 Xin Tong1
 Liangjie Gu
- 1Postdoctoral Research Center, Industrial and Commercial Bank of China, Beijing, China
- 2Wuhan University, Wuhan, China
- 3Chinese Academy of Financial Sciences, Beijing, China
This article is to study the progressive impact of China’s fiscal policy on the sustainable development of the photovoltaic industry. On the one hand, the method based on characteristic facts, through the derivation of the evolutionary game theory of the two parties, finds the influence of the central and the local government on the alternate development of China’s photovoltaic industry production enterprises and power generation enterprises due to different policy subjects; on the other hand, from 2013 to 2018, the newly installed capacity of distributed photovoltaics in various provinces in China, through the method of measurement and empirical evidence, found that policy preferences (policy objects, methods, links, timing, and intensity) the effects of alternate development. This study believes that in terms of policy subjects, the central government should be the mainstay of the power generation, while in the production, considering the impact of the new crown epidemic and upstream raw materials, the joint efforts of the central and local governments are needed, and in terms of policy preferences, the Chinese government needs to give greater policy support to distributed photovoltaics in order to achieve carbon peaking in 2030 and carbon neutrality in 2060, which should not be interrupted by policies such as “whole county development” and “building surface photovoltaics.”
1 Introduction
Clean energy is in full swing around the world with no exception of China. As a major producer of photovoltaic and wind power in the world, China’s sustainable development of clean energy has received extensive attention.
Previous studies on the fiscal policy of China’s photovoltaic industry have mostly focused on traditional industry such as revenue model derivation, excess capacity, and subsidy abuse, but take less notice of the impact of it on photovoltaic industry, such as the staged development characteristics of China’s photovoltaic industry, as well as the phenomenon of alternate development of enterprise types and power station forms. In perspective of the goal as to achieve grid parity on the power generation side, China’s photovoltaic industry can clearly be divided into five stages in chronological order, namely, infancy (1958–1997), early development (1998–2008), mid-term development (2009–2012), late-stage development (2013–2020), and late-stage development (2021–2025).
Previous studies have limited their concern of fiscal policy on policy tools, such as general budget investment, treasury bond investment, fiscal subsidies, fiscal interest discounts, fiscal guarantees, substituting awards for subsidies, government procurement, and tax incentives. Research brings policy subjects and policy preferences into focus to better maintain the sustainable development of the industry.
Previous studies have generally studied the government as a whole, often introducing a two-party game model between the government and enterprises, or a three-party game model between the government, enterprises, and the market, which failed to acknowledge the significant impact of the tax-sharing system on China’s fiscal system. The two-party evolutionary game model with the local government explains the fact that China’s photovoltaic industry develops in stages, and thus elucidates that different government entities lead to the alternate development of China’s photovoltaic industry production enterprises and power generation enterprises.
Previous studies have failed to notice the changes in the photovoltaic power plants in China, specifically the alternating development of centralized power plants and distributed power plants. So, our study explains deeply through empirical evidence that this phenomenon indicates that fiscal policy preferences (objects, methods, link, timing, and intensity) might have an important effect on China’s photovoltaic industry.
2 Theoretical Basis and Literature Review
2.1 Theoretical Basis
2.1.1 Relevant Theories of Government Intervention
Stiglitz further affirms the theory of government intervention from the perspective of government functions. He believes that when the market is incomplete, information asymmetry and competition are insufficient, market failure is universal, and the market mechanism will not reach its own level. The Pareto optimality. The universality of market failure requires the universality of government intervention. In order to rectify market failure, government intervention should spread across various economic sectors and fields, not just to formulate regulations but also to redistribute and provide public goods.
Stiglitz believes that government efficiency should be viewed from a different angle. It is not only that the government sector has inefficiencies but observe similar inefficiencies in the private sector can also be observed. Neither statistical data nor theoretical analysis can prove that government is less efficient than the private sector. Stiglitz believes that the reasons for the inefficiency of government include: lack of competition, no threat of bankruptcy, commitment to social goals, excessive pursuit of fairness, and limited scope of authority. Despite the government’s failures, Stiglitz believes that the government can largely improve efficiency by taking advantage of the power to tax, prohibit, penalize, and save transaction costs compared with the market.
Based on the theory of government economic functions, Stiglitz believes that although the perfect competition model in textbooks does not exist in reality, and limited competition in a market economy can facilitate information transmission and promoting technological progress. Therefore, in the public utilities and departments that the government directly intervenes, monopoly should be actively restrained and competition should be encouraged. As for the common resource allocation problem in the market economy, Stiglitz proposed that the government’s public policy should mainly focus on the resource allocation function and improve the resource allocation efficiency by exerting the government’s redistribution function. Even if government intervention is occasionally ineffective, government failure is no worse than market failure. The problem of government inefficiency can be alleviated and eliminated. By adopting appropriate policies, government intervention can bring about Pareto improvement.
2.1.2 Related Theories of Industrial Economics
An industrial policy is the sum of various policies formulated when the government intervenes in the formation and development of industries in order to achieve certain economic and social goals, mainly including national economic plans (instructive and guiding plans), industrial structure adjustment plans, industrial support plans, investment and financing, technology policy, monetary policy, labor policy, foreign trade policy, and project approval. Industrial economics is an important branch of applied economics, which is known as the meso-economy between the macro-economy and the micro-economy, served as the link between those two. Industrial economics mainly studies technological progress, the flow of factors and resources such as labor, spatial development, economic performance, and the dynamic changes of industries. In addition, it explores issues such as industrial linkages, structure, organization, development, layout, and policies in pursuit of industrialization through game theory and equilibrium and non-equilibrium analysis methods, and provides economic theoretical reference for formulating national economic development strategies and specific industrial policies.
The “developmental state theory” began with the book, MITI and the Japanese Miracle (Chalmers, 1992). A developmental country can be defined as a country that prioritizes economic development. In order to realize the goals of long-term economic development, the state intervenes in the economy and market.
The theory of late-mover advantage was proposed by Alexander Gerschenkron in 1962 who, after summarizing the successful experience of economic catch-up in Germany, Russia, Italy, and other countries, explored an effective way for economically backward countries to achieve economic growth (Alexander, 2012). He believed that the latecomer countries which characteristically lack continuity in industrialization must rely on the blowout development of manufacturing and on large enterprises as well as mandatory industrial capital centralization.
The National Competitive Advantage Theory, also known as the Diamond Theory, was proposed by the American strategic management scientist Michael Porter (Michael, 2014). Porter believed that the four factors that determine the competitiveness of a country’s industry include production factors such as human resources, natural resources, knowledge resources, capital resources, and infrastructure. Porter believed that it is enterprises, not governments, that engage in industrial competition. Ultimately, it must be reflected in the enterprise. All the government can do is to provide the resources needed by enterprises and create a suitable environment for industrial development. The government can create new opportunities and pressures in the meantime. The government should directly invest in the areas that enterprises cannot act upon, that is, external costs, such as developing infrastructure, opening capital channels, and cultivating information integration capabilities.
The theory of strategic emerging industries is proposed by the Chinese government in the exploration of economic construction for many years. In the 2018 “Strategic Emerging Industries Classification” document, it is defined that strategic emerging industries are based on major technological breakthroughs and development needs. The overall and long-term development plays a major leading role. It refers to the industries with intensive knowledge and technology, low consumption of material resources, great growth potential, and good comprehensive benefits, including the new generation of information technology industry, high-end equipment manufacturing industry, new material industry, biological industry, and new energy. A total of nine major fields are covered, including automobile industry, new energy industry, energy conservation and environmental protection industry, digital creative industry, and related service industries. Strategic emerging industries share the characteristics of leading, pillar, dominant, basic, emerging, strategic, and technology-driven. Accelerating the cultivation and development of strategic emerging industries is China’s strategic move to respond to changes in the complex international economic environment and to promote sustainable domestic economic and social development.
2.2 Literature Review
Previous studies on the fiscal policy of the photovoltaic industry in the Europe and America often focused on the comparison of policy tools, policy framework design, economic research, and policy supervision. Sarasa-Maestro et al. (2013) analyzed four commonly used PV incentive policies in EU countries, including feed-in tariff (FIT), green certificate, investment tax incentive, and quota system bidding. Li et al. (2017) compared the policy measures such as power purchase agreements, capital grants, tax incentives, and preferential loans in the development of photovoltaic and wind power in EU member states and concluded that only tax incentives can bring the most incentive effect. García-álvarez et al. (2018) argue that only the feed-in tariff policy has a significant impact on PV-installed capacity in EU countries, while policy design factors such as tariff scale and contract duration have a positive but insignificant impact. Pyrgou et al. (2016) investigated the regulatory and policy framework of feed-in tariff schemes based on the impact of photovoltaics on electricity prices and the European renewable energy market. Zhai (2010) proposed a three-layer description model of US photovoltaic policy including top-level mandatory policies, middle-level financial support mechanisms, and bottom-level capital pools. Shrimali and Jenner (2013) evaluated the impact of 12 national-level policies such as cash incentives, access standards, and property taxes on the cost and deployment of photovoltaics in the United States. Darghouth et al. (2016) argued that at the overall national level in the United States, the two policy pricing strategies, net measurement and market feedback loops, almost counteract each other, resulting in a modest net effect. Sesmero et al. (2016) argued that the introduction of time-of-day pricing (TOD) into grid electricity taxation can potentially change the economics of photovoltaic systems.
Yet previous studies on fiscal policy in China’s PV industry have focused on government intervention, cost-benefit, and excess capacity. Zhou et al. (2018) constructed a two-party evolutionary game model with the government and photovoltaic power generation enterprises as the main players and introduced the learning curve method to analyze the impact of technological changes on the equilibrium strategies of both parties. Chen (2013) believes that government leadership attributes largely to the growth dilemma of China’s photovoltaic industry, so it is demanding to become dependent to local governments and take the road of innovation based on market demand. Lv et al. (2017) established a three-party incomplete information dynamic game model involving the central government, local government, and photovoltaic enterprises as the main body and gave a path to optimize China’s photovoltaic industry policy. Zang (2016) drew a road map for the cost and benefit trend of photovoltaic power generation in various provinces and cities under the subsidy policy. Zhang and Wang (2017) analyzed the impact of construction cost, electricity price, and system efficiency on the internal rate of return of photovoltaic projects in three types of resource areas. Yu (2017) believes that the government fixed asset investment is the direct cause of overcapacity in my country’s photovoltaic industry. Wang and Zhang (2015) studied the degree, causes, and solutions of overcapacity in my country’s photovoltaic industry. Yu and Lu (2015) believed that traditional support policies should be changed to avoid improper government intervention that would cause structural and institutional overcapacity in my country’s photovoltaic industry.
In the past 2 years, research on sustainable development of photovoltaics has focused on carbon emission reduction, Coronavirus, technological innovation, and environmental quality. Kirikkaleli et al. (2021) revealed that while financial development and renewable energy consumption reduce the consumption-based CO2 emissions in Chile, economic growth, and electricity consumption increase consumption-based carbon emissions. Adebayo TS. et al (2022)demonstrated that positive (negative) shifts in renewable energy development decrease (increase) CO2 emissions, while positive (negative) shocks in fossil fuel energy increase CO2 emissions. Moreover, negative (positive) variation in COVID cases leads to a decrease (increase) in CO2 emissions. Adebayo et al. (2022b)think that technological innovation is found to exert an indirect favorable impact on the environment and natural resources. Thus, technological innovation can be anticipated to enhance sustainable natural resources exploration in the NICs. Adebayo et al. (2022c) confirmed that in all quantiles, financial development, economic growth, urbanization, and agriculture impact CO2 emissions positively, while in the middle quantiles, the influence of renewable energy use on CO2 is negative. Fareed et al. (2021) believed that renewable energy and export diversification increase the load capacity factor and thus support environmental quality.
3 The Impact of China’s Fiscal Policy on the Development Process of the Photovoltaic Industry
Based on the government intervention theory and industry theory in Section 2.1.1, this study aims to study the impact of fiscal policy on China’s photovoltaic industry. Changes in policies include variations in policy subjects, objects, methods, strengths, links, and timing (Liu et al., 2019). To simplify the research, this section lists the set of objects, methods, strengths, links, and timings outside the policy body as changes in preferences. Then the two assumptions studied in this study follow:
Hypothesis 1: changes in the main body of fiscal policy have an impact on the sustainable development of China’s photovoltaic industry
Hypothesis 2: Changes in fiscal policy preferences have an impact on the sustainable development of China’s photovoltaic industry
3.1 History of the Development of China’s PV Industry and Fiscal Policy
3.1.1 Development History of China’s Photovoltaic Industry
With the goal of achieving grid parity, the development of China’s photovoltaic industry can be divided into five stages in chronological order, namely, embryonic stage (1958–1997), early stage of development (1998–2008), middle stage of development (2009–2012), mid-late development (2013–2020), and late-development stage (2021–2025)
3.1.1.1 The Infancy of Development
The budding period of the development of China’s photovoltaic industry was from 1958 to 1997, when China’s photovoltaic industry was mainly led by the governmental financial support on research, with its primary purpose to provide space energy for aircraft.
After the first monocrystalline silicon was made in 1958, China mainly applied photovoltaic power generation technology to satellites in the aerospace field, resembling other countries. Until the 1970s, China did not outpace foreign countries in the development of photovoltaic technology. This is because photovoltaic power generation technology was still in the scientific research stage on a global scale. Countries mainly used it for space energy, with a scarce amount used for ground applications. Since the 1980s, foreign countries have begun to expand the ground applications of photovoltaic power generation. Following the general trend in the world, China has included solar cells in the “Seventh Five-Year Plan,” organized universities and research institutions to carry out relative research, and introduced advanced production lines from abroad to increase the production capacity of photovoltaic solar cells in China. In the spirit of the expansion of domestic production capacity, the Chinese government has invested heavily in photovoltaic power generation projects in non-power areas since 1982 and promoted the ground applications of photovoltaic power generation in the western region of China. Though costly, it is still more economical in the long term than extending the grid to these sparsely populated areas. By the 1990s, under the planning and leadership of the Chinese government, after years of introduction, re-innovation and application of advanced photovoltaic power generation technology, China’s solar cell production technology has achieved primary development, and production capacity and output have increased steadily. It can basically meet the needs of the domestic market, and even a handful of products are exported for foreign exchange.
3.1.1.2 Early Stage of Development
The early stage of the development of China’s photovoltaic industry lasted from 1998 to 2008. During this period, the front-end production links predominantly drove the overall development of the industry, while the back-end power generation links developed relatively slowly.
In terms of photovoltaic production, China’s first 3 MW polysilicon solar cell and application system demonstration project was planned to be launched in Yingli Company in Baoding, Hebei, in 1998, which marked the participation of Chinese private enterprises in the world division of photovoltaic production. In 2002, Wuxi Suntech 10 MW solar cells and the production of module projects have reached a new high in production capacity. Because China’s photovoltaic production link has been based on the development of market-oriented private enterprises from the beginning of its development, the midstream production link of China’s photovoltaics has quickly demonstrated the efficiency and strength of “Made in China” textbooks. In 2003, China’s photovoltaic module output accounted for 30% of the world’s total output at that time. In 2007, China’s photovoltaic module output surpassed Japan to become the world’s first. Owing to the subsidy system of European countries for photovoltaic power plant projects, China’s photovoltaic industry has cut into the midstream cell and module production link as a low-cost producer and processor and made full use of foreign markets, technologies, and capital, and Hebei Yingli has emerged successively, such as Wuxi Suntech and Jiangxi Saiwei and an abundance of other excellent production enterprises. During this period, the cutting-edge technologies, raw materials, equipment, and consumer markets of the photovoltaic industry are still owned by other countries such as Europe, America, Japan, and South Korea. Chinese photovoltaic manufacturers were challenged with the unfavorable situation of “three heads out” of technology and market and raw materials, before an industrial breakthrough became imminent.
The photovoltaic power generation still relies on direct financial investment to continuously promote photovoltaic projects in areas without electricity such as “transmitting electricity to the township” and “bright project,” and the cumulative project scale must not exceed 30 MW.
3.1.1.3 Mid-Term Development
The mid-term development of China’s photovoltaic industry lasted from 2009 to 2013. During this period, the back-end power generation link mainly drives the overall development of the industry.
In terms of photovoltaic production, from the perspective of the entire industry chain, with the policy support of the central and local governments, China’s photovoltaic industry has begun to accumulate strength from the midstream and expand upstream and downstream. The localization level of the most upstream raw materials and equipment has begun to improve, and the domestic proportion of upstream crystalline silicon and silicon wafers has also continued to increase. In 2013, China’s polysilicon production ranked first in the world for the first time. In the midstream segment, China’s cell and module products still maintained the world’s first output despite the drastic fluctuations in the market environment. Among them, the global financial crisis in 2008–2009 made financing difficult for photovoltaic power plants, and the reduction of subsidy policies in European countries. It also directly leads to a decrease in the international demand for photovoltaic products. The decrease in demand caused the price of photovoltaic products to fall, which promoted the rush to install photovoltaics worldwide from 2009 to 2010. The explosive recovery of demand led to a compensatory increase in production capacity of Chinese photovoltaic manufacturers. In 2009, the “four trillion” stimulus policy issued by the Chinese government in response to the world financial crisis also promoted the prosperity of China’s domestic photovoltaic installed capacity market. However, in 2010, Europe, the main market for the world’s photovoltaic power generation installed capacity at that time, has also entered a stage of saturation. At that time, the policy changes of European countries to significantly reduce subsidies also led to a slowdown in the growth rate of the international photovoltaic consumer market. The saturation of the European market has led to a new round of overcapacity in Chinese photovoltaic manufacturers. Domestic manufacturers have chosen to respond to the crisis through price wars. The rapid decline in the price of photovoltaic modules in China has led to the rise of foreign trade protectionism. In 2011–2012, the US Europe has successively filed anti-dumping and anti-subsidy lawsuits against Chinese photovoltaic products in the trade war. Chinese photovoltaic manufacturers have suffered a major blow, and many companies have gone bankrupt, which forced the Chinese photovoltaic industry to quickly turn around and return to the domestic market.
In the field of photovoltaic power generation, China started the pilot project of photovoltaic commercial power plants in 2008. Under the “4 trillion” economic stimulus package in 2009, China’s photovoltaic downstream power generation links began to accumulate growth. Under the guarantee of the funds of the Renewable Energy Law and the incentives of the initial investment and construction subsidies for the two demonstration projects of “Golden Sun” and “Solar” roofs, the installed capacity of photovoltaic power generation in China has increased significantly. The installed capacity increased from about 0.23 GW in 2009 to about 13 GW in 2013, and the total installed capacity increased from about 0.37 GW in 2009 to about 19 GW in 2013; in terms of growth rate, the average annual growth rate of installed capacity is about 233.94%, and the average cumulative installed capacity growth rate is about 170.02%. During this period, China’s photovoltaic power plants are mainly ground-based, and most of the projects are deployed in the northwest region.
3.1.1.4 The Middle and Late Stages of Development
The middle and late stage of China’s photovoltaic development spanned from 2014 to 2020. During this period, the production and power generation links of China’s photovoltaic industry have been coordinated and optimized, and the industry’s leading edge has continued to expand.
In photovoltaic production, Chinese photovoltaic manufacturers have maintained and continued to expand their international leading edge. By 2018, the domestic self-sufficiency rate of the most upstream equipment and raw materials has exceeded 60%, and upstream silicon materials are gradually substituted imported products, accounting for more than 50%. With the continuous expansion of new production capacity in the western low electricity price regions, the self-sufficiency rate of China’s silicon materials will rise steadily. Upstream silicon wafers and midstream cell and module products maintain a steadfast leading position in the world, accounting for more than 70% of the world. Chinese photovoltaic manufacturers need to pay high attention to the changes in the international photovoltaic consumption market. What is worth to mention is that the main force of the international market has shifted from traditional markets in Europe and the United States to the emerging markets with diversified development in developing countries. Among them, the European market which used to account for 70% of China’s export volume a decade ago, now dropped to 20%, whereas the US market remains below 2%. Although the U.S. is no longer the main export destination of Chinese photovoltaic products, the trade war started again by U.S. President Trump in 2018 still exerted a negative impact on China’s photovoltaic industry, because the U.S. took the lead in imposing tariffs on Chinese photovoltaic products, which is easy to cause The rest of the world followed suit.
In the aspect of photovoltaic power generation, from 2013 to 2018, the incentive policy of China’s photovoltaic power plants has changed from construction subsidies to subsidized feed-in tariffs with a regression mechanism. Although the subsidy intensity has been continuously lowered, due to the sound development foundation laid in the medium term, China’s photovoltaic installed capacity still maintains a rapid growth level. From the perspective of installed capacity, the annual installed capacity has increased from about 11 GW in 2014 to about 53 GW in 2017. The installed capacity increased from about 19 GW in 2014 to about 173 GW in 2018; in terms of growth rate, the average annual installed capacity growth rate was about 38.11%, and the average cumulative installed capacity growth rate was about 55.36%. The cumulative installed capacity growth rate is lower than that in the mid-development period, but due to the large installed capacity base reached in the mid-term, China’s photovoltaic installed capacity is at the highest level in the world in the mid-to-late period. During this period, the growth rate of distributed photovoltaic power plants in China was faster, and the installed location showed a trend of shifting from the northwest to the east.
3.1.1.5 Late Stage of Development
Taking the grid parity as the end point, the later stage of China’s photovoltaic development will extend from 2021 to 2025. During this period, China’s photovoltaic industry will be basically mature. It is a more affordable energy form than traditional thermal energy. At that time, other clean energy power generation technologies such as hydropower, wind power, biomass, and nuclear power in China were still more expensive than photovoltaics due to the limited supplies. Therefore, photovoltaics will become the most economical renewable energy in China, which will undertake a larger proportion of China’s clean energy transformation tasks. During this period, due to the abolishment of the electricity price subsidy policy, the installed capacity of the power generation link may decline, and the most upstream and upstream localization rate of the production link may occur. It will continue to increase, and there expectantly may be a trend of growing industrial transfer in the midstream.
3.1.2 Development History of China’s PV Fiscal Policy
This section mainly introduces several key policies with remarkable significance in the fiscal policy of China’s photovoltaic industry. The first is the Renewable Energy Law, which forms the legal and financial basis for the large-scale application and promotion of China’s photovoltaic power. Second, the two major demonstration projects of “Golden Sun” belong to the ex ante construction subsidies, which set a precedent for China to apply subsidy tools to promote the development of the photovoltaic power station–installed market. Third, the on-grid tariff subsidy policy, which belongs to the ex post power generation subsidy, has promoted the rapid growth of China’s photovoltaic installed capacity in recent years, and last, tax policy plays a significant role as well. These policies mentioned are issued by the central government to encourage the development of the photovoltaic industry. In fact, the corresponding local governments have also issued a large number of local financial incentive policies, which will not be iterated in this article.
3.1.2.1 Renewable Energy Law
China’s “Renewable Energy Law” is a mandatory tax policy for all electricity consumers, which essentially raises funds for the application of clean energy by levying a “renewable energy price surcharge” in the electricity price. The renewable energy fund is constantly adjusting its rates, and the current levy rate in 2016 is 0.019 yuan/kWh. This regulation raises the required funds for China’s renewable energy in a clear legal form, collecting initial investment in clean energy, and lays a solid foundation for the development of renewable energy in China by gathering the financial support of government subsidies. The market-oriented development of energy in advance provides the possibility.
3.1.2.2 “Solar Roof” and “Golden Sun” Demonstration Project
In the early stage of the development of China’s photovoltaic industry, although the “Renewable Energy Law” has been implemented since 2006, the large-scale commercial application of photovoltaic power generation technology downstream of industrial production did not start immediately. In 2008, China conducted initial pilot projects in Shanghai and Inner Mongolia. From 2009 to 2012, two important solar energy demonstration projects were launched successively, and relevant implementation strategies, notices, and financial subsidy methods were issued. The two demonstration projects marked the official launch of the domestic photovoltaic installation market downstream of China’s photovoltaic industry, mainly in the form of pre-subsidy for construction subsidies.
In 2008, the National Development and Reform Commission carried out the pilot work of bidding for particular business licenses for commercial photovoltaic power plants. Because the National Development and Reform Commission pays more attention to the power in economic development, the National Development and Reform Commission prefers to use franchised operating rights, such as selling franchise licenses, to attract owners to participate in project bidding in the spirit of promoting the development of photovoltaic power plants. The Ministry of Finance, due to its experience in coordinating finance, is more inclined to issue detailed fiscal supporting policies and uses fiscal and financial resources to match the powers to help the implementation of the project. Because administrative power and financial power are complementary to each other, only when the Ministry of Finance promulgates specific financial subsidy methods and relevant departments jointly promulgate implementation measures, the NDRC’s policy planning can be truly implemented and popularized.
In order to implement the “Renewable Energy Law,” and the State Council’s strategic deployment of energy conservation, emission reduction and the development of new energy, and accelerate the application of solar power generation technology in urban and rural construction, Opinions on the Implementation of Photovoltaic Building Application” [Caijian (2009) No. 128] and “Interim Measures for the Administration of Financial Subsidy Funds for Solar Photovoltaic Building Application” [Caijian (2009) No. 129] are two policies referred in the industry as the “Solar Roof” project, which is intended to support the development of photovoltaic building application demonstration projects through financial subsidies to solve the problems such as solar photovoltaic building integration design, insufficient construction capacity, lack of relevant application technical standards, and weak production capacity of solar photovoltaic modules that realize componentization of buildings. It is also aimed to initiate the application of solar photovoltaic facilities in urban and rural construction, and drive the development of China’s solar photovoltaic industry.
3.1.2.3 On-Grid Tariff Subsidy Policy
The central government’s on-grid tariff subsidy is relatively uniform. In 2008, the on-grid tariff subsidy was about 4.0 yuan/kWh, while in 2011, it was unified at 1.15 yuan/kWh. In 2014, according to the irradiation resources, the benchmark electricity price for the internet of areas Class I, II, and III was 0.9 yuan/kWh, 0.95 yuan/kWh, and 1.0 yuan/kWh, respectively. The price subsidy standard for distributed photovoltaic power generation was 0.42 yuan/kWh. In 2016, those prices were lowered to 0.80, 0.88, and 0.98 yuan/kWh in areas I, II, and III, respectively. One year later, they experienced another drop to 0.65, 0.75, and 0.85 yuan/kWh, respectively, while at the beginning of 2018 the prices for each area were lowered by 0.1, of which distributed photovoltaic projects were lowered to 0.37 yuan/kWh. Starting from June in 2018, those prices were adjusted to 0.50, 0.60, and 0.70 yuan/kWh, respectively. Distributed projects were included in scale management for the first time, and the subsidy standard for the full electricity price was lowered to 0.32 yuan/kWh. From 2019 to 2022, due to the implementation of grid parity, the benchmark electricity price for new projects will be the same with local coal-fired electricity, and the central government will give certain financial subsidies to the projects of the year.
In addition to the central government, local governments have also introduced local power station subsidy policies, with an intensity of about 0.1–0.4 yuan/kWh, to encourage the development of local photovoltaic power stations. More than 20 provinces and regions across the country have successively issued local photovoltaic support policies, mainly for the construction and development of local distributed photovoltaic power stations. In addition to provincial governments, local governments in the central and eastern regions also have municipal government subsidies. Local government subsidies not only provide subsidies for on-grid electricity prices but also provide construction subsidies based on the installed capacity of the system. The maximum subsidy amount can reach 4/W.
3.1.2.4 Tax Incentive Policy
With the completion of China’s tax system reform of “replacement of business tax with value-added tax” in 2017, China’s policy system for replacing business tax with value-added tax to reduce double taxation and corporate tax burden has been established. The next step in China’s tax reform is to shift from indirect tax to direct tax, from corporate tax to personal tax. China’s current tax system does not favor the photovoltaic industry. In the production link before the midstream of photovoltaics, the tax policy is nearly the same as that of the traditional manufacturing industry, and more tax policies are concentrated in the power generation link.
In terms of value-added tax, the Ministry of Finance issued the “Notice on the Value-Added Tax Policies for Photovoltaic Power Generation” in September 2013, which stipulated that from 1 October 2013 to 31 December 2015 taxpayers selling self-produced solar energy electricity products are subjected to a policy of refunding 50% of the value-added tax immediately upon collection. If the residential community and its roof area are not fairly large, the electricity generated by photovoltaic power generation will be limited. When the monthly sales revenue is less than 20,000 RMB, according to the “Ministry of Finance and the State Administration of Taxation on Temporary Exemption of VAT on Some Small and Micro Enterprises” and the Notice on Business Tax and Business Tax [Cai Shui (2013) No. 52], VAT can be exempted. According to the “Notice on Continuing the Implementation of the Value-Added Tax Policy for Photovoltaic Power Generation” [Cai Shui (2016) No. 81], from 1 January 2016 to 31 December 2018, taxpayers selling self-produced power products produced by using solar energy, should follow the policy of 50% VAT refund immediately after collection. Before the date of receipt of the document, the value-added tax that has been collected should be refunded in accordance with the provisions of this notice and can be deducted or refunded for the value-added tax that the taxpayer should pay in subsequent months. In the “Notice on Reducing the Tax and Fee Burden of Enterprises in the Field of Renewable Energy,” it was extended from 31 December 2018 to 31 December 2020. The policy of refunding 50% of VAT on photovoltaic power generation products should be implemented immediately after collection.
Regarding to income tax, the preferential policies are mainly the “three exemptions and three half reductions” policy. Photovoltaic power generation enterprises comply with the second paragraph of Article 27 of the “Enterprise Income Tax Law,” Article 87 of the “Regulations on the Implementation of the Enterprise Income Tax Law” and “Enterprise Income Tax Law”. If the conditions for new solar power generation projects approved by the government investment department in the Catalogue of Corporate Income Tax Preferentials for Public Infrastructure Projects (2008 Edition) are calculated from the year in which the first production and operation income of the project is obtained, income tax shall be exempted for the first 3 years, while starting from the fourth year, the corporate income tax shall be halved additionally.
With respect to tariffs, according to the “Notice on Adjusting the Catalogue of Import Tax Policies for Major Technological Equipment” [Caiguan (201314)], from 1 April 2013, domestic enterprises that meet the prescribed conditions will be eligible for the production of solar energy products supported by the state. It is necessary to import given crucial components and raw materials for battery equipment, key integrated circuit equipment and other equipment, exempt from customs duties and import value-added tax.
3.2 The Impact of Changes in the Main Body of Fiscal Policy on the Development of China’s Photovoltaic Industry
Previous studies, such as the work of Lv et al. (2017), established a three-party incomplete information dynamic game model with the central government, local government, and photovoltaic enterprises as the main body after they proposed optimization suggestions for the fiscal policy of China’s photovoltaic industry. However, the failure to distinguish between the production enterprises and power generation enterprises in the whole photovoltaic industry chain, and the failure to gain insight into the game between enterprises is actually a microcosm of the game between the central government and the local government. Therefore, this study chooses the policy subject as the participant of the game.
This section studies the impact of changes in the main body of policies on the alternate development of photovoltaic production and power generation enterprises in china. The central government and the local government are the two main bodies that issue industrial policies. The central and local governments have different motivations leading to various behavioral decisions. From a motivational point of view:
For local governments, the reform of the tax-sharing system requires the majority of local fiscal revenue to be delivered to the central government, and the balance of local fiscal revenue and expenditure depends on transfer payments from the central government. In order to maintain a smooth operation of the government, the local government must efficiently increases revenue and meanwhile reduces expenditure. According to the Wagner’s law, the scale of fiscal expenditure is constantly increasing with the growth of national income, so it is of urgent need for the local government to expand the source of fiscal revenue. Local officials also have personal motivations to develop the local economy and improve their political performance in order to increase the bargaining chip, which leads to the local governments to always be relatively active in developing emerging industries. Owing to the deep understanding of local enterprises, local government policies can more directly and effectively act on them, so local government policy tools can also be more flexible and relaxed based on local situations.
For the central government, the tax-sharing system further clarifies the responsibilities, rights and interests of the central and local governments, increasing the proportion of fiscal revenue in GDP and tax revenue in fiscal revenue, alleviating the financial pressure of the central government, and improving the central government’s macro-control ability. The central government is more calm and cautious from the overall situation, with hopes that emerging industries will develop rapidly and healthily. The central government will boost the industry when it is in a downturn, cool down and regulate when the industry is overheated, and correct it when the industry is in the wrong direction. The policies of the central government act on the overall situation more macroscopically and uniformly, such as the market access system, the administrative prohibition system, the industry prohibition system, the tax preference system and the electricity price subsidy system. The central government’s macro-control can help the industry overcome the blindness and impulsiveness of the authorities, and it can also avoid the low-end repeated and ineffective competition of the local government.
The game involving the central and local governments includes not only the vertical game between them, but also the horizontal game between local governments. For simplicity, this section selects the two-party vertical evolutionary game model of the central and local governments to briefly explain the changes in policy subjects and influence on the industrial development.
3.2.1 Assumptions and Model Settings
The fiscal policy of the local government’s photovoltaic industry can be simplified into two types: whether or not to introduce local incentive policies. The central government’s fiscal policy behavior can also be grouped into two types: one is the introduction of incentive policies, and the other is the regulatory policies. Regulatory policies may not only simply reduce or stop the supply of incentive policies, but they may even introduce inhibitory policies.
The hypothetical preconditions of the game in this section are: the consequences of the game may be beneficial, unhelpful or unfavorable; the result is immediately generated after the game is chosen, without the participation of the market and enterprises; it is assumed that there is no information asymmetry and insufficient information between the two sides of the game, more specifically, decisions from one are shared with the other, thus influencing their decisions. Under the above ideal assumptions, the two-party game model of the central and local governments can be established as follows:
Suppose the probability of the local government issuing an incentive fiscal policy is q (0 ≤ q ≤ 1); then the probability of the local government not issuing an incentive fiscal policy is 1-q. The probability that the central government issues an incentive fiscal policy is p (0 ≤ p≤ 1); the probability that the central government issues a regulatory fiscal policy is then 1-q.
Suppose that when the local government issues incentive fiscal policies, when the central government issues regulatory fiscal policies, the central government’s revenue is A; when the central government issues incentive fiscal policies, the central government’s additional revenue is E. Suppose that when the local government does not issue incentive fiscal policies, and the central government issues regulatory fiscal policies, the central government’s revenue is B; when the central government issues incentive fiscal policies, the central government’s additional revenue is H. Suppose that when the central government issues incentive fiscal policies, the local government does not issue incentive fiscal policies, then the local government’s revenue is C; when the local government issues incentive fiscal policies its additional revenue is F; assuming that the central government issues regulatory fiscal policies and when local government does not issue an incentive fiscal policy, then the local government’s revenue is D; if the local government issues an incentive fiscal policy, the local government’s additional revenue is then G.
Then, the two-party game matrix of the central government and the local government is shown in Table 1.
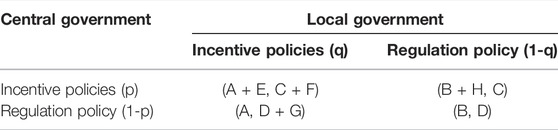
TABLE 1. Game matrix of central and local governments.
From the perspective of the central government:
When it introduces incentive fiscal policies, its benefits are
When it introduces fiscal control policies, its benefits are
So, the average revenue of the central government is
When CGP1 > CGP2, the probability function p = p(t) that the central government chooses to stimulate the photovoltaic industry is an increasing function of t. However, when CGP1 < CGP2, the probability function p = p(t) that the central government chooses to stimulate the photovoltaic industry is a decreasing function of t.
Setting
Similarly, from the perspective of local government:
When it introduces incentive policies, its benefits are
When it does not introduce incentive policies, its benefits are
Therefore, the average revenue of the local government is
When LGP1 > LGP2, the probability function q = q(t) that the local government chooses to stimulate the photovoltaic industry is an increasing function of t. When LGP1 < LGP2, the probability function q = q(t) that the local government chooses to stimulate the photovoltaic industry is a decreasing function of t.
Setting
3.2.2 Evolutionary Analysis of the Game Model Between the Central Government and the Local Government
(1) Central government’s coping strategies and evolutionary stability solutions
The introduction of incentive fiscal policies by local governments will affect the policy decision of the central government. The corresponding strategy of this evolution is expressed by the differential equation of the probability of the introduction of incentive policies of the central government, which is the aforementioned formula.
We set M(p) = 0, then we can solve p∗ = 0, p∗ = 1, q∗ = H/H−E.
When M(p) = dp(t)/dt = 0 and the second partial derivative of the p(t) function M′(p) < 0, the solution of p satisfies the stability requirement of replicating the evolution strategy of dynamic differential equations. At this time, q* = H/HE, and M(p) = dp(t)/dt = 0, the probability p at this time is in a stable state, suggesting that the central government’s policies to stimulate the development of China’s photovoltaic industry can remain fairly stable.
However, the local government’s incentives for the local photovoltaic industry are difficult to maintain in an ideal balanced state of q* = H/H−E, so q* can be divided into two situations:
When the local incentives for the local photovoltaic industry are insufficient, that is, when q*<H/HE, p* = 0 and p* = 1 are the ideal solutions of the excitation intensity q. Considering that p* = 0, M′ (0) is greater than 0, and when p* = 1, M′ (1)<0, so p* = 1 is the final stable state of evolution, which indicates that the local government has introduced local incentives for the development of the local photovoltaic industry. When the policy intensity of q*<H/HE continues to decline, the central government will increase the probability and intensity of issuing central policies to stimulate the development of China’s photovoltaic industry in order to maintain the balance of the game between the two parties.
When the local incentives for the local photovoltaic industry are overly strong, that is, when q* is greater than H/HE, p* = 0 and p* = 1 are the ideal state solutions for the excitation intensity p; and when p* = 0 is considered, M′ (0)<0; and when p* = 1, M′ (1)>0, so p* = 0 is the final stable state of evolution, and its practical meaning is that the local government has introduced local incentives to the local photovoltaic industry. When the policy intensity q* of development is greater than H/HE and continues to rise, the central government will issue regulatory policies in order to maintain the balance of the game between the two parties to cool down the photovoltaic industry or adjust its direction.
These three situations are shown in Figure 1.

FIGURE 1. Central government’s coping strategies and evolution.
(2) Coping strategies and evolutionary stability solutions of local governments
Whether or not the central government has introduced incentive policies will affect the decision-making of local governments. This evolutionary coping strategy is expressed by the differential equation of the probability of local government incentive policies, which is the aforementioned formula.
We set N(q) = 0, we can solve q∗ = 0, q∗ = 1, p∗ = G/G−F.
When N(q) = dq(t)/dt = 0 and the first-order partial derivative of q(t) function N′(q) < 0, the solution of q can satisfy the stability requirement of replicating dynamic differential equation evolution strategy. At this time p* = G/GF, and N(q) = dq(t)/dt = 0, the probability q at this time is in a stable state, suggesting that the local government can reasonably issue a strategy to stimulate the development of the photovoltaic power generation industry to maintain stability.
However, the central government’s incentives for China’s photovoltaic industry are difficult to maintain in a balanced ideal state of p* = G/G−F, so p* can be divided into two situations:
When the central government promulgates insufficient incentives for China’s photovoltaic power generation industry, that is, when p*<G/GF, q* = 0 and q* = 1 are the ideal state solutions of the incentive intensity p. Considering that q* = 0, N′ (0)>0; and when q* = 1, N′ (1)<0, so q* = 1 is the final stable state of evolution, and its practical meaning is that the central government has issued measures to encourage the development of China’s photovoltaic power generation industry. When the policy intensity is p*<G/GF and continues to decline, in order to maintain the balance of the game between the two sides, the local government will issue the probability and intensity of local policies to stimulate the development of the photovoltaic power generation industry.
When the incentive strength of China’s photovoltaic power generation industry issued by the central government goes unusually high, that is, when p*>G/GF, q* = 0 and q* = 1 are the ideal state solutions of the incentive strength q. Considering that q* = 0 When q* = 1, N′ (1)>0, so q* = 0 is the final stable state of evolution, and its practical meaning is that the central government has issued incentives for China’s photovoltaic power generation industry. When the policy intensity of development is p*>G/GF and continues to rise, the local government will not issue local incentive policies in order to maintain the equilibrium of the game between the two sides.
These three situations are shown in Figure 2 below.
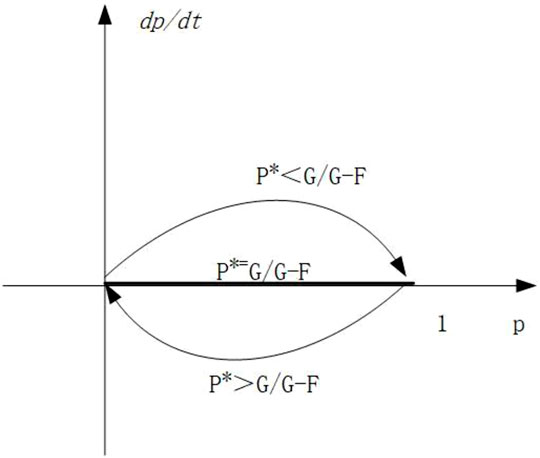
FIGURE 2. Coping strategies and evolution of local governments.
3.2.3 The Derivation of the Game Stability Strategy of the Central and Local Governments
When the game between the central and local governments is stable, the probability that the central government will issue an incentive fiscal policy is p* and the probability that the local government will issue a local incentive for the development of the photovoltaic power generation industry is q*. At this time, M(p) and N(q) simultaneous dynamic replication equations can derive to five equilibrium solutions, they are (p, q) = (0, 0) (0, 1), (1, 0) (1, 1), and (G/GF, H/HE). Then the Jacobian matrix corresponding to the game system at this time is as follows:
When the Jacobian matrix is stable, the five equilibrium points of the game system are also stable, as shown in Table 2.
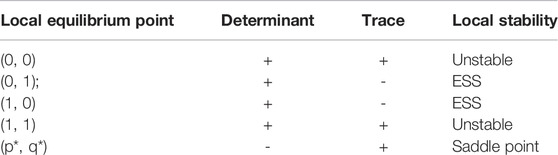
TABLE 2. Local stability of system equilibrium points.
It can be seen from the aforementioned table that among the five equilibrium points of the game (1, 0) and (0, 1) have local stability, while (0, 0) and (1, 1) do not share local stability, and (p*, q*) belongs to the saddle point, so the replication dynamic relationship between the central and local government games is shown in Figure 3 below.
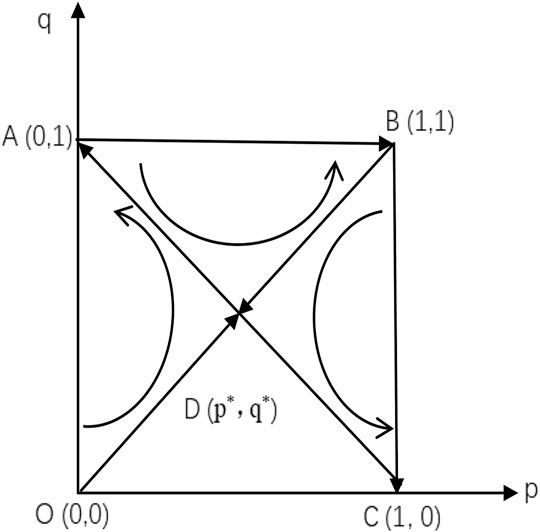
FIGURE 3. Replication dynamic evolution diagram of the central and local government game.
It can be seen from the figure that only point A and point C are the stable strategy points of the evolutionary game, when the system achieves the optimal Pareto equilibrium. Point A means that the local government relies primarily on local incentive policies. When the initial state is located in the upper left area of the figure, the system will eventually converge to point A, that is, the Pareto optimal equilibrium is at (0, 1). Point C means that it mainly relies on the central government to issue incentive policies. When the initial state is located in the lower right area of the graph, the system will eventually converge to point C, that is, the Pareto optimal equilibrium is at (1, 0). In other areas, the convergence direction of the system will be jointly determined according to supplemental conditions of the game.
Comparing the history of the development of China’s photovoltaic policy and industry, it makes no challenge to find the impact of changes in policy entities on industrial development:
(1) The development stage of China’s photovoltaic industry corresponds to point C of the system, when the main body of policies issued is the central government. The central government’s policies entirely determine the direction of the industry at that time. The photovoltaic industry totally relies on financial appropriations. General budgets and special expenditures are invested in designated links such as universities, scientific research units, manufacturing state-owned enterprises and photovoltaic projects of electrification projects in western non-power areas. So the system is stable around point C.
(2) In the early stage of the development of China’s photovoltaic industry, the corresponding system moves from point C to point A. At this stage, Chinese photovoltaic production enterprises lead the development, while power generation enterprises lag behind. The reason is that during this period, the local government replaced the central government to become the main body of photovoltaic incentive policies. By distorting the price system of production factors, it created a “policy depression” to attract investment (Wang, 2018), allowing China’s photovoltaics industry to utilize the factor endowments and basic condition resources accumulated and released by the policy reform at that time, started from the labor-intensive module manufacturing link, take the lead in developing and quickly establish the comparative advantage of module midstream products on an international scale. The central government continued to fund the construction of power projects in non-electric areas during this period, but the scale and intensity of policies were considerably less than that of local governments. The enthusiasm of local governments for the emerging photovoltaic industry can be traced back to the contradiction between local fiscal revenue and expenditure after the reform of the tax-sharing system, and it is also related to the need for China’s economic construction to resume and revive after the 1997 Asian financial crisis. The tax contribution brought by photovoltaic manufacturers has also enhanced the financial strength of the local government, and also strengthened the local government’s determination to continue to develop the production link of the photovoltaic industry.
(3) The middle and late stages of the development of China’s photovoltaic industry correspond to the process of the system moving from point A to point B. At this stage, China’s power generation enterprises are leading the development, and China’s domestic photovoltaic installed capacity has increased rapidly, which indicates that China’s photovoltaic industry chain has successfully expanded from midstream to downstream applications. At the same time, the production link has also benefited from the rise of the power generation link. In the mid-term, the production enterprises began to expand their scope from the middle of the industrial chain to the upstream and the most upstream. The self-sufficiency rate of localization has repeatedly hit new highs. The reason is that after 2009, the central government issued a policy to activate the installed capacity of the domestic photovoltaic market. From 2009 to 2013, the central government’s policy was to encourage power generation enterprises. Government policies still encourage the development of local production enterprises; after 2013, the central and local governments jointly issued incentive policies that are conducive to the development of power generation enterprises, among which local governments not only give electricity price subsidies with additional construction subsidies, and perseveringly implementing incentive policies to power generation enterprises. From 2017 to 2018, the gaming system reached the vicinity of point B, which means that the peak of the combined force of the central and local government incentive policies appeared, the historic moment when the annual new photovoltaic capacity of China’s photovoltaics in 2017 reach the highest level of 53GW, and China’s photovoltaic production in 2019. The output of each line of products reached a new high.
(4) The later stage of the development of China’s photovoltaic industry corresponds to the process that the system will move from point B to point C and finally stabilize at point C. Judging from the grid parity and the expected cancellation of subsidies, the late start year of China’s photovoltaic industry is 2021. However, from the policy evolution game model in this section, the later stage of China’s photovoltaic industry can also be counted from 2019. The first reason is that the central government issued the “531” policy in 2018, which is a relatively strict regulatory document, indicating that the central government’s electricity price subsidy will be aborted soon. The second reason is that since 2019, the central government had for the first time arranged the total budget for financial subsidies when it announced its annual project plan. The trend at this stage is that point B moves to point C, which means that the main body of policy issuance has changed from the dual main body of the central and local governments to the central government again. This is because the local incentive policies of local governments have successfully cultivated a large number of domestic production enterprises with top international competitiveness has basically formed a national whole-industry chain structure in the production link, and no longer need the subsidy policy of local governments that distorted the price system excessively at the beginning of development. Due to the realization of grid parity across the country in the later period, power generation companies do not need subsidies for on-grid electricity prices, and basically have the ability to operate independently in the market. Therefore, in the later period, policies will shift from a single subsidy method to other comprehensive methods, such as taxes and electricity prices, tariffs, etc.
To sum up, the model can clearly explain the impact of changes in policy entities on the development of China’s photovoltaic industry. Compared with previous studies, it explains the game of policy entities behind the staged development of China’s photovoltaic industry. Because China is a country with hierarchical levels of government, when developing strategic emerging industries such as photovoltaics, the horizontal game between local governments can strengthen the competitiveness of policies and thus strengthen the competitiveness of industries. Vertical games, especially the macro-control actions of the central government, can improve the rationality of policies and ensure the overall healthy and sustainable development of the industry. This has resulted in the alternating development of Chinese photovoltaic industry production enterprises and power generation enterprises, because local governments are more inclined to support production enterprises for tax and employment improvement, while central policies are more inclined to incentivize power generation enterprises to achieve structural transformation of clean energy.
So Hypothesis 1 is accepted.
3.3 The Impact of Changes in Fiscal Policy Preferences on the Development Process of China’s Photovoltaic Industry
This section primarily studies the impact of policy preferences on the mainstream photovoltaic power plant forms in China, and explains the reasons behind the phenomenon of centralized and distributed alternating leading development in power plant forms. Policy preference is a collection of policy objects (objects), methods, links, timing, and intensity in addition to policy subjects. It can also be understood as a comprehensive concept of the degree of policy easing.
It is worth to mention that the adjustment of China’s photovoltaic policy preferences is made after careful consideration based on the new situation and new trend of industrial development, which fully considers the advantages and disadvantages of the two power station forms as well as resource endowments across China.
The scale effect of centralized power plants is obvious which are generally deployed in the northwestern region with good terrain and light conditions. However, the western region is located in the inland and the economy is relatively backward. There is a serious phenomenon of “abandoning light and limiting electricity,” making it difficult to guarantee the income of the power station (Zhu, 2017). In addition, centralized power stations need to obtain construction indicators and increase investment in boosting grid-connected equipment when connecting to the grid. The qualification procedures are very complicated (Robert et al., 2015).
Distributed photovoltaic power plants are relatively small in scale and can be deployed close to power users. The grid connection and qualifications are relatively simple, and they can be broken down into pieces and have natural development advantages. The light resources in the eastern region are poorer than those in the western region, however, the population is densely distributed, the economy and the industry and commerce are developed, thus the electricity consumption is large, the on-grid electricity price is relatively high, and the power grid facilities are complete. The relative shortage of land resources in the eastern region is more suitable for the development of distributed photovoltaic power plants.
3.3.1 Model Design and Variable Description
Previous studies have focused on overcapacity in China’s photovoltaic production (Wang Hui, Zhang Yueyou1; Yu Zhiqiang2), and only a few studies have involved power generation. Considering that China’s photovoltaic industry is now in the late stage of development, and the production link is basically mature, this study chooses the power generation link to illustrate the macro scale effect of fiscal policy on China’s photovoltaic industry. The influence of the installed capacity of distributed photovoltaic power plants in each province over the years, Referring to Jia’s model (Jia et al., 2016), adding financial subsidies from the central government as an explanatory variable, the establishment of the measurement model is shown in the following equation:
In the formula, the explanatory variable is the PAIC (Provincial Annual New Installation and Capacity) of the newly added distributed photovoltaic power station in each province over the years, the unit is MW; the explanatory variable includes the central government’s national-level distributed photovoltaic subsidy CS (Central Government Subsidy), the unit is RMB/kWh. After 2013, the central government’s distributed photovoltaic subsidies are all feed-in tariff subsidies; provincial local governments’ distributed photovoltaic subsidy PS (Provincial Subsidy), in RMB/kWh, distributed by local provincial governments after 2013. The subsidy for solar PV is also the feed-in tariff subsidy; the municipal government’s distributed PV subsidy MS (Municipal subsidy), after 2013, the municipal subsidy includes both the construction subsidy and the feed-in tariff subsidy, and the construction subsidy is uniformly converted into the feed-in tariff subsidy. The control variables include the annual GDP (Gross Domestic Product) of each province, with the unit of 100 million yuan; the thermal power price TPP (Thermal Power Price), a benchmark for coal-fired desulfurization and denitrification in each province, with a unit of yuan/kWh; the annual effective sunshine duration of each province AESD (Annual Effective Sunshine Duration) in hours. The variables are defined in Table 3.
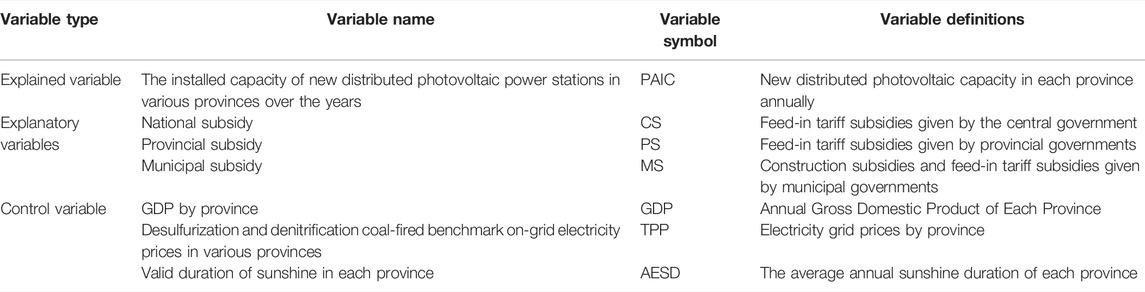
TABLE 3. Variable definition table.
These variables are set mainly based on the following considerations:
1. The explained variable selects the newly added distributed photovoltaic power station installed capacity PAIC in each province over the years, which is used to characterize the scale growth of China’s photovoltaic power generation.
2. The explanatory variables are the central government subsidy for CS, provincial government subsidy for PS and municipal government subsidy for MS, because they serve as macro financial subsidies for newly installed photovoltaic power stations, and are the main policies of governments at all levels in China to encourage the development of distributed photovoltaic power stations Way.
3. Among the control variables, the GDP of each province sets the upper limit of the independent financial resources of each province, which is related to the actual support of each province for distributed photovoltaics. The benchmark on-grid electricity price TPP for desulfurization and denitrification of coal in each province and the effective duration of sunshine in each province AESD are closely related to the income of the power station.
3.3.2 Data Sources and Descriptive Statistics
The model sample data in this section are collected from the Ministry of Finance, the National Development and Reform Commission, the Bureau of Energy and the Bureau of Statistics. Because some provinces have incomplete data, controversial or missing statistics, Inner Mongolia, Hainan, Chongqing, Guizhou, Yunnan, Xinjiang and Tibet were excluded, and the sample was narrowed down to the remaining 24 provinces, municipalities and autonomous regions. The time span is 6 years from 2013 to 2018. The descriptive statistics of the variables are listed in Table 4 below.
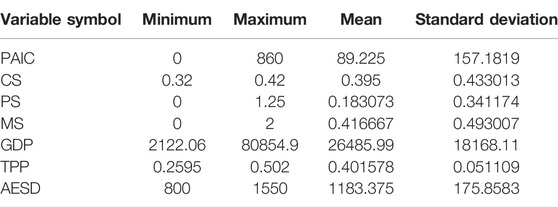
TABLE 4. Variable descriptive statistics.
3.3.3 Regression Results
Variable non-stationarity may lead to spurious regression of the model, and the stationarity test generally adopts the method of unit root test (Gujarati, 2016). Taking into consideration of rigor, the stationarity test of the unit root of each variable in this model was performed first. This model uses the IPS under the common unit root and the LLC method under different unit roots to obtain the corresponding accompanying probability p-value, based on whether the original sequence is stationary. After testing, the value of the corresponding p-value of all variables corresponding to the probability is 0, suggesting that the sequence trend of each variable in this model is stable, thus no further cointegration test is required.
The Pearson correlation test is used to observe the correlation between variables excluding other control factors, and can roughly evaluate whether there is multicollinearity between variables (Luo and Liu, 2019). From Table 5, it can be observed that of the main variables of this model, the central government subsidy (CS), provincial government subsidy (PS) and municipal government subsidy (MS) are all likely to have a significant positive correlation related to the installed capacity of distributed photovoltaic power plants in each province over the years (PAIC).
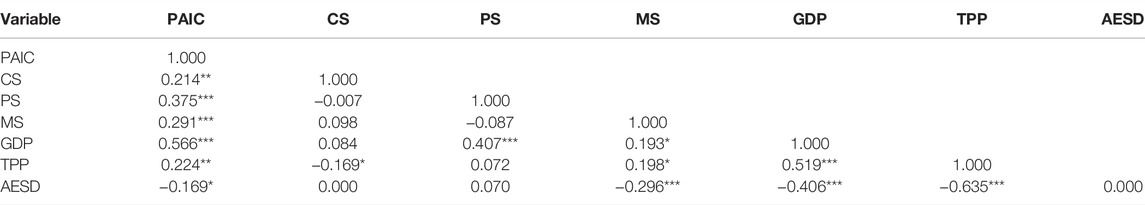
TABLE 5. Correlation test.
From Table 5, it can also be seen that although there is a significant correlation between the control variables, the correlation coefficient is still low when the empirical value of the correlation coefficient is 0.75. There may be multicollinearity problems in the annual effective duration of sunshine (AESD) in each province. It is necessary to perform multicollinearity test with this model through the variance inflation factor method VIF (Variance Inflation Factor). From Table 6, we can obtain that the mean value of the VIF test is 1.76 and there is no variable with a VIF value greater than 10, which indicates that the model set in this study is less likely to experience the problem of multicollinearity.
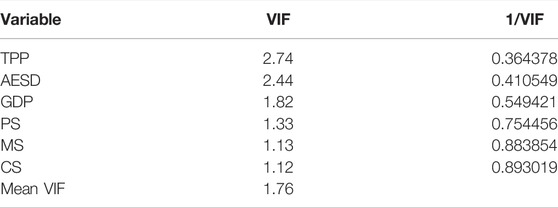
TABLE 6. Multicollinearity tests.
In the Hausman test, the p value is greater than 0.01, indicating that the null hypothesis is accepted and the model excludes the influence of endogeneity. The regression results are shown in Table 7 below.
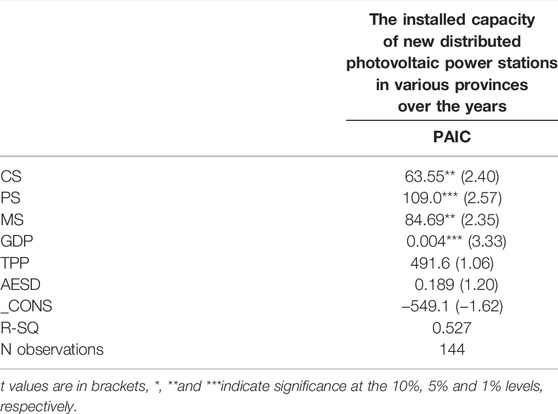
TABLE 7. Regression results.
From the regression results, the financial subsidies of local governments plays an obvious role in promoting the newly installed capacity of distributed photovoltaic power plants in various provinces in China, which is consistent with the previous research findings (Jia et al., 2016). In addition, this model proves that the financial subsidies provided by the central government are also significantly related to the installed capacity of interprovincial distributed photovoltaics. Specifically,
1. The national subsidy CS, provincial subsidy PS and municipal subsidy MS are significant at 1%, 1%, and 5% of the newly added distributed photovoltaic installed capacity in each province over the years, and the coefficients are 63.55, 109.0 and 84.69 respectively, which shows that the distributed photovoltaic financial subsidies of governments at all levels can significantly promote the increase of distributed photovoltaic installed capacity in each province. Among them, the unified feed-in tariff subsidy of the central government is the common institutional basis for the development of distributed photovoltaics in various provinces. From a provincial perspective, municipal subsidies complement the provincial subsidies. From a vertical perspective of provincial subsidy policies, Jiangsu Province is dominated by unified provincial subsidies, while Zhejiang Province is dominated by their respective municipal subsidies. From the perspective of promotion results, distributed photovoltaics in Zhejiang Province have larger increments and higher growth rates. Collectively, it shows that the more sufficient the main body of the incentive policy, the better the promotion effect on the development of the industry. Because whether it is a construction subsidy or an on-grid tariff subsidy, or reducing the initial investment of its own funds, or improving the income level of the power station, it can drive the enthusiasm of the owners to adopt the form of distributed photovoltaic power plants.
2. The GDP has a significant effect on the newly added distributed photovoltaic installed capacity of each province over the years at the level of 1%, with a coefficient of 0.004, which shows that if a province has a better economic situation, it will be more conducive to the distributed photovoltaic application of the province. The reason is that GDP is an important indicator of the economic development level of each province, which can indirectly reflect the upper limit of the financial resources of each province. Provinces with good financial resources can raise more funds to provide more local subsidies with distributed projects. From a practical point of view, distribution of photovoltaic subsidies in the eastern provinces will bring multiple benefits, for example, compensating for the disadvantage of natural conditions due to the lack of light resources, fossil energy and flat land, facilitating the consumption of the photovoltaic front-end products of local enterprises, alleviating the production capacity and the cost of production.
3. The thermal power on-grid tariff TPP and the effective sunshine duration AESD demonstrate no significant impact on the installed capacity of newly added distributed photovoltaic power plants in each province over the years. These two control variables mainly represent the constraints on the income of distributed photovoltaic power plants. The positive regression result indicates that the necessary financial subsidies can help the eastern provinces to overcome certain problems such as poor lighting conditions, lack of fossil energy, and less open space in terms of geographical terrain.
So, Hypothesis 2 is doubtlessly accepted.
3.3.4 Robustness Check
Generally speaking, robustness testing includes changing the sample interval (or removing extreme values), function form, measurement method, control variable, variable definition, data source and other methods to examine the stability of measurement results. (Chen, 2018). In the robustness test of this model, variation of the measurement method is adopted, and the generalized moment estimation GMM model is used. The main regression results shown in Table 8 are basically consistent with the results in Table 7, so this model is presumably to be robust.
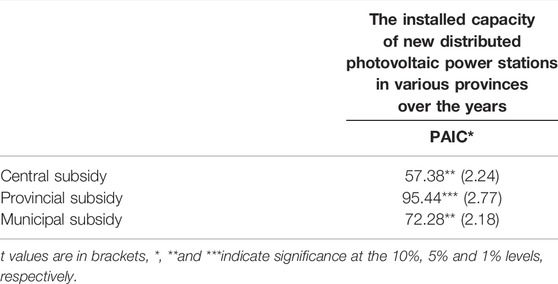
TABLE 8. Robust regression results.
4 Research Conclusion and Policy Recommendations
4.1 Research Conclusion
1. Changes in policy entities have had an intuitive impact on the development of China’s photovoltaic industry. China’s multi-government incentives are a unique institutional feature of China’s development of photovoltaic industry. Because China is a country with multiple levels of government, it differentiates from particular foreign countries when the local authority of provinces and cities is compared to the whole country. As a result, when developing strategic emerging industries such as photovoltaics, the horizontal game involving local governments can strengthen the competitiveness of policies and the industry. Vertical games, especially the macro-control actions of the central government, can improve the rationality of policies and ensure the healthy and sustainable development of the industry. In the process of cooperation between the central and local governments, it has also objectively promoted the alternate leading development of China’s photovoltaic industry production and power generation enterprises.
2. Changes in policy preferences have had an impact on the power station form of China’s photovoltaic industry, which is mainly reflected in the development proportion of distributed power stations from 2013 to 2018. The reason is the change in China’s photovoltaic fiscal policy preferences. At that time, the distributed photovoltaic policy was relatively loose and thus conducive to the development of distributed photovoltaics, which is reflected in scale indicators, subsidy policies, power generation and consumption and other aspects. With the indentation of distributed incentive policies in 2018, the proportion of centralized photovoltaic power plants in China has increased again, contributed by the incentives of large base plans such as “Front Runner” and “County Development".
4.2 Policy Recommendations
1. Because the Chinese government possesses five layers, policy entities need to make greater efforts in terms of policy coordination. Coupled with the tax-sharing system that China has implemented since 1993, China’s current taxation is mainly based on indirect taxation of value-added tax, and the transition to direct taxation such as personal income tax and corporate income tax demand presumably prolonged hours. Considering that China’s photovoltaic industry has eventually achieved the alignment of power generation side costs with coal power. In the power generation link, the main body of fiscal policy should be the central government, and more use of tax incentives, fiscal discounts, national debt investment, REITs and other forms are suggested. In this way, problems such as overcapacity, homogenization, and malicious bidding caused by financial subsidies can be prevented. In the production, considering the impact of the new crown epidemic and the increase in the price of upstream raw materials in recent years, the central government and local governments need to jointly introduce incentives and guidance measures to encourage factories to continuously improve quality and efficiency, and reduce the cost of photovoltaic power plants on hardware system.
2. Increasing the speed of deployment of photovoltaic power generation systems has become increasingly imperative as China has set ambitious goals of carbon peaking by 2030 and carbon neutrality by 2060. In pursuit of this goal, the idea of “development of the whole county” was formed and implemented in 2021, which makes the installed capacity of centralized photovoltaic power plants exceed the trend of distributed photovoltaic power plants for a second time. However, from the perspective of China’s realization of a two-carbon overall situation, the proportion of distributed photovoltaics determines whether this goal can be achieved, because the sustainable development of the photovoltaic industry requires extensive participation of individuals, enterprises and markets. Therefore, to a certain extent, it is necessary for the fiscal policy of China to favor distributed photovoltaics, to provide continuous incentives in terms of policy methods, links, timing and intensity. For example, in 2021, the Ministry of Housing and Urban-Rural Development once again mentioned building surface photovoltaics. Under the existing and predictable technical conditions, it is not a good scheme for distributed photovoltaics, which will weaken the cost and deployment convenience of distributed photovoltaics. Competitive advantages.
4.3 Discussion of the Finding, Research Limitations, and Future Directions
4.3.1 Discussion on the Findings of This Study
Even though previous studies have recognized the differences between the central government and the local government as the main body of policy issuance, the established game model exists between the government and the enterprise, or the central government, the local government and the enterprise. However, this study argues that due to the energy highly planned industry in China, an absolutely ideal two-party game between the government and the enterprise is hardly found. However, if the three-party game between the central government, the local government and the enterprise is introduced, the fact that the central government, the local government, the production enterprise and the power generation enterprise will get involved in a four-way game is actually ignored. The process will be more complicated. Therefore, in order to explain the influence of policy entities on China’s photovoltaic industry, this study only introduces the game model with the central government and the local government involved.
Previous studies largely focused on the production link, especially on cost-benefit and excess capacity, while insufficient research was conducted on the power generation link. In the previous model, although the financial subsidies given by the local government were discussed, the financial subsidies of the central government were missing from the model. This study believes that the effect of central subsidies should hardly be undervalued, despite that the Chinese photovoltaic industry has currently achieved the grid parity on the power generation side.
4.3.2 Limitations of This Study
On the one hand, due to the rapid development of China’s photovoltaic industry, this study mainly conducts a review of the history, aiming to gain experience and inspiration from previous policies and industry history. On the other hand, due to the lack of public data and the impact of strict policy regulation, this study can only select a narrow part of the research timeline in policy preference.
4.3.3 Future Prospects
On the basis of this study, in the main part of the policy, on the one hand, factories and power generation enterprises, financial departments, residential departments and power transmission and sales departments can be attracted to form more game parties. On the other hand, local governments can be further refined into provincial governments and local governments. In terms of policy preference, we will further study the impact of major policies, such as “30 May 2018 Document,” “2060 Carbon Neutrality” and “County Development,” on China’s photovoltaic industry by means of impulse response.
Data Availability Statement
The original contributions presented in the study are included in the article/Supplementary Material; further inquiries can be directed to the corresponding author.
Author Contributions
LG: conceptualization, methodology, supervision, and project administration. XT: formal analysis, software, and writing—review and editing. MY: data curation, visualization, validation, investigation, and writing—original draft.
Conflict of Interest
Author XT was employed by company Industrial and Commercial Bank of China.
The remaining authors declare that the research was conducted in the absence of any commercial or financial relationships that could be construed as a potential conflict of interest.
Publisher’s Note
All claims expressed in this article are solely those of the authors and do not necessarily represent those of their affiliated organizations, or those of the publisher, the editors, and the reviewers. Any product that may be evaluated in this article, or claim that may be made by its manufacturer, is not guaranteed or endorsed by the publisher.
Acknowledgments
Thanks go to Mr. Wang Chaocai, China Academy of Fiscal Sciences, and China Photovoltaic Association for their help and guidance on the completion of this article.
Footnotes
1Wang Hui, Zhang Yueyou. Is there excess capacity in strategic emerging industries? Taking China’s photovoltaic industry as an example [J]. Industrial Economic Research, 2015 (1):61-70.
2Yu Zhiqiang. Research on capacity utilization rate of China’s photovoltaic industry based on dual-system DEA [J]. Future and Development, 2017, 41 (10): 20-24.
References
Adebayo, T. S., AbdulKareem, H. K. K., Bilal,, , Kirikkaleli, D., Shah, M. I., Abbas, S., et al. (2022a). CO2 Behavior amidst the COVID-19 Pandemic in the United Kingdom: The Role of Renewable and Non-renewable Energy development[J]. Renew. Energy 189, 492–501. doi:10.1016/j.renene.2022.02.111
Adebayo, T. S., Agyekum, E. B., Kamel, S., Zawbaa, H. M., and Altuntaş, M. (2022c). Drivers of Environmental Degradation in Turkey: Designing an SDG Framework through Advanced Quantile Approaches. Energy Rep. 8, 2008–2021. doi:10.1016/j.egyr.2022.01.020
Adebayo, T. S., Akadiri, S. S., Adedapo, A. T., and Usman, N. (2022b). Does Interaction between Technological Innovation and Natural Resource Rent Impact Environmental Degradation in Newly Industrialized Countries? New Evidence from Method of Moments Quantile Regression. Environ. Sci. Pollut. Res. 29, 3162–3169. doi:10.1007/s11356-021-17631-y
Alexander, G. (2012). Historical Perspective of Economic Backwardness [M]. Beijing: Commercial Press, 492.
Chen, Z. (2013). Government-led Research on the Growth Dilemma of China's Photovoltaic Industry [J]. Discuss. Mod. Econ. 07, 39–43. doi:10.3969/j.issn.1009-2382.2013.07.008
Darghouth, N. R., Wiser, R. H., Barbose, G., and Mills, A. (2016). Net Metering and Market Feedback Loops: Exploring the Impact of Retail Rate Design on Distributed PV deployment[J]. Appl. Energy 162 (3), 713–722. doi:10.1016/j.apenergy.2015.10.120
Fareed, Z., Salem, S., Adebayo, T. S., Pata, U. K., and Shahzad, F. (2021). Role of Export Diversification and Renewable Energy on the Load Capacity Factor in Indonesia: A Fourier Quantile Causality Approach[J]. Front. Environ. Sci. 2021, 434. doi:10.3389/fenvs.2021.770152
García-álvarez, M. T., Cabeza García, L., and Soares, I. (2018). Assessment of Energy Policies to Promote Photovoltaic Generation in the European Union[J]. Energy 151, 864–874. doi:10.1016/j.energy.2018.03.066
Gujarati, P. (2016). Essentials of Econometrics. 4th Edition. Beijing: Machinery Industry Press, 285.
Jia, Y., Shi, J., Pang, Y., and An, P. (2016). Empirical Analysis of Distributed Photovoltaic Power Generation Subsidy Policy Based on Provincial Cross-Sectional Data [J]. Renew. Energy 34 (10), 1435–1440.
Kirikkaleli, D., Güngr, H., and Adebayo, T. S. (2021). Consumption-based Carbon Emissions, Renewable Energy Consumption, Financial Development and Economic Growth in Chile[J]. BSE 31, 1123–1137. doi:10.1002/bse.2945
Li, S.-J., Chang, T.-H., and Chang, S.-L. (2017). The Policy Effectiveness of Economic Instruments for the Photovoltaic and Wind Power Development in the European Union. Renew. Energy 101, 660–666. doi:10.1016/j.renene.2016.09.005
Liu, S., Fu, Z., Li, C., and Yu, W. (2019). Theoretical Research on Building a Modern Financial Subsidy System [J]. Financial Res. 2019 (09), 3–11.
Luo, H., and Liu, J. (2019). Lost" of R&D Assistance of Military Enterprises under the Intervention of Subsidies: An Empirical Study Based on the Adjustment Effect of Financial Subsidies [J]. Sci. Technol. Prog. Countermeas. 36 (11), 125–134. doi:10.6049/kjjbydc.2018110093
Lv, D., Guo, B., Chen, W., and Meirong, Z. (2017). Research on the Optimization Path of My Country's Photovoltaic Industry Policy Based on Multi-Party Cooperation Game [J]. Sci. Technol. Manag. Res. 37 (03), 56–62. doi:10.3969/j.issn.1000-7695.2017.03.010
Pyrgou, A., Kylili, A., and Fokaides, P. A. (2016). The Future of the Feed-In Tariff (FiT) Scheme in Europe: The Case of Photovoltaics. Energy Policy 95, 94–102. doi:10.1016/j.enpol.2016.04.048
Robert, M., Fang, Z., Hao, D., and Jun, S. (2015). Analysis of Distributed-Generation Photovoltaic Deployment, Installation Time and Cost, Market Barriers, and Policies in China[J]. Energy Policy 81, 43–55. doi:10.1016/j.enpol.2015.02.010
Sarasa-Maestro, C. J., Dufo-López, R., Bernal-Agustín, J. L., and José, L. (2013). Photovoltaic Remuneration Policies in the European Union. Energy Policy 55, 317–328. doi:10.1016/j.enpol.2012.12.011
Sesmero, J., Jung, J., and Tyner, W. (2016). The Effect of Current and Prospective Policies on Photovoltaic System Economics: An Application to the US Midwest. Energy Policy 93, 80–95. doi:10.1016/j.enpol.2016.02.042
Shrimali, G., and Jenner, S. (2013). The Impact of State Policy on Deployment and Cost of Solar Photovoltaic Technology in the U.S.: A Sector-specific Empirical Analysis. Renew. Energy 60, 679–690. doi:10.1016/j.renene.2013.06.023
Wang, C. (2018). Review and Prospect of Local Financial Reform in China [J]. J. Zhongnan Univ. Econ. Law 2018 (05), 21–25+163. doi:10.3969/j.issn.1003-5230.2018.05.003
Wang, H., and Zhang, Y. (2015). Is There Excess Capacity in Strategic Emerging Industries? ——Taking China's Photovoltaic Industry as an Example [J]. Industrial Econ. Res. 2015 (1), 61–70.
Yu, D., and Lu, Y. (2015). Improper Government Intervention and Overcapacity in Strategic Emerging Industries: Taking China's Photovoltaic Industry as an Example [J]. China Ind. Econ. 2015 (10), 53–68.
Yu, Z. (2017). Research on Capacity Utilization Rate of China's Photovoltaic Industry Based on Dual-System DEA [J]. Future Dev. 41 (10), 20–24. doi:10.3969/j.issn.1003-0166.2017.10.005
Zang, N. (2016). Thirteenth Five-Year" Photovoltaic Power Generation Cost Trend Analysis [J]. China Electr. Power Enterp. Manag. 2016 (13), 50–53. doi:10.3969/j.issn.1007-3361.2016.05.014
Zhai, P. (2010). Environmental, Policy and Social Analysis of Photovoltaic Technologies[J]. Dissertations & Theses - Gradworks. Available at https://keep.lib.asu.edu/items/149523
Zhang, A., and Wang, W. (2017). Analysis of the Factors Affecting the Income of Photovoltaic Power Generation Projects [J]. China Collect. Econ. 2017 (20), 14–15.
Zhou, D., Xu, Q., Ma, J., and Wang, Q. (2018). Research on Supporting Policies of Photovoltaic Industry Based on Evolutionary Game [J]. Res. Technol. Econ. Manag. 2018 (03), 114–119. doi:10.3969/j.issn.1004-292X.2018.03.021
Keywords: photovoltaic, industry, fiscal policy, sustainable development, alternative
Citation: Tong X, You M and Gu L (2022) The Impact of Fiscal Policy on the Sustainable Development of China’s Photovoltaic Industry. Front. Environ. Sci. 10:883546. doi: 10.3389/fenvs.2022.883546
Received: 25 February 2022; Accepted: 24 May 2022;
Published: 09 August 2022.
Edited by:
Gagan Deep Sharma, Guru Gobind Singh Indraprastha University, IndiaReviewed by:
Ehsan Rasoulinezhad, University of Tehran, IranSanjeet Singh, Chandigarh University, India
Copyright © 2022 Tong, You and Gu. This is an open-access article distributed under the terms of the Creative Commons Attribution License (CC BY). The use, distribution or reproduction in other forums is permitted, provided the original author(s) and the copyright owner(s) are credited and that the original publication in this journal is cited, in accordance with accepted academic practice. No use, distribution or reproduction is permitted which does not comply with these terms.
*Correspondence: Liangjie Gu, NTE5ODEzNjBAcXEuY29t