- 1School of Economics, Tianjin University of Commerce, Tianjin, China
- 2APEC Research Center, Nankai University, Tianjin, China
- 3School of Economics, Nankai University, Tianjin, China
This study investigates the motives behind the degrees of molecular pollution during the COVID-19 pandemic, which persisted from first walk 1 January 2020 to 31 December 2020. A spatial Durbin file model is used linked to an edge backslide model in this article to find the widely inclusive and nearby consequences of present-day plan and urbanization on nonrenewable energy source by things. The outcomes are discussed next: both were available in modern-day plan and urbanization from a generally inclusive standpoint. The geological consequences of CO2 emissions were concentrated on utilizing information from 22 European countries somewhere in the range of 1990–2020, and all through the examination cycle, the Durbin spatial model was discovered. Although factors such as gross domestic product per capita, urbanization, and energy power impact CO2 emissions, exchange receptivity stays unaltered. The findings will fill in as critical repercussions for state-run administrations, wellbeing experts, and regulators in the war against the return of COVID-19 in Europe. The great number of suggestions were worthless since the concept integrated six money-connected creation assessments into a coordinated arrangement. There is information to indicate that CO2 emissions are associated with money-related events in neighboring nations.
Introduction
There is an increase in global temperature due to the addition and collection of ozone-draining substances in the environment which all contribute to a constant state of flux. The concept of natural SPE, methane, nitrous oxide, and CO2 are common ozone-depleting gases emitted by mechanical processes, such as those found in power plants and vehicles. Approximately 75% of ozone-depleting chemical emissions come from CO2 emissions (Abbasi, 2016), and global temperatures have already reached 1.5°C, which is extraordinarily high. According to the findings, financial development stimulates money-related development, which boosts oil premiums and results in increased CO2 emissions (Sadorsky, 2010; Islam et al., 2013; Tang and Tan, 2015; Le et al., 2020). By decreasing incoming expenses and increasing liquidity for reported ventures, cash-related advancement lowers credit focus and allows them to construct yield. As a result, financial regard develops, resulting in increased energy consumption and CO2 emissions. Furthermore, there is a strong link between monetary growth and ecological degradation, implying that monetary improvement is linked to a baseline expansion in CO2 emissions, followed by a decline as the economy grows, resulting in an EKC with a swapped U-shape(Orubu and Omotor, 2011). There are two approaches to understand the link between cash-related activities and money development, as represented by hypothetical strategies: first, the money-related advancement of a region is triggered by monetary development. In addition, the development of cash provides a fundamental framework for the growth of money (Goldsmith, 1969). While most experts agree that monetary progress is essential for mechanical advancement, it also allows businesses and governments to acquire earth-useful innovations, and finance also stimulates interest in energy-efficient advances capable of minimizing the negative impact of petrol subordinates, so improving the air quality or environmental quality (Jalil and Feridun, 2011; Tang and Tan, 2015; Acheampong, 2019; Sun et al., 2021). In order to reduce Chile’s dependence on imported nonrenewable energy sources, the country’s policymakers should actively encourage the development of low-carbon technologies and renewable energy investments, particularly in sectors that are more energy-intensive and are causing an increase in consumption-based CO2 emissions (Kirikkaleli et al., 2021). Ongoing commitments in this sector have advised against using biological review strategies to investigate air pollution and COVID-19 credulously. In light of the pandemic’s astonishing progress, strategic isolation and lockdowns have been imposed around the globe, resulting in crucial global and local financial disruptions. Air quality improvements have been declared in several urban communities where strategic isolation and lockdowns have been required, in accordance with the reverse relationship between money, mobility, and air quality. CO2 emissions and renewable energy are mutually exclusive. However, CO2 emissions correlated positively with nonrenewable and actual GDP growth. The circumlocutory and geographical flood effects of monetary change on CO2 emissions are missed by the standard board econometric approaches; thus, spatial econometric models are more vital and capable (Meng et al., 2017; You and Lv, 2018). Geopolitical risk has a direct impact on carbon emissions in India. Geopolitical risk increases environmental deterioration in the intermediate quantiles while decreasing environmental degradation in the lower and higher quantiles. Demand for nonrenewable energy is driving up emissions, while demand for renewable energy is driving them down. The economic development and renewable and nonrenewable energy uses are linked via a feedback mechanism in the panel causality analysis (Bekun et al., 2018). Several studies have already combined data from ground-based equipment and satellites to estimate SO2 levels. We were expecting a mixed or even inconsistent evaluation, given that most research projects in this sector use a standard and unambiguous board data assessment that ignores the geographical dependence of the data (Lv and Li 2021). Tourism, GDP, and foreign direct investment all degrade the natural environment. According to the causality study, tourism and carbon dioxide emissions are linked in a one-way causal relationship. FDI and carbon dioxide emission share a similar causation pattern with urbanization and carbon dioxide emission. Our next step is to look at the numerous heterogeneous effects of monetary policy on CO2 emissions using various financial movement signals. In regard to global air quality, the lockdowns are the “largest scale trial of all time.” They also serve as models for what to expect in future arrangements. The Eurozone’s environment deteriorates as a result of financial inclusion. Both economic expansion and the use of renewable energy contribute to environmental damage (Fareed et al., 2020). According to these findings, earlier studies have only considered short-term changes in CO2 emissions caused by changes in the value of a country’s currency while neglecting its longer-term flooding effect on CO2 emissions. Several additional financial and environmental requirements have been added to the content of this study According to our research, this is the first piece to examine the influence of financial expansion on CO2 emissions from a local standpoint. As a result, we are investigating the relationship between financial development and CO2 emissions from a board-level viewpoint. The ongoing and fresh COVID-19 epidemic has had a significant impact on our day-to-day activities and financial planning. Legislators have imposed lockdown measures to stop the spread of the disease, such as closing down workplaces, educational institutions, restaurants, and other places where people congregate to communicate, and all conditions of the European Association had imposed some form of developmental restriction (Sun and Razzaq, 2022).
Below is an explanation of the rest of this article’s structure. A writing study on the impact of monetary growth on CO2 emissions can be found in Section 2, while the evidence test and trial templates used in Section 3 are shown in Section 4, and the scientific findings are presented in Section 5, which wraps up the investigation and makes several recommendations for the framework.
Literature Review
There is growing evidence that money-related changes have an impact on CO2 emissions, and this section summarizes some key results on the impact of increased financial resources on CO2 outflows and regular contamination. In addition, the previous tests appear to be substantially comparable on the basis of the fact that geographical dependence on information and nations using conventional board data as well as other econometric methodologies was ignored. While no nation is truly isolated, geographic econometric models should be considered as relying on data from several regions to avoid skewed findings. Renewable energy is hailed as a cure for reducing pollution since it has a statistically significant negative correlation with CO2 emissions throughout the time period under study (Bekun et al., 2021a). To cope with the challenges caused by spatial dependency between credits, standard procedures like ordinary least squares (OLS) and summary methodology for second (GMM) are ineffective. When GDP development is prioritized over environmental quality, we get the EKC phenomena. In terms of causation, GDP growth and carbon emission follow a feedback Granger causality, whereas energy intensity and carbon emission follow a similar causality (Bekun et al., 2021b). The momentum research will next use spatial econometric approaches to look at the impact of money-related improvements on CO2 emissions. GMM was used by Yuxiang and Chen (2011) to examine the impact of money-related improvements on petroleum derivative side effects in China, and results revealed that financial progress, as controlled by the extent of bank credits to GDP, the extent of private advances to GDP, and the extent of non-private GDP, reduces the impact of fossil fuel byproducts. According to the most recent statistics, there were 67,618,431 confirmed COVID-19 cases worldwide, with 1,544,985 deaths thus far. The United States has declared the most positive cases so far, followed by India, Brazil, Russia, France, and Italy. There is evidence that the amount of petroleum derivative side effects in Pakistan decreases when the amount of fluid liabilities and private area advances to GDP increases, as determined by Jalil and Feridun (2011), using the ARDL method. In the first place, the positive shocks of innovation disrupt CO2 emissions’ harmful ramifications, while the negative shocks impair the ecological quality. Second, globalization and REC reduce CO2 emissions, which improves ecological quality. Third, FDI and FFC demonstrate the direct link between CO2 emissions and the pollution issue, making the pollution issue even more worrisome (Weimin et al., 2021). In regard to working on money-related events and financial new developments, energy use plays a significant role. It also produces large emissions that countries might increase their energy production even more by improving energy efficiency. The presentation of oil venture subsidy programs, energy steadiness, and energy base movement can be modified to achieve monetary alterations and GDP growth in Sub-Saharan African countries. Positive and negative shocks have a considerable impact on environmental quality in both the short and long terms, according to the results from NARDL’s method. Shahbaz et al. (2013a) investigated in Indonesia the link between financial activities and nonrenewable energy source outcomes using ARDL and Granger causality considerations. According to their findings, money-related change is necessary to spur environmentally friendly innovation, which reduces CO2 emissions and enhances natural utility. Although globalization, energy use, commerce, and GDP development all have positive short-term correlations, a review of fuel importation also reveals a negative association with the ecological imprint of the global economy (Rehman et al., 2021a). Shahbaz et al. (2013b) used the cutoff points to look at the technique to deal with, examining the co-integration between monetary events and CO2 increases in Malaysia, and found that CO2 release, monetary events, energy consumption, and monetary development have had significant run links for a long time, as evidenced. There is a positive correlation between Pakistan’s economic development and nuclear energy, according to short-run estimates, whereas the remaining factors revealed a negative correlation. In order to deal with the issue of GHG emissions, it is essential to have a conservative policy and financial assistance (Weimin et al., 2021). A decrease in CO2 emissions is also seen from the data. An increased use of power and increased financial resources destroy CO2 pollution. Air pollution poses substantial health risks to humans, such as heart and lung diseases and a variety of other ailments. Ziaei (2015) found that stock return rate staggers affect energy use, particularly in long-horizon situations with East Asian-Pacific countries present. It takes a long time for positive shocks to the output of cereal crops to have a detrimental influence on air quality because they increase carbon dioxide emissions, but negative shocks have no effect at all. China’s carbon dioxide emissions are unaffected by shocks to forests, ironically (Rehman et al., 2021b). Additionally, Al-Mulali et al. (2015) used co-integration tests and FMOLS to discover that homegrown credit to the private sector raises the production of fossil fuel byproducts in 129 different countries. Furthermore, it is possible that air pollution is directly linked to the number of sickness cases. According to Abbasi and Riaz, (2016), the economic growth in Pakistan resulted in decreased CO2 emissions because of the use of ARDL and VAR. They used hard and quick credit, private area credit, security, market capitalization, and trade protections to deal with the new financial development. CO2 emissions induced the environmental Kuznets curve theory for each of the four sectors of the economy In addition, financial development and urbanization have been shown to increase CO2 emissions, whereas technical innovation is needed to reduce sector-based CO2 emissions (Murshed et al., 2022a). The causality test was used to determine if there was a two-way causation between the local acknowledgment of private space and CO2 pollution by who also used a measurement of BRIC economies’ financial progress as a proxy. They have rigged things such that the growth of the banking sector increases CO2 emissions. Ahmad et al. (2018) achieved a similar outcome by extending local loans to the private sector to address money-related issues. They used the ARDL and ECM techniques to find that China’s nonrenewable energy outcome was energized by financial development. The country’s long-term growth is negatively impacted by CO2 emissions from the transportation industry. It was revealed that positive shocks to CO2 emission statistics from the transportation sector slowed the long-term economic growth in Pakistan, whereas negative shocks were shown to speed up both short- and long-term economic progresses in this example (Rehman et al., 2021c). Ehigiamusoe and Lean (2019) examined in 122 nations the impact of monetary change on fossil fuel byproducts, discovering that financial progress ruined petroleum derivative results over time. Analyzed station-based data on air quality in 34 countries and discovered that NO2 and PM2.5 concentrations have increased by 60 and 31%, respectively, due to increased centralization. The long-term relationships between renewable power generation, economic globalization, economic growth, and urbanization, as well as emissions of carbon dioxide due to energy production, were confirmed by the econometric analysis (Murshed et al., 2022b). Most recently, monitored a 9.1% drop in NO2 convergence 90 days after the lockout using an example of 174 nations. While petroleum product outcomes have fallen in high-paying countries, as the research shows, they have increased in low- and mid-paying countries. An investigation in 24 MENA nations was conducted by Charfeddine and Kahia (2019) to investigate the causative link between energy consumption that is safe for the ecosystem and monetary activities such as CO2 emissions, and the financial turn of events. Rehman et al. (2022) have observed that the variable population growth, economic growth, rural population growth, and livestock output had a positive correlation with CO2 emissions in the short-term inquiry. The increase in both animal production and energy use have a favorable impact on long-term CO2 emissions, as does population growth, economic growth, rural population expansion, and livestock production. On a board vector autoregressive approach, the review’s findings show that activities involving money and the use of environmentally friendly electricity have tight ties with CO2 release. Adebayo et al. (2022a) observed that monetary development and nonrenewable energy usage add to the debasement of the climate, while globalization and sustainable power use help to control the corruption of the climate. The most obvious link in the epidemic is the sharp decline in emissions, which corresponds to a decline in the overall interest and consumption compared to the situation when GDP and outflows were separated. When looked at the reasons for population growth and urbanization as well as their links to CO2 emissions, they uncovered a wealth of information. They discovered that the adverse impacts of petroleum products had enormously favorable links with various parameters. For the second technique to break down the influence of financial market development on nonrenewable energy source result power in 83 countries between 1980 and 2015, Acheampong et al. (2020) used the instrumental variable summary method (GMM). Important issues include the definition of health endpoints and recurrence metrics to define and quantify COVID-19 in the population. The FDI affects CO2 emissions in both good and bad ways, and as a result, the costs rise and the problem of pollution resurfaces (Rehman et al., 2021d). Adebayo (2022b) found that i) REC improves environmental quality, ii) fossil fuels harm environmental quality, and (iii) FDI inflows improve environmental quality at all frequencies. Air pollution’s potential negative impact on the COVID-19 pandemic is the cause for grave concern. Zhao and Yang (2020) used a static and dynamic inquiry to look at the relationship between financial events and CO2 emissions at the Chinese public level. The stunning findings show that the progress made in regional money has had little effect on CO2 emissions, as a result of lowering environment friendliness standards and narrowing the scope of environmental requirements in the United States (Utility Jump 2020). There is a strong correlation between CO2 emissions and globalization, tourist arrivals, economic expansion, and energy consumption in the majority of quantiles, according to quantile causality results. Lv and Li (2021) used a board data spatial econometric approach for 97 countries from 2000 to 2014 to explore the impact of financial change on CO2 pollution and concluded that there is a geographical association between CO2 emissions via countries during this period. They also demonstrated that the CO2 emissions of a country may be affected by the financial progress of its neighbors. A worldwide integration of economic and financial factors for natural resource-related and environmentally friendly goods and services is supported by the study’s findings (Adebayo et al., 2022c). Researchers from studied the regional distribution of CO2 emissions that when energy productivity improved, all six financial development metrics became more significant, resulting in increased CO2 emissions despite their negative flood implications. According to the EU27 and UK saw an emanation decay of 12.7% in the first half of 2020, largely due to changes in ground transportation, with France, Spain, and Italy seeing the largest declines. Between 1 January and 31 July 2020, CO2 outflow decreases in Europe were around 10.3%, with the bulk of declines coming from ground transportation and air travel, according to a study by Guevara et al. (2020).
Methodology and Data Analysis
Empirical Model
In this research, the logarithm of the carbon emission
When we regard monetary growth as a free factor, the ecological efficiency is turned U-shaped, so the negative coefficient of the squared kind of gross domestic product per capita in the CO2 emanation situation is hypothetically discussed and should be investigated, according to the natural Kuznets (EKC) conjecture. In either case, as the economy develops, the condition of the atmosphere first deteriorates and then changes (Grossman and Krueger, 1995; Lee et al., 2010). Other factors such as urbanization, energy force, and trade openness are often used as illustrative factors for CO2 emissions in the literature (Epule et al., 2012; Chakravarty and Tavoni, 2013; Solarin et al., 2017; Acheampong, 2019; Kayani et al., 2020).
To surface the different accepts of the effectiveness of financial development on CO2 emission in depth, the interaction terms of energy intensity and financial development are entered in the new form of the CO2 emission model of Equation-2, where
Higher-energy intensity is supposed to have a positive impact on CO2 emissions because energy intensity is a metric of energy quality, and a higher value of this index equals more CO2 emissions, so the coefficient six should be positive. However, if the financial market develops to stimulate pro-environmental infrastructure, the coefficient seven is negative, and the energy intensity’s initial positive effects are diminishing. The consequences of CO2 emissions are investigated using a spatial econometric model, with a focus on financial growth metrics. A spatial panel model could have a lagged dependent variable or adopt a spatially autoregressive mechanism in the error word, according to the spatial Durbin model, which involves spatially lagged independent variables, was developed by LeSage and Pace (2009). The spatial lag model, the spatial error model, and the spatial Durbin model are all written as follows:
Here,
Data Collection
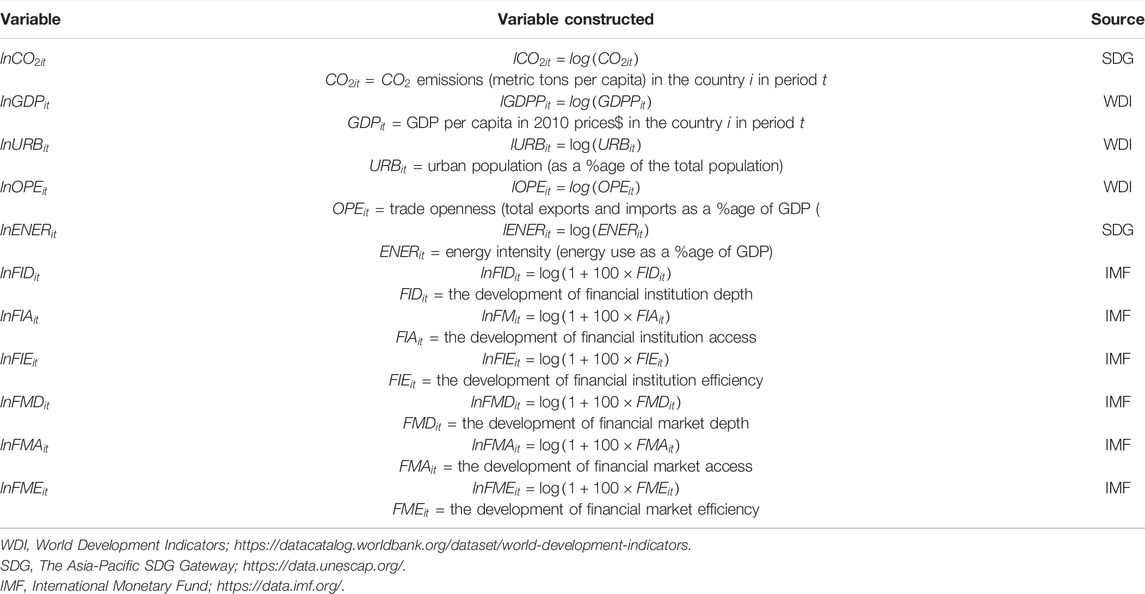
To analyze the effects of CO2 emissions and conduct an experimental analysis, data from 22 European countries are compiled from 1990 to 2020. Moran’s I is a more remarkable insight. A positive Moran’s esteem shows the spatial amassing of comparative quality in the field, while a negative worth demonstrates the spatial collection of no virtual qualities. Table 1 shows a list of the constructed variables used in the research, and the effect of CO2 emissions, spatial econometric models are utilized.
The data related to all variables are collected from three websites: 1) World Development Indicator; https://datacatalog.worldbank.org/dataset/world-development-indicators, 2) The Asia-Pacific SDG Gateway; https://data.unescap.org/, and 3) International Monetary Fund; https://data.imf.org/
Results and Discussion
The model with synchronous spatial and time-frame fixed impact is against models with time-frame fixed impact and additionally models with spatial fixed impact. The model of concurrent spatial and time span fixed impacts is picked if the invalid theory is rejected, and the subsequent model is picked if the invalid Speculation is acknowledged. Table 2 also provides access to the data’s summary statistics showing Moran’s I more remark measurements.
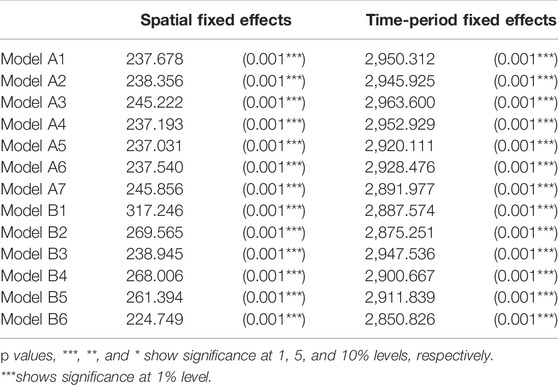
Two autonomous likelihood ratio (LR) investigations are utilized to inspect the probability of the presence of time span fixed impacts and spatial fixed impacts in the model. Table 3 shows the LR test insights for each model (3). The test outcomes show that the LR test figures are critical and that the invalid speculation is dismissed for all models. Subsequently, the model of covering spatial and time span fixed impacts is the better model for proceeding onward with the assessment technique in these situations.
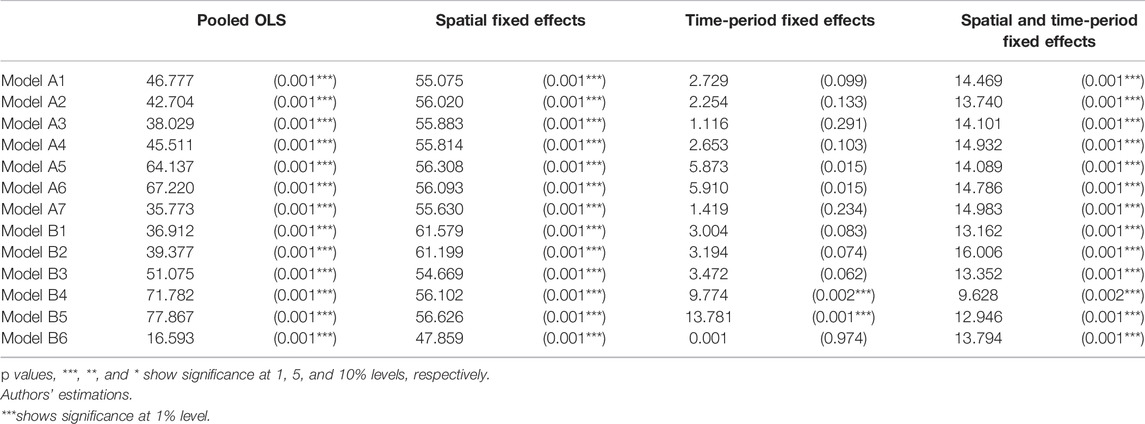
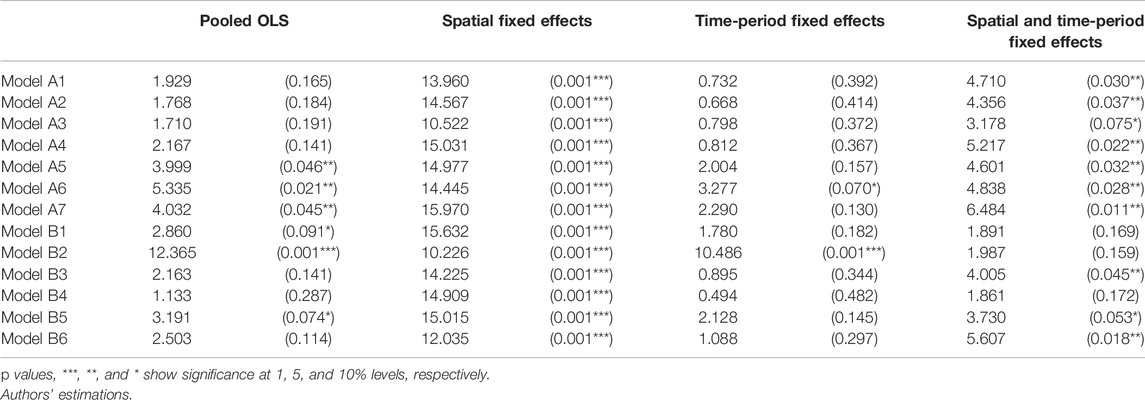
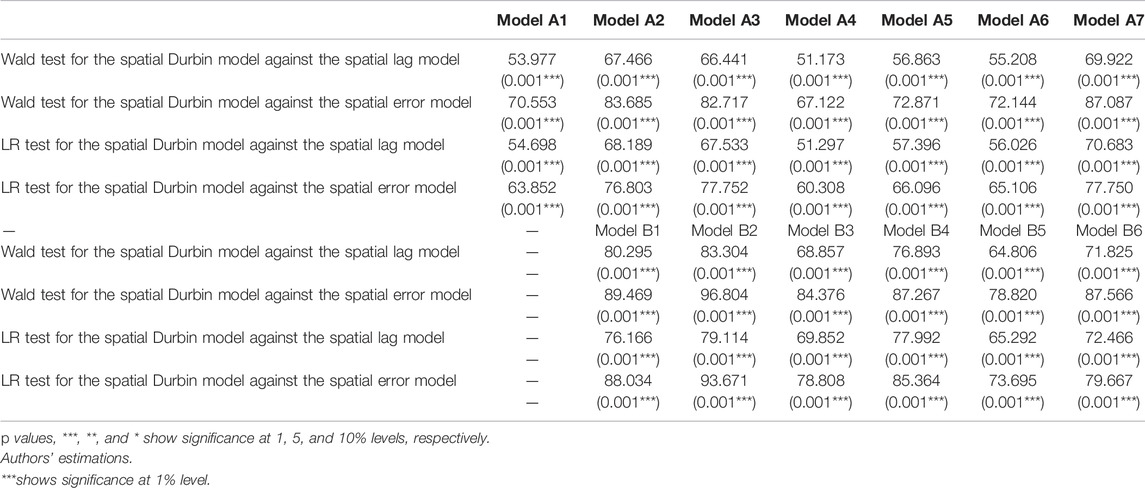
Another evaluation, seen in Tables 4, 5, looking at whether using the spatial lag or spatial error in the model with no spatial interaction effects improves the model significantly. LM experiments for a spatially lagged dependent variable and spatial error autoregressive model are used for this purpose, using the residuals of a non-spatial model. The test statistic is based on the chi-square distribution. The existence of the spatial lagged model and the spatial error model would be verified if the null hypothesis of the LM test is dismissed. We only consider the Lagrange multiplier (LM) statistics for this model since the results of the LR test verified the presence of the model with simultaneous spatial and time-period fixed effects. The test results indicate that the sum of test statistics is substantial at the 1% level in Table 3 and 5% level in Tables 4, indicating that the presence of the spatial lagged in all models and the spatial error for the majority of models is not ruled out. As a result, the inclusion of spatial interaction effects in the model highlights the importance of including such effects in laboratory experiments to explore the factors causing CO2 emission.
Table 6 shows the findings of the Hausman test, which was used to see whether the fixed effects model should be replaced with a random-effect model. In this test, the null hypothesis stresses the presence of random effects in the model. The Hausman test results reveal that the presumption of random effects in the spatial lag model is dismissed for all simulations, whereas the presence of fixed effects is verified at a 1% significance stage.
Finally, we examine two separate hypotheses
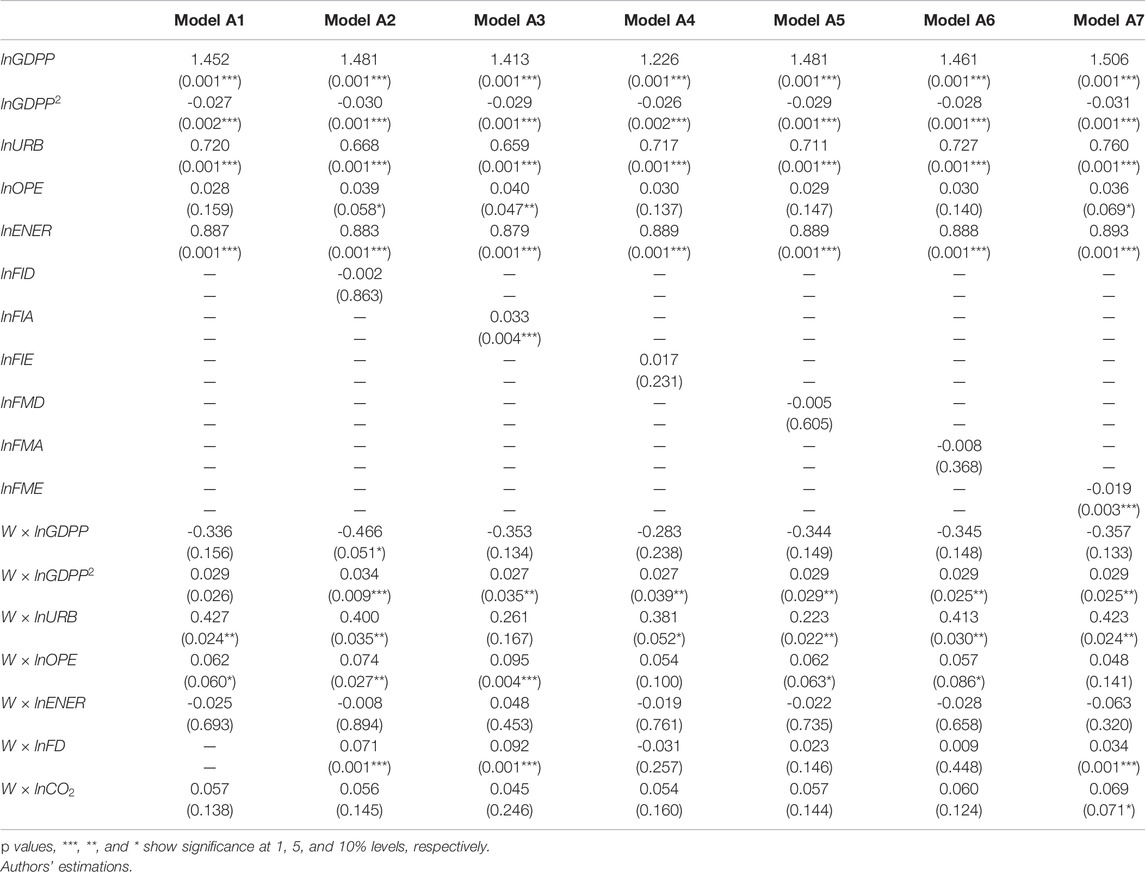
Most of the model variables had a major impact on CO2 emissions, according to the coefficients of the model variables in Table 8, and CO2 emissions increased by around 1.45% with every % growth in GDP per capita. However, the GDP per capita coefficient of the squared words is negative, illuminating the EKC hypothesis and resulting in an inverted U-shaped association between GDP growth and CO2 emissions. In addition, each percentage increase in urbanization results in a 0.7% increase in CO2 emissions. While trade openness has a positive impact on CO2 emissions, most simulations do not find this effect to be significant. The energy intensity has a favorable impact on CO2 emissions, with each percentage increase in energy intensity resulting in an increase in CO2 emissions by around 0.88%. Table 8 shows that the estimation results for the coefficients of the logarithm of financial institution access and financial market efficiency are substantially positive and negative, respectively, when considering various components of the financial growth index.
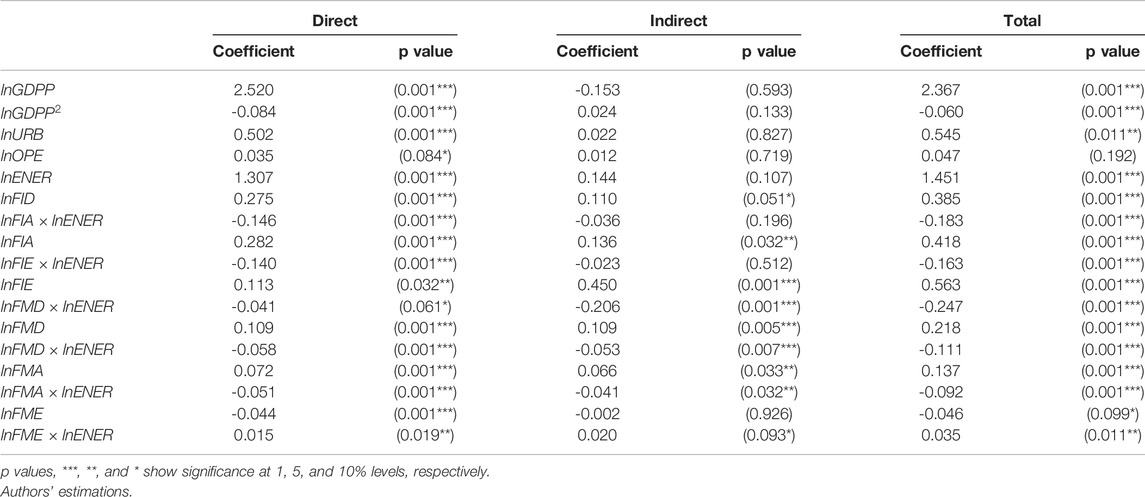
The calculation results of equation (2) are provided in Table 8 to understand the impact of financial growth spillover effects on energy production. The findings show that all aspects of financial growth have significantly important consequences. However, for financial market performance, all aspects of financial growth have a clear positive impact on CO2 emissions. The addition of the interaction word improved the estimation results significantly, indicating that not using such effects might lead to misleading results. Except for financial market performance, the indirect effects are negative, according to the findings. The spillover effects of the various components of financial growth on energy intensity are measured using Eq. 3:
Table 9 shows the direct and spatially indirect effects of all model B2 variables, as well as the variables specific to model B3 on B7’s financial growth. Specific effects measure the influence of independent variables on a special country’s dependent variable, while spatially indirect effects measure the effect of independent variables in neighboring countries on a special country’s dependent variable. The direct results are significantly different from the approximate values when Tables 8, 10 are compared. Since the primary effects involve feedback effects from crossing adjacent states and returning to the states themselves, the indirect effects include feedback effects to investigate the impact of adjacent countries’ independent variables on a country’s CO2 emissions concentrate on the spatially indirect effects.
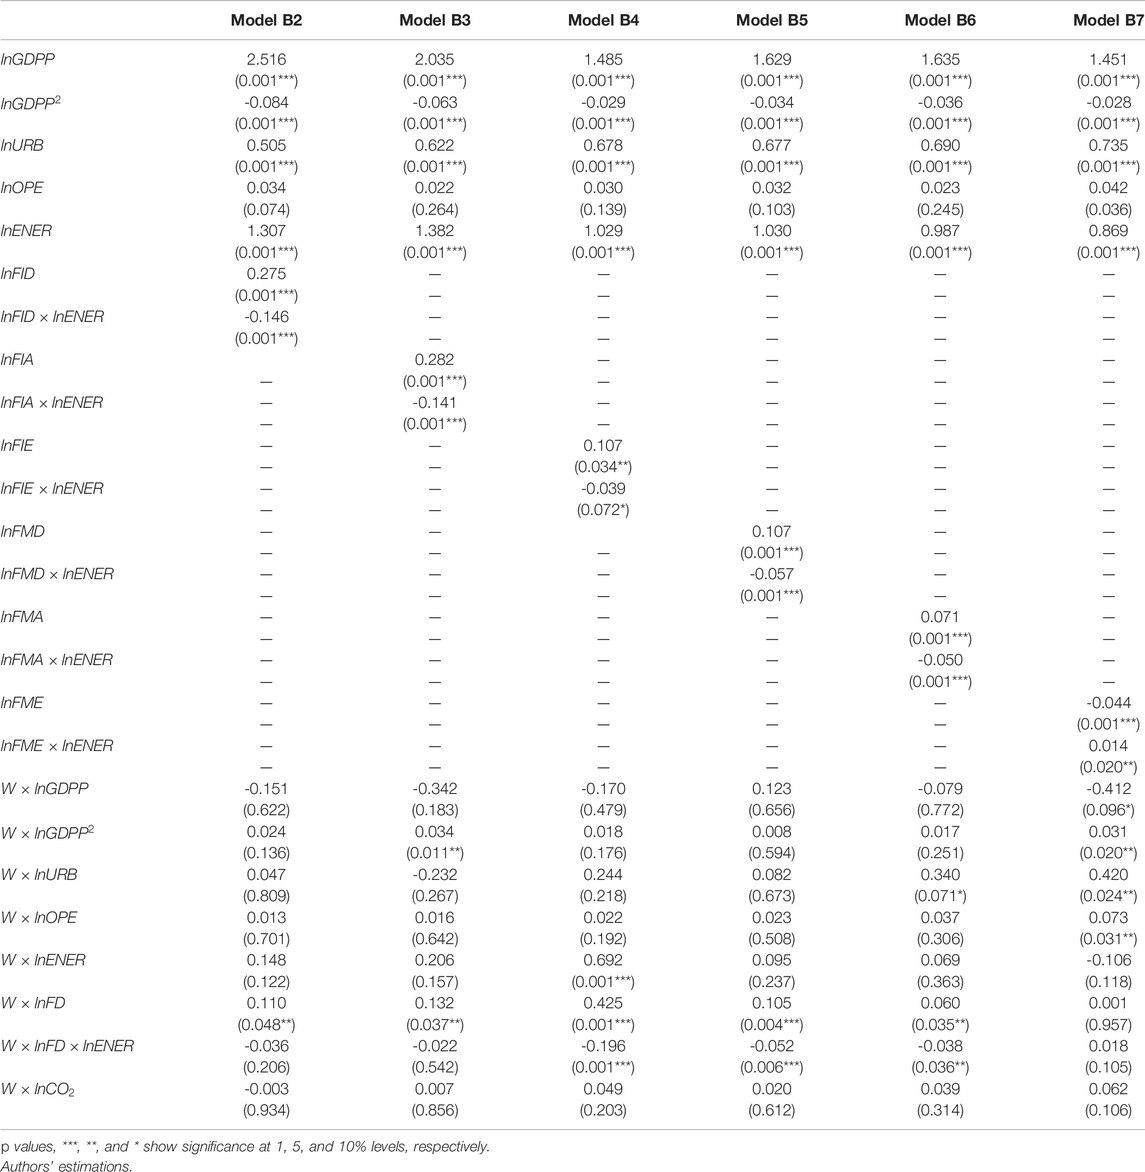
TABLE 10. Eq. 2’s estimated results.
Discussions
According to the findings, while control independent variables in neighboring countries have no major effects on CO2 emissions in other countries, the direct and spillover effects of neighboring countries’ financial growth on CO2 emissions in other countries are significant. The direct effects of financial growth in neighboring countries’ economies and organizations on a country’s CO2 emissions are positive, although spillover effects are negative. In terms of financial market performance, the effects are opposite. The sign of the coefficient is very similar to the non-spatial direct results of countries. The results of neighboring countries’ financial growth are close to the effects of a country’s own internal financial development.
Conclusion
The research is conducted with data from 22 European nations spanning the years 1990–2020; the study looked at the impact of CO2 emissions on the physical location of people and places. For reasons that are not clear, the model’s selection resulted in a biased estimation and unsatisfactory results. In the COVID-19 lockdowns, we studied the financial performance of companies and CO2 emissions in Europe. The COVID-19 pandemic wave in Europe had a significant impact on passenger transportation emissions. Trade transparency appears to have no influence on CO2 emissions, according to the study’s results. Between 1 March 2020 and 31 December 2020, emissions were decreased under the COVID-19 emergency. It will be impossible to meet the European Green Agreement emission reduction objectives unless the existing pattern of increasing private and decreasing public passenger transportation is modified. Most linear findings of financial growth are worthless, except for the logarithm coefficients of financial institution access and financial market performance, both of which are positive. In most cases, increased energy quality has a positive and considerable influence on CO2 emissions, although this has the opposite effect on energy intensity. CO2 emissions in a neighboring region are not affected by GDP growth or other control factors.
Suggestions for Future Research
Financial indicators from neighboring nations have similar impacts on CO2 emissions, which suggests major consequences. According to this claim, reducing greenhouse gas emissions would necessitate global policy convergence. A comparison might be drawn between European industrial manufacturing processes and the production of harmful gases such as SiO2 and NO2.
Data Availability Statement
The original contributions presented in the study are included in the article/Supplementary Material; further inquiries can be directed to the corresponding authors.
Author Contributions
XL: Conceptualizing, writing, drafting-Original draft. KZ: Conceptualizing, writing, drafting-Original draft. HT: Data and methodology. CL: Review and editing. YS: Review and editing.
Funding
The authors acknowledge funding from the National Social Science Fund of China (No. 20BJL049).
Conflict of Interest
The authors declare that the research was conducted in the absence of any commercial or financial relationships that could be construed as a potential conflict of interest.
Publisher’s Note
All claims expressed in this article are solely those of the authors and do not necessarily represent those of their affiliated organizations, or those of the publisher, the editors, and the reviewers. Any product that may be evaluated in this article, or claim that may be made by its manufacturer, is not guaranteed or endorsed by the publisher.
References
Abbasi, F., and Riaz, K. (2016). CO2 Emissions and Financial Development in an Emerging Economy: An Augmented VAR Approach. Energy Policy 90, 102–114. doi:10.1016/j.enpol.2015.12.017
Acheampong, A. O., Amponsah, M., and Boateng, E. (2020). Does Financial Development Mitigate Carbon Emissions? Evidence From Heterogeneous Financial Economies. Energy Econ. 88, 104768. doi:10.1016/j.eneco.2020.104768
Acheampong, A. O. (2019). Modelling for Insight: Does Financial Development Improve Environmental Quality? Energy Econ. 83, 156–179. doi:10.1016/j.eneco.2019.06.025
Adebayo, T. S., Onifade, S. T., Alola, A. A., and Muoneke, O. B. (2022a). Does it Take International Integration of Natural Resources to Ascend the Ladder of Environmental Quality in the Newly Industrialized Countries? Resour. Policy 76, 102616. doi:10.1016/j.resourpol.2022.102616
Adebayo, T. S., Abdulkareem, H., Bilal, , , Kirikkaleli, D., Shah, M. I., and Abbas, S. (2022b). CO2 Behavior Amidst the Covid-19 Pandemic in the United Kingdom: The Role of Renewable and Non-Renewable Energy Development. Renew. Energy 189.
Adebayo, T. S., Awosusi, A. A., Rjoub, H., Agyekum, E. B., and Kirikkaleli, D. (2022c). The Influence of Renewable Energy Usage on Consumption-Based Carbon Emissions in MINT Economies. Heliyon 8 (2), e08941. doi:10.1016/j.heliyon.2022.e08941
Ahmad, M., Khan, Z., Ur Rahman, Z., and Khan, S. (2018). Does Financial Development Asymmetrically Affect CO2 Emissions in China? An Application of the Nonlinear Autoregressive Distributed Lag (NARDL) Model. Carbon Manag. 9 (6), 631–644. . doi:10.1080/17583004.2018.1529998
Al-Mulali, U., Ozturk, I., and Lean, H. H. (2015). The Influence of Economic Growth, Urbanization, Trade Openness, Financial Development, and Renewable Energy on Pollution in Europe. Nat. Hazards 79 (1), 621–644. doi:10.1007/s11069-015-1865-9
Bekun, F. V., Alola, A. A., and Sarkodie, S. A. (2018). Toward a Sustainable Environment: Nexus Between CO2 Emissions, Resource Rent, Renewable and Nonrenewable Energy in 16-EU Countries. Sci. Total Environ. 657, 1023–1029. doi:10.1016/j.scitotenv.2018.12.104
Bekun, F. V., Alola, A. A., Gyamfi, B. A., and Yaw, S. S. (2021b). The Relevance of EKC Hypothesis in Energy Intensity Real-Output Trade-Off for Sustainable Environment in EU-27. Environ. Sci. Pollut. Res. 28 (37), 51137–51148. doi:10.1007/s11356-021-14251-4
Bekun, F. V., Gyamfi, B. A., Onifade, S. T., and Agboola, M. O. (2021a). Beyond the Environmental Kuznets Curve in E7 Economies: Accounting for the Combined Impacts of Institutional Quality and Renewables. J. Clean. Prod. 314, 127924. doi:10.1016/j.jclepro.2021.127924
Chakravarty, S., and Tavoni, M. (2013). Energy Poverty Alleviation and Climate Change Mitigation: Is There a Trade off? Energy Econ. 40, S67–S73. doi:10.1016/j.eneco.2013.09.022
Charfeddine, L., and Kahia, M. (2019). Impact of Renewable Energy Consumption and Financial Development on CO2 Emissions and Economic Growth in the MENA Region: A Panel Vector Autoregressive (PVAR) Analysis. Renew. Energy 139, 198–213. doi:10.1016/j.renene.2019.01.010
Ehigiamusoe, K. U., and Lean, H. H. (2019). Effects of Energy Consumption, Economic Growth, and Financial Development on Carbon Emissions: Evidence From Heterogeneous Income Groups. Environ. Sci. Pollut. Res. 26 (22), 22611–22624. . doi:10.1007/s11356-019-05309-5
Epule, E., Peng, C., Lepage, L., Chen, Z., and Nguh, B. S. (2012). The Environmental Quadrupole: Forest Area, Rainfall, CO2 Emissions and Arable Production Interactions in Cameroon. Bjecc 2 (1), 12–27. doi:10.9734/bjecc/2012/1035
Fareed, Z., Rehman, M. A., Adebayo, T. S., Wang, Y., Ahmad, M., and Shahzad, F. (2022). Financial Inclusion and the Environmental Deterioration in Eurozone: The Moderating Role of Innovation Activity. Technol. Soc. 69, 101961. doi:10.1016/j.techsoc.2022.101961
Grossman, G. M., and Krueger, A. B. (1995). Economic Growth and the Environment. Q. J. Econ. 110 (2), 353–377. doi:10.2307/2118443
Guevara, J. G., Peterlik, I., Berger, M. O., and Cotin, S. (2020). Elastic Registration Based on Compliance Analysis and Bio-Mechanical Graph Matching. Ann. Biomed. Eng.
Islam, F., Shahbaz, M., Ahmed, A. U., and Alam, M. M. (2013). Financial Development and Energy Consumption Nexus in Malaysia: A Multivariate Time Series Analysis. Econ. Model. 30, 225–441. doi:10.1016/j.econmod.2012.09.033
Jalil, A., and Feridun, M. (2011). The Impact of Growth, Energy and Financial Development on the Environment in China: A Cointegration Analysis. Energy Econ. 33 (2), 284–291. doi:10.1016/j.eneco.2010.10.003
Kayani, G. M., Ashfaq, S., and Siddique, A. (2020). Assessment of Financial Development on Environmental Effect: Implications for Sustainable Development. J. Clean. Prod. 261, 120984. doi:10.1016/j.jclepro.2020.120984
Kirikkaleli, D., Güngör, H., and Adebayo, T. S. (2021). Consumption‐Based Carbon Emissions, Renewable Energy Consumption, Financial Development and Economic Growth in Chile. Bus. Strat. Env. 31, 1123–1137. doi:10.1002/bse.2945
Le, T.-H., Le, H.-C., and Taghizadeh-Hesary, F. (2020). Does Financial Inclusion Impact CO2 Emissions? Evidence From Asia. Finance Res. Lett. 34, 101451. doi:10.1016/j.frl.2020.101451
Lee, C.-C., Chiu, Y.-B., and Sun, C.-H. (2010). The Environmental Kuznets Curve Hypothesis for Water Pollution: Do Regions Matter? Energy Policy 38 (1), 12–23. doi:10.1016/j.enpol.2009.05.004
LeSage, J., and Pace, R. (2009). Introduction to Spatial Econometrics. Boca Raton: Taylor & Francis. doi:10.1201/9781420064254
Lv, Z., and Li, S. (2021). How Financial Development Affects CO2 Emissions: A Spatial Econometric Analysis. J. Environ. Manag. 277, 111397. doi:10.1016/j.jenvman.2020.111397
Meng, B., Wang, J., Andrew, R., Xiao, H., Xue, J., and Peters, G. P. (2017). Spatial Spillover Effects in Determining China's Regional CO2 Emissions Growth: 2007–2010. Energy Econ. 63, 161–173. doi:10.1016/j.eneco.2017.02.001
Murshed, M., Rashid, S., Ulucak, R., Dagar, V., Rehman, A., Alvarado, R., et al. (2022a). Mitigating Energy Production-Based Carbon Dioxide Emissions in Argentina: The Roles of Renewable Energy and Economic Globalization. Environ. Sci. Pollut. Res., 29 16939–16958. doi:10.1007/s11356-021-16867-y
Murshed, M., Mahmood, H., Ahmad, P., Rehman, A., and Alam, M. S. (2022b). Pathways to Argentina's 2050 Carbon-Neutrality Agenda: The Roles of Renewable Energy Transition and Trade Globalization. Environ. Sci. Pollut. Res. 29, 29949–29966. doi:10.1007/s11356-021-17903-7
Orubu, C. O., and Omotor, D. G. (2011). Environmental Quality and Economic Growth: Searching for Environmental Kuznets Curves for Air and Water Pollutants in Africa. Energy Policy 39 (7), 4178–4188. doi:10.1016/j.enpol.2011.04.025
Rehman, A., Ma, H., Ahmad, M., Ozturk, I., and Işık, C. (2021b). An Asymmetrical Analysis to Explore the Dynamic Impacts of CO2 Emission to Renewable Energy, Expenditures, Foreign Direct Investment, and Trade in Pakistan. Environ. Sci. Pollut. Res. 28, 53520–53532. doi:10.1007/s11356-021-14537-7
Rehman, A., Ma, H., Ozturk, I., Murshed, M., and Dagar, V. (2021c). The Dynamic Impacts of CO2 Emissions from Different Sources on Pakistan's Economic Progress: A Roadmap to Sustainable Development. Environ. Dev. Sustain 23, 17857–17880. doi:10.1007/s10668-021-01418-9
Rehman, A., Ma, H., Ozturk, I., and Ulucak, R. (2022). Sustainable Development and Pollution: The Effects of CO2 Emission on Population Growth, Food Production, Economic Development, and Energy Consumption in Pakistan. Environ. Sci. Pollut. Res. 29, 17319–17330. doi:10.1007/s11356-021-16998-2
Rehman, A., Ma, H., Radulescu, M., Sinisi, C. I., Paunescu, L. M., Alam, M. D. S., et al. (2021d). The Energy Mix Dilemma and Environmental Sustainability: Interaction Among Greenhouse Gas Emissions, Nuclear Energy, Urban Agglomeration, and Economic Growth. Energies 14 (22), 7703. doi:10.3390/en14227703
Rehman, A., Ulucak, R., Murshed, M., Ma, H., and Işık, C. (2021a). Carbonization and Atmospheric Pollution in China: The Asymmetric Impacts of Forests, Livestock Production, and Economic Progress on CO2 Emissions. J. Environ. Manag. 294, 113059. doi:10.1016/j.jenvman.2021.113059
Sadorsky, P. (2011). Financial Development and Energy Consumption in Central and Eastern European Frontier Economies. Energy Policy 39 (2), 999–1006. doi:10.1016/j.enpol.2010.11.034
Sadorsky, P. (2010). The Impact of Financial Development on Energy Consumption in Emerging Economies. Energy Policy 38 (5), 2528–2535. doi:10.1016/j.enpol.2009.12.048
Shahbaz, M., Hye, Q. M. A., Tiwari, A. K., and Leitão, N. C. (2013a). Economic Growth, Energy Consumption, Financial Development, International Trade and CO2 Emissions in Indonesia. Renew. Sustain. Energy Rev. 25, 109–121. doi:10.1016/j.rser.2013.04.009
Shahbaz, M., Solarin, S. A., Mahmood, H., and Arouri, M. (2013b). Does Financial Development Reduce CO2 Emissions in Malaysian Economy? A Time Series Analysis. Econ. Model. 35, 145–152. doi:10.1016/j.econmod.2013.06.037
Solarin, S. A., Al-Mulali, U., Musah, I., and Ozturk, I. (2017). Investigating the Pollution Haven Hypothesis in Ghana: An Empirical Investigation. Energy 124, 706–719. doi:10.1016/j.energy.2017.02.089
Sun, Y., Duru, O. A., Razzaq, A., and Dinca, M. S. (2021). The Asymmetric Effect Eco-Innovation and Tourism Towards Carbon Neutrality Target in Turkey. J. Environ. Manag. 299 (113), 653. doi:10.1016/j.jenvman.2021.113653
Sun, Y., and Razzaq, A. (2022). Composite Fiscal Decentralisation and Green Innovation: Imperative Strategy for Institutional Reforms and Sustainable Development in OECD Countries. Sustain. Dev. 2022, 1–14. doi:10.1002/sd.2292
Tamazian, A., and Rao, B. B. (2010). Do Economic, Financial and Institutional Developments Matter for Environmental Degradation? Evidence From Transitional Economies. Energy Econ. 32 (1), 137–145. doi:10.1016/j.eneco.2009.04.004
Tamazian, A., Chousa, J. P., and Vadlamannati, K. C. (2009). Does Higher Economic and Financial Development Lead to Environmental Degradation: Evidence From BRIC Countries. Energy Policy 37 (1), 246–253. doi:10.1016/j.enpol.2008.08.025
Tang, C. F., and Tan, B. W. (2015). The Impact of Energy Consumption, Income and Foreign Direct Investment on Carbon Dioxide Emissions in Vietnam. Energy 79, 447–454. doi:10.1016/j.energy.2014.11.033
Weimin, Z., Chishti, M. Z., Rehman, A., and Ahmad, M. (2021). A Pathway Toward Future Sustainability: Assessing the Influence of Innovation Shocks on CO2 Emissions in Developing Economies. Environ. Dev. Sustain 24, 4786–4809. doi:10.1007/s10668-021-01634-3
You, W., and Lv, Z. (2018). Spillover Effects of Economic Globalization on CO2 Emissions: A Spatial Panel Approach. Energy Econ. 73, 248–257. doi:10.1016/j.eneco.2018.05.016
Yuxiang, K., and Chen, Z. (2011). Financial Development and Environmental Performance: Evidence From China. Envir. Dev. Econ. 16 (1), 93–111. doi:10.1017/s1355770x10000422
Zhao, B., and Yang, W. (2020). Does Financial Development Influence CO2 Emissions? A Chinese Province-Level Study. Energy 200, 117523. doi:10.1016/j.energy.2020.117523
Keywords: financial development, CO2 emissions, European countries, spatial econometrics, Europe
Citation: Liu X, Zhang K, Tu H, Liu C and Sun Y (2022) Dynamic Effects of CO2 Emissions on Anticipated Financial Development of European Countries. Front. Environ. Sci. 10:882847. doi: 10.3389/fenvs.2022.882847
Received: 24 February 2022; Accepted: 25 April 2022;
Published: 21 June 2022.
Edited by:
Mihaela Onofrei, Alexandru Ioan Cuza University, RomaniaReviewed by:
Abdul Rehman, Henan Agricultural University, ChinaTomiwa Sunday Adebayo, Cyprus International University, Turkey
Copyright © 2022 Liu, Zhang, Tu, Liu and Sun. This is an open-access article distributed under the terms of the Creative Commons Attribution License (CC BY). The use, distribution or reproduction in other forums is permitted, provided the original author(s) and the copyright owner(s) are credited and that the original publication in this journal is cited, in accordance with accepted academic practice. No use, distribution or reproduction is permitted which does not comply with these terms.
*Correspondence: Yunpeng Sun, dGp3YWRlM0AxMjYuY29t
 Xiaojun Liu1
 Yunpeng Sun