 Shahid Ali
 Junfeng Jiang1
- 1School of Management Science and Engineering, Nanjing University of Information Science and Technology, Nanjing, China
- 2Department of Commerce, The Islamia University of Bahawalpur, Bahawalpur, Pakistan
- 3Department of Management Science, COMSATS University Islamabad, Vehari Campus, Vehari, Pakistan
Real earning management (REM) enhances the control of managers on the financial reporting of firms. However, its influence on financial decisions in the coming years is not well documented, especially in developing countries. This study investigates the influence of three REM activities on subsequent years’ dividend payout decisions (DPDs) and annual corporate returns of firms listed on the Pakistan Stock Exchange (PSX). The study employed panel data from 2011 to 2020 of 120 large manufacturing firms to 1) measure the extent of REM activities and 2) investigate the impact on future financial decisions of dividends and reported returns. This study used multiple proxies of return for robustness. Consistent with empirical studies, the REM negatively impacts the following years’ returns. However, its effect on dividend payout policy is insignificant. This indicates that Pakistani firms are more concerned with a smooth dividend payout to investors than reporting coherent returns. The study provides significant evidence from a developing economy and has implications for investors, analysts, and policymakers.
1 Introduction
Real earning management (REM) is a widely practiced yet less documented issue in the accounting literature (Yimenu and Surur, 2019). It has a wide range of effects on firms’ financial results; nonetheless, most auditors fail to identify these activities as earning manipulation in company books. The managers can gain an undue advantage from information asymmetry by preparing the financial statements according to their interests and discretions (Zang, 2006). Despite the highly sophisticated accounting standards and the role of independent auditors, academic studies and media consistently provide empirical evidence that managers use their authority to achieve their inherent interests by manipulating the accounting numbers (Kedia and Philippon, 2009; Joshi, 2019).
REM practices focus on managing the earnings by doing actual business activities (Zang, 2012). It is done by modifying the business process or changing the timing of business contracts or deals (Graham et al., 2005). It is increasing among the managers who want to take control of their performance and bonus system (Kothari et al., 2005). Managers prefer REM instead of accrual earnings management (AEM) because it is challenging to identify REM in financial statements. Furthermore, there exists a lack of awareness among investors and analysts regarding REM activities (Rachmawati, 2019).
The capital market facilitates meeting two interested parties, namely those who have funds and those who need funds (Salehi et al., 2018). Investors need the information to assess the ability and performance of a company before making an investment decision (Sugiyanto and Candra, 2020). Incentives of managers are linked with the firm’s performance, and the managers always endure the pressure to meet the expectations set by investors and financial analysts (Oruke et al., 2021). Firms may outperform or underperform due to many economic and industry-specific factors. However, considering the demand for steady dividend payments and firm growth by investors, managers may manipulate and streamline the profit figures according to market expectations (Roychowdhury, 2006). Bansal et al. (2021) found that investors perceive the decline in REM as an element of risk; hence, they discount the share price at a higher rate. The increase in REM brings positive things because it can suppress the rate of return on shares.
A rise in REM literature advocates that it influences the return and performance of firms in the short run (Sugiyanto and Candra, 2020; Safta et al., 2021). However, empirical results on the influence of REM on long-term future returns are mixed and scarce in developing economies (Sugiyanto and Candra, 2020). Mixed results of studies (García-Meca and Sánchez-Ballesta, 2009; Zang, 2012; Suprianto and Setiawan, 2018) have raised questions on theoretical explanations of why managers perform REM activities, i.e., to increase or decrease the figures of annual returns. A possible reason behind the positive impact of REM on future returns may be the signaling effect and reduction of agency issues (Gunny, 2010), while its contrary explanation may be that managers having opportunistic motives perform the REM activities to reduce the expected returns (Cohen and Zarowin, 2010).
Dividend payout decisions (DPDs) significantly influence the stock market to convey information to stockholders. Fields et al. (2001) concluded that the DPD depends on the declared returns and the recommendations suggested by its directors. As there is a strong relationship between declared earnings and dividend payments, it is imperative to study the impact of REM on successive DPD and returns simultaneously. It will provide a better and more comprehensive understanding of the underlying nexus of REM between returns and dividend decisions of firms.
This study examines the REM activities among the large manufacturing firms of Pakistan and investigates their influence on subsequent annual corporate returns and dividend payments by taking the sample panel data from 2011 to 2020. Size, leverage, and growth rates are controlled to precisely determine the predicting power of REM on corporate returns and DPD. The model proposed by Dechow and Skinner (2000) for estimating REM activities is employed to measure the overall extent of REM in firms. Consistent with studies by Katherine Ann Gunny (2005) and Roychowdhury (2006), industry-specific coefficients are estimated and compared with firm-specific actual data to gauge the extent of REM activities. Then, to estimate the impact of REM on future returns, the REM measures are regressed against the three proxies of next year’s returns, i.e., return on assets (ROA), return on equity (ROE), and earning per share (EPS) of firms. A similar model is run by taking the dividend payout ratio of the following year as a proxy for DPD to estimate the impact of REM on it.
Results of this study reveal that the managers perform REM activities to gain their target profits; however, their activities negatively impact future corporate returns. However, their DPD is not influenced by REM activities. Investors must be aware of the impact of such manipulations on accounting figures of financial statements. The remaining of this work is organized as follows: Section 2 reviews the empirical literature on REM and presents the study’s theoretical background. In section 3, the methodology and model of the study are discussed in detail. Section 4 deals with analysis and results. Finally, section 5 concludes the study in terms of significant findings.
2 Literature Review and Hypothesis Development
2.1 Real Earning Management and Corporate Returns
The agency theory considers stewardship and the agency-principal connection to explain management’s interest in earning management. At the expense of the stewardship relationship, a company’s management puts its interests ahead of investors (Fransiska, 2021). If shareholders and auditors fail to shed light correctly, management satisfies their interests by using their light shade (Yimenu and Surur, 2019). Furthermore, management engages in REM to signal the firm’s performance to the stakeholders. The theory explains how management signals their motivation in proportion to their results (Oruke et al., 2021). By building a smooth and expanding earning string over time, management can give investors inside knowledge about their future expectations, allowing them to influence the stock price (Adhikary et al., 2021). The theory demonstrates that a firm’s profitability performance compels managers to engage in REM.
Roychowdhury (2006) developed an empirical model to measure REM and showed the existence of REM as a practice by managers to meet earnings thresholds. García-Meca and Sánchez-Ballesta (2009) examined that companies in the United Kingdom managed profits upward by accounting exploitation and implemented real operating decisions around 4 years earlier from failure. Another study by Cohen and Zarowin (2010) found that the firms are more likely to perform REM when issuing seasoned equity offerings and when the executives are audited by auditors with longer tenure or have friendly relationships. Katherine A Gunny (2010) reported that executives might use REM to reach anticipated returns to signal better future performance, and those firms that perform REM activities to attain current year expectations had higher future returns than those firms that fail to convey expectations.
The literature consistently supports the evidence that REM negatively impacts the future corporate returns of firms (Li, 2010). The swap effect of REM is exposed by Amy Zang (2012), who found that 78% of the economic managers surveyed disclosed an inclination to engage in REM to control the perceptions of financial reporting. This behavior can be interpreted by assuming that shareholders and analysts recognize the REM activities and consider them detrimental to long-term profitability. Chi et al. (2015) documented that performance and REM have a positive relationship even though this relationship weakened in family-controlled firms.
Chansarn and Chansarn (2016) discovered that dividend payouts directly impact discretionary expenses in large manufacturing firms; they stated that management compensation and auditor reputation motivate to carry out REM and harm dividend payouts and stock returns. Salehi et al. (2018) demonstrated a significant and positive relationship between earnings quality and stock returns and indicated that REM and disclosure quality are not significantly related to stock returns. Aladwan (2019) investigated the impact of board composition and firm size on REM and argued that large diversified boards are less prone to earning manipulation and small firms disclose more information to stakeholders.
Lock et al. (2019) reported that family firms practiced more REM using authority in board meetings in the Malaysian market. Weerathunga et al. (2020) demonstrated that REM does not decline following the convergence of International Financial Reporting Standards (IFRS). However, post-IFRS REM activities vary among large firms to keep pace with IFRS convergence. Oruke et al. (2021) found that family firms exercise more REM than their non-family counterparts in Bangladesh. These studies confirm that REM is higher in family firms than in non-family firms. The prevalence of REM in the manufacturing industry shows that the managers prefer it over AEM.
The studies mentioned earlier investigating REM’s impact on firms’ profitability showed that firms use REM to meet a set target of returns by manipulating the operational decisions and altering the accounting numbers; however, it impacts the firms in the successive accounting periods. According to the objectives of this study, the first hypothesis is developed as follows:
H1: REM activities negatively influence the future corporate returns of firms operating in Pakistan.
2.2 Real Earning Management and Dividend Payout Decisions
Li (2010) examined the relationship of REM with dividend policy to investigate whether the companies manipulate reported earnings through REM to maintain smooth dividend payments and dividend payout ratios. He also found that REM actions are related to stock returns. Shah et al. (2010) studied the behavior of Pakistani firms concerning manipulation of financial reporting figures and concluded that the relation of AEM is insignificant to the dividend policy of firms. A study by Dilawer (2012) conducted in Pakistan on the linkages of AEM and dividend policy reported a negative relationship between AEM and dividend policy. They maintained that AEM negatively impacts the returns and DPR in the long run, using the data spanning from 1966 to 2008.
Moghri and Galogah (2013) examined the consequences of AEM on the dividend policy of listed firms on the Tehran Stock Exchange. The results of this study reveal a positive and significant linkage between AEM and dividend policy. Such outcomes point out that with the rise in discretionary accruals of companies, their dividend ratio will move upward.
Lock et al. (2019) analyzed various scenarios of exchange rate movements and found that exchange rate movements did contribute to REM when the exchange rate weakened. However, REM does not have a significant relationship with strengthening foreign exchange rates. In addition, REM has a positive effect on annual stock returns in Malaysia. Arif et al. (2020) also reported the same results regarding the negative and significant relationship of REM with dividend policy and inferred that smaller firms pay more dividends than larger firms. Jessica (2020) found that firm characteristics such as size, value, leverage, and growth influence REM significantly.
The study also examines the impact of REM activities on future DPD. Dividend decisions are based on net earnings, and accordingly, firms with large profits tend to pay more dividends. Managers should engage in REM activities to meet investors’ dividend expectations for their incentives and promotions. Accordingly, it can be argued that there exists a potential relationship between DPD and REM activities. Hence, the second hypothesis of the study is developed as follows:
H2: REM activities positively influence the future DPD of firms operating in Pakistan.
3 Methodology
The sample for this study consists of all the 366 manufacturing firms listed in the Pakistan Stock Exchange (PSX), the central stock market of Pakistan. Out of which, 120 firms have been selected depending upon the data availability. Annual data of the sample from 2011 to 2020 are taken from the balance sheet analysis (BSA) of non-financial firms issued by the State Bank of Pakistan and their websites. Only manufacturing firms have been selected for the research because it aligns with the empirical literature (Suprianto and Setiawan, 2018). Second, financial reporting standards for the financial sector differ from those for manufacturing firms. Third, the measures of REM accurately work in the case of manufacturing firms only. For example, one of the measures of REM is the abnormal production cost. This measure is only valid in manufacturing firms instead of financial firms (Adhikary et al., 2021). Fourth, many firms have been delisted or renamed, merged, or acquired during the selected period. Therefore, the study follows the methodological approach of Tabassum et al. (2015). The selection was based on the availability of firm-level data. Moreover, the firm has not been merged, acquired, or out of business and remained listed in PSX during the selected period.
Finally, firms satisfying the aforementioned criteria and having the largest capitalization of their respective sectors were selected from PSX to constitute the sample of this study.
3.1 Measurement of Independent Variables
3.1.1 Measurement of REM
The study uses three proxies to measure REM: 1) the abnormal level of cash flows from operations, 2) the abnormal level of discretionary expenses, and 3) the abnormal level of production costs. These proxies were developed and used by Katherine Ann Gunny (2005) and Roychowdhury (2006). Li (2010) validated the efficiency and accuracy of these measures in estimating the volume of REM.
To measure the abnormal level of cash flow from operations (CFO), the following generalized least square regression is run for each industry j and year t;
where CFOit is the total cash flows from operations for the firm i and year t derived from the statement of cash flows. Assetsi,t-1 is total assets lagged by year t-1. All the values in the model are lagged by total assets to normalize the big accounting figures. Sales i,t is sales of the current year, and ∆Salesit is the change of current year t from previous year t-1. While α1,j,t, α2,j,t, and α3,j,t are estimated sets of coefficients of model for the industry j and year t. Also, εit is the residuals for the firm i and year t which is the proxy of the abnormal level of CFO in firms under study.
The abnormal cost of production is measured using the following model:
where Prodit is the total production cost of firm i for the year t. The model estimates the normal production costs for each industry j and firm i while the residuals of the model εit are the abnormal level of production costs used as a proxy in this study.
The model expresses the normal level of discretionary expenses as a linear function of sales of firm i for year t;
where DISCEXPit is the discretionary expenses of firm i for the year t. Since Eq. 3 estimates the normal level of DISCEXPit, therefore, the εit is the abnormal level of discretionary expenses taken as a proxy in the study.
The proxies of REM are abnormal CFO (named A_CFO), abnormal production costs (named A_PROD), and abnormal discretionary expenses (named A_DISCEXP) derived from Eqs 1, 2, and 3 are combined and named REM. A_CFO and A_DISCEXP are multiplied by −1, making the data uniform, and the new measure of REM is named REM1. The multiplications of A_CFO and A_DISCEXP are consistent with Amy Zang (2012). It enables to add them into aggregate measure REM1 and interpret as more the values of A_CFO and A_DISCEXP, the more it means that firm has low cash flows from operations and low discretionary expenses. A_PROD does not need to multiply with −1 as higher its value, the higher the REM activity.
Firms that are suspected to be engaged in REM to increase returns are expected to fall into one of the following criteria:
a) Low cash flows from operations;
b) Low discretionary expenses;
c) Higher production costs.
3.1.2 Measurement of Dividend Payout Decisions
This study uses the dividend payout ratio to capture the effects of DPD (Moghri and Galogah, 2013). It is measured as the dividend per share divided by earnings per firm share. This measurement is most suitable for this study as it also shows the link between dividends and earnings. Decisions of offering dividends by the board of directors when the earnings are manipulated can be logically reflected using this ratio (Bansal et al., 2021).
3.2 Measurement of Dependent and Control Variables
3.2.1 Corporate Returns and Control Variables
Empirical research to measure corporate returns has focused on financial ratios. Three accounting measures of return, namely, ROE, ROA, and EPS, are employed as the indicator for corporate returns of firms. These measurements are previously used in studies (Suprianto and Setiawan, 2018; Arif et al., 2020).
The control variables are taken to control the effects of firms’ size, leverage, and growth in the research model. Size, leverage, and growth rate are measured as the natural log of total assets, the ratio of total debt to total equity, and the sales growth rate, respectively.
3.3 Research Model
To test hypotheses H1 and H2, the following generalized least square regression models are developed:
Where:
ROAi,t+1 is a return on assets of firm i and year t+1.
ROEi,t+1 is a return on equity of firm i and year t+1.
EPSi,t+1 is earning per share of firm i and year t+1.
REM1i,t is the aggregated measure of REM made up of (-1) A_CFOi,t, A_PRODi,t, and (-1) A_DISCEXPi,t.
DPRi,t+1 is the dividend payout ratio of firm i and year t.
SIZEi,t, a control variable, is the size of firms i for the year t.
LEVi,t, a control variable, is the leverage of firm i for year t.
GROWTHi,t, a control variable, is the growth of firm i for year t.
εi,t is the residual of models not explained by selected variables.
4 Results and Discussion
4.1 Descriptive Statistics
Table 1 provides the descriptive statistics of the aggregate measure of all the model variables. The study uses 920 firm-year observations for the analysis. The mean value of REM1 is 0.0015479, which is close to zero. It is due to the methodology of its calculations. Because residuals are taken as a proxy of REM, they tend to become zero, but their positive skewness shows the existence of REM. A standard deviation of 0.121036244 indicates that companies are engaged in REM activities. The highest mean value among the return indicators is ROE, 3.0119159. It shows that companies listed in PSX have good performance in terms of ROE. It can be concluded that the first hypothesis of the impact of the negative performance of REM1 on ROE is accepted. ROA has a mean of 2.0509899 and a standard deviation of 1.2154204.
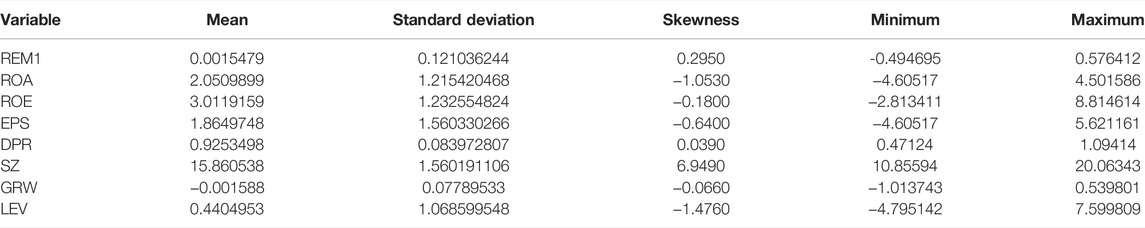
TABLE 1. Descriptive statistics.
Comparatively low standard deviation (0.083972807) of DPR signals a smooth pattern of dividend payments by the firms over time. REM and DPD show positive skewness with varying degrees. The mean value of growth, which is −0.001588, indicates that Pakistani firms are affected by COVID-19, and some firms have even faced losses during the sample period.
4.2 Pearson Correlation Analysis
All the variables are tested for correlation to find out their co-movement. Table 2 indicates that ROA is negatively correlated with REM1 with a magnitude of −0.267 and is statistically significant. Similarly, another dependent variable, ROE, is negatively correlated with REM1 with a relatively low magnitude of −0.168 and is statistically significant. EPS also exhibits similar relation and negative correlation with REM1 with the value of −0.194. These results support the study’s hypothesis that REM activities negatively impact firms’ future returns. Moreover, these results also validate the model to estimate the REM and measure of performance of firms.
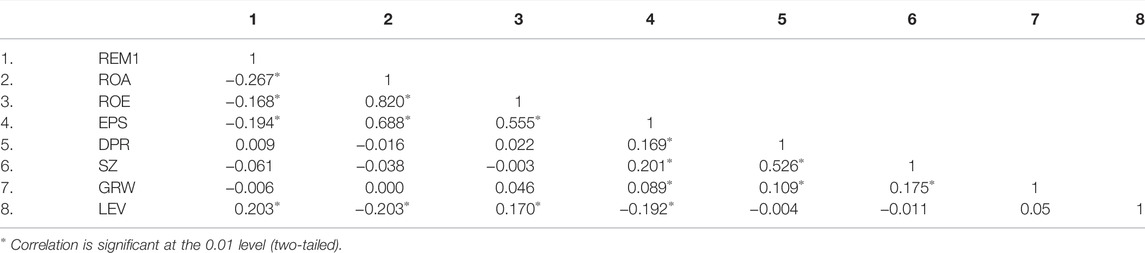
TABLE 2. Pearson correlation matrix of variables.
DPR shows a weak positive correlation with REM1, which is statistically insignificant. It can be argued that DPD has an insignificant association with REM. It rejects the second hypothesis of the study that REM influences the DPD of firms. Therefore, the correlation test supports the argument that REM is negatively correlated with performance, yet it has no impact on the DPD of firms. Firms tend to pay dividends regardless of their performance in the accounting year smoothly. One of the key findings of this table is that size and growth of firms are negatively related to REM. It supports the argument that REM activities are detrimental to the firm’s growth in the long run.
4.3 Impact of Real Earning Management on Corporate Returns
Referring to Table 3, ROA is regressed against REM1 to examine the relationship of corporate returns with REM. R square of the model is 0.436, which shows the model fit, and its p-value (0.000) shows that the impact of REM1 is statistically significant on ROA. R square shows that contribution of REM1 on ROA is 43.6%. The coefficient of REM1 is −2.611 with a t-value of −7.231, showing that REM1 is negatively associated with ROA, and their relationship is significant. These findings confirm that REM has a negative impact on next year’s ROA of firms. It has the most significant coefficient in the model, exhibiting the strength of the dependent variable on the dependent variable. Three control variables, SZ, GRW, and LEV, are added to control their effects on the returns of firms.

TABLE 3. Results of regression analysis of REM on return and dividend payout.
Managers conduct REM activities to enhance their returns for the current year. Theoretically, such actions by managers cause the inefficient use of firm resources and hence negatively impact long-term returns. Empirical analysis of this study supports this argument; three proxies of return, i.e., ROA, ROE, and EPS, are used as robustness tests to confirm results. The results carry significant policy implications for managers and investors. Managers should efficiently allocate the firms’ resources to achieve consistent long-term profits instead of manipulating assets for short-term benefits. REM activities are potentially detrimental to future earnings and performance. Investors should be aware of REM activities reported in firms’ financial statements and should make investment decisions based on more concrete performance measures like growth in operational assets instead of measuring manipulated figures of profits.
This result is consistent with the previous studies (Gunny, 2005; Zang, 2012; Jessica, 2020) that found firms perform REM to increase the reported returns temporarily; however, such actions negatively impact the actual future returns of firms. As the REM also affects the optimal allocation of resources, its negative influence on profits can be easily understood. Overall, this model accepts the first hypothesis that REM has a negative impact on future returns.
The results of regression Model 2, presented in Table 3, show that the R square is 0.370. The model is statistically significant with a p-value of 0.000, which shows that REM strongly impacts ROE. It means that firms engaged in REM experience its impact on performance sooner or later.
The coefficient of REM1 is −2.037, and its t-value is -5.435, which is statistically significant. The negative sign of REM1 coefficients indicates the nature of the impact that REM1 has on ROE. This result is consistent with the results of Model 1, which also reaffirm that REM activities negatively affect the performance of firms. ROE depicts how productively shareholders’ investment generates positive cash inflows. As discussed earlier, multiple proxies of return are used to robust the results. The relation of REM with both ROA and ROE is negative, demonstrating that firms with declining profits may be suspected of having been engaged in REM activities in the past. Overproduction to reduce costs may be more beneficial for large companies, but it is detrimental to small companies (Gunny, 2010).
Model 3 has a 0.397 R square, a coefficient of -2.013, and a p-value of 0.014, showing that the model is statistically significant, and independent variables contribute around 40% to the EPS value. It provides evidence that REM has a negative impact on the EPS of firms. This result is the same as expected because ROA and ROE negatively impact REM. Firms are much more concerned about the value of EPS due to its important place in analysts’ forecasting. Therefore, a decline in EPS will signal to analysts that the firm may have been using non-conventional methods to maintain returns in the past.
REM1 has a coefficient of −2.013 and a t-value of −4.343, indicating that the impact of REM1 is significant and negative in the model. The absolute value of REM1 shows that even a one-unit increase in REM1 will decrease the EPS of the future year by 2.013. The results are robust and confirm that REM has a negative effect on the corporate returns of firms, and it causes the firms to experience a decline in the EPS of firms. The decline in EPS of firms due to REM1 provides a general framework where firms can understand the long-term effects of earnings manipulation on future cash flows.
In summary, it can be concluded that the study’s first hypothesis has been accepted with significant results. It also provides evidence that Pakistani firms listed in PSX are engaged in REM, and earnings manipulation varies from firm to firm and industry to industry. However, these activities cause a decline in the future profitability reported returns of firms.
4.4 Impact of Real Earning Management on Dividend Policy of Firms
Hypothesis 2 states that there is a positive impact of REM on the DPD of firms. The results of Model 4 are presented in Table 3, where the R square of the model is 0.279, and it is statistically significant. It indicates that the model predicts the DPR using dependent variables. The results reveal that alpha has an extreme predicting power with a coefficient of 0.477 and a t-value of 19.50. However, the coefficient of REM1 is only 0.039, which means that REM has very little or almost zero influence on the DPD of firms. Though the results are statistically significant, they accept the null hypothesis of having no association between the DPD of firms and their REM activities. Therefore, the study’s second hypothesis that REM1 positively impacts DPD is rejected, and earnings manipulation does not affect dividend policy.
These results are not consistent with previous works (Dilawer, 2012; Ajide and Aderemi, 2014; Shahwan and Almubaydeen, 2020) concluding that DPD has a negative relationship with REM, while Moghri and Galogah (2013) and Aladwan (2019) reported that DPD has a positive relationship with REM activities. The diversity of these results implies the corporate cultural effects of firms situated in different countries. In light of the results of this study, it can be stated that Pakistani firms tend to meet the expectations of investors and analysts in the case of dividend payments despite the variation in profitability and performance. Furthermore, REM activities do not influence the dividend payments in the future. It means that firms, regardless of the decline in returns, successfully satisfy the investors by offering consistent dividend payments. The results have exciting aspects and portray the corporate culture of Pakistani manufacturing firms. Firms pay a dividend consistently, and fluctuation in the profits has a low impact on DPD.
5 Conclusion
This study examines the relation of REM with future corporate returns and DPD. It is concluded that firms are engaged in REM activities and use more than one method to manipulate the figures of profits to meet the earning target. Firms that are suspicious regarding REM have subsequent low cash flows from operations (A_CFO), high production costs (A_PROD), and low discretionary expenses (A_DISCEXP). Similar to previous studies (Zang, 2012; Salehi et al., 2018; Adhikary et al., 2021) on this topic, it is found that REM1 negatively impacts the future corporate returns of firms. This finding supports the notion that firms which engage in REM witness a decline in future profits. This decline can be explained by REM activities limiting the optimal use of resources in research and development, advertisement, and the purchase of new technology. Firms adopt REM as a tool to temporarily report good profit figures at the cost of low profit in the long term (Arif et al., 2020).
The study has some limitations. First, the sample contains only 120 firms, which can be expanded further in future studies. Second, the study was focused on the Pakistani manufacturing sector, while a comparative study of multiple countries will produce more comprehensive results. Future studies may use qualitative approaches to measure the extent of REM and non-accounting measures of returns to validate the results. The study has implications such as investors need to consider the increase in discretionary expenses over time as a signal of poor reporting. Policymakers may make it mandatory for firms to report the abnormal changes in the sale and purchase of long-term assets during the last quarter of the accounting year. For analysts, non-accounting performance measures should also be incorporated to anticipate the firm’s profits because REM may affect the accuracy of earning figures.
Data Availability Statement
The original contributions presented in the study are included in the article/Supplementary Material, further inquiries can be directed to the corresponding author.
Author Contributions
SA: writing—initial draft, writing—analysis, visualization, and validation. JJ: review, editing, and supervision. GM: writing literature review, editing, and methodology. MK: visualization, writing literature review, and editing.
Funding
This research is funded by the National Natural Science Foundation of China (71972153).
Conflict of Interest
The authors declare that the research was conducted in the absence of any commercial or financial relationships that could be construed as a potential conflict of interest.
Publisher’s Note
All claims expressed in this article are solely those of the authors and do not necessarily represent those of their affiliated organizations, or those of the publisher, the editors, and the reviewers. Any product that may be evaluated in this article, or claim that may be made by its manufacturer, is not guaranteed or endorsed by the publisher.
References
Adhikary, B. K., Mitra, R. K., and Meah, M. R. (2021). Do manufacturing Firms in Bangladesh Engage in Earnings Management to Avoid Losses? Further Evidence Using the Governance Elements as Monitors. J. Financial Report. Account.
Ajide, F. M., and Aderemi, A. A. (2014). The Effects of Earnings Management on Dividend Policy in Nigeria: An Empirical Note. SIJ Trans. Industrial, Financial Bus. Manag. (IFBM) 2 (3), 145–152.
Aladwan, M. (2019). Accrual Based and Real Earning Management Association with Dividends Policy “The Case of Jordan”. Italian J. Pure Appl. Math. 41, 691–707.
Arif, M. L. S., Alim, M. N., and Yuliana, R. (2020). Effect the Real Earnings Management on the Earning Quality (Study on Companies Registered in Islamic Capital Market (DES) and Non DES in Indonesia Stock Exchange, 2008–2012). Paper presented at the International Colloquium Forensics Accounting and Governance (ICFAG).
Bansal, M., Ali, A., and Choudhary, B. (2021). Real Earnings Management and Stock Returns: Moderating Role of Cross-Sectional Effects. Asian J. Account. Res. doi:10.1108/ajar-11-2020-0107
Chansarn, S., and Chansarn, T. (2016). Earnings Management and Dividend Policy of Small and Medium Enterprises in Thailand1. Int. J. Bus. Soc. 17 (2).
Chi, C. W., Hung, K., Cheng, H. W., and Tien Lieu, P. (2015). Family Firms and Earnings Management in Taiwan: Influence of Corporate Governance. Int. Rev. Econ. Finance 36, 88–98. doi:10.1016/j.iref.2014.11.009
Cohen, D. A., and Zarowin, P. (2010). Accrual-based and Real Earnings Management Activities Around Seasoned Equity Offerings. J. Account. Econ. 50 (1), 2–19. doi:10.1016/j.jacceco.2010.01.002
Dechow, P. M., and Skinner, D. J. (2000). Earnings Management: Reconciling the Views of Accounting Academics, Practitioners, and Regulators. Account. horizons 14 (2), 235–250. doi:10.2308/acch.2000.14.2.235
Dilawer, T. (2012). Earning Management and Dividend Policy: Evidence from Pakistani Textile Industry. Int. J. Acad. Res. Bus. Soc. Sci. 2 (10), 362.
Farichah, F. (2017). Management Compensation and Auditor Reputation on Earnings Management and on Share Returns. Comp. Study Consumer Prot. Indonesia through Mech. Prod. Liabil. Insur. 20 (3A), 196–208. doi:10.35808/ersj/704
Fields, T. D., Lys, T. Z., and Vincent, L. (2001). Empirical Research on Accounting Choice. J. Account. Econ. 31 (1-3), 255–307. doi:10.1016/s0165-4101(01)00028-3
Fransiska, S. (2021). Comparison of Earnings Management in Each Non-financial Sector of Bumn Listed on the Idx. Jaef 2 (2), 133–152. doi:10.37715/jaef.v2i2.1832
García‐Meca, E., and Sánchez‐Ballesta, J. P. (2009). Corporate Governance and Earnings Management: A Meta‐analysis. Corp. Gov. Int. Rev. 17 (5), 594–610.
Graham, J. R., Harvey, C. R., and Rajgopal, S. (2005). The Economic Implications of Corporate Financial Reporting. J. Account. Econ. 40 (1-3), 3–73. doi:10.1016/j.jacceco.2005.01.002
Gunny, K. A. (2010). The Relation between Earnings Management Using Real Activities Manipulation and Future Performance: Evidence from Meeting Earnings Benchmarks*. Contemp. Account. Res. 27 (3), 855–888. doi:10.1111/j.1911-3846.2010.01029.x
Gunny, K. A. (2005). What Are the Consequences of Real Earnings Management? Berkeley: University of California.
Jessica, V. (2020). The Effect of Firm Characteristics and Good Corporate Governance Characteristics to Earning Management Behaviors. J. Account. Finance Auditing Stud. 6 (2), 31–49.
Joshi, R. (2019). Evaluating the Effect of Earnings Management on Dividend Policy of Selected Indian Companies. Res. Rev. Int. J. Multidisiplinary 4 (1), 482–485.
Kedia, S., and Philippon, T. (2009). The Economics of Fraudulent Accounting. Rev. Financ. Stud. 22 (6), 2169–2199. doi:10.1093/rfs/hhm016
Kothari, S. P., Leone, A. J., and Wasley, C. E. (2005). Performance Matched Discretionary Accrual Measures. J. Account. Econ. 39 (1), 163–197. doi:10.1016/j.jacceco.2004.11.002
Lock, B. Q., Chu, E. Y., Song, S. I., and Lee, L. Y. (2019). Exchange Rate Movements, Earnings Management and Stock Returns in Malaysia. Cap. Mark. Rev. 27 (1), 53–68.
Moghri, A. E., and Galogah, S. S. (2013). Effect of Earnings Management on Dividend Policy: Evidence from Tehran Stock Exchange. World Sci. J. 1 (14), 58–65.
Oruke, M., Iraya, C. M., Omoro, N. O., and Otieno, L. O. (2021). Earnings Management: A Critical Literature Review.
Rachmawati, S. (2019). Company Size Moderates the Effect of Real Earning Management and Accrual Earning Management on Value Relevance. Ethics J. Econ. 18 (1), 133–142. doi:10.15408/etk.v18i1.9381
Roychowdhury, S. (2006). Earnings Management through Real Activities Manipulation. J. Account. Econ. 42 (3), 335–370. doi:10.1016/j.jacceco.2006.01.002
Safta, I. L., Sabău, A.-I., and Muntean, N. (2021). Bibliometric Analysis of the Literature on Measuring Techniques for Manipulating Financial Statements. Risks 9 (7), 123. doi:10.3390/risks9070123
Salehi, M., Tagribi, M., and Farhangdoust, S. (2018). The Effect of Reporting Quality on Stock Returns of Listed Companies on the Tehran Stock Exchange. Int. J. Prod. Perform. Manag. doi:10.1108/ijppm-09-2015-0127
Shah, S. Z., Yuan, H., and Zafar, N. (2010). Earnings Management and Dividend Policy: An Empirical Comparison between Pakistani Listed Companies and Chinese Listed Companies. Int. Res. J. Finance Econ. 35 (1), 51–60.
Shahwan, Y., and Almubaydeen, T. H. (2020). Effects of Board Size, Board Composition and Dividend Policy on Real Earnings Management in the Jordanian Listed Industrial Firms. Ijfr 11 (4), 195–202. doi:10.5430/ijfr.v11n4p195
Sugiyanto, S., and Candra, A. (2020). Moderating Good Corporate Governance Effect Sales Growth, Conservatisme Accounting and Liquidity Risk Terhadap Agresivitas Pajak (Studi Pada Perusahaan Manufaktur Dan Jasa Keuangan Terdaftar Bei). Paper presented at the Proseding Seminar Nasional Akuntansi.
Suprianto, E., and Setiawan, D. (2018). Impact of Family Control on the Relationship between Earning Management and Future Performance in Indonesia. Bus. Econ. Horizons (BEH) 14 (1232-2019-757), 342–354. doi:10.15208/beh.2018.25
Tabassum, N., Kaleem, A., and Nazir, M. S. (2015). Real Earnings Management and Future Performance. Glob. Bus. Rev. 16 (1), 21–34. doi:10.1177/0972150914553505
Weerathunga, P. R., Xiaofang, C., and Sameera, T. K. G. (2020). Heterogeneity in Earning Management of Listed Companies Following International Financial Reporting Standards Convergence: a Developing Country Experiences. Ijefi 10 (1), 101–108. doi:10.32479/ijefi.8872
Yimenu, K. A., and Surur, S. A. (2019). Earning Management: From Agency and Signalling Theory Perspective in Ethiopia. Jemt 24 (6), 1–12. doi:10.9734/jemt/2019/v24i630181
Zang, A. (2006). Evidences on the Trade of between Real Manipulation and Accrual Manipulation. Work. Univerrsit Rochester.
Keywords: real earning management, corporate returns, dividend payout decisions, developing economy, Pakistan
Citation: Ali S, Jiang J, Murtaza G and Khan M (2022) Influence of Real Earning Management on Subsequent Dividend Payout Decisions and Corporate Returns: A Case of Developing Economy. Front. Environ. Sci. 10:882809. doi: 10.3389/fenvs.2022.882809
Received: 19 March 2022; Accepted: 15 April 2022;
Published: 20 May 2022.
Edited by:
Kangyin Dong, University of International Business and Economics, ChinaReviewed by:
Amir Ikram, University of Engineering and Technology, PakistanSyed Far Abid Hossain, International University of Business Agriculture and Technology, Bangladesh
Copyright © 2022 Ali, Jiang, Murtaza and Khan. This is an open-access article distributed under the terms of the Creative Commons Attribution License (CC BY). The use, distribution or reproduction in other forums is permitted, provided the original author(s) and the copyright owner(s) are credited and that the original publication in this journal is cited, in accordance with accepted academic practice. No use, distribution or reproduction is permitted which does not comply with these terms.
*Correspondence: Shahid Ali, c2hhaGlkYWxpMjRAaG90bWFpbC5jb20=