- 1Shanghai Typhoon Institute, Shanghai Meteorological Service, Shanghai, China
- 2Shanghai Key Laboratory of Meteorology and Health, Shanghai Meteorological Service, Shanghai, China
- 3Department of Atmospheric and Oceanic Sciences and Institute of Atmospheric Sciences, Fudan University, Shanghai, China
- 4Big Data Institute for Carbon Emission and Environmental Pollution, Fudan University, Shanghai, China
Air pollution has become one of the most challenging problems in China, especially in economically developed and densely populated regions such as Shanghai. In this study, the long short-term memory (LSTM) model is introduced for the application in extended-range forecasting of PM2.5 in Shanghai by incorporating three members of the Subseasonal-to-Seasonal Prediction project (S2S) forecasting, moderate-resolution imaging spectroradiometer (MODIS) aerosol optical depth (AOD) data, and large-scale circulation factors derived from ERA-5 reanalysis. Therefore, an accurate ∼40-day PM2.5 prediction model over Shanghai was developed, providing new insights for air pollution extended-range forecasting. The new model not only exhibited much better accuracy but also captured the pollution process more closely than traditional methods, such as multiple regression (MLR). The prediction root-mean-square errors (RMSEs) based on the China Meteorological Administration (CMA), the U.K. model, and the European Centre for Medium-Range Weather Forecasts (ECMWF) were 24.84, 24.35, and 22.27 μg m−3, respectively, and their Heidke Skill Scores (HSSs) were between 0.1 and 0.5. As a result, the S2S-LSTM model for extension period pollution prediction with higher accuracy developed in this study could further burst the hot spots of pollution extended-range prediction research. However, limitations of the prediction model are still in existence, especially in dealing with only a single site instead of a two-dimensional prediction, which requires further investigation in future studies.
1 Introduction
Air pollution caused by PM2.5 has already been regarded as an important threat to human health; therefore, there is an urgent need for practical preventative measures to be adopted. Over the years, a large body of research has elucidated the composition and diffusion characteristics of air pollutants, including PM2.5 (WHO, 2003; WHO, 2016; Xing et al., 2016), and reported that they could lead to various diseases, including respiratory diseases and heart diseases. Therefore, accurate air quality prediction is crucial for preventing medical accidents caused by air pollution and controlling the atmospheric environment comprehensively and effectively. The time scale of the extended range is a current issue, leading to difficulties in pollution prediction.
For PM2.5 operational forecasting, in terms of period validity, there is a lack of an extended-range prediction method between short- and medium-term numerical forecasting and statistical models that perform monthly to seasonal forecasting. Extended-range prediction is a 10- to 30-day scale forecast that bridges the “time gap” between weather forecasts and climate predictions, which is both a technical difficulty and a key to the preparation for joint pollution control. The occurrence and evolution of air pollution are complex and nonlinear, with the collective effect of pollution emission sources and multiple atmospheric factors. There are two main types of methods for air pollution prediction research: deterministic (Baklanov et al., 2008; Kim et al., 2010; Woody et al., 2016) and statistical (Di Carlo et al., 2007; Castellano et al., 2009; De Gennaro et al., 2013; Donnelly et al., 2015). In deterministic methods, the formation and diffusion processes of pollutants are modeled using theoretical metalogical emissions and chemical models. Due to the use of ideal theory in model structure determination and empirical parameter estimation, deterministic methods are not sufficient to explain the nonlinearity and heterogeneity of many factors related to the formation of pollutants. In addition, limited by the number of computing resources and the physical mechanisms of pollutant formation and weather evolution are described in the model, it is difficult to continue to extend period validity while maintaining numerical stability. Compared with deterministic methods, statistical methods can avoid the complexity of modeling and have good performance by using data-driven statistical modeling techniques, but linear equations in traditional statistical models are not sufficient to describe complex nonlinear processes. Therefore, there is an urgent need to develop new PM2.5 concentration prediction methods that include the nonlinear relationship between PM2.5 concentration and its impact factors but do not exhaust too many computing resources and establish a quantitative extended-range prediction model of PM2.5.
Organized by the World Meteorological Organization, the World Weather Research Program, and the World Climate Research Program jointly launched the Subseasonal-to-Seasonal Prediction Project (S2S) (Vitart et al., 2017), which provides sub-seasonal prediction datasets (up to 60 days). Currently, 11 operational centers provide the outputs of their prediction models, including the China Meteorological Administration (CMA), the U.S. National Center of Environmental Prediction (NCEP), the European Centre for Medium-Range Weather Forecasts (ECMWF), and centers in Australia, Canada, France, Italy, Japan, Korea, Russia, and the United Kingdom. The S2S model database has provided a great data foundation for evaluating the prediction performance of extreme events (such as heavy pollution) and, more importantly, deterministic prediction results. Therefore, the S2S prediction field can be used as an impact factor in constructing the nonlinear PM2.5 concentration model.
In recent years, with the development of artificial intelligence, deep learning has emerged (Gao et al., 2018). The concept of deep learning was first proposed by Hinton et al. (2006), which refers to the learning process of obtaining a multilevel deep network structure using certain training methods based on sample data. The long short-term memory (LSTM) network was developed on the basis of recurrent neural networks (RNNs). By introducing “memory units,” the LSTM network solved the vanishing or exploding gradient problem that occurred when the RNN processed long-term series data, making it more suitable for solving long-time series forecasting problems. The LSTM network has been widely used for air pollution forecasting. Seng et al. (2021) utilized the LSTM network to forecast air quality in Beijing, which achieved better results than other line-based models. Qin et al. (2019) proposed a new method for urban PM2.5 concentration prediction based on a convolutional neural network (CNN) and LSTM network, which utilizes the CNN to extract spatial features of inputs between monitoring stations, and the LSTM network to predict future air pollution concentration based on the learning of features in the historical air pollution concentration time series data. Qi et al. (2019) proposed a hybrid PM2.5 spatiotemporal prediction model based on graph convolutional neural networks and the LSTM network, which uses graph convolutional networks (GCNs) to extract the spatial correlation between different stations, the and LSTM network to capture the temporal correlation between observations at different times. Zhou et al. (2019) proposed a deep learning multi-output LSTM (DM-LSTM) neural network model that incorporates three deep learning algorithms (mini-batch gradient descent, dropout neurons, and L2 regularization), which can be used to extract key factors of complex spatial–temporal relationships. Wen et al. (2019) adopted a new spatiotemporal convolutional long short-term neural network for air pollution prediction, extracted high-level spatiotemporal features through a combination of CNN and long short-term memory neural networks (LSTM-NN), and integrated meteorological data and aerosol data to improve model prediction performance. Wang and Song (2018) proposed a deep spatiotemporal ensemble model for air quality prediction, which used a weather pattern partitioning strategy, generated spatial data as relative stations and relative area by analyzing causalities among stations to discover spatial correlations, and used a predictor based on deep LSTM network to learn both long-term and short-term dependencies of air quality. The aforementioned models captured the spatial–temporal correlations of air pollution concentration data well, and they can all fulfill short-term air quality forecasts. However, none of these studies involved extended-range pollution prediction. Until now, there has been no objective pollution prediction method based on S2S. The extended range is a key period for the government to formulate emission abatement plans in advance and optimize production capacity; therefore, there is an urgent need for an accurate and objective extended-range pollution prediction.
In this study, first, synthetic analysis and regression analysis were used to select and define the local and large-scale circulation factors that impact the change in PM2.5 concentration in Shanghai. Then, multiple sets of experiments were designed based on the LSTM method to carry out a 20-day PM2.5 concentration forecast in Shanghai, and the optimal experimental design was selected. Finally, the S2S meteorological forecast, MODIS AOD data, and previous large-scale circulation were integrated as input fields to establish and evaluate the extended-range prediction model of PM2.5 concentration in Shanghai.
2 Data and Methods
2.1 Data Sources
2.1.1 PM2.5 Concentration Data
The daily average PM2.5 historical concentration with a resolution of 0.5° was obtained from historical data reconstructed based on the evaluation of MERRA-2 (https://search.earthdata.nasa.gov/) combined with meteorological information. In this study, the time period of the modeling and evaluation data was January 1, 1996 to December 31, 2019. The grid point (121.5°E, 31.5°N) represents the value of Shanghai. The PM2.5 concentration data were obtained from the national urban air quality real-time publication platform (http://113.108.142.147:20035/emcpublish/), and the data between January 1, 2014 and December 31, 2019 were used.
2.1.2 Meteorological Data
Reanalysis data of the three models (CMA, U.K. model, and ECMWF) with a resolution of 1.5° were collected from the S2S database (http://apps.ecmwf.int/datasets/data/s2s). A basic description of these models is provided in Table 1. In this study, the common reanalysis period was 1996–2019, with an emphasis on the winter season (November to February, or NDJF) for evaluation related to pollution. The grid point (121.5°E, 31.5°N) represents the value of Shanghai. In addition, CMA and U.K. models are run daily, while the ECMWF model generates predictions twice a week (on Mondays and Thursdays). Atmospheric circulation data were sourced from ERA-5.
2.1.3 MODIS AOD Data
Satellite-derived AOD indicates the air pollution of the whole layer and is highly indicative of ground-level PM2.5 concentrations (Shen et al., 2018). In this study, MODIS global aerosol data (MOD04L2) are used (https://ladsweb.modaps.eosdis.nasa.gov/search.html), which is the most commonly used remote sensing aerosol optical thickness data set. It uses the improved dark pixel algorithm to obtain 550 nm AOD data with a spatial resolution of 10 km. This study extracts the daily AOD data of Shanghai and its surrounding areas from 2001 to 2019, AOD is considered a parameter related to pollution emission sources in the model.
2.2 Modeling Method
2.2.1 LSTM Model
The LSTM model is an improved recurrent neural network that was proposed by Hochreiter and Schmidhuber (1997) and recently improved and promoted by Alex Graves. The core concepts of the LSTM model are the cell state and the “gate” structure. The cell state is equivalent to the path of information transmission, which allows information to be passed on in the sequence. Theoretically, the cell state will always be able to pass on the relevant information during sequence processing. Thus, even information from earlier time steps can be carried to cells in later time steps, overcoming the impact of short-term memory. The addition and removal of information are achieved through “gate” structures that learn which information to save or forget during the training process. The LSTM model has three types of gate structures: forget gate, input gate, and output gate; its structure is shown in Figure 1. For a detailed introduction, see Olah (2015).
2.2.2 Multiple Regression
In this study, there was a significant linear correlation between the random variable Y, which was the PM2.5, and the fixed variables
where
2.3 Impact Factor Analysis of PM2.5 Concentration
2.3.1 Local Impact Factors
In order to study the local factors affecting PM2.5 concentration, synthetic analysis was conducted on meteorological and environmental factors before and after the rapid increase and decrease in PM2.5 concentration in Shanghai. A rapid increase (decrease) is defined as an average daily increase (decrease) in the PM2.5 concentration in Shanghai by more than 1.5 times the standard deviation. Thus, from 2014 to 2019 (2014 refers to the winter of 2014/2015, similarly for the following years), there were 41 rapid increases and 45 rapid decreases. The changes in meteorological elements at the Shanghai Baoshan Station before and after the rapid increase and decrease are shown in Figure 2.
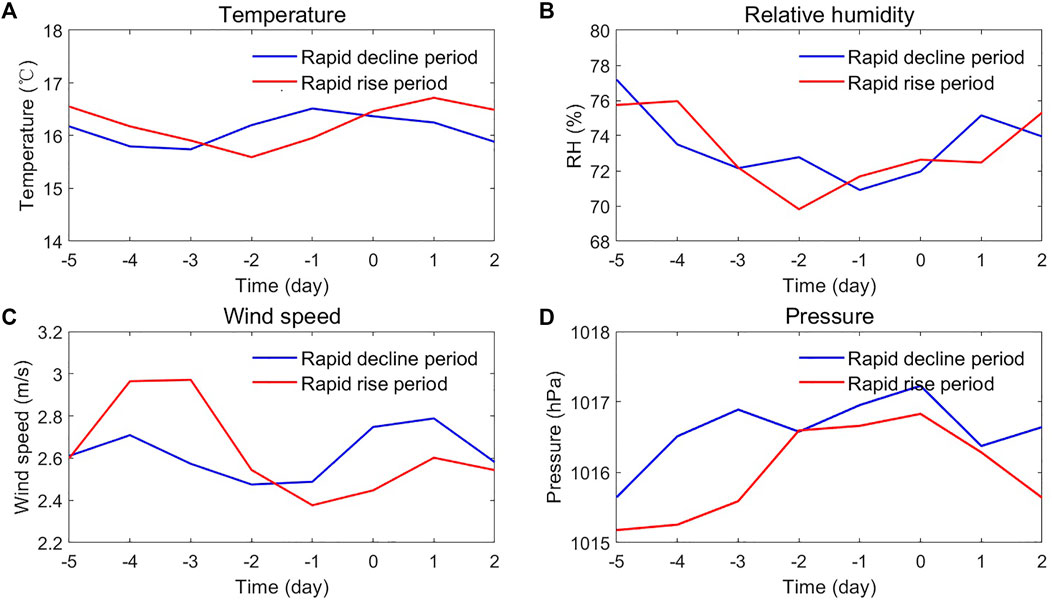
FIGURE 2. Changes of factors in the atmospheric environment before and after the rapid increases and decreases in PM2.5 concentration: (A) temperature, (B) relative humidity, (C) wind speed, and (D) atmospheric pressure. (Note: The positive (negative) time indicates the change in environmental meteorological elements occurring before (after) the change in PM2.5.)
During a rapid increase, the temperature first decreased and then increased, with the largest drop occurring from 4 to 2 days before and the lowest temperature occurring 2 days before the rapid increase. The same was true for relative humidity. The wind speed at 10 m above ground also dropped at first and then rose, with the highest wind speed occurring from 4 to 3 days before, the largest drop occurring from 3 to 1 day before, and the lowest wind speed occurring 1 day before the rapid increase. From 1 day before to 1 day after the rapid increase, the wind speed increased slowly, and then from 1 to 2 days after, it decreased slowly. The atmospheric pressure also exhibited a trend of first increasing and then decreasing, with the largest increase occurring from 3 to 2 days before the rapid increase. From 2 days before to the day of the rapid increase, the atmospheric pressure increased slowly, reaching the highest on the day, and then dropped rapidly. It can be concluded from the temperature and wind speed trends that before the rapid increase, a cold front passed through Shanghai, and as the atmospheric pressure was the highest on the day, a rapid increase occurred after the passage of the cold front.
During a rapid decrease, environmental factors differed greatly from those during a rapid increase. The temperature increased and then decreased, with the largest increase occurring from 3 to 1 days before and the highest temperature occurring 1 day before. Relative humidity decreased and then increased, with the lowest occurring 1 day before. The change in wind speed was smaller than that during a rapid increase, with the largest increase occurring from 1 day before to the day, and the highest wind speed occurring 1 day after, and then the wind speed started to fall. The change in atmospheric pressure was also smaller than that during the rapid increase, and the atmospheric pressure was always higher. A large increase occurred from 2 days before to the day, and the atmospheric pressure was the highest on the day. The wind speed increases from 1 day before to the day of the rapid decrease, and combined with the decreasing trend of temperature, indicated that the rapid decreasing process was impacted by the high surface pressure system, and a cold front passed from 1 day before to 1 day after the process.
It can be seen from the aforementioned analysis that local temperature, wind speed, atmospheric pressure, and relative humidity are the main impact factors of the rapid changes in PM2.5 concentration.
2.3.2 Large-Scale Circulation Impact Factors
In order to analyze the large-scale circulation characteristics and key areas that impact the change in PM2.5 concentration in Shanghai, a lead/concurrent regression analysis of PM2.5 on geopotential height and temperature fields was conducted. To ensure period validity, this study analyzed the environmental factor regression before PM2.5 concentration changes.
The results of the lead regression analysis of PM2.5 concentration on the geopotential height field at 500 hPa (as shown in Figure 3) showed that the 10 days before 500 hPa geopotential height regression field had a “positive, negative, positive, negative” distribution pattern in Eurasia, with its centers of positive anomalies located in the Mediterranean and Siberian regions, and the centers of negative anomalies located in the Ural Mountains and the North Pacific regions. The negative anomaly centers passed the significance test, and this distribution corresponded to zonal circulation.
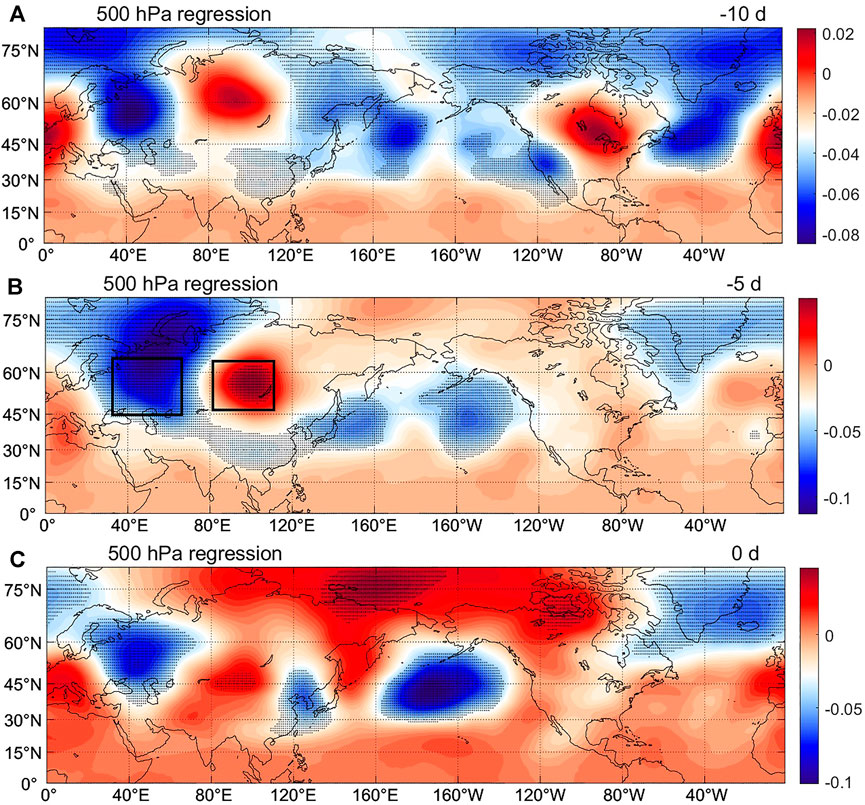
FIGURE 3. Lead regression analysis of PM2.5 concentration on the 500 hPa geopotential height field (A) ten days before, (B) five days before, and (C) day of.
Five days before, the locations of the positive and negative anomaly centers remained the same, but the range of the anomaly centers in the Ural Mountains and Lake Baikal regions increased, and the anomaly centers in both locations passed the significance test. At the same time, the intensity and range of the positive anomaly center in Siberia and the negative anomaly center in the Ural Mountains decreased, while the intensity and range of the negative anomaly center (the Aleutian Low) in the North Pacific increased. A negative anomaly center appeared in East China, indicating that Shanghai was experiencing the impact of a trough. From the aforementioned analysis, it can be seen that the signal of the 500 hPa high-altitude field was the strongest 5 days before the change in PM2.5 concentration in Shanghai, and this signal had good predictive significance for the change in PM2.5 concentration in Shanghai. Therefore, (47°–67°N, 30°–65°E) and (47°–63°N, 85°–110°E) were selected as the key areas of the 500 hPa geopotential height field.
Figure 4 shows the regression on the 850 hPa temperature field, which shows that 10 days before the increase in PM2.5 concentration in Shanghai, there was a positive anomaly center in Siberia, whose intensity and range increased 5 days before, and it passed the significance test. From 10 to 5 days before, the central and eastern regions of China were controlled by significant negative anomalies. At the same time, the center of a positive anomaly in Siberia clearly moved south and expanded in its range to central and eastern China. This shows that during the same period of increase in PM2.5 concentration, the temperature at 850 hPa increased in central and eastern China, which was conducive to the occurrence of a temperature inversion that could inhibit the vertical diffusion of pollutants. It can be seen that the signal of the 850 hPa field was also the strongest 5 days before the change in PM2.5. Therefore, the 850 hPa temperature field (53°–63°N, 80°–110°E) was selected as the key area.
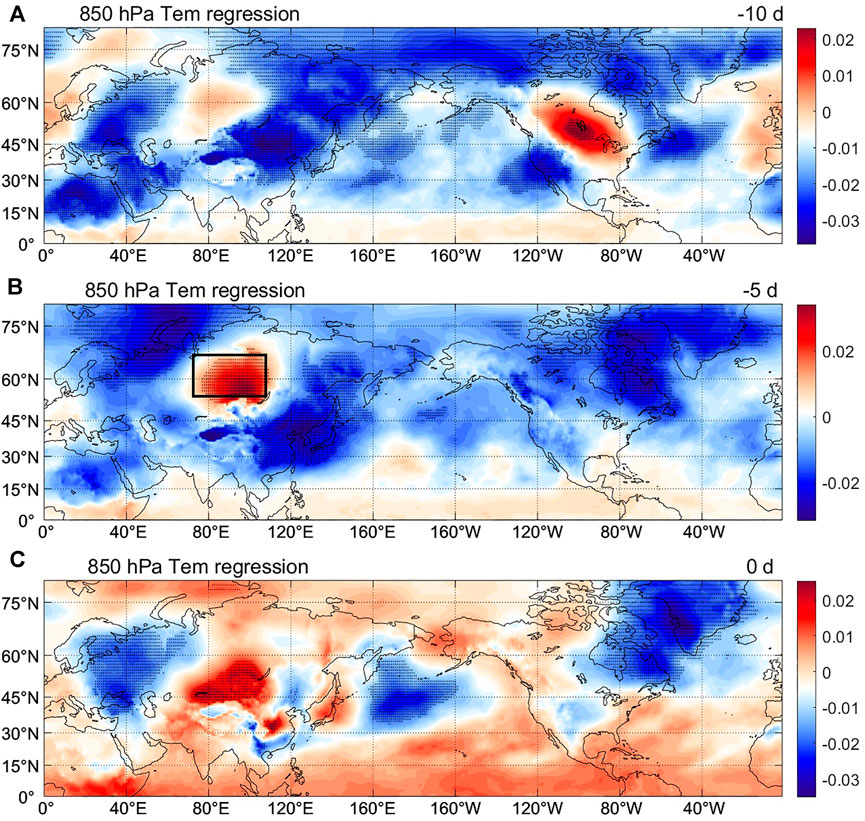
FIGURE 4. Lead regression analysis of PM2.5 concentration on the 850 hPa temperature field (A) ten days before, (B) five days before, and (C) day of.
The distribution of the sea-level pressure field regression and the 850 hPa temperature field were similar (figures not shown). The increase in PM2.5 concentration corresponded to the formation, eastward movement, and southward movement of the Siberian High. To avoid factor duplication, this study did not select key areas from the sea-level pressure field of the sea-level pressure field.
2.4 Predictor Screening
Based on the analysis in Section 2.3, the predictors were divided into two categories: local factors and large-scale circulation factors. Meteorological predictors in three models (ECMWF, CMA, and the U.K. model) in the S2S dataset on a grid point near Shanghai and MODIS AOD data were used as local factors. To obtain more comprehensive meteorological information and avoid the error caused by a single factor, a decision tree model (LightGBM) was adopted to rank the meteorological factors in the three models in the S2S dataset that affect PM2.5 concentration, and the first 69 predictors were selected, including 46 high-altitude predictors and 23 sea-level predictors. The names and importance of the predictors are presented in Supplementary Appendix Table S1. The large-scale circulation factors were the four key area indices defined in the middle, lower, and surface layers of the troposphere in section 2.3. In addition, the forecast date and PM2.5 measurements before the forecast started were set as the basic information of the forecast.
2.5 Modeling Framework
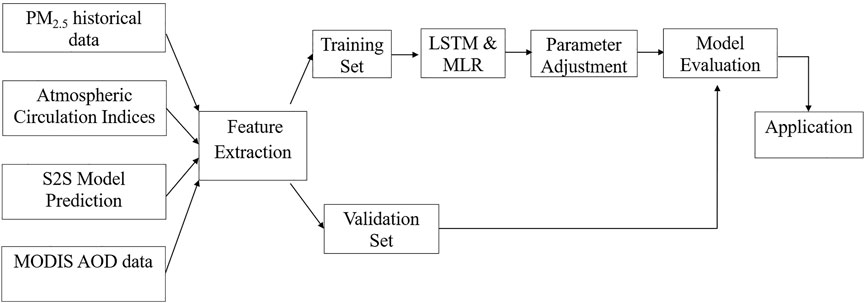
The PM2.5 concentration from 2001 to 2019, the meteorological prediction data of the CMA, ECMWF, and U.K. models in the S2S dataset, MODIS AOD data, and earlier atmospheric circulation indices in the key areas were selected. The LSTM model parameter settings are presented in Table 2. Figure 5 shows the flowchart of the modeling framework. The specific steps were as follows: 1) The LightGBM model was used to extract feature factors of the meteorological factors that impact PM2.5 concentration and randomly divide the feature factors into a training set (90%) and a validation set (10%); 2) 90% of the data in the training set were selected randomly and applied to the LSTM and MLR models, respectively, for model training. The remaining 10% was used for testing and adjusting the model parameters based on the test results to select the optimal parameters for the model; 3) the validation set was used to evaluate and test the model prediction results. If the model passed the test, the model was saved. Then, only predictor inputs were required to generate the operational forecasts. If the model did not pass the test, then the process returned to model training, the predictors and training parameters were adjusted, and the model was retrained.
Commonly used continuous time series evaluation test indicators, correlation coefficient (R) and root-mean-square error (RMSE), were selected for an overall evaluation, and the Heidke Skill Score (HSSs) (Heidke, 1926) was selected as an indicator to evaluate the hit rate of pollution days. The HSS is related to two measures: proportion correct (PC) and its maximum likelihood estimate (E), which is defined as follows:
where a refers to the number of observed pollution days forecasted correctly, b refers to the number of observed pollution days forecasted incorrectly, and c refers to the number of observed pollution days where a forecast was not made. Based on Eqn 2, the ideal value of PC is a uniform value, and its reference value is a probable consistency. Therefore, E can be written as
and HSS can be defined as
where the range of HSS is [−∞, 1], and a negative value means that the model is worse than random predictions, a value of 0 means that it does not have any skill, and a value of 1 means that the forecasts are perfect.
3 Results
Based on the aforementioned analysis, the PM2.5 concentration in Shanghai is affected not only by the interaction between local meteorological factors and source emissions but also by earlier atmospheric circulation conditions. Meteorological fields predicted by S2S can provide local meteorological factors over an extended range. Utilizing the LSTM and MLR models, the nonlinear and linear correlations between the PM2.5 concentration and the local factors (S2S predicted values) and earlier atmospheric circulation factors were established. Then, an extended-range prediction model of PM2.5 concentration in Shanghai was established. Based on the evaluation, the optimal model was selected as the prediction model.
3.1 Experiment Plan and Result Verification
Based on the time relationship between the impact factor and the forecast target, three sets of experiments were designed, and each experiment was repeated ten times. The ensemble average was obtained as the forecast result. The design and forecast testing for each experiment are described as follows.
Experiment 1: t-20, t-19,..., t-1 real-time atmospheric circulation factors were selected as predictors to establish a forecast model for PM2.5 concentration in Shanghai for 20 days, t, t + 1,..., t + 20. The design scheme is listed in Table 3. The model in EXP1-1 was built using MLR regression, and the forecast model in EXP1-2 was built using the LSTM network. Experiment 2: A total of 207 historical predictors (t, t + 1,..., t + 20) from the three models in the S2S dataset, and MODIS AOD data (t-20, t-19,..., t-1) were used to establish a forecast model for 0- to 20-day PM2.5 concentration. The model in EXP2-1 was built using MLR regression, and the forecast model in EXP2-2 was built using the LSTM network. Experiment 3: Real-time atmospheric circulation factors (t-20, t-19,..., t-1), MODIS AOD data (t-20, t-19,..., t-1), and historical predictors (t, t + 1,..., t + 20) in the three models in the S2S dataset were selected as predictors for training the model. The model in EXP3-1 was built using MLR regression, and the forecast model in EXP3-2 was built using LSTM. Figure 6 shows the forecast test results for each experiment. The top and bottom graphs show the changes in the forecast and real-time RMSE with forecast time, respectively. Figure 7 shows the comparison between the forecast and actual measurements in January, February, November, and December of 2019 (the black line is the observation, and the colored lines are the 20-days predicted daily concentration values that start daily the 20-day predicted daily concentration value that started daily).
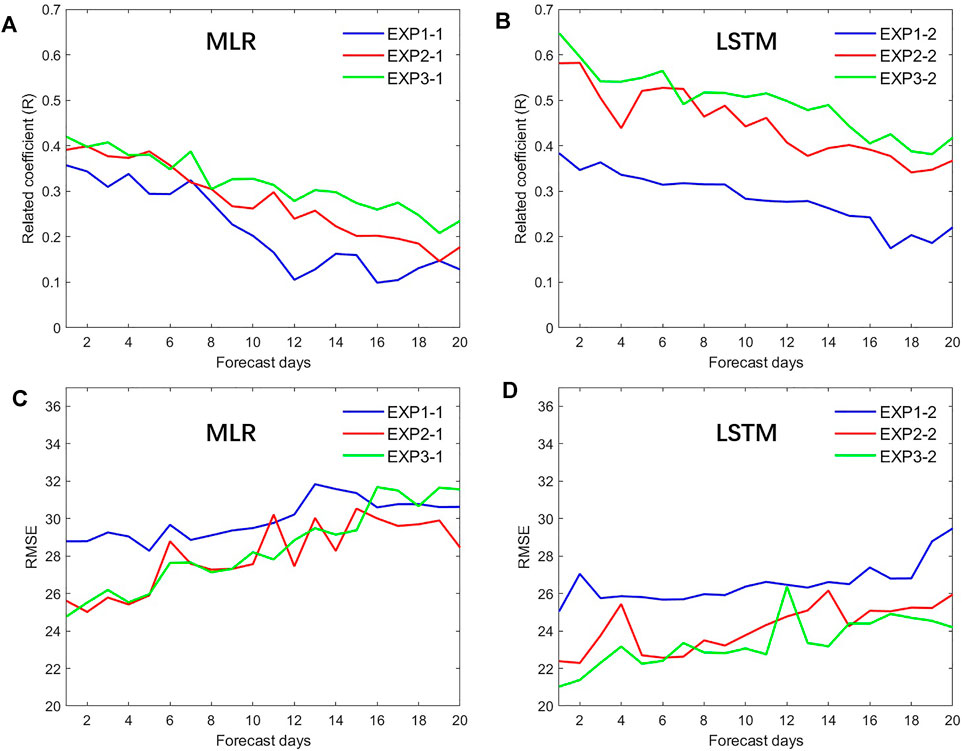
FIGURE 6. Individual experiment forecast result verification of EXP 1 to EXP 3 (A,B) R (the 95% confidence level is 0.18) (C,D) RMSE.
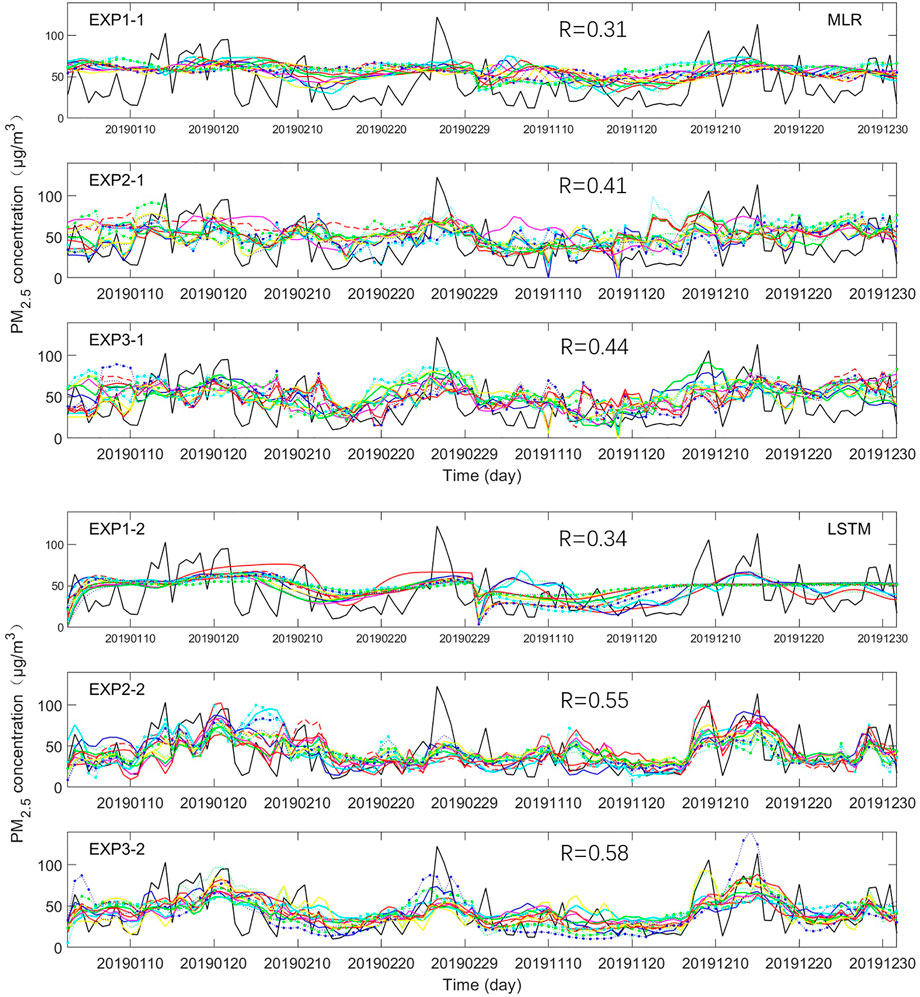
FIGURE 7. Comparison of results from EXP 1 to EXP 3 with the actual condition for (A) MLR and (B) LSTM model. (Note: The black line is the measured PM2.5, and the colored lines are the daily forecast, R is the correlation coefficient of 1- 20-day average prediction with observation.)
It can be seen from the R and RMSE results that overall, the prediction results of LSTM were better than those of the MLR model. First, the results from EXP 1-1 and 1–2 were analyzed. This model only used earlier large-scale circulation as predictors, and its error was relatively small in short-term forecasts, and the error increased as the period validity increased. The R and RMSE of 0- to 7-day forecasts versus the true value were stable, with R between 0.3 and 0.35, and RMSE around 26 μg m−3. As the period validity increased, R decreased, and RMSE increased significantly. The R and RMSE values of EXP 1 to 2 were better than those of EXP 1-1, indicating that the LSTM model had a better predictive ability than the MLR model. As seen from the comparison between the forecasted and measured PM2.5 concentration in 2019 (Figure 7), both EXP 1-1 and EXP 2-1 were only able to forecast the average PM2.5 concentration, but not the highest and lowest values, which indicates that only considering large-scale circulations and not considering local factors would cause the model to not be able to obtain information about the local meteorological factors and thus not forecast the high-frequency changes in PM2.5. However, the earlier large-scale circulations contain weather signals near the forecast stations for a period of time in the future, so they can provide background information about the average PM2.5 concentration to some extent.
In EXP 2-1 and EXP 2-2, the meteorological factors predicted by S2S and MODIS AOD data at this station were selected as predictors, and the error of these experiments also increased as the period validity increased. The R and RMSE of EXP 2-2 were better than EXP 2-1, which indicates that the predictive ability of the LSTM model was better than that of MLR. As seen from the comparison between the forecasted and measured PM2.5 concentration in 2019 (Figure 7), both experiments were able to forecast the high-frequency change in PM2.5, which shows that the information contained in the local meteorological factors predicted by S2S had a relatively significant impact on PM2.5. However, as the period validity increased, the accuracy of the S2S meteorological forecast decreased, and its ability to forecast the PM2.5 concentration also weakened.
EXP 3-1 and EXP 3-2 selected all S2S local predictors, MODIS AOD data, and earlier large-scale circulation factors as predictors to train the models. The results showed that the distribution patterns of R and RMSE of EXP 3-1 and EXP 3-2 were the same as those of EXP 2-1 and EXP 2-2, but the error values (R and RMSE) were smaller, indicating that adding the earlier large-scale circulation factors on the basis of local factors can significantly improve the forecast by the model. As seen from the comparison between the forecasted and measured PM2.5 concentrations in 2019 (Figure 7), both EXP 3-1 and EXP 3-2 could predict high-frequency changes in PM2.5. Overall, they are closer to the actual condition than EXP 2-1 and EXP 2-2, indicating that local factors were the main impactor of the change in PM2.5, and the earlier circulation factors in the key areas could correct the error in the S2S local forecast, thereby improving the forecast results. EXP 3-2 had a higher R, a lower RMSE, and better forecast stability than EXP 3-1, and its forecasted peak value was closer to the actual peak, indicating that LSTM has better predictive ability than MLR.
It can be concluded from the aforementioned three experiments that the optimal forecast model was achieved when both the large-scale circulation factors before the PM2.5 concentration change and the S2S local meteorological predictors (including MODIS AOD data) were used as impact factors, and the LSTM model was used in training. Therefore, this study selected the LSTM model established in EXP 3-2 as the extended-range prediction model of PM2.5 concentration in Shanghai.
3.2 Model Prediction Effect Analysis
Based on the aforementioned experiments, the design of EXP 3 was used, and the 45-day prediction of the ECMWF, CMA, and U.K. models in the S2S dataset, the first 20 days of the atmospheric circulation indices in the key areas from the ERA-5 reanalysis data, the MODIS AOD data, and the measured PM2.5 concentration was selected to train the winter of 2001–2014 using the LSTM and MLR models. Six prediction models were obtained: LSTM-ECMWF, MLR-ECMWF, LSTM-CMA, MLR-CMA, LSTM-UK, and MLR-UK. They were then used to predict the following 40-day daily PM2.5 concentration from 2015 to 2019. The results were first averaged using a pentad, then tested, and evaluated. The evaluation results (Figure 8) showed that as the period validity increased, the prediction ability of the models gradually decreased. The correlation coefficient of 1–2-pentad LSTM_ECMWF model prediction could reach 0.6–0.7, the coefficients for the U.K. and CMA models were slightly lower (0.5–0.65), and their RMSE were all lower than 25 μg m−3. The prediction accuracy of the model decreased significantly beyond the three pentads, with a correlation coefficient lower than 0.45. The RMSEs of the LSTM-ECMWF model at 20–25 μg m−3 and that of the LSTM-U.K. and LSTM-CMA models were both higher than 25 μg m−3. Overall, the predictive ability of the MLR model was weaker than that of the LSTM model. For example, the correlation coefficient of the LSTM-ECMWF was higher than 0.1–0.2 than MLR-ECMWF, and the RMSE was lower by 3–9 μg m−3.
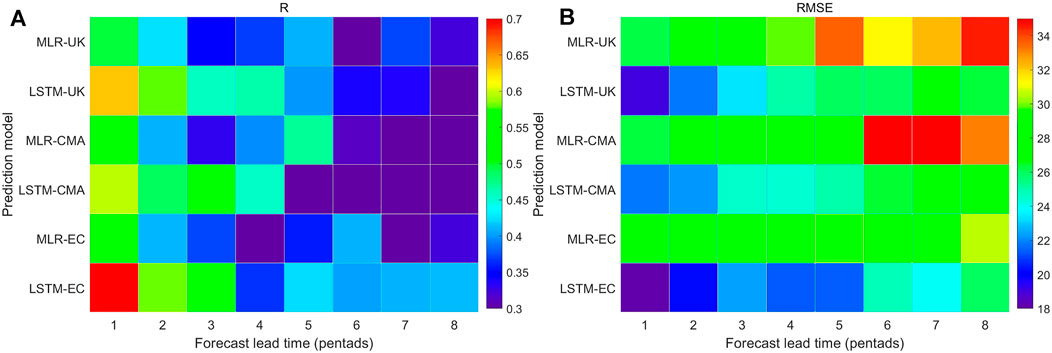
FIGURE 8. Correlation coefficients (the 95% confidence level is 0.18) (A) and RMSE (B) between PM2.5 concentration predictions with different period validity (one to eight pentads) (x-axis) of MLR and LSTM predictions based on CMA, U.K., and ECMWF models and the actual condition.
The HSS was estimated from the score of correctly predicted pollution days in winter after the revised predictions due to random errors were excluded. It can be seen from the comparison of the HSS of the six prediction models (Figure 9) that compared to the predictions made by MLR, the prediction made by LSTM showed higher skill in most prediction lead times, and its HSS was always higher than 0.1 in the period validity of two to eight pentads. The prediction of LSTM-UK had an advantage within the lead time of one to four pentads, with an HSS higher than 0.2; for a lead time of four to seven pentads, the predictive abilities of LSTM-ECMWF and LSTM-UK were similar. It can be seen that the LSTM model based on S2S can predict the pollution days in Shanghai to some extent, which exceeded the time scale of the weather forecast (7–10 days in advance), but as lead time increased, its prediction ability gradually weakened.
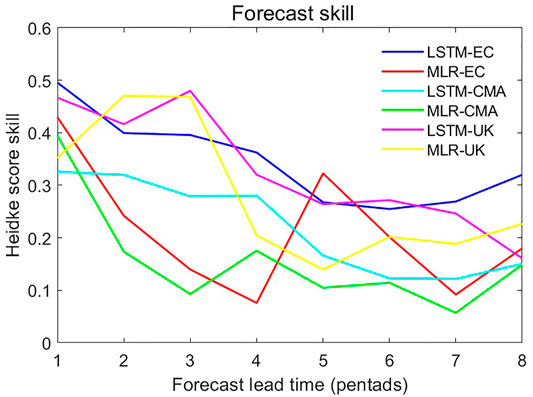
FIGURE 9. Heidke Skill Score (y-axis) of MLR and LSTM PM2.5 concentration predictions based on CMA, U.K., and ECMWF models with different period validity (one to eight pentads) (x-axis).
3.3 Comparison With LGBM
In order to further verify the prediction advantages of the LSTM model, based on the aforementioned three groups of experiments and the same data set, this study conducted the same prediction test with a light gradient boosting machine (LGBM). An LGBM is a decision tree machine learning algorithm. The R and RMSE of the aforementioned two tests are given in Figure 10. Overall, the prediction ability of the LSTM model is obviously better than that of LGBM model. In experiments 3-1, the average correlation coefficient and RMSE of all prediction days (including 1–20 days) are 0.495 and 23.4 μg m−3, respectively, which are better than those of the LGBM model (0.47 and 23.8 μg m−3). In addition, compared with the LGBM model, the LSTM model also has advantages in the prediction performance of longer forecast time. For example, when the prediction days were 16–20 days, RMSE is reduced by 0.8 μg m−3 compared with LGBM. Thus, only LSTM prediction results were evaluated in the next section.
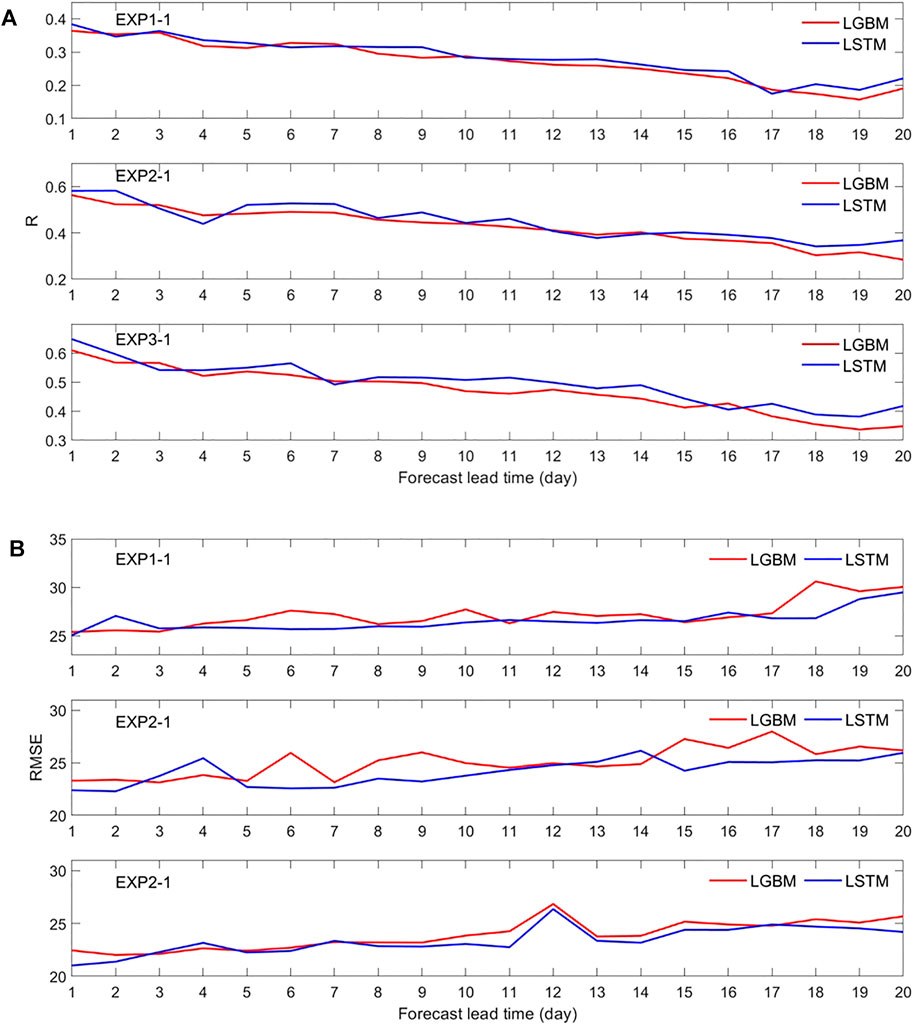
FIGURE 10. Comparison of results from EXP 1 to EXP 3 with the actual condition for LGBM and LSTM models (A) R (the 95% confidence level is 0.18) and (B) RMSE.
3.4 Predictive Effect of Individual Cases of Pollution
As discussed in the previous sections, the LSTM model has higher and more stable prediction skills; therefore, only the LSTM prediction results were evaluated using individual cases of pollution. December 1, 2015 to January 20, 2016 was selected as the case study. In this period, 25 pollution days occurred (figure not shown), among which three pollution processes lasted 3 days or more, and pollution lasted for seven consecutive days from January 13 to 19, 2016. Figure 11 shows the model-predicted 2015–2016 consecutive pollution events compared with the observed results (purple dots) at different lead times (blue dots). Overall, the LSTM-ECMWF, LSTM-CMA, and LSTM-UK models were able to predict 80, 76, and 88% of the pollution processes with a lead time of 15–40 days, respectively. However, there were differences in the lead times for the pollution prediction. Relatively speaking, the ECMWF model showed good skill in predicting continuous pollution during January 13–19, 2016, 35–40 days in advance. The U.K. model accurately predicted this pollution process 35 and 15 days in advance, but there was a period where predictions were not made in mid-December 2015. The lead time of the accurate prediction by the CMA model was short, only 20 days in advance of the continuous pollution process in mid-January 2016. Compared with the intermittent predictions of continuous pollution by ECMWF and CMA, the U.K. model provided a more reasonable prediction of the pollution cycle with a lead time of 15–40 days. It can be seen that for the prediction of the pollution process, all three models had a certain level of prediction ability, but the LSTM-UK model had a higher hit rate for pollution prediction.
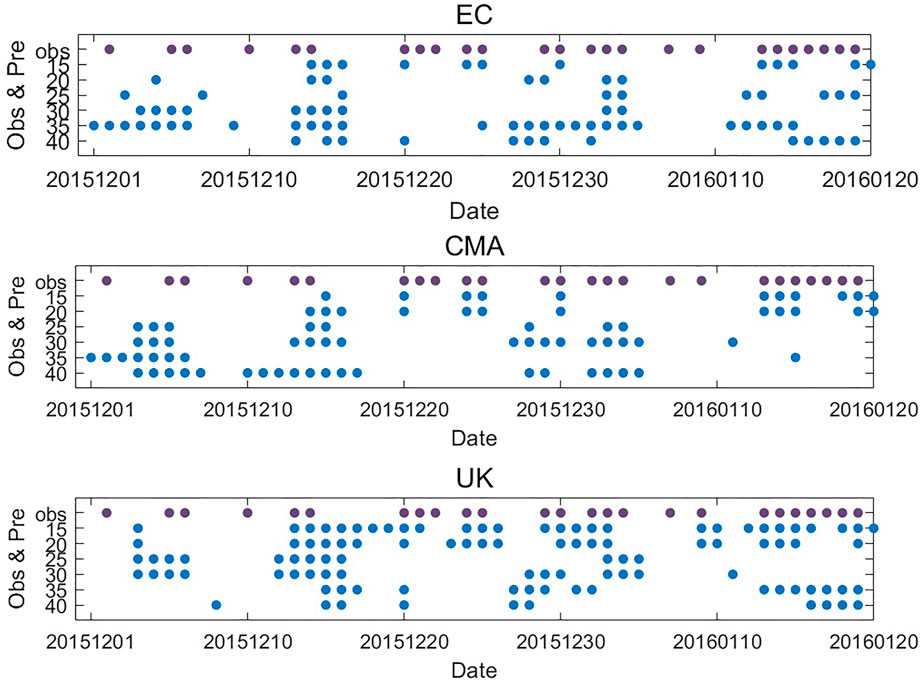
FIGURE 11. Comparison between the observed pollution processes and the LSTM-predicted pollution periods (December 1, 2015–January 20, 2016). (Note: Purple dots indicate the observed pollution period (December 1, 2015–January 20, 2016).) The three sets of graphs show the predicted pollution period by ECMWF (top), CMA (middle), and the U.K. (bottom) models with different period validity (y-axis).
4 Discussion
The local factors were the main factors affecting the rapid changes in PM2.5. Regression analysis was used to select earlier large-scale circulation factors can provide background information about the average PM2.5 concentration to some extent. Adding the earlier large-scale circulation factors on the basis of local factors can significantly improve the forecast by the model, indicating that local factors were the main impactor of the change in PM2.5, and the earlier circulation factors could correct the error in the S2S local forecast to some extent. In future research, external forcing factors can be selected to enter the model because the signal of external forcing factors lasts longer and has an impact on the evolution of atmospheric circulation in advance.
The model prediction error originates from two sources. The first is the prediction ability error of the model, which can be solved by selecting the model with strong prediction ability, increasing the training model samples, and adjusting the appropriate parameters of the model. The second is the forecast error of the S2S meteorological field. The field of ERA-5 was regarded as the “true value,” and correlation analysis was performed with the same meteorological elements in S2S (figure omitted). It was discovered that the correlation coefficients of U, V, and ERA of each standard layer related to the wind field decreased significantly beyond the second pentad, and wind at different layers played a large role in the PM2.5 concentration (Supplementary Appendix Table S1); therefore, the wind field error of the S2S forecast may be one of the main factors causing the relatively large error in 11- to 40-day pollution prediction. By adding predictors related to the wind field in the training model, the impact of wind field error on the predictive ability of the model can be reduced, which was one of the reasons why 69 S2S local factors were chosen. In addition, before training the pollution prediction model, the meteorological prediction field of S2S first should be objectively corrected, which is one of the effective ways to reduce the prediction error of the pollution prediction model.
In addition, PM2.5 concentration is affected not only by meteorological factors but also by the emission of pollutants and the interaction between pollutants. In this study, only MODIS AOD is used to characterize pollution emission factors. In the future, incorporating real-time emission inventory into the model is also the direction to improve the prediction ability of the model.
Data Availability Statement
The original contributions presented in the study are included in the article/Supplementary Material, further inquiries can be directed to the corresponding author.
Author Contributions
Conceptualization: YQ and JM; methodology: YQ, JM, and ZY; software: YQ and ZQ; validation: YQ, JM, and ZY; writing—original draft preparation: YQ and JM; writing—review and editing: YQ, JM, and ZY; visualization: YQ and JM; and funding acquisition: JM All authors have read and agreed to the published version of the manuscript.
Funding
This research is supported by the National Natural Science Foundation of China (Grant Nos. 42005055, 91644223, and 41475040), the Natural Science Foundation of Shanghai (Grant No. 19ZR1462100), the Chinese Ministry of Science and Technology (Grant No. 2019YFC0214605), and the Shanghai Science and Technology Commission (Grant No. 19DZ1205003).
Conflict of Interest
The authors declare that the research was conducted in the absence of any commercial or financial relationships that could be construed as a potential conflict of interest.
Publisher’s Note
All claims expressed in this article are solely those of the authors and do not necessarily represent those of their affiliated organizations, or those of the publisher, the editors, and the reviewers. Any product that may be evaluated in this article, or claim that may be made by its manufacturer, is not guaranteed or endorsed by the publisher.
Supplementary Material
The Supplementary Material for this article can be found online at: https://www.frontiersin.org/articles/10.3389/fenvs.2022.882741/full#supplementary-material
References
Baklanov, A., Mestayer, P. G., Clappier, A., Zilitinkevich, S., Joffre, S., Mahura, A., et al. (2008). Towards Improving the Simulation of Meteorological fields in Urban Areas through Updated/advanced Surface Fluxes Description. Atmos. Chem. Phys. 8 (3), 523–543. doi:10.5194/acp-8-523-2008
Castellano, M., Franco, A., Cartelle, D., Febrero, M., and Roca, E. (2009). Identification of NOx and Ozone Episodes and Estimation of Ozone by Statistical Analysis. Water Air Soil Pollut. 198, 95–110. doi:10.1007/s11270-008-9829-2
De Gennaro, G., Trizio, L., Di Gilio, A., Pey, J., Pérez, N., Cusack, M., et al. (2013). Neural Network Model for the Prediction of PM10 Daily Concentrations in Two Sites in the Western Mediterranean. Sci. Total Environ. 463-464, 875–883. doi:10.1016/j.scitotenv.2013.06.093
Di Carlo, P., Pitari, G., Mancini, E., Gentile, S., Pichelli, E., and Visconti, G. (2007). Evolution of Surface Ozone in central Italy Based on Observations and Statistical Model. J. Geophys. Res. 112, D10316. doi:10.1029/2006JD007900
Donnelly, A., Misstear, B., and Broderick, B. (2015). Real Time Air Quality Forecasting Using Integrated Parametric and Non-parametric Regression Techniques. Atmos. Environ. 103, 53–65. doi:10.1016/j.atmosenv.2014.12.011
Gao, S., Zhao, P., Pan, B., Li, Y., Zhou, M., Xu, J., et al. (2018). A Nowcasting Model for the Prediction of Typhoon Tracks Based on a Long Short Term Memory Neural Network. Acta Oceanol. Sin. 37 (05), 8–12. doi:10.1007/s13131-018-1219-z
Heidke, P. (1926). Berechnung des erfolges und der gfc;te der windstrkevorhersagen im sturmwarnungsdienst. Geografiska Annaler 8 (4), 301–349. doi:10.1080/20014422.1926.11881138
Hinton, G. E., Osindero, S., and Teh, Y. W. (2006). A Fast Learning Algorithm for Deep Belief Nets. Neural Comput. 18 (07), 1527–1554. doi:10.1162/neco.2006.18.7.1527
Hochreiter, S., and Schmidhuber, J. (1997). Long Short-Term Memory. Neural Comput. 9 (8), 1735–1780. doi:10.1162/neco.1997.9.8.1735
Kim, Y., Fu, J. S., and Miller, T. L. (2010). Improving Ozone Modeling in Complex Terrain at a fine Grid Resolution: Part I - Examination of Analysis Nudging and All PBL Schemes Associated with LSMs in Meteorological Model. Atmos. Environ. 44 (4), 523–532. doi:10.1016/j.atmosenv.2009.10.045
Olah, C. (2015). Understanding LSTM Networks. Available at: https://colah.github.io/posts/2015-08-Understanding-LSTMs/. (Accessed August 27, 2015).
Qi, Y., Li, Q., Karimian, H., and Liu, D. (2019). A Hybrid Model for Spatiotemporal Forecasting of PM2.5 Based on Graph Convolutional Neural Network and Long Short-Term Memory. Sci. Total Environ. 664, 1–10. doi:10.1016/j.scitotenv.2019.01.333
Qin, D., Yu, J., Zou, G., Yong, R., Zhao, Q., and Zhang, B. (2019). A Novel Combined Prediction Scheme Based on CNN and LSTM for Urban PM2.5 Concentration. IEEE Access 7, 20050–20059. doi:10.1109/ACCESS.2019.2897028
Seng, D., Zhang, Q., Zhang, X., Chen, G., and Chen, X. (2021). Spatiotemporal Prediction of Air Quality Based on LSTM Neural Network. Alexandria Eng. J. 60 (2), 2021–2032. doi:10.1016/j.aej.2020.12.009
Shen, H., Li, T., Yuan, Q., and Zhang, L. (2018). Estimating Regional Ground-Level PM2.5 Directly from Satellite Top-Of-Atmosphere Reflectance Using Deep Belief Networks. J. Geophys. Res. Atmos. 123 (24), 13–875. doi:10.1029/2018jd028759
Vitart, F., Ardilouze, C., Bonet, A., Brookshaw, A., Chen, M., Codorean, C., et al. (2017). The Subseasonal to seasonal(S2S) Prediction Project Database. Bull. Amer. Meteorol. Soc. 98, 163–173. doi:10.1175/BAMS-D-16-0017.1
Wang, J., and Song, G. (2018). A Deep Spatial-Temporal Ensemble Model for Air Quality Prediction. Neurocomputing 314, 198–206. doi:10.1016/j.neucom.2018.06.049
Wen, C., Liu, S., Yao, X., Peng, L., Li, X., Hu, Y., et al. (2019). A Novel Spatiotemporal Convolutional Long Short-Term Neural Network for Air Pollution Prediction. Sci. Total Environ. 654, 1091–1099. doi:10.1016/j.scitotenv.2018.11.086
WHO (2016). Ambient Air Pollution: A Global Assessment of Exposure and burden of Disease. Geneva, Switzerland: WHO Library Cataloguing-in-Publication Data.
WHO (2003). Health Aspects of Air Pollution with Particulate Matter, Ozone and Nitrogen Dioxide. Bonn, Germany. Technical Report WHO.
Woody, M. C., Wong, H.-W., West, J. J., and Arunachalam, S. (2016). Multiscale Predictions of Aviation-Attributable PM2.5 for U.S. Airports Modeled Using CMAQ with Plume-In-Grid and an Aircraft-specific 1-D Emission Model. Atmos. Environ. 147, 384–394. doi:10.1016/j.atmosenv.2016.10.016
Xing, Y. F., Xu, Y. H., Shi, M. H., and Lian, Y. X. (2016). The Impact of PM2.5 on the Human Respiratory System. J. Thorac. Dis. 8 (1), E69–E74. doi:10.3978/j.issn.2072-1439.2016.01.19
Keywords: LSTM, S2S, PM2.5, extended-range prediction, atmospheric circulation
Citation: Qu Y, Ma J and Yu Z (2022) Extended-Range Forecasting of PM2.5 Based on the S2S: A Case Study in Shanghai, China. Front. Environ. Sci. 10:882741. doi: 10.3389/fenvs.2022.882741
Received: 24 February 2022; Accepted: 29 March 2022;
Published: 27 May 2022.
Edited by:
Jing Wei, University of Maryland, College Park, United StatesReviewed by:
Xing Yan, Beijing Normal University, ChinaQing Chen, The University of Iowa, United States
Wenhao Xue, Qingdao University, China
Copyright © 2022 Qu, Ma and Yu. This is an open-access article distributed under the terms of the Creative Commons Attribution License (CC BY). The use, distribution or reproduction in other forums is permitted, provided the original author(s) and the copyright owner(s) are credited and that the original publication in this journal is cited, in accordance with accepted academic practice. No use, distribution or reproduction is permitted which does not comply with these terms.
*Correspondence: Jinghui Ma, MTg5MTgyMDY2MDVAMTYzLmNvbQ==
 Yuanhao Qu
 Jinghui Ma
 Zhongqi Yu1,2


