 Liye Wang1
 Yaolin Liu
95% of researchers rate our articles as excellent or good
Learn more about the work of our research integrity team to safeguard the quality of each article we publish.
Find out more
ORIGINAL RESEARCH article
Front. Environ. Sci. , 12 April 2022
Sec. Land Use Dynamics
Volume 10 - 2022 | https://doi.org/10.3389/fenvs.2022.882582
This article is part of the Research Topic Towards Sustainable Urban Development: Use of Geographic Big Data for Spatial Planning View all 25 articles
Nowadays, both urbanization and cropland expansion are hot issues. However, research related to the spatiotemporal interaction between urbanization and cropland expansion and their socioeconomic determinants remains scarce. Accordingly, this research takes the urban agglomeration in the middle reaches of the Yangtze River (MRUA) as the research area by combining spatial analysis, sensitivity analysis, and the spatial gravity model. To achieve this goal, we identified the area of the construction land expansion and cropland expansion, the sensitivity of cropland expansion to construction land expansion, and the shifting trajectory of gravity centers of construction land expansion and cropland expansion and their interaction during 2000–2020, respectively. Additionally, the geographically weighted regression model was utilized to explore the spatiotemporal heterogeneity of four socioeconomic determinants of the interaction between construction land expansion and cropland expansion. The results are as follows: 1) the area of the expanded construction land and the expanded cropland and the sensitivity of cropland expansion to construction land expansion show an overall increasing pattern; 2) the gravity center of the expanded construction land shifted toward the northeast, whereas that of the expanded cropland moved to the southeast but with similar moving distances (17.83 and 15.37 km, respectively); 3) the GDP has an increasing positive effect on the interaction of the construction land expansion and cropland expansion, whereas the investment in fixed assets shows an increasing negative effect during 2000–2020. The GDP in the agricultural sector and population displays a stable influence. This article offers a solution for decision makers to promote the interaction between construction land and cropland.
Globally, frequent human interactions with the natural environment have significantly changed Earth’s surface (Song et al., 2018; Tesfaw et al., 2018). Only in the second half of the 20th century, human’s efforts to develop the social economy have resulted in 24% of Earth’s surface conversion into cropland and lost more than 55% of mangroves and coral reefs (Millennium Ecosystem Assessment, 2005). Therefore, land use/land cover change (LUCC) has been a hot issue in recent decades (Ariti et al., 2018; Folberth et al., 2020). Under human demands to attain economic progress, urbanization has unavoidably become one of the most active LUCCs, which then promoted the expansion of the impervious surface and loss of ecological land (Deng et al., 2009; Salerno et al., 2018; Qiu et al., 2019).
The urbanization level worldwide is estimated to reach over 80%, and in developing countries, the quantity of urban areas in 2050 will be far larger than that in 2000 with an increasing expansion rate (Angel et al., 2011; United Nations, 2018). The increased urban area inevitably takes up a large number of cropland and occupies the space of ecological land (van Vliet et al., 2017; Wang et al., 2020; Wu et al., 2020). The high-quality lives brought by urbanization to the people also lead to the booming population (Shu et al., 2018; Boudet et al., 2019). Facing the pressure from two sides, that is, the reduction of cropland and population growth, the world is under severe food security problems (Foley et al., 2011; Asche et al., 2015).
Cropland, as a scarce resource, holds the key to maintaining food security for a country and the world (Egli et al., 2018; Yang et al., 2020a). To avoid cropland loss and ensure food security, many countries worldwide have promulgated several cropland protection policies in line with their national conditions (Monk et al., 2013). For example, in 1938, the United Kingdom promulgated the “Green Belt Policy” to restrict the growth of urban area and prevent cropland loss (Cullingworth et al., 2014); in 1996, China implemented a series of policies to ensure no net loss of cropland and increase the quality of cropland, such as the “Cropland Balance Policy” and the “Basic Cropland Policy” (Ke et al., 2018; Su et al., 2020; Wang et al., 2021). These policies are not only aimed at preventing cropland loss but can also promote cropland expansion (Ke et al., 2019; Tang et al., 2021). Song and Pijanowski (2014) pointed out that in 1999–2008, due to the “Cropland Balance Policy”, 27,677 km2 of cropland was reclaimed through land consolidation, exploitation, and rehabilitation in China. Additionally, the spontaneous agricultural activities of farmers can increase the area of cropland (He et al., 2021; Zhang et al., 2022). In the future, cropland expansion will play an increasingly important role in maintaining food security.
Both urbanization and cropland expansion are hot research topics at the regional and global scale. Researchers initially focused on the causes and effects of urbanization (Haase et al., 2012; He et al., 2014). At the regional scale, Souza et al. (2016) discussed the effects of urbanization on the microclimate of Manaus. Su et al. (2012) evaluated the urbanization impacts on ecosystem services at the eco-regional scale. Moreover, Liu et al. (2021) examined the characteristics of the urban expansion structure in a city scale. At a global scale, Lambin and Meyfroidt (2011) evaluated the relationships among urbanization, economic globalization, and land scarcity. Seto et al. (2012) projected the global urban area in 2030 and discussed its direct impact on carbon biomass. Li et al. (2022) analyzed the characteristics of global urbanization trend and its related population dynamics. As time goes on, the area of cropland expansion is continuously increasing (Zabel et al., 2019; Eigenbrod et al., 2020; Cheng et al., 2021), consequently gaining considerable attention on its effects. The effects of cropland expansion on ecosystem services (Ke et al., 2019; Tang et al., 2021) and cropland productivity (Song and Pijanowski, 2014; Song and Liu, 2017), the causes of cropland expansion (Zelaya et al., 2016; He et al., 2021), and the relationships among cropland expansion, cropland intensification, and food security (Mauser et al., 2015; Zabel et al., 2019; Folberth et al., 2020) are all hot issues of the researchers. The interactions between urbanization and cropland change are also explored (Liu L. et al., 2014; van Vliet et al., 2017). For example, Tu et al. (2021) discussed the interactions of urbanization and cropland loss under different rates and patterns of urban expansion. Zhou et al. (2021) applied macro–micro comparative analysis to detect the urbanization-associated cropland loss at different scales. However, all of the aforementioned urban and cropland interaction research works are all based on the analysis of urbanization resulting cropland loss. Research scarcely focused on the interaction between urban expansion and cropland expansion.
Thus, this study attempts to explore the interaction between urban expansion and cropland expansion and its socioeconomic determinants. To this end, taking the urban agglomeration in the middle reaches of the Yangtze River (MRUA), China as the research area, we first identified the expanded construction land and the expanded cropland through spatial analysis during the periods of 2000–2010 and 2010–2020. Then, sensitivity analysis was utilized to detect the sensitivity of cropland expansion to construction land expansion. We also identified the gravity centers of the expanded construction land and expanded cropland, their shifting trajectories, and interaction. Last, the geographically weighted regression (GWR) model was applied to detect the socioeconomic determinants of the interaction between construction land expansion and cropland expansion.
MRUA is located within
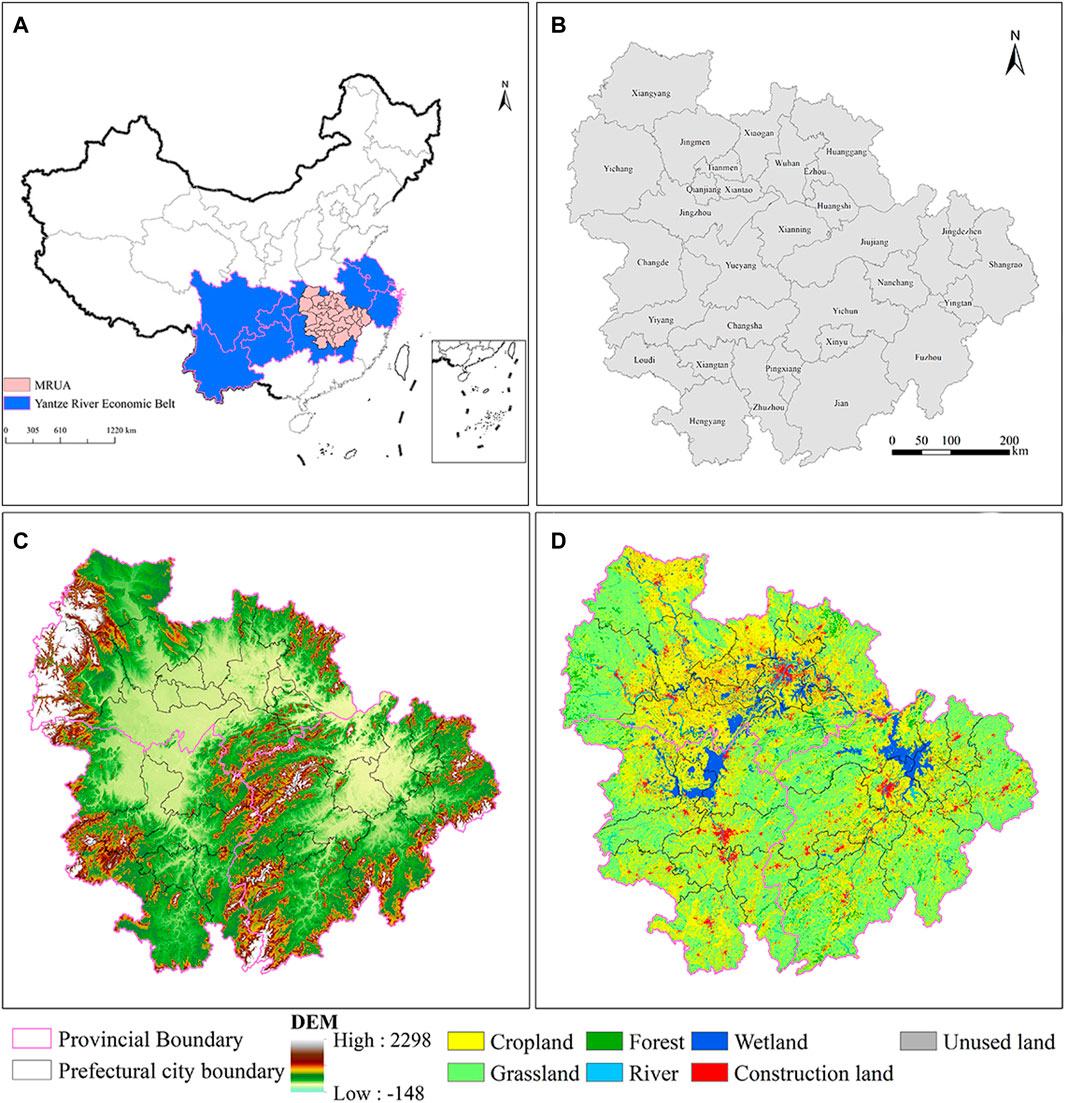
FIGURE 1. Location (A), names of prefectural cities (B), DEM (C), and land use in 2020 (D) of MRUA.
This research uses two types of data: spatial data and statistical data. The spatial data include the land use maps in 2000, 2010, and 2020 from the Data Center of Resources and Environment, Chinese Academy of Science (http://www.resdc.cn), and were reclassified into seven land use types based on the original land use reclassification system (Liu et al., 2010; Liu et al., 2014a). The statistical data come from the Statistical Yearbook of Hubei, Hunan, and Jiangxi Provinces in 2000–2020.
In order to detect the interaction between construction land expansion and cropland expansion and explore its socioeconomic determinants, four steps were conducted (Figure 2). First, the area of the expanded construction land and cropland in the periods of 2000–2010 and 2010–2020 was evaluated using spatial analysis. Then, by integrating sensitivity analysis, we calculated the sensitivity of cropland expansion to construction land expansion to reflect the relationships between them. Third, the gravity model was chosen to estimate the spatial balance of construction land expansion and cropland expansion, changes of the gravity centers, and the interaction between construction land expansion and cropland expansion in 2000–2020. Finally, four socioeconomic determinants and the GWR model were applied to explore the spatial local effects of the variables on the interaction between construction land expansion and cropland expansion. The spatiotemporal heterogeneity of socioeconomic determinants can be identified by using these steps.
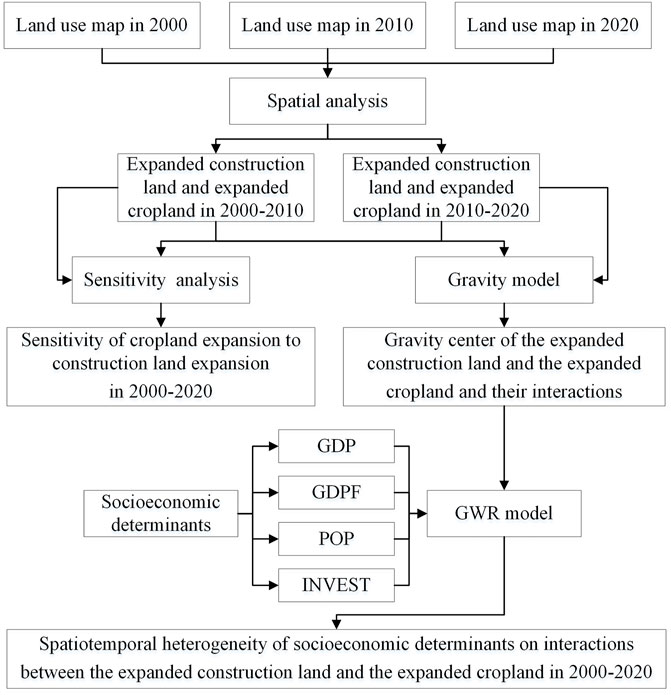
FIGURE 2. Research framework.
This research defines the expanded construction land or the expanded cropland as follows: that a parcel is no construction land or no cropland at the beginning of the research period and it is transformed to construction land or cropland at the end of the research period. Therefore, the amount of the expanded construction land and the expanded cropland is calculated as follows:
where
To evaluate the impact of the expanded construction land on the expanded cropland, the sensitivity analysis model was chosen to assess the sensitivity of cropland expansion to construction land expansion. The sensitivity analysis can reflect the effects of one changing element on another or a group of elements through quantitative analysis (Han et al., 2016; Chai et al., 2019). The sensitivity of cropland expansion to construction land expansion is calculated as follows:
where
The sensitivity analysis denotes the reflection of cropland change to construction land expansion, where a positive score indicates that cropland expansion is affected by construction land expansion; whereas a negative score represents that cropland expansion has an inverse relationship with construction land expansion. Notably, this study focuses on the sensitivity of the expanded cropland area to the area of expanded construction land. Thus, the score of sensitivity is positive. A higher value of sensitivity indicates a higher sensitivity of cropland expansion to construction land expansion.
In the development process of an element, its quantity, quality, and location continue to change in space, leading to the change in spatial force magnitude (Li et al., 2018; Chai et al., 2019). The concept of gravity center is from physics, which refers to a space point whose forces are relatively balanced in all directions (Zhang et al., 2012; Wang et al., 2018). Therefore, the spatial gravity model can be utilized to analyze the spatial balance of some elements by analyzing the direction and distance changes, such as energy (Zhang et al., 2012), grain production (Chai et al., 2019), and ecological capacity (Cheng et al., 2019). The gravity model can also calculate the interaction or flow between at least two locations (Zeng et al., 2019; Yang et al., 2020b). In this article, the gravity model is first used to calculate the coordinate of the center of the expanded construction land and the expanded cropland. Then, it estimates the interaction between the expanded construction land and the expanded cropland. The coordinates of the gravity center can be calculated according to Eqs 4, 5:
where
The changing direction and distance of the gravity center is evaluated according to the following equations, respectively:
where
The interaction calculated by the gravity model exhibits a positive relationship with the focused elements’ attributes and a negative relationship with their spatial distances. The equation is as follows:
where
The GWR model was conducted to investigate the socioeconomic determinants of the interaction between construction land expansion and cropland expansion in MRUA. Regression models are widely used in the driving mechanism analysis (Zhong et al., 2011; Ariti et al., 2015; Mohmmed et al., 2019). The GWR model is an extension of the traditional regression model, which considers the spatial effect by integrating the coordinates of the variables into the calculation (Fotheringham et al., 1996; Punzo et al., 2022). Therefore, the GWR model can estimate the coefficients as many as the local research units, thereby better reflecting the local spatial effects of the explanatory variables on dependent variables (Su et al., 2014; Guo et al., 2021). To obtain a better view of the spatially varying relationships between the interaction of construction land expansion and cropland expansion and socioeconomic determinants, the GWR model was used to visualize the spatial heterogeneity. The GWR model is described as follows:
where
The interaction between the construction land expansion and cropland expansion is a result of the development of social economy, and its calculations are based on two sides the expanded construction land and the expanded cropland. Thus, it is influenced by the joint effects of socioeconomic factors affecting the construction land and cropland. Table 1 displays the explanatory variables selected in this study. The GDP and INVEST have been regarded as the factors influencing construction land expansion (Zhang et al., 2020; Wu et al., 2021), while GDPF is the factor affecting the change of cropland (Cheng et al., 2020; Eigenbrod et al., 2020; Tian et al., 2021). In addition, POP can be considered as the socioeconomic factor that influences both construction land and cropland (Sarparast et al., 2020; Uisso and Tanrıvermiş, 2021).
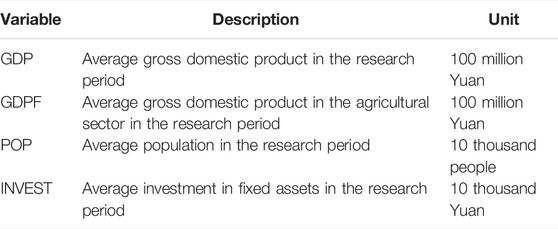
TABLE 1. List of explanatory variables.
In the last 20 years, MRUA has experienced massive changes of construction land and cropland expansions. As time goes by, both construction land expansion and cropland expansion display an increasing trend (Table 2). In 2000–2010, MRUA experienced the expansion of 3,410.92 km2 of construction land and 1785.92 km2 of cropland. Meanwhile, these figures increased to 5,103.82 and 7,809.46 km2, respectively, in the period of 2010–2020. Figure 3 provides a detailed view on the amount of the expanded construction land and cropland in each subresearch area. From this figure, we can see that in 2000–2010, as capital cities in their provinces, Wuhan, Changsha, and Nanchang experienced the largest amount of construction land expansion with a number of 407.02, 357.68, and 257.21 km2, respectively. In 2010–2020, Wuhan was still the city that experienced the largest number of construction land expansion with a number of 351.38 km2. Meanwhile, the other top two cities with the largest areas of construction land expansion have been changed to Jiujiang and Jingzhou with the area of 305.29 and 302.75 km2, respectively. As for the area of the expanded cropland, Shangrao, Yueyang, and Nanchang are the top three cities experiencing cropland expansion (194.41, 176.32, and 139.42 km2, respectively) in 2000–2010; while in 2010–2020, the top three cities with the largest cropland expansion have been changed to Jingzhou, Yichang, and Xiangyang and the areas of the expanded cropland have been increased to 621.41, 537.73, and 531.73 km2, respectively.

TABLE 2. Area of the expanded construction land and the expanded cropland in 2000–2020 (km2).
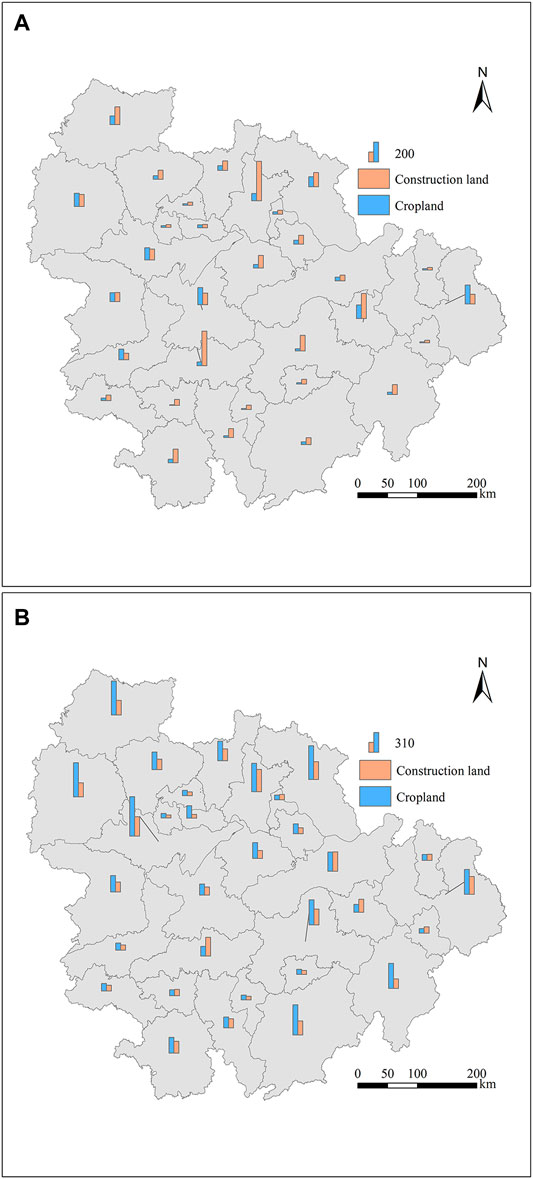
FIGURE 3. Area of the expanded construction land and the expanded cropland in the subresearch area in the periods of (A) 2000–2010 and (B) 2010–2020 (km2).
Figure 3 also shows that the difference between the expanded construction land and the expanded cropland indicates a shrinking trend. In 2000–2010, only five cities, namely, Yichang, Jingzhou, Shangrao, Yueyang, and Yiyang showed that the area of the expanded cropland was larger than that of the expanded construction land. The other cities experience more construction land expansion than cropland expansion, especially in fast developing cities, such as Wuhan and Changsha. In 2010–2020, the area of the expanded cropland showed an increasing pattern, and that of the expanded construction land displays a decreasing trend compared with that in 2000–2010. The phenomenon of the area of the expanded cropland which is larger than that of the expanded construction land happens in nearly all the subresearch area and meets the requirement of cropland protection policies.
By integrating the area of the expanded construction land and the expanded cropland, the sensitivity of cropland expansion to construction land expansion of each city in MRUA was estimated (Figure 4). To gain a clear view of the results, the sensitivity was divided into three levels as follows: low sensitivity
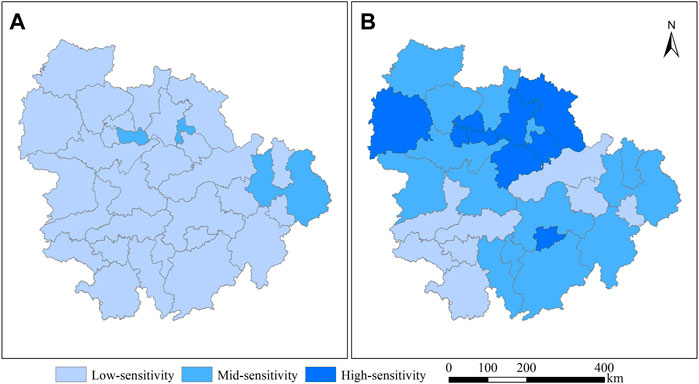
FIGURE 4. Sensitivity of cropland expansion to construction land expansion in the periods of (A) 2000–2010 and (B) 2010–2020.
Overall, the number of cities denoting the sensitivity of mid and high continuously increased and those with low sensitivity kept decreasing over time. During 2000–2010, only three cities were with mid sensitivity and the other cities in MRUA were all at the level of low sensitivity (Figure 4A). In comparison, the number of cities with low sensitivity decreased to eight, whereas the quantity of cities with mid and high sensitivity increased to 14 and nine during 2010–2020, respectively (Figure 4B). Additionally, cities with high sensitivity were mainly located in the north of MRUA. The results of sensitivity analysis in MRUA demonstrate that the area of cropland expansion is becoming increasingly related to the area of construction land expansion over time.
Figure 5 displays the changes of the gravity centers of the expanded construction land and the expanded cropland in 2000–2020, and the change directions and distances of the gravity centers are listed in Table 3. Although the gravity centers were all in Xianning during 2000–2020, the gravity center of the expanded construction land has moved toward the northeast, whereas that of the expanded cropland has continuously changed toward the southeast of the research area. Both the gravity centers of the expanded construction land and expanded cropland show a moving trend toward the east. The moving distances of the gravity centers of the expanded construction land and the expanded cropland experienced little difference with distances of 17.83 and 15.37 km, respectively. With respect to the moving directions, the difference between the expanded construction land and the expanded cropland showed substantial changes. During 2000–2020, the change direction of the gravity center of the expanded construction land was
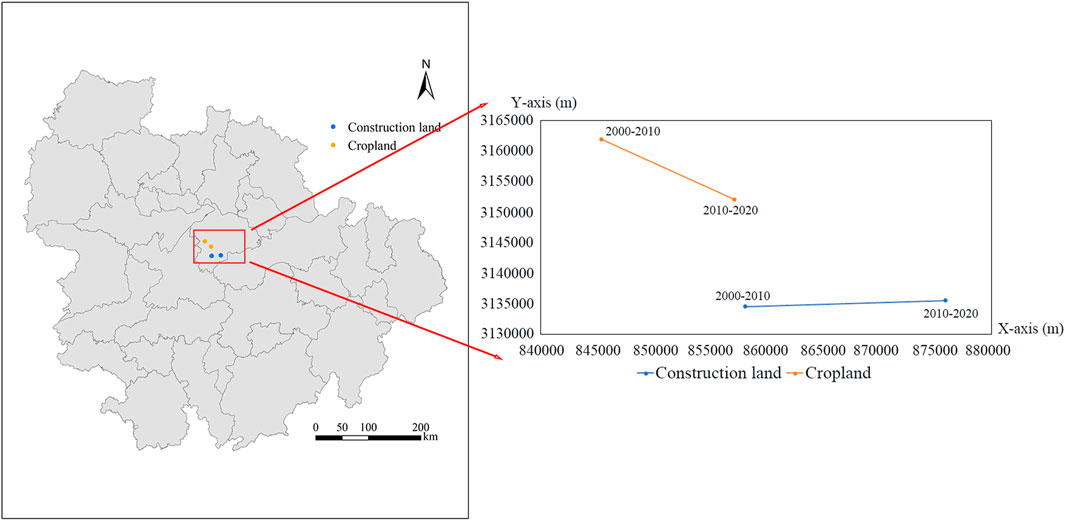
FIGURE 5. Changes of the gravity center of the expanded construction land and the expanded cropland in 2000–2020.

TABLE 3. Moving directions and distances of the gravity centers of the expanded construction land and cropland.
Figure 6 presents the spatiotemporal characteristics of the spatial interaction between the construction land expansion and cropland expansion in each subresearch area from 2000 to 2020. For a clear view, Figure 6 presents the LN format of the values of the interactions. From an overall perspective, the values of the interaction show an increasing trend as follows: the minimum and maximum values of the interaction have increased from 5.65 and 8.72 in 2000–2010 to 7.15 and 9.89 in 2010–2020. For a spatial perspective, in 2000–2010, cities with high values mainly locate in the central and north of the research area; meanwhile, the highest values distribute in the central of the research area. Wuhan, Changsha, Xianning, and Jingzhou were the cities with the highest values of interactions. The lowest values distribute in the south of the research areas, such as Zhuzhou, Xiangtan, and Jingdezhen. For the period of 2010–2020, only three cities showed the lowest values, namely, Yichang, Xiangtan, and Zhuzhou. The highest values occured in Tianmen and Wuhan. Most of the cities with the lowest values in 2000–2010 have increased their interaction values, indicating a good phenomenon for balancing the tradeoffs between construction land expansion and cropland expansion.
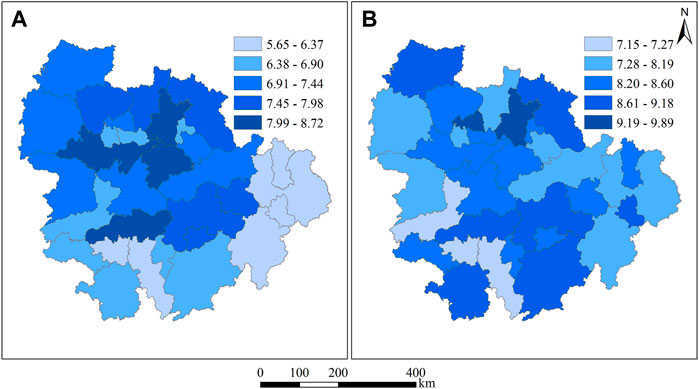
FIGURE 6. LN format of the interaction between the expanded construction land and the expanded cropland in the periods of (A) 2000–2010 and (B) 2010–2020.
The GWR model was utilized to analyze the spatiotemporal heterogeneity of socioeconomic determinants on the interaction between construction land expansion and cropland expansion both in 2000–2010 and 2010–2020. Table 4 shows the performance of the GWR model in 2000–2010 and 2010–2020. The values of AICc in 2000–2010 and 2010–2020 are 580.84 and 219.26, respectively, and the adjusted R2 values are 0.92 and 0.6, respectively, indicating that the GWR model can be used to reveal the spatial and temporal differentiations of socioeconomic determinants. From the summary table of the estimated coefficients (Table 5), we can see considerable variations in the coefficient of each explanatory variable with different positive and negative effects. The standard deviation of GDP and INVEST shows a decreasing trend over time, changing from 5.15 and 4.66 in 2000–2010 to 3.87 and 3.89 in 2010–2020, respectively, whereas that of GDPF and POP displays an increasing pattern (2.7 and 4.76 in 2000–2010 and 4.28 and 5.25 in 2010–2020, respectively).
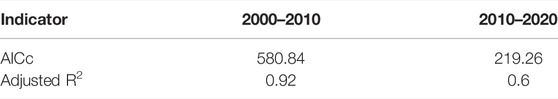
TABLE 4. Performance of the GWR model in the periods of 2000–2010 and 2010–2020.
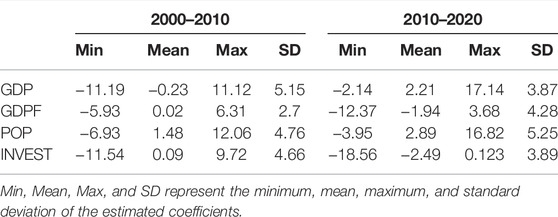
TABLE 5. Summary of the estimated coefficients detected by the GWR model.
Based on the local coefficients estimated by the GWR model and the Natural Breaks Jenks method in ArcGIS 10.2, the coefficients with similar values have been divided in to the same classification level (Figure 7). In addition, to distinguish the positive and negative effects, the authors separated the positive and negative coefficients as follows: blue represents the positive values, and yellow denotes the negative values.
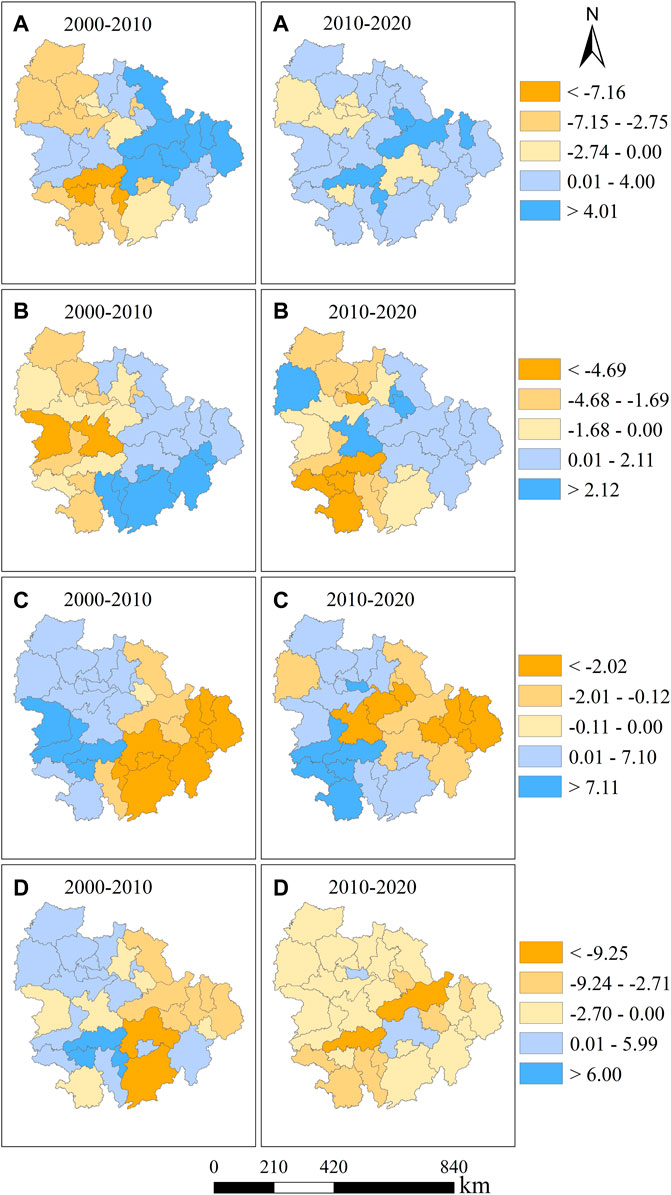
FIGURE 7. Spatiotemporal distributions of the GWR coefficients of socioeconomic determinants in MRUA from 2000 to 2020: (A) GDP, (B) GDPF, (C) POP, and (D) INVEST.
The spatiotemporal effects of GDP on the interaction between the construction land expansion and cropland expansion in 2000–2010 and 2010–2020 are shown in Figure 7A. Overall, the positive effects of GDP displayed an increasing trend, whereas the absolute values of coefficients showed a shrinking pattern. In 2000–2010, the positive coefficients distributed in the south of the research area, and the negative coefficients were located in the northwest and northeast. In 2010–2020, nearly all the subresearch areas displayed with the positive coefficients whereas negative coefficients could only be seen in northwest and were scattered in the middle. The proportions of positive coefficients increased overtime with a proportion of 45.16% in 2000–2010 to 77.42% in 2010–2020 (Table 6).
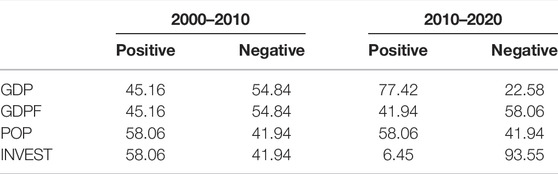
TABLE 6. Proportions of the cities with different types of coefficients (%).
According to Figure 7B, the influence of GDPF on the interaction between construction land expansion and cropland expansion slowly follows the trend of negative effects distributed in the west and positive effects located in the east both in 2000–2010 and 2010–2020. Moreover, the proportions of the positive and negative coefficients are stable in these two time periods (Table 6).
The spatiotemporal effects of POP in 2000–2020 are displayed in Figure 7C, showing an overall pattern of the positive coefficients located in the west and the negative coefficients distributed in the east. The distribution pattern of the POP’s different types of coefficients is nearly reversed with that of the GDPF. Meanwhile, the proportions of the positive and negative coefficients of POP are similar to that of GDPF, with proportions of 58.06 and 41.94% both in 2000–2010 and 2010–2020 (Table 6).
Figure 7D presents the spatiotemporal influences of INVEST on the interaction between construction land expansion and cropland expansion, which shows that the overall pattern of the cities with negative coefficients are continuously increasing over time. In 2000–2010, the positive coefficients could be detected in the northwest and southeast of the research area; whereas in 2010–2020, only two cities had positive coefficients. Therefore, the proportion of the negative coefficients showed a sharp increase, with a proportion of 41.94% in 2000–2010 to 93.55% in 2010–2020 (Table 6).
Taking 31 prefectural cities in MRUA as the case area, this study analyzed the spatiotemporal patterns of the interaction between construction land expansion and cropland expansion and detected their socioeconomic determinants’ effects from 2000 to 2020 by integrating the spatial gravity model and the GWR model. The urbanization and cropland expansion are both hot issues for researchers (Badreldin et al., 2019; Zhou et al., 2021; Wang et al., 2022). Since the implication of cropland protection policies, it is important to assess the implication effect and its consequences (Liu et al., 2017; Ke et al., 2018; Ke et al., 2019; Wang et al., 2020). The interaction analysis of construction land expansion and cropland expansion can directly reflect the requirements of cropland protection policies on the cropland area. Owing to one of the cropland protection policies, Cropland Balance Policy, requests that if the development of construction land takes in cropland, the construction land developer must reclaim the same area of cropland as the loss of cropland due to construction land development through land consolidation, exploitation, or rehabilitation (Lichtenberg and Ding, 2008; Song and Pijanowski, 2014; Liu et al., 2017). The results of the characteristics of the expanded construction land and the expanded cropland showed that during 2000–2020 both construction land and cropland expansions displayed an increasing trend. Additionally, the area of the expanded cropland exceeded those of the expanded construction land in 2010–2020. In the subresearch areas, during 2000–2010, only five cities showed that the area of cropland expansion exceeded that of construction land expansion. This phenomenon nearly happened in all subresearch areas. The value of the interaction of construction land expansion and cropland expansion also showed an overall increasing pattern with the minimum and maximum values increased from 5.65 and 8.72 to 7.15 and 9.89, respectively. All of the aforementioned results have proven that the implementation results of the cropland protection policies are progressively improving over time, which is in line with the conclusions of Yu et al. (2018) and Yang et al. (2020a).
We also identified the spatial and temporal sensitivity of cropland expansion to construction land expansion through sensitivity analysis and drew the shifting map of the gravity centers of the expanded construction land and the expanded cropland. The decrease in the sensitivity of cropland expansion to construction land expansion may cause many problems, such as imbalance of regional land use structures and insufficiency of grain production (Xu et al., 2013; Chai et al., 2019). The sensitivity analysis also demonstrated an increasing pattern of sensitivity of cropland expansion to construction land expansion. Moreover, the proportion of high sensitivity cities is progressively expanding over time, showing that cropland expansion is becoming increasingly sensitive to construction land expansion. The results of the gravity center showed that during 2000–2020, the gravity centers of the expanded construction land and the expanded cropland were all located in one prefectural city, but their shifting patterns were different. Both the gravity centers of the expanded construction land and the expanded cropland shifted to the east in the X-axis direction in 2000–2020, which supported the research of Chai et al. (2019) conducted in Hubei Province. In the Y-axis direction, distinct from the research carried out by Wang et al. (2018), the gravity center of the expanded construction land shifted toward the north and that of the expanded cropland moved toward the south. This phenomenon decided by the DEM of the research area (Figure 1B). The research area presents a pattern of high in the southeast and low in the northwest. People prefer to use the land with low DEM for developing construction land because of the low cost and high repay (Liu et al., 2005; Su et al., 2020), pushing the expanded cropland to the locations with relatively high DEM. Therefore, the gravity center of the expanded cropland moved to the southeast of the research area.
Existing studies have separately discussed the influence factors of construction land and cropland transitions (Ariti et al., 2015; Zelaya et al., 2016; Zhou et al., 2020). However, these studies did not explore the spatiotemporal impacts of socioeconomic determinants on the interaction between construction land expansion and cropland expansion. Thus, this study explored the spatiotemporal heterogeneity of the socioeconomic determinants of the interaction between construction land expansion and cropland expansion for 2000–2010 and 2010–2020 using the GWR model. Four socioeconomic determinants were chosen, namely, GDP, GDPF, POP, and INVEST. The positive impact of GDP showed an increasing pattern over time. The GDP reflects the overall economic level of a region (Xie and Wang, 2015; Gollin et al., 2016). With the improvement of socio economy, the government began to pay extra attention to the implementation of cropland protection (Liu et al., 2017; Piquer-Rodríguez et al., 2018). Therefore, the more construction land expansion, the larger the area of cropland expansion. Then, it promotes the interaction between them. The impacts of GDPF and POP nearly show an inversed distribution pattern. This finding is due to the fact that the economic development of the west of the research area is better than the east. The high GDPF is more attractive for the people in the east for agricultural activities. Thus, the positive impact of GDPF located in the east. By contrast, people in the economically underdeveloped areas prefers to live in the urban areas and the construction land expansion rate brought by population increase in economic developed areas is higher than that in underdeveloped areas (Li et al., 2019; Li et al., 2022). Therefore, the negative effect of POP distributed in the east. The negative influence of INVEST is continuously increasing during 2000–2020 because the investment in fixed assets concentrates on the urban areas and ignores the development in the agricultural areas. This situation leads the unilateral expansion of construction land instead of the joint expansion of construction land and cropland, thus negatively affecting their interaction.
This research contains some limitations. First, only two time periods of construction land expansion and cropland expansion were identified with a time interval of 10 y. Several LUCC-related studies have chosen the time interval of 5 y to better reveal the detailed change in land use changes (Lang et al., 2018; Wu et al., 2021). The time interval in this article can be improved. Second, construction land expansion can also bring the loss of cropland. Future research could explore the relationships among construction land expansion, cropland expansion, and cropland loss. Last, this article identified the spatiotemporal heterogeneity of four socioeconomic determinants on the interaction between construction land expansion and cropland expansion. Several other socioeconomic determinants may also affect the interaction between construction land expansion and cropland expansion. Other determinants should be explored in the future.
This study first detected the spatial and temporal characteristics of construction land expansion and cropland expansion. Then, the sensitivity analysis was applied to identify the sensitivity of cropland expansion to construction land expansion. Next, the gravity center of the expanded construction land and the expanded cropland and their shifting trajectories were detected by the spatial gravity model. Finally, four socioeconomic determinants were chosen, namely, GDP, GDPF, POP, and INVEST, and their impacts on the interaction between construction land expansion and cropland expansion were explored by the GWR model. The results show that the areas of the expanded construction land and expanded cropland and the sensitivity of cropland expansion to construction land expansion demonstrated an overall increasing trend over time in MRUA. The shift trajectories of the expanded construction land and cropland displayed different patterns, where the gravity center of the expanded construction land moved toward the northeast, whereas that of the expanded cropland shifted toward the southeast. The spatiotemporal heterogeneity of socioeconomic determinants of the interaction between construction land expansion and cropland expansion obviously exists in MRUA. The GDP has an increasing positive effect, whereas the investment in fixed assets displays an increasing negative influence during 2000–2020. The GDP in the agricultural sector and the population show a stable effect with half the proportion of the cities having a negative or positive influence. However, the distribution of the negative or positive influence of these two determinants are almost reversed. This study is not only helpful to understand the regional spatiotemporal interaction of construction land and cropland expansions and their socioeconomic determinants but can also offer solutions for the decision makers to promote this interaction and continue the pursuit of sustainable development.
The original contributions presented in the study are included in the article/Supplementary Material, further inquiries can be directed to the corresponding authors.
LW: writing—original draft preparation, methodology, and writing—reviewing and editing. SZ: writing—reviewing editing and methodology. YL (3rd author): writing—reviewing and editing and methodology. YL (4th author): writing—editing and supervision.
This work was supported by the National Key Research and Development Program of China (Grant No. 2017YFB0503601).
The authors declare that the research was conducted in the absence of any commercial or financial relationships that could be construed as a potential conflict of interest.
The handling editor JC declared a past co-authorship with the author YL.
All claims expressed in this article are solely those of the authors and do not necessarily represent those of their affiliated organizations, or those of the publisher, the editors, and the reviewers. Any product that may be evaluated in this article, or claim that may be made by its manufacturer, is not guaranteed or endorsed by the publisher.
Angel, S., Parent, J., Civco, D. L., Blei, A., and Potere, D. (2011). The Dimensions of Global Urban Expansion: Estimates and Projections for All Countries, 2000-2050. Prog. Plann. 75, 53–107. doi:10.1016/j.progress.2011.04.001
Ariti, A. T., van Vliet, J., and Verburg, P. H. (2015). Land-use and Land-Cover Changes in the Central Rift Valley of Ethiopia: Assessment of Perception and Adaptation of Stakeholders. Appl. Geogr. 65, 28–37. doi:10.1016/j.apgeog.2015.10.002
Ariti, A. T., van Vliet, J., and Verburg, P. H. (2018). What Restrains Ethiopian NGOs to Participate in the Development of Policies for Natural Resource Management? Environ. Sci. Pol. 89, 292–299. doi:10.1016/j.envsci.2018.08.008
Asche, F., Bellemare, M. F., Roheim, C., Smith, M. D., and Tveteras, S. (2015). Fair Enough? Food Security and the International Trade of Seafood. World Develop. 67, 151–160. doi:10.1016/j.worlddev.2014.10.013
Badreldin, N., Abu Hatab, A., and Lagerkvist, C.-J. (2019). Spatiotemporal Dynamics of Urbanization and Cropland in the Nile Delta of Egypt Using Machine Learning and Satellite Big Data: Implications for Sustainable Development. Environ. Monit. Assess. 191, 767. doi:10.1007/s10661-019-7934-x
Boudet, F., Macdonald, G. K., Robinson, B. E., and Samberg, L. H. (2019). Rural-urban Connectivity and Agricultural Land Management across the Global South. Glob. Environ. Change 60, 101982. doi:10.1016/j.gloenvcha.2019.101982
Chai, J., Wang, Z., Yang, J., and Zhang, L. (2019). Analysis for Spatial-Temporal Changes of Grain Production and farmland Resource: Evidence from Hubei Province, central China. J. Clean. Prod. 207, 474–482. doi:10.1016/j.jclepro.2018.10.008
Cheng, C., Liu, Y., Chen, Y., Liu, Y., Zhang, Y., Shen, S., et al. (2019). Diagnosing Cropland's Allowable Range and Spatial Allocation in China's Typical Mountainous Plateau Area: An Evaluation Framework Based on Ecological Carrying Capacity. Sci. Total Environ. 685, 1255–1268. doi:10.1016/j.scitotenv.2019.03.200
Cheng, C., Liu, Y., Liu, Y., Yang, R., Hong, Y., Lu, Y., et al. (2020). Cropland Use Sustainability in Cheng-Yu Urban Agglomeration, China: Evaluation Framework, Driving Factors and Development Paths. J. Clean. Prod. 256, 120692. doi:10.1016/j.jclepro.2020.120692
Cheng, P., Tang, H., Dong, Y., Liu, K., Jiang, P., and Liu, Y. (2021). Knowledge Mapping of Research on Land Use Change and Food Security: A Visual Analysis Using Citespace and Vosviewer. IJERPH 18, 13065. doi:10.3390/ijerph182413065
Cullingworth, B., Nadin, V., Hart, T., Davoudi, S., Pendlebury, J., Vigar, G., et al. (2014). Town and Country Planning in the UK. doi:10.4324/9781315742267
Deng, J. S., Wang, K., Hong, Y., and Qi, J. G. (2009). Spatio-temporal Dynamics and Evolution of Land Use Change and Landscape Pattern in Response to Rapid Urbanization. Landscape Urban Plann. 92, 187–198. doi:10.1016/j.landurbplan.2009.05.001
Egli, L., Meyer, C., Scherber, C., Kreft, H., and Tscharntke, T. (2018). Winners and Losers of National and Global Efforts to Reconcile Agricultural Intensification and Biodiversity Conservation. Glob. Change Biol. 24, 2212–2228. doi:10.1111/gcb.14076
Eigenbrod, F., Beckmann, M., Dunnett, S., Graham, L., Holland, R. A., Meyfroidt, P., et al. (2020). Identifying Agricultural Frontiers for Modeling Global Cropland Expansion. One Earth 3, 504–514. doi:10.1016/j.oneear.2020.09.006
Folberth, C., Khabarov, N., Balkovič, J., Skalský, R., Visconti, P., Ciais, P., et al. (2020). The Global Cropland-Sparing Potential of High-Yield Farming. Nat. Sustain. 3, 281–289. doi:10.1038/s41893-020-0505-x
Foley, J. A., Ramankutty, N., Brauman, K. A., Cassidy, E. S., Gerber, J. S., Johnston, M., et al. (2011). Solutions for a Cultivated Planet. Nature 478, 337–342. doi:10.1038/nature10452
Fotheringham, A. S., Charlton, M., and Brunsdon, C. (1996). The Geography of Parameter Space: an Investigation of Spatial Non-stationarity. Int. J. Geog. Inf. Sci. 10, 605–627. doi:10.1080/026937996137909
Gollin, D., Jedwab, R., and Vollrath, D. (2016). Urbanization with and without Industrialization. J. Econ. Growth 21, 35–70. doi:10.1007/s10887-015-9121-4
Guo, B., Wang, X., Pei, L., Su, Y., Zhang, D., and Wang, Y. (2021). Identifying the Spatiotemporal Dynamic of PM2.5 Concentrations at Multiple Scales Using Geographically and Temporally Weighted Regression Model across China during 2015-2018. Sci. Total Environ. 751, 141765. doi:10.1016/j.scitotenv.2020.141765
Haase, D., Schwarz, N., Strohbach, M., Kroll, F., and Seppelt, R. (2012). Synergies, Trade-Offs, and Losses of Ecosystem Services in Urban Regions: an Integrated Multiscale Framework Applied to the Leipzig-Halle Region, Germany. E&S 17. doi:10.5751/ES-04853-170322
Han, Z., Song, W., and Deng, X. (2016). Responses of Ecosystem Service to Land Use Change in Qinghai Province. Energies 9, 303. doi:10.3390/en9040303
He, C., Liu, Z., Tian, J., and Ma, Q. (2014). Urban Expansion Dynamics and Natural Habitat Loss in China: A Multiscale Landscape Perspective. Glob. Change Biol. 20, 2886–2902. doi:10.1111/gcb.12553
He, X., Yan, J., and Cheng, X. (2021). Household Perspective on Cropland Expansion on the Tibetan Plateau. Reg. Environ. Change 21. doi:10.1007/s10113-021-01752-8
Ke, X., van Vliet, J., Zhou, T., Verburg, P. H., Zheng, W., and Liu, X. (2018). Direct and Indirect Loss of Natural Habitat Due to Built-Up Area Expansion: A Model-Based Analysis for the City of Wuhan, China. Land Use Policy 74, 231–239. doi:10.1016/j.landusepol.2017.12.048
Ke, X., Wang, L., Ma, Y., Pu, K., Zhou, T., Xiao, B., et al. (2019). Impacts of Strict Cropland Protection on Water Yield: A Case Study of Wuhan, China. Sustainability 11, 184. doi:10.3390/su11010184
Lambin, E. F., and Meyfroidt, P. (2011). Global Land Use Change, Economic Globalization, and the Looming Land Scarcity. Proc. Natl. Acad. Sci. U.S.A. 108, 3465–3472. doi:10.1073/pnas.1100480108
Lang, Y., Song, W., and Deng, X. (2018). Projected Land Use Changes Impacts on Water Yields in the Karst Mountain Areas of China. Phys. Chem. Earth Parts A/B/C 104, 66–75. doi:10.1016/j.pce.2017.11.001
Li, H., Song, Y., and Zhang, M. (2018). Study on the Gravity center Evolution of Air Pollution in Yangtze River Delta of China. Nat. Hazards 90, 1447–1459. doi:10.1007/s11069-017-3110-1
Li, M., van Vliet, J., Ke, X., and Verburg, P. H. (2019). Mapping Settlement Systems in China and Their Change Trajectories between 1990 and 2010. Habitat Int. 94, 102069. doi:10.1016/j.habitatint.2019.102069
Li, M., Verburg, P. H., and van Vliet, J. (2022). Global Trends and Local Variations in Land Take Per Person. Landscape Urban Plann. 218, 104308. doi:10.1016/j.landurbplan.2021.104308
Lichtenberg, E., and Ding, C. (2008). Assessing farmland protection Policy in China. Land use policy 25, 59–68. doi:10.1016/j.landusepol.2006.01.005
Liu, J., Zhan, J., and Deng, X. (2005). Spatio-temporal Patterns and Driving Forces of Urban Land Expansion in China during the Economic Reform Era. AMBIO: A J. Hum. Environ. 34, 450–455. doi:10.1579/0044-7447-34.6.450
Liu, J., Zhang, Z., Xu, X., Kuang, W., Zhou, W., Zhang, S., et al. (2010). Spatial Patterns and Driving Forces of Land Use Change in China during the Early 21st century. J. Geogr. Sci. 20, 483–494. doi:10.1007/s11442-010-0483-4
Liu, J., Kuang, W., Zhang, Z., Xu, X., Qin, Y., Ning, J., et al. (2014a). Spatiotemporal Characteristics, Patterns, and Causes of Land-Use Changes in China since the Late 1980s. J. Geogr. Sci. 24, 195–210. doi:10.1007/s11442-014-1082-6
Liu, L., Xu, X., and Chen, X. (2014b). Assessing the Impact of Urban Expansion on Potential Crop Yield in China during 1990-2010. Food Sec. 7, 33–43. doi:10.1007/s12571-014-0411-z
Liu, X., Zhao, C., and Song, W. (2017). Review of the Evolution of Cultivated Land protection Policies in the Period Following China's Reform and Liberalization. Land Use Policy 67, 660–669. doi:10.1016/j.landusepol.2017.07.012
Liu, J., Jiao, L., Zhang, B., Xu, G., Yang, L., Dong, T., et al. (2021). New Indices to Capture the Evolution Characteristics of Urban Expansion Structure and Form. Ecol. Indicators 122, 107302. doi:10.1016/j.ecolind.2020.107302
Mauser, W., Klepper, G., Zabel, F., Delzeit, R., Hank, T., Putzenlechner, B., et al. (2015). Global Biomass Production Potentials Exceed Expected Future Demand without the Need for Cropland Expansion. Nat. Commun. 6. doi:10.1038/ncomms9946
Millennium Ecosystem Assessment (2005). Ecosystems and Human Well-Being: Synthesis. ISBN: 1-56973-590-5.
Mohmmed, A., Li, Z., Olushola Arowolo, A., Su, H., Deng, X., Najmuddin, O., et al. (2019). Driving Factors of CO2 Emissions and Nexus with Economic Growth, Development and Human Health in the Top Ten Emitting Countries. Resour. Conserv. Recycl. 148, 157–169. doi:10.1016/j.resconrec.2019.03.048
Monk, S., Whitehead, C., Burgess, G., and Tang, C. (2013). International Review of Land Supply and Planning Systems. London: Joseph Rowntree Foundation, 1–110.
Pan, D., Hong, W., and Kong, F. (2020). Efficiency Evaluation of Urban Wastewater Treatment: Evidence from 113 Cities in the Yangtze River Economic Belt of China. J. Environ. Manage. 270, 110940. doi:10.1016/j.jenvman.2020.110940
Piquer-Rodríguez, M., Butsic, V., Gärtner, P., Macchi, L., Baumann, M., Gavier Pizarro, G., et al. (2018). Drivers of Agricultural Land-Use Change in the Argentine Pampas and Chaco Regions. Appl. Geogr. 91, 111–122. doi:10.1016/j.apgeog.2018.01.004
Punzo, G., Castellano, R., and Bruno, E. (2022). Using Geographically Weighted Regressions to Explore Spatial Heterogeneity of Land Use Influencing Factors in Campania (Southern Italy). Land Use Policy 112, 105853. doi:10.1016/j.landusepol.2021.105853
Qiu, L., Pan, Y., Zhu, J., Amable, G. S., and Xu, B. (2019). Integrated Analysis of Urbanization-Triggered Land Use Change Trajectory and Implications for Ecological Land Management: A Case Study in Fuyang, China. Sci. Total Environ. 660, 209–217. doi:10.1016/j.scitotenv.2018.12.320
Salerno, F., Gaetano, V., and Gianni, T. (2018). Urbanization and Climate Change Impacts on Surface Water Quality: Enhancing the Resilience by Reducing Impervious Surfaces. Water Res. 144, 491–502. doi:10.1016/j.watres.2018.07.058
Sarparast, M., Ownegh, M., and Sepehr, A. (2020). Investigation the Driving Forces of Land-Use Change in Northeastern Iran: Causes and Effects. Remote Sensing Appl. Soc. Environ. 19, 100348. doi:10.1016/j.rsase.2020.100348
Seto, K. C., Güneralp, B., and Hutyra, L. R. (2012). Global Forecasts of Urban Expansion to 2030 and Direct Impacts on Biodiversity and Carbon Pools. Proc. Natl. Acad. Sci. U.S.A. 109, 16083–16088. doi:10.1073/pnas.1211658109
Shu, C., Xie, H., Jiang, J., and Chen, Q. (2018). Is Urban Land Development Driven by Economic Development or Fiscal Revenue Stimuli in China? Land Use Policy 77, 107–115. doi:10.1016/j.landusepol.2018.05.031
Song, W., and Liu, M. (2017). Farmland Conversion Decreases Regional and National Land Quality in China. Land Degrad. Develop. 28, 459–471. doi:10.1002/ldr.2518
Song, W., and Pijanowski, B. C. (2014). The Effects of China's Cultivated Land Balance Program on Potential Land Productivity at a National Scale. Appl. Geogr. 46, 158–170. doi:10.1016/j.apgeog.2013.11.009
Song, X.-P., Hansen, M. C., Stehman, S. V., Potapov, P. V., Tyukavina, A., Vermote, E. F., et al. (2018). Global Land Change from 1982 to 2016. Nature 560, 639–643. doi:10.1038/s41586-018-0411-9
Souza, D. O. d., Alvalá, R. C. d. S., and Nascimento, M. G. d. (2016). Urbanization Effects on the Microclimate of Manaus: A Modeling Study. Atmos. Res. 167, 237–248. doi:10.1016/j.atmosres.2015.08.016
Su, S., Xiao, R., Jiang, Z., and Zhang, Y. (2012). Characterizing Landscape Pattern and Ecosystem Service Value Changes for Urbanization Impacts at an Eco-Regional Scale. Appl. Geogr. 34, 295–305. doi:10.1016/j.apgeog.2011.12.001
Su, S., Li, D., Hu, Y. n., Xiao, R., and Zhang, Y. (2014). Spatially Non-stationary Response of Ecosystem Service Value Changes to Urbanization in Shanghai, China. Ecol. Indicators 45, 332–339. doi:10.1016/j.ecolind.2014.04.031
Su, Y., Qian, K., Lin, L., Wang, K., Guan, T., and Gan, M. (2020). Identifying the Driving Forces of Non-grain Production Expansion in Rural China and its Implications for Policies on Cultivated Land protection. Land Use Policy 92, 104435. doi:10.1016/j.landusepol.2019.104435
Tang, L., Ke, X., Chen, Y., Wang, L., Zhou, Q., Zheng, W., et al. (2021). Which Impacts More Seriously on Natural Habitat Loss and Degradation? Cropland Expansion or Urban Expansion? Land Degrad. Dev. 32, 946–964. doi:10.1002/ldr.3768
Tesfaw, A. T., Pfaff, A., Golden Kroner, R. E., Qin, S., Medeiros, R., and Mascia, M. B. (2018). Land-use and Land-Cover Change Shape the Sustainability and Impacts of Protected Areas. Proc. Natl. Acad. Sci. U.S.A. 115, 2084–2089. doi:10.1073/pnas.1716462115
Tian, G., Duan, J., and Yang, L. (2021). Spatio-temporal Pattern and Driving Mechanisms of Cropland Circulation in China. Land Use Policy 100, 105118. doi:10.1016/j.landusepol.2020.105118
Tu, Y., Chen, B., Yu, L., Xin, Q., Gong, P., and Xu, B. (2021). How Does Urban Expansion Interact with Cropland Loss? A Comparison of 14 Chinese Cities from 1980 to 2015. Landscape Ecol. 36, 243–263. doi:10.1007/s10980-020-01137-y
Uisso, A. M., and Tanrıvermiş, H. (2021). Driving Factors and Assessment of Changes in the Use of Arable Land in Tanzania. Land Use Policy 104, 105359. doi:10.1016/j.landusepol.2021.105359
van Vliet, J., Eitelberg, D. A., and Verburg, P. H. (2017). A Global Analysis of Land Take in Cropland Areas and Production Displacement from Urbanization. Glob. Environ. Change 43, 107–115. doi:10.1016/j.gloenvcha.2017.02.001
Wang, J., Zhang, Z., and Liu, Y. (2018). Spatial Shifts in Grain Production Increases in China and Implications for Food Security. Land Use Policy 74, 204–213. doi:10.1016/j.landusepol.2017.11.037
Wang, L., Ke, X., and Abu Hatab, A. (2020). Trade-offs between Economic Benefits and Ecosystem Services Value under Three Cropland protection Scenarios for Wuhan City in China. Land 9, 117–17. doi:10.3390/land9040117
Wang, L., Zheng, W., Tang, L., Zhang, S., Liu, Y., and Ke, X. (2021). Spatial Optimization of Urban Land and Cropland Based on Land Production Capacity to Balance Cropland protection and Ecological Conservation. J. Environ. Manage. 285, 112054. doi:10.1016/j.jenvman.2021.112054
Wang, L., Zhang, S., Tang, L., Lu, Y., Liu, Y., and Liu, Y. (2022). Optimizing Distribution of Urban Land on the Basis of Urban Land Use Intensity at Prefectural City Scale in mainland China. Land Use Policy 115, 106037. doi:10.1016/j.landusepol.2022.106037
Wu, C., Chen, B., Huang, X., and Dennis Wei, Y. H. (2020). Effect of Land-Use Change and Optimization on the Ecosystem Service Values of Jiangsu Province, China. Ecol. Indicators 117, 106507. doi:10.1016/j.ecolind.2020.106507
Wu, R., Li, Z., and Wang, S. (2021). The Varying Driving Forces of Urban Land Expansion in China: Insights from a Spatial-Temporal Analysis. Sci. Total Environ. 766, 142591. doi:10.1016/j.scitotenv.2020.142591
Xie, H., and Wang, W. (2015). Exploring the Spatial-Temporal Disparities of Urban Land Use Economic Efficiency in china and its Influencing Factors under Environmental Constraints Based on a Sequential Slacks-Based Model. Sustainability 7, 10171–10190. doi:10.3390/su70810171
Xu, S.-w., Wu, J.-z., Song, W., Li, Z.-q., Li, Z. m., and Kong, F.-t. (2013). Spatial-Temporal Changes in Grain Production, Consumption and Driving Mechanism in China. J. Integr. Agric. 12, 374–385. doi:10.1016/S2095-3119(13)60236-1
Yang, B., Ke, X., van Vliet, J., Yu, Q., Zhou, T., and Verburg, P. H. (2020a). Impact of Cropland Displacement on the Potential Crop Production in China: a Multi-Scale Analysis. Reg. Environ. Change 20. doi:10.1007/s10113-020-01690-x
Yang, J., Zeng, C., and Cheng, Y. (2020b). Spatial Influence of Ecological Networks on Land Use Intensity. Sci. Total Environ. 717, 137151. doi:10.1016/j.scitotenv.2020.137151
Yu, Q., Hu, Q., van Vliet, J., Verburg, P. H., and Wu, W. (2018). GlobeLand30 Shows Little Cropland Area Loss but Greater Fragmentation in China. Int. J. Appl. Earth Obs. Geoinf. 66, 37–45. doi:10.1016/j.jag.2017.11.002
Zabel, F., Delzeit, R., Schneider, J. M., Seppelt, R., Mauser, W., and Václavík, T. (2019). Global Impacts of Future Cropland Expansion and Intensification on Agricultural Markets and Biodiversity. Nat. Commun. 10, 1–10. doi:10.1038/s41467-019-10775-z
Zelaya, K., van Vliet, J., and Verburg, P. H. (2016). Characterization and Analysis of Farm System Changes in the Mar Chiquita basin, Argentina. Appl. Geogr. 68, 95–103. doi:10.1016/j.apgeog.2016.02.001
Zeng, C., Song, Y., Cai, D., Hu, P., Cui, H., Yang, J., et al. (2019). Exploration on the Spatial Spillover Effect of Infrastructure Network on Urbanization: A Case Study in Wuhan Urban Agglomeration. Sustain. Cities Soc. 47, 101476. doi:10.1016/j.scs.2019.101476
Zhang, Y., Zhang, J., Yang, Z., and Li, J. (2012). Analysis of the Distribution and Evolution of Energy Supply and Demand Centers of Gravity in China. Energy Policy 49, 695–706. doi:10.1016/j.enpol.2012.07.012
Zhang, P., Yang, D., Qin, M., and Jing, W. (2020). Spatial Heterogeneity Analysis and Driving Forces Exploring of Built-Up Land Development Intensity in Chinese Prefecture-Level Cities and Implications for Future Urban Land Intensive Use. Land Use Policy 99, 104958. doi:10.1016/j.landusepol.2020.104958
Zhang, Y., Wang, W., and Feng, Y. (2022). Impact of Different Models of Rural Land Consolidation on Rural Household Poverty Vulnerability. Land Use Policy 114, 105963. doi:10.1016/j.landusepol.2021.105963
Zhong, T.-Y., Huang, X.-J., Zhang, X.-Y., and Wang, K. (2011). Temporal and Spatial Variability of Agricultural Land Loss in Relation to Policy and Accessibility in a Low Hilly Region of Southeast China. Land Use Policy 28, 762–769. doi:10.1016/j.landusepol.2011.01.004
Zhou, Y., Li, X., and Liu, Y. (2020). Land Use Change and Driving Factors in Rural China during the Period 1995-2015. Land Use Policy 99, 105048. doi:10.1016/j.landusepol.2020.105048
Keywords: gravity center, cropland protection, GWR, sensitivity analysis, urban agglomeration
Citation: Wang L, Zhang S, Liu Y and Liu Y (2022) Interaction Between Construction Land Expansion and Cropland Expansion and Its Socioeconomic Determinants: Evidence From Urban Agglomeration in the Middle Reaches of the Yangtze River, China. Front. Environ. Sci. 10:882582. doi: 10.3389/fenvs.2022.882582
Received: 24 February 2022; Accepted: 14 March 2022;
Published: 12 April 2022.
Edited by:
Jiaxing Cui, Central China Normal University, ChinaReviewed by:
Bohan Yang, Central China Normal University, ChinaCopyright © 2022 Wang, Zhang, Liu and Liu. This is an open-access article distributed under the terms of the Creative Commons Attribution License (CC BY). The use, distribution or reproduction in other forums is permitted, provided the original author(s) and the copyright owner(s) are credited and that the original publication in this journal is cited, in accordance with accepted academic practice. No use, distribution or reproduction is permitted which does not comply with these terms.
*Correspondence: Yaolin Liu, eWFvbGluNjEwQDE2My5jb20=
Disclaimer: All claims expressed in this article are solely those of the authors and do not necessarily represent those of their affiliated organizations, or those of the publisher, the editors and the reviewers. Any product that may be evaluated in this article or claim that may be made by its manufacturer is not guaranteed or endorsed by the publisher.
Research integrity at Frontiers
Learn more about the work of our research integrity team to safeguard the quality of each article we publish.