 Mingyue Fan
 Zhiying Wu
 Sikandar Ali Qalati
 Di He
Di He Rana Yassir Hussain
94% of researchers rate our articles as excellent or good
Learn more about the work of our research integrity team to safeguard the quality of each article we publish.
Find out more
ORIGINAL RESEARCH article
Front. Environ. Sci., 24 May 2022
Sec. Environmental Economics and Management
Volume 10 - 2022 | https://doi.org/10.3389/fenvs.2022.879590
This article is part of the Research TopicFinancial and Trade Globalization, Greener Technologies and Energy TransitionView all 46 articles
Based on the logistics performance index proposed by the World Bank, this study uses the entropy method to construct the green logistics performance index and empirically analyzes the impact of the green logistics performance of Regional Comprehensive Economic Partnership (RCEP) countries on China’s export trade using the expanded trade gravity model. The results show that the green logistics performance of RCEP countries can significantly promote China’s export trade to RCEP countries, and various measures to improve green logistics performance have different impacts on China’s export trade. The order of influence degree is the efficiency of a customs clearance procedure, the convenience of arranging freight with a competitive price, the timeliness of cargo transportation, the ability and quality of logistics service, and the intensity of CO2 and N2O emission. To promote China’s export trade, we should give full play to the functions of the customs of various countries and improve the efficiency of regulatory procedures. The regression results reveal that GLPI has a significant and positive impact on export trade RCEP countries, as indicated by the coefficient value of 2.887 at a 1% level of significance. The component factors of GLPI also positively and significantly influence the export trade, but carbon emissions and nitrogen emissions proved to be negative. This study establish with RCEP countries, promote the layout of logistics transport routes among RCEP members, and enhance the popularity of green logistics services; Give full play to the positive role of regional economic organizations and mechanisms, and promote green logistics cooperation between RCEP member countries with high and low GLPI; Through logistics planning, logistics policy and advanced low-carbon logistics technology, promote sustainable development of green logistics.
In today’s prevalent trade protectionism, tariff reduction is a frontal counterattack to trade protectionism. The Regional Comprehensive Economic Partnership (RCEP) is a regional free trade agreement that covers both trade and non-trade-related issues, including rules of origin, trade facilitation, intellectual property rights, and investment (Suvannaphakdy, 2021). RCEP includes 15 member countries, including China, Japan, South Korea, Australia, and New Zealand, and ten ASEAN countries, with the total population, economic volume, and total trade accounting for about 30% of the world (Erokhin, 2020). Under the rules of RCEP, this region with the largest population, most diverse structure, and the greatest development potential in the world will usher in a new round of growth. Monitor (2020) stated that RCEP is expected to boost member countries’ export growth by more than 10% above the baseline by 2025.
Greenhouse gas emissions are the direct cause of global warming, which is an urgent problem to be solved in the process of economic development. At the same time, greenhouse gas emission is also a phenomenon that cannot be ignored in green logistics and has gradually become an indispensable content in the study of green logistics. Liu evaluated the impact of fuel cell vehicles on GHG emissions from China’s road fleet (Liu et al., 2018), while Yan and Sun investigated the impact of electric vehicle development on GHG emissions and fossil energy consumption in China from a life cycle perspective and based on automotive technology and China’s energy development plan, exploring the potential of energy-saving and emission reduction of electric vehicles (Yan and Sun, 2021). At present, although some scholars have added the related effects of carbon dioxide (CO2) emissions in the study of the Logistics Performance Index (LPI) (Mariano et al., 2017), CO2 emissions account for 75% of greenhouse gas emissions (Teng et al., 2019), so it can be inferred that greenhouse gas emissions are far more far-reaching than CO2 emissions. In addition, the consumption of fossil fuels is the core problem of logistics operations. The higher the utilization rate, the greater the damage to society and the environment. This study contributes to the existing literature in several ways. First, a green logistic performance index is constructed, whereas most of the previous literature focuses on logistic performance only. Green logistics is of great significance to environmental protection, social progress, and economic growth (Khan et al., 2019). Therefore, this study adds greenhouse gas emissions and fossil fuel consumption as important factors affecting green logistics to the original LPI to construct the green logistics performance index (GLPI). On this basis, the LPI index, greenhouse gas emissions, fossil fuel consumption, and export trade data of RCEP15 countries from 2012 to 2018 are collected, and the influence of GLPI and each sub-index on China’s export trade is empirically analyzed using the extended gravity model. Second, this study focuses on the trade by China to RCEP countries as there is a serious lack of literature on this, in order to promote the development of China’s export trade and regional economic integration to provide suggestions.
With the strengthening of regional economic integration, trans-regional trade has become more frequent, and the market competition between regions has become more intense. Therefore, logistics has become a key link in trade competition (Ahmadi and Taghizadeh, 2019; Tang and Wang, 2020). Under the background of green and low carbon, green logistics is an effective way to deal with the “green barriers” of international trade and achieve sustainable development of trade (Ren and Huang, 2015). With the further expansion of intra-regional trade volume, the improvement of green logistics performance will further optimize the regional trade environment. Li et al. (2021) proved the importance of green logistics in enhancing green economic activities in One Belt One Road Initiative countries. Karaduman et al., 2020 also established a significant positive influence of logistics performance on carbon emission performance of the Balkan region. Khan et al., 2020 showed that logistics performance improves the environmental and economic conditions through the utilization of renewable energy, leading to a reduction in emissions. Table 1 provides the recent evidence that establishes the link between logistics performance and trade.

TABLE 1. Recent evidence on logistics performance and trade.
As a new trend in the development of modern logistics, there are relatively few studies on the impact of green logistics performance on regional trade in the academic circle, and most of the literature is about the impact of logistics performance on international trade (Wang et al., 2018). Related research can be roughly divided into two categories. The first category mainly analyzes the impact of overall logistics performance indicators on international trade. For example, Saslavsky and Shepherd (2014) investigated the effects of logistics performance on trade in parts and components within international production networks and found that logistics performance has a greater impact on parts trade than final product trade. Önsel Ekici et al. (2016) verified the positive effect of logistics performance on international trade with the help of the LPI index. Gani (2017) estimated the impact of logistics performance on international trade using transnational data from many country samples and found that logistics performance had a statistically significant positive impact on trade flows, especially exports. Siddiqui and Vita (2019) used panel data analysis to study the impact of logistics performance on the trade of the garment industry in Cambodia, Bangladesh, and India and concluded that logistics has a significant impact on trade. Riadh (2020) believed that logistics performance promotes international trade because it first reduces transportation costs to improve trade, thus further expanding international trade. Töngür et al. (2020) empirically analyzed the impact of Turkish logistics performance on export through the gravity model and found that logistics performance had a positive impact on export value. Its impact on emerging markets was greater than on international markets (Taghizadech and Ahmadi, 2019; Ahmadi, 2021). In addition, improved logistics performance in Turkey has a more significant impact on exports than that of import partners.
The second kind of research analyzes the specific impact of each sub-index of logistics performance on international trade. For example, Marti and Puertas (2017) analyzed the impact of various sub-indexes constituting the LPI index on the trade of emerging countries. The importance of the LPI sub-indices has increased in the international trade of many emerging countries in Africa, South America, and Eastern Europe (Marti and Puertas, 2017). Çelebi (2019) compared the impact of various sub-indicators of logistics performance on trade and found that good logistics is more beneficial to the export of middle- and low-income countries, while it is the opposite for middle- and high-income countries. Zaninović et al. (2021) tested the homogeneity of logistics performance of EU countries and found that the greater the difference of each sub-index of the LPI index, the lower the trade between trading partners. In the case of EU-15 countries trading with other countries, the LPI sub-index of ease of arranging freight at competitive prices has the greatest negative impact on trade with trading partners. Mendes dos Reis et al. (2020) used bilateral soybean export data of Argentina, Brazil, the United States, and their partners to verify the performance of different components of logistics performance in trade. Their study found that logistics infrastructure can significantly positively promote the development of soybean trade. Rashida and Cullinane (2019) used data envelopment analysis to evaluate if the national logistic performance is sustainable or not in OECD nations. Tan et al. (2020) introduced blockchain green logistics to determine the sustainable operations of logistics. Zhang et al. (2020) addressed the policy aspects of green logistics, green growth, and sustainable growth and discovered various factors that improve GLP based on grounded theory. Khan et al. (2019) observed a strong influence of macro-level environmental, social, and economic indicators on GLPI in South Asian Association for Regional Cooperation (SAARC) countries.
In conclusion, the existing literature on the logistics performance study of the impact of international trade is rich. However, in research methods, domestic and foreign scholars mostly use the LPI index to measure the logistics performance but ignore the era background, in the green low carbon greenhouse gas emissions and fossil fuel consumption influence on logistics performance. At the same time, from the perspective of RCEP, there is no literature on the performance of green logistics in RCEP countries and its impact on China’s export trade. Therefore, this study aims to take green logistics performance as the entry point and empirically analyze the impact of green logistics performance in RCEP countries on China’s export trade by constructing a GLPI index based on the extended gravity model. The aim is to provide decision-making support for improving the green logistics performance of RCEP member countries and expanding the scale of China’s export trade.
As a new mode of modern logistics, compared with traditional logistics, green logistics not only restrains the harm caused by logistics to the environment in the process of logistics but also purifies the logistics environment and makes the best use of logistics resources (Seroka-Stolka and Ociepa-Kubicka, 2019). Based on the relationship between green logistics and traditional logistics, that is, green logistics is the extension of traditional logistics in the context of the green and low-carbon era, this study believes that the understanding of the connotation of green logistics performance should be based on the concept of traditional logistics performance, combined with the concept of green development, necessary expansion, and extension.
Traditional logistics performance is more concerned with low-cost and efficient logistics services in the logistics process. In the era of green development, the performance of green logistics should pay more attention to the friendliness and conservation of the environment and resources in the logistics process. Traditional logistics performance is usually measured by the LPI index. It mainly includes the efficiency of customs clearance procedures, the quality of trade and transportation-related infrastructure, the convenience of arranging freight at competitive prices, the ability and quality of logistics services, the ability to trace goods, and the timeliness of goods transportation. The timeliness was on six sides. The GLPI index should pay more attention to greenhouse gas emission intensity and fossil fuel consumption in the logistics process on the basis of six aspects of the traditional LPI index.
On the basis of six sub-indexes of the traditional LPI index, this study introduces green level indexes, including the greenhouse gas emission intensity index and fossil fuel consumption index to construct the GLPI index. Among them, greenhouse gas emission intensity indicators include CO2 emission intensity, N2O emission intensity, methane emission intensity (CH4), and fluorine greenhouse gas emission intensity (Fgas). The fossil fuel index includes fossil fuel consumption. The sub-indexes of the GLPI index and their sources are shown in Table 2. The LPI index for missing years is replaced by the mean of adjacent years.
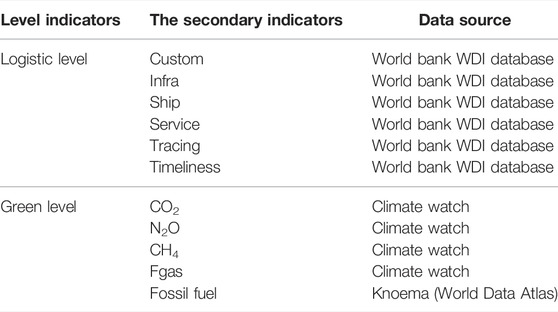
TABLE 2. Sub-indexes of GLPI index and their sources.
This study first collected the CO2 emission intensity, N2O emission intensity, CH4 emission intensity, Fgas emission intensity, and fossil fuel consumption of 14 RCEP countries except for China and calculated the green level score using the entropy method. Then, the LPI index and green level score released by the World Bank are processed by the entropy method again, and the result is the GLPI index of RCEP14 countries from 2012 to 2018 (Table 3).

TABLE 3. Performance of green logistics in RCEP14 countries during 2012–2018.
As sown in Table 2, there is a large gap in green logistics performance among RCEP sample countries, and the GLPI index of ten ASEAN countries is lower than that of the four non-ASEAN countries in the region. Specifically, Singapore’s GLPI index is at the top of RCEP sample countries, with an average of 2.6 points from 2012 to 2018. However, the mean GLPI index of Laos and Myanmar is at the end of the RCEP sample countries, and the mean GLPI index is only 1.5 points. In addition, among the RCEP sample countries except for Singapore, the GLPI indices of Japan, Australia, South Korea, and New Zealand rank at the top, with average values of 2.5, 2.4, 2.3, and 2.3, respectively. The GLPI value of Laos, Myanmar, and Cambodia has been observed below 2 from 2012–2018.
In order to further analyze the underlying reasons for the differences in green logistics performance in RCEP sample countries, this study observed the mean values of GLPI sub-indexes in 2012, 2014, 2016, and 2018. Figure 1 shows the mean values of each sub-index in RCEP sample countries. It can be seen that, for Singapore, a country with a high GLPI index, the development of six sub-indicators of logistics level is balanced. Among them, the ability to track and query goods and the efficiency of custom clearance procedures have the greatest effect on the improvement of green logistics performance. Moreover, the emission intensity and fossil fuel consumption of CO2, N2O, CH4, and Fgas are relatively low. For countries with a low GLPI index, such as Laos and Myanmar, the efficiency of customs clearance procedures is a weak link, and the timeliness of cargo transportation is also a weak link in green logistics in the region. Meanwhile, the emission intensity and fossil fuel consumption of CO2, N2O, CH4, and Fgas are relatively high, which lower the GLPI index scores of the two countries.
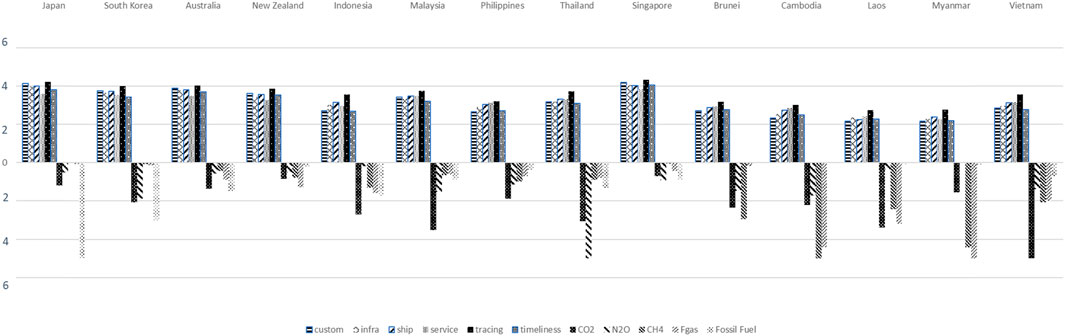
FIGURE 1. Mean value of GLPI sub-indexes in RCEP sample countries.
Figure 2 shows the mean green level and logistics level of RCEP sample countries. Among them, Myanmar and Laos, with a lower GLPI index, have lower mean green and logistics levels. Singapore, Japan, Australia, South Korea, and New Zealand, with a higher GLPI index, have higher mean green and logistics levels. In general, with Singapore as the benchmark, there is still room for improvement in the GLPI performance of RCEP sample countries.
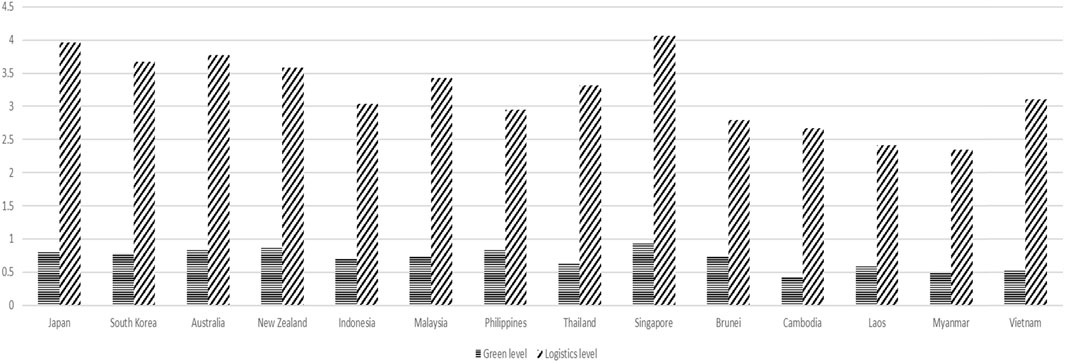
FIGURE 2. Mean green level and logistics level of RCEP sample countries.
The gravity model was first introduced into the field of international trade by Pöyhönen (1963) when he studied the relationship between trade scale, GDP of each country, and the distance between two countries. The research found that the trade volume of two countries was directly proportional to their respective economic aggregates. It is inversely proportional to the geographical distance between the two countries (Pöyhönen, 1963; Ahmadi et al., 2019). Among the traditional models for the explanation of export trade, the trade gravity model of Tinbergen (1962) has a strong ability to explain export trade. The basic meaning of this model is that the trade scale between two countries is directly proportional to the GDP of the two countries and inversely proportional to the distance between them. The basic equation of the trade gravity model is
GDPi represents the economic scale of country i; GDPj represents the economic scale of country j; and DISij represents the geographical distance between country i and country j.
This study aims to make an empirical analysis of the impact of green logistics performance on China’s export trade, so the green logistics performance index (GLPI) is added on the basis of the basic gravity model. At the same time, the two dummy variables of whether China is a member of Asia-Pacific Economic Cooperation (APEC) and whether it is a member of ASEAN (ASEAN) were added to investigate the impact of various trade agreements and preferential policies on China’s export trade. Combined with the existing research results and according to the research needs of this study, two variables, population (POP) and economic openness (OPEN), were added to the gravity model to construct the following regression equation:
In order to further conduct an empirical analysis of the impact of each sub-index of the GLPI index on China’s export trade, in this study, GLPI was replaced with tracing, SHIP, Service, Custom, timeLiness, infra, CO2, N2O, CH4, Fgas, and fossil fuel, and the following models were obtained:
Based on data availability, this study has selected panel data from the United Nations Trade Database, the World Bank WDI database, CEPII mapping, the official website of the Asia-Pacific Organization, and other RCEP15 countries from 2012 to 2018 for analysis. The data sources are shown in Table 4. Table 5 shows the descriptive statistical analysis results of each indicator in the RCEP15 countries. It can be found that countries differ greatly in GDP, population, distance, and other aspects. In terms of the GLPI index and its sub-indexes, GHG emission intensity and fossil fuel consumption differ greatly.
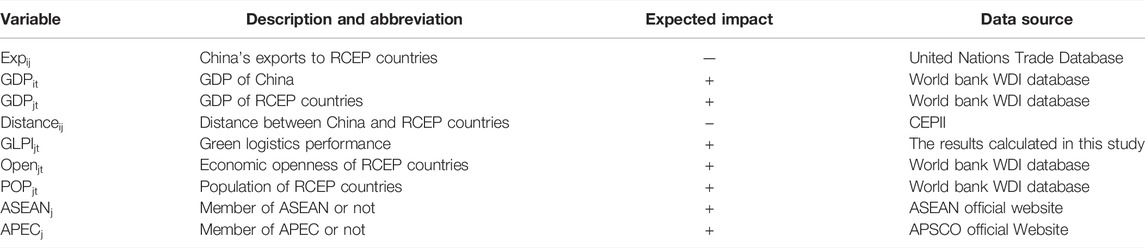
TABLE 4. Definition of variables and data sources.
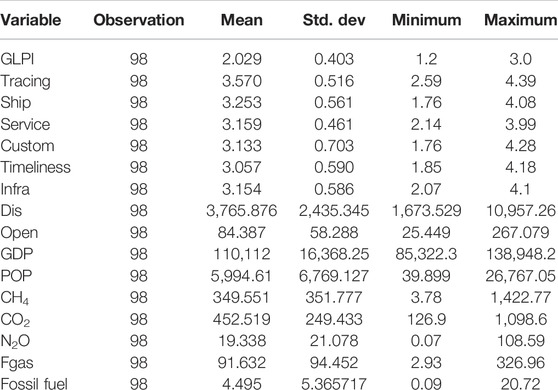
TABLE 5. Summary statistics of the variable for RCEP sub-sample.
This study uses stata16.0 software and the ordinary least square method to conduct regression analysis on panel data of RCEP countries from 2012 to 2018. The collinearity test was carried out using the maximum variance inflation factor method. It was found that the variable LnGDPjt had collinearity problems with other variables, so this variable was removed from the model. Husman test and Lagrange (LM) test results show that the random effect model should be selected for this model, and the regression results obtained are shown in Table 5. The fitting results are as follows:
As can be seen from the results of Model (7), with the gradual addition of variables, the explanatory power of the model is constantly enhanced. The specific results are as follows:
1) The explanatory variable GLPIjt has the greatest impact on China’s export trade. The estimated coefficient of the GLPI index on China’s export trade is 2.887, which is statistically significant, indicating that the higher the GLPI index of RCEP sample countries, the more favorable it is to China’s export trade development, and the trade growth rate will be higher than that of the GLPI index.
2) The impact of GDPit on China’s export trade is second only to the GLPI index, indicating that if China’s GDP increases by 1%, China’s export trade will increase by 2.261%.
3) The third influential variable is the explanatory variable APECj, with a statistically significant influence coefficient of 0.773, which indicates that the establishment of a partnership between RCEP sample countries and China based on the APEC initiative has a positive impact on the development of China’s export trade. It can be inferred that the signing of RCEP agreement will also have a positive impact on China’s export trade.
4) ASEANj, the explanatory variable in the fourth place, has a negative impact on China’s export trade, which is inconsistent with expectations. After observing the export trade data of China and RCEP sample countries, it is found that China’s export to Japan, South Korea, and other non-ASEAN member countries is much higher than that of ASEAN member countries, which may be the reason for the negative estimated coefficient. With the implementation of the RCEP agreement in various countries, this figure may change from negative to positive.
5) The explanatory variable POPj ranked fifth, which indicated that if the population of RCEP sample countries increased by 1%, China’s export trade would increase by 0.634%.
6) The degree of influence of explanatory variable OPENj ranks sixth, which indicates that if the economic openness of RCEP sample countries increases by 1%, China’s export trade will increase by 0.619%.
7) The explanatory variable DISij has the weakest influence on China’s export trade, with a statistically significant influence coefficient of −0.419, indicating that distance has hindered China’s export trade with RCEP partner countries.
In order to conduct an in-depth study on the impact of GLPI sub-indexes of RCEP sample countries on China’s export trade, the regression of Eqs 2–12 is carried out according to the above ideas. The empirical results show that the factors Ship, Service, Custom, Timelines, CO2 emission intensity, and N2O emission intensity pass the empirical test, and the regression equation obtained is shown in Table 7.
The model regression results show that the effects of each item of the GLPI index of RCEP sample countries on China’s export trade are different. The estimated coefficients of the regression model are sorted as follows: efficiency of customs clearance procedures, convenience of arranging freight with competitive prices, timeliness of cargo transportation, ability and quality of logistics services, CO2 emission intensity, and N2O emission intensity, and their estimated coefficients are as 3.157, 2.996, 2.959, 2.389, −0.697, and −0.242.
The results show that the efficiency of customs clearance procedures, the convenience of arranging freight at competitive prices, the timeliness of cargo transportation, and the ability and quality of logistics services have a great impact on China’s export trade. Among them, the efficiency of customs clearance procedures has the highest impact, indicating that for every 1% increase in the efficiency of customs clearance procedures in RCEP sample countries, China’s export trade to RCEP sample countries will increase by 3.157%. Therefore, to improve green logistics performance in RCEP sample countries with limited resources, resources should first be invested in the efficiency of customs clearance procedures, followed by the convenience of arranging competitively priced freight, the timeliness of cargo transport, and the ability and quality of logistics services. At the same time, in order to conform to the theme of low-carbon development of Green and low carbon is the core issue for human society development, it is also necessary to take a comprehensive consideration of carbon dioxide emissions and nitrous oxide emissions.
This study used the lagged elPI and its data as instrumental variables to conduct robustness tests. The lagged data can control the endogenous variables of the model to a certain extent. Based on this instrumental variable, this study adopts a two-stage least square method to carry out instrumental variable regression.
Stage 1:
Stage 2:
In the first stage, the elPI of the current year was interpreted with the lag of one stage, and the predicted value of the elPI of the current year was obtained by regression coefficient. In the second stage, the elPI measured value replaced the actual elPI value as the main explanatory variable for the robustness test. Through the empirical test, the robustness test of Ship, Service, Custom, Timelines, CO2 emission intensity, and N2O emission intensity of GLPI was carried out using the same method, and the test results are shown in Table 8. The empirical results of the substitution of explanatory variables are consistent with those shown in Table 6 and Table 7, which proves the robustness of the results in this study.
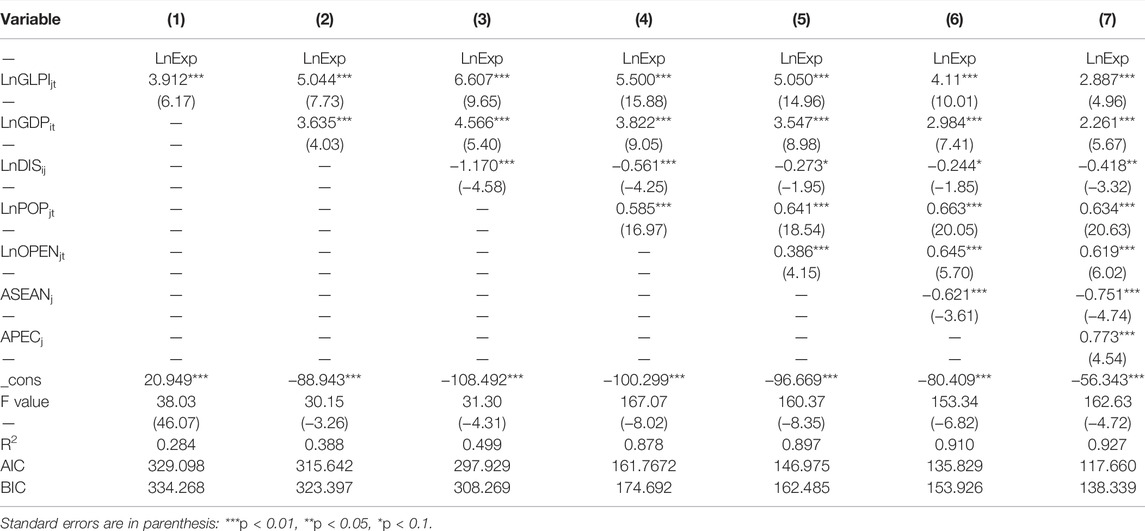
TABLE 6. GLPI overall index regression of RCEP sample countries.
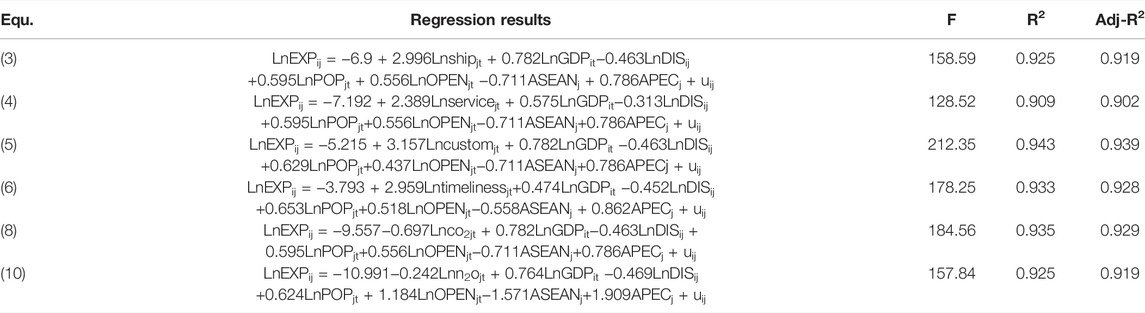
TABLE 7. Regression of GLPI sub-indexes in RCEP sample countries.
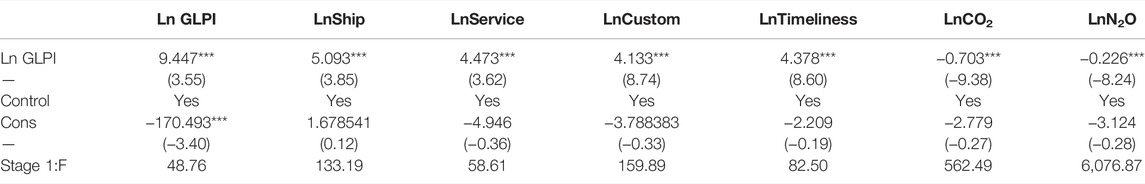
TABLE 8. Robustness test results of alternative explanatory variables.
Based on the LPI index, this study constructs the GLPI index by the entropy method. At the same time, empirical analysis is made on the impact of the GLPI index and its sub-indexes on China’s export trade, and the following conclusions are drawn:
1) Based on the connotation and denotation of the GLPI index, on the basis of the traditional LPI index, further introduce CO2 emission intensity, N2O emission intensity, CH4 emission intensity, Fgas emission intensity, and fossil fuel consumption to construct the GLPI index. Meanwhile, the GLPI index of RCEP14 sample countries was calculated and analyzed. The analysis results show that, on the whole, the green logistics performance of RCEP countries has different development levels, and the GLPI index of non-ASEAN countries is generally higher than that of ASEAN countries. In terms of GLPI sub-indexes, Singapore has a high GLPI index, and the development of GLPI sub-indexes is balanced. The efficiency of customs clearance procedures and the timeliness of cargo transportation are the weakest links in regional green logistics. Meanwhile, the emission intensity and fossil fuel consumption of CO2, N2O, CH4, and Fgas in Myanmar and Laos are relatively high.
2) The overall regression results of the GLPI index of RCEP sample countries on China’s export volume show that GLPI has the greatest impact on export volume; if the green logistics performance of RCEP sample countries increases by 1%, China’s export volume will increase by 2.887%. The degree of influence of other factors is the size of China’s economy, whether it is a member of APEC, whether it is a member of ASEAN, the population of RCEP sample countries, the degree of economic openness, and the spatial distance of RCEP sample countries.
3) The regression results based on the GLPI sub-indexes of RCEP sample countries on China’s export trade show that the efficiency of customs clearance procedures, the convenience of arranging freight at competitive prices, the timeliness of cargo transportation, and the ability and quality of logistics services have a positive effect on China’s export trade; CO2 and N2O emission intensity hinder the increase in China’s export volume. However, the ability to track and query goods, the quality of infrastructure, CH4 emission intensity, Fgas emission intensity, and fossil fuel consumption have no significant impact on China’s export trade.
Based on the above conclusions, in the context of building an RCEP free Trade Zone and promoting green logistics efficiency to promote China’s export trade, this study puts forward the following countermeasures and suggestions:
1) The improvement of the efficiency of customs clearance procedures is not only an important aspect of the improvement of GLPI but also the primary influencing factor of the GLPI sub-indexes to promote China’s export trade. Customs of all countries should give full play to their functions, work together with local governments and business communities to optimize the customs clearance process, and greatly improve the overall customs clearance efficiency of ports by means of the electronic process, intensive reform, personalized and service-oriented customs clearance, and diversified customs clearance classification.
2) Actively improving the timeliness of international cargo transportation will be conducive to improving GLPI and further promoting China’s export trade. Therefore, countries should establish dialogue mechanisms with RCEP countries, give full play to the flexibility of the RCEP organization, promote the layout of logistics routes among RCEP members, and improve the response of green logistics services in the region.
3) Regional economic organization mechanism has a great trade creation effect on China’s export trade. Therefore, it is necessary to give full play to the positive role of regional economic organization mechanism, effectively promote green logistics cooperation between RCEP member countries with high AND low GLPI index, provide relevant green logistics construction experience for RCEP countries with low GLPI index, and help them improve the performance level of green logistics. In this way, trade between China and RCEP member countries will be maximized. The signing of the RCEP agreement will promote the connection between RCEP member countries and Chinese industries, which will be conducive to the trade complementarity of all member countries in the region and the realization of common development.
4) Green and low-carbon is the theme of The Times. In the context of global efforts to tackle climate change and jointly promote low-carbon development, RCEP member countries should work together to reduce CO2 and N2O emissions; promote sustainable development of green logistics through logistics planning, logistics policies, and advanced low-carbon logistics technologies; and further improve the performance of green logistics in RCEP member countries. To provide a favorable external environment for further development.
5) The governments should formulate environmental regulations that are effective and efficient at the same time and nurture the development of green logistics. A sophisticated green logistics policy can ensure a reduction in carbon emissions. Such policies can ensure a sustainable economy, society, and environment. Further, carbon taxation and subsidies may also give fruitful results.
6) The initiatives by exporters like green packaging, transportation, and supply chain and complying with other environmental policies will result in a global competitive edge. The export operations can be optimized according to the environmental initiatives and policies developed through collaborations between policymakers and the logistics industry.
The raw data supporting the conclusion of this article will be made available by the authors without undue reservation.
All authors listed have made a substantial, direct, and intellectual contribution to the work and approved it for publication.
The authors declare that the research was conducted in the absence of any commercial or financial relationships that could be construed as a potential conflict of interest.
All claims expressed in this article are solely those of the authors and do not necessarily represent those of their affiliated organizations or those of the publisher, the editors, and the reviewers. Any product that may be evaluated in this article, or claim that may be made by its manufacturer, is not guaranteed or endorsed by the publisher.
Ahmadi, M. (2021). A Computational Approach to Uncovering Economic Growth Factors. Comput. Econ. 58 (4), 1051–1076. doi:10.1007/s10614-020-09985-1
Ahmadi, M., Jafarzadeh-Ghoushchi, S., Taghizadeh, R., and Sharifi, A. (2019). Presentation of a New Hybrid Approach for Forecasting Economic Growth Using Artificial Intelligence Approaches. Neural Comput. Applic 31 (12), 8661–8680. doi:10.1007/s00521-019-04417-0
Ahmadi, M., and Taghizadeh, R. (2019). A Gene Expression Programming Model for Economy Growth Using Knowledge-Based Economy Indicators. Jm2 14 (1), 31–48. doi:10.1108/jm2-12-2017-0130
Çelebi, D. (2019). The Role of Logistics Performance in Promoting Trade. Marit. Econ. Logist. 21 (3), 307–323. doi:10.1057/s41278-017-0094-4
Erokhin, V. (2020). Regional Comprehensive Economic Partnership: A Review of Major Parameters of the Trade Alliance. Mark. Logist. 32, 23–34.
Gani, A. (2017). The Logistics Performance Effect in International Trade. Asian J. Shipp. Logist. 33 (4), 279–288. doi:10.1016/j.ajsl.2017.12.012
Górecka, A. K., Pavlić Skender, H., and Zaninović, P. A. (2021). Assessing the Effects of Logistics Performance on Energy Trade. Energies 15 (1), 191. doi:10.3390/en15010191
Karaduman, H. A., Karaman-Akgül, A., Çağlar, M., and Akbaş, H. E. (2020). The Relationship between Logistics Performance and Carbon Emissions: an Empirical Investigation on Balkan Countries. Int. J. Clim. Change Strategies Manag. 12 (4), 449–461. doi:10.1108/ijccsm-05-2020-0041
Khan, S. A. R., Jian, C., Zhang, Y., Golpîra, H., Kumar, A., and Sharif, A. (2019). Environmental, Social and Economic Growth Indicators Spur Logistics Performance: From the Perspective of South Asian Association for Regional Cooperation Countries. J. Clean. Prod. 214, 1011–1023. doi:10.1016/j.jclepro.2018.12.322
Khan, S. A. R., Zhang, Y., Kumar, A., Zavadskas, E., and Streimikiene, D. (2020). Measuring the Impact of Renewable Energy, Public Health Expenditure, Logistics, and Environmental Performance on Sustainable Economic Growth. Sustain. Dev. 28 (4), 833–843. doi:10.1002/sd.2034
Li, X., Sohail, S., Majeed, M. T., and Ahmad, W. (2021). Green Logistics, Economic Growth, and Environmental Quality: Evidence from One Belt and Road Initiative Economies. Environ. Sci. Pollut. Res. Int. 28 (24), 30664–30674. doi:10.1007/s11356-021-12839-4
Liu, F., Zhao, F., Liu, Z., and Hao, H. (2018). The Impact of Fuel Cell Vehicle Deployment on Road Transport Greenhouse Gas Emissions: The China Case. Int. J. Hydrogen Energy 43 (50), 22604–22621. doi:10.1016/j.ijhydene.2018.10.088
Mariano, E. B., Gobbo, J. A., Camioto, F. d. C., and Rebelatto, D. A. d. N. (2017). CO2 Emissions and Logistics Performance: a Composite Index Proposal. J. Clean. Prod. 163, 166–178. doi:10.1016/j.jclepro.2016.05.084
Martí, L., and Puertas, R. (2017). The Importance of Export Logistics and Trade Costs in Emerging Economies. Marit. Econ. Logist. 19 (2), 315–333. doi:10.1057/mel.2015.31
Mendes dos Reis, J. G., Sanches Amorim, P., Sarsfield Pereira Cabral, J. A., and Toloi, R. C. (2020). The Impact of Logistics Performance on Argentina, Brazil, and the US Soybean Exports from 2012 to 2018: A Gravity Model Approach. Agriculture 10 (8), 338. doi:10.3390/agriculture10080338
Monitor, G. I. T. (2020). RCEP Agreement a Potential Boost for Investment in Sustainable Post-COVID Recovery.
Önsel Ekici, Ş., Kabak, Ö., and Ülengin, F. (2016). Linking to Compete: Logistics and Global Competitiveness Interaction. Transp. Policy 48, 117–128. doi:10.1016/j.tranpol.2016.01.015
Pöyhönen, P. (1963). A Tentative Model for the Volume of Trade between Countries. Weltwirtschaftliches Arch. 90, 93–100. Available at: http://www.jstor.org/stable/40436776.
Rashidi, K., and Cullinane, K. (2019). Evaluating the Sustainability of National Logistics Performance Using Data Envelopment Analysis. Transp. Policy 74, 35–46. doi:10.1016/j.tranpol.2018.11.014
Ren, J., and Huang, (2015). The Influence of Green Barrier on China's Agricultural Products Trade and Countermeasure Analysis. Int. J. Technol. Manag. 11, 3. doi:10.4103/2226-8561.166366
Riadh, H. (2020). Modelling and Quantifying the Effects of Trade Facilitation on Trade and International Transport Costs Using the Logistics Performance Index. Ijstl 12 (5), 462–486. doi:10.1504/ijstl.2020.10030194
Saslavsky, D., and Shepherd, B. (2014). Facilitating International Production Networks: The Role of Trade Logistics. J. Int. Trade & Econ. Dev. 23 (7), 979–999. doi:10.1080/09638199.2013.811534
Seroka-Stolka, O., and Ociepa-Kubicka, A. (2019). Green Logistics and Circular Economy. Transp. Res. Procedia 39, 471–479. doi:10.1016/j.trpro.2019.06.049
Siddiqui, A. A., and Vita, S. (2019). Impact of Logistics Performance on Trade with Specific Reference to Garment Sector in Cambodia, Bangladesh and India. Glob. Bus. Rev. 22 (2), 517–531. doi:10.1177/0972150918811700
Song, M.-J., and Lee, H.-Y. (2022). The Relationship Between International Trade and Logistics Performance: A Focus on the South Korean Industrial Sector. Res. Transp. Bus. Manag. 100786. doi:10.1016/j.rtbm.2022.100786
Suvannaphakdy, S. (2021). Assessing the Impact of the Regional Comprehensive Economic Partnership on ASEAN Trade. J. Southeast Asian Econ. 38, 133+. doi:10.1355/ae38-1f
Taghizadech, R., and Ahmadi, M. (2019). Statistical and Econometrical Analysis of Knowledge-Based Economy Indicators Affecting Economic Growth in Iran: The New Evidence of Principal Component Analysis—Tukey and ARDL Bound Test. Prepr. January 10, 1–23. doi:10.13140/RG.2.2.26515.02087
Tan, B. Q., Wang, F., Liu, J., Kang, K., and Costa, F. (2020). A Blockchain-Based Framework for Green Logistics in Supply Chains. Sustainability 12 (11), 4656. doi:10.3390/su12114656
Tang, X., and Wang, G. (2020). Design and Analysis of E-Commerce and Modern Logistics for Regional Economic Integration in Wireless Networks. J. Wirel. Com. Netw. 2020 (1), 208. doi:10.1186/s13638-020-01816-z
Teng, F., Su, X., and Wang, X. (2019). Can China Peak its Non-CO2 GHG Emissions before 2030 by Implementing its Nationally Determined Contribution? Environ. Sci. Technol. 53 (21), 12168–12176. doi:10.1021/acs.est.9b04162
Töngür, Ü., Türkcan, K., and Ekmen-Özçelik, S. (2020). Logistics Performance and Export Variety: Evidence from Turkey. Cent. Bank. Rev. 20 (3), 143–154. doi:10.1016/j.cbrev.2020.04.002
Wang, D.-F., Dong, Q.-L., Peng, Z.-M., Khan, S., and Tarasov, A. (2018). The Green Logistics Impact on International Trade: Evidence from Developed and Developing Countries. Sustainability 10 (7), 2235. doi:10.3390/su10072235
Yan, X., and Sun, S. (2021). Impact of Electric Vehicle Development on China's Energy Consumption and Greenhouse Gas Emissions. Clean. Techn Environ. Policy 23 (10), 2909–2925. doi:10.1007/s10098-021-02209-6
Yeo, A. D., Deng, A., and Nadiedjoa, T. Y. (2020). The Effect of Infrastructure and Logistics Performance on Economic Performance: The Mediation Role of International Trade. Foreign Trade Rev. 55 (4), 450–465. doi:10.1177/0015732520947676
Zaninović, P. A., Zaninović, V., and Skender, H. P. (2021). The Effects of Logistics Performance on International Trade: EU15 vs CEMS. Econ. Research-Ekonomska Istraživanja 34 (1), 1566–1582. doi:10.1080/1331677X.2020.1844582
Keywords: regional comprehensive economic partnership, green logistics performance, expansion gravity model, export trade, entropy
Citation: Fan M, Wu Z, Qalati SA, He D and Hussain RY (2022) Impact of Green Logistics Performance on China’s Export Trade to Regional Comprehensive Economic Partnership Countries. Front. Environ. Sci. 10:879590. doi: 10.3389/fenvs.2022.879590
Received: 19 February 2022; Accepted: 14 April 2022;
Published: 24 May 2022.
Edited by:
Enzo Barberio Mariano, São Paulo State University, BrazilReviewed by:
Mohsen Ahmadi, Urmia University of Technology, IranCopyright © 2022 Fan, Wu, Qalati, He and Hussain. This is an open-access article distributed under the terms of the Creative Commons Attribution License (CC BY). The use, distribution or reproduction in other forums is permitted, provided the original author(s) and the copyright owner(s) are credited and that the original publication in this journal is cited, in accordance with accepted academic practice. No use, distribution or reproduction is permitted which does not comply with these terms.
*Correspondence: Di He, aGRAdWpzLmVkdS5jbg==; Rana Yassir Hussain, eWFzc2lyLmh1c3NhaW5AdWUuZWR1LnBr
† ORCID: Mingyue Fan, orcid.org/0000-0001-9678-0205; Sikandar Ali Qalati, orcid.org/0000-0001-7235-6098; Rana Yassir Hussain, orcid.org/0000-0002-6951-1322
Disclaimer: All claims expressed in this article are solely those of the authors and do not necessarily represent those of their affiliated organizations, or those of the publisher, the editors and the reviewers. Any product that may be evaluated in this article or claim that may be made by its manufacturer is not guaranteed or endorsed by the publisher.
Research integrity at Frontiers
Learn more about the work of our research integrity team to safeguard the quality of each article we publish.