 Xu Han
 Jianmin Dou
 Chenghui Tang
- 1Department of Economics, Shanghai Administration Institute, Shanghai, China
- 2School of Urban and Regional Science, Shanghai University of Finance and Economics, Shanghai, China
With the rise of the city-regions development strategy, the impact of the spatial structure in city-regions on environmental pollution becomes an increasingly important issue related to sustainable regional development. Although previous studies have paid attention to spatial structure affecting environmental quality, there is a lack of analyzing the reduction effect of industrial pollution emission from the perspective of polycentricity and monocentricity. In order to provide the evidence from industrial production activities to test the relationship between spatial structure and industrial pollution, this study extends the production density model by treating industrial pollution emissions as non-expected output and introducing the spatial structure factor into the model, thus revealing the non-linear interactive effects of spatial structure and agglomeration on industrial pollution emissions, and exploring this emission reduction effect and its mechanisms using threshold regression model and mediation model. The empirical analysis shows that spatial structure matters and the results are as follows: Firstly, polycentricity is associated with lower industrial pollution emission intensity, but the emission reduction effect of polycentricity depends on regional agglomeration. Secondly, the higher the regional agglomeration, the greater the emission reduction effect. Thirdly, the heterogeneity test also indicates that the geographical compactness and unified administration of city-regions strengthen this emission reduction effect. Fourthly, the mediating effect test verifies the three mechanisms proposed in this study, among which energy utilization efficiency effect plays a major role. The governments are expected to promote the transformation of the spatial structure from a monocentricity to polycentricity based on the level of regional agglomeration to ensure that the expected emission reduction effect can be achieved.
1 Introduction
Urbanization and industrialization have contributed to the rapid growth of the urban economy and the population and industry have also further agglomerated in cities. But it is undeniable that industrial pollution emission has become one of the primary air pollution sources. The 2016 report on the state of the environment in China shows that 254 of 338 cities do not meet the national ambient air quality standard, accounting for about 75% of the total, and the average number of days not up to the standard accounts for 21.2%. A city is not only an important space for economic agglomeration, but also the main place for human living. The important goal of the 13th Five-Year Plan is giving consideration to both urban environment and economic development and controlling the pollution problem1. With the efforts of the central and local governments, pollution problem in China has been initially controlled and the industrial pollution emission intensity has shown an obvious downward trend as a whole, but there is still a big gap compared with the developed countries. Some policy documents at the national level have clearly pointed out that China’s urbanization in the future is to restrict the increasing agglomeration of the population in large cities and focus on the development of small- and medium-sized cities. Will such an urban development policy with the concept of space organization have a policy dividend on pollution reduction? What kind of spatial policy can achieve regional economic growth and green development consistently? Behind the vigorous process of urbanization in China, it is urgent to explore the rational urban spatial mode for avoiding air pollution caused by excessive emission of industrial pollution due to the agglomeration of economic activities.
In Figure 1, the spatial structure index2 has been distributed according to quartile and there is an obvious positive relationship between the quartile ranking of spatial structure index and pollution emission intensity in China’s 21 city-regions in 2003 and 2016. In Figure 1A, the bar chart of 2003 shows that the average pollution emission intensity of the five city-regions with the smallest spatial structure index (most inclined to polycentric spatial structure) is 147.61 (thousands ton/billion Yuan), and the average pollution emission intensity of the six city-regions with the largest spatial structure index (most inclined to monocentric spatial structure) is 296.33 (thousands ton/billion Yuan). The bar chart of 2016 shows a similar phenomenon: the city-regions with more obvious polycentric spatial structures have lower pollution emission intensity. The bar charts of the quartile ranking of spatial structure index and industrial sulfur dioxide emission intensity have also been plotted in Figure 1B and the results are similar.
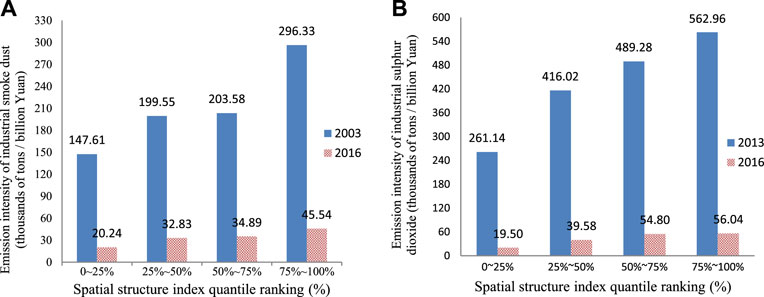
FIGURE 1. Spatial structure of city-region and pollution emission intensity in 2003 and 2016. The ordinate label in the charts have indicated the difference between (A,B).
Studies at home and abroad have proved that the polycentric spatial structure can promote the local economic efficiency because the cities with geographical proximity and close relations have “borrowed size” (Alonso, 1973). Building on the concept of “borrowed size”, some terms have been conceptualized for external economies at the scale of the regional urban system, such as urban network externalities (Capello, 2000), which can be used as an alternative to the agglomeration externalities in a single city. And under polycentric spatial structure, smaller cities that are part of a city-region have more endogenous ability to control these economic, social, and environmental costs within the acceptable range, while enjoying the agglomeration externality and overcoming the agglomeration diseconomy. Therefore, two questions are worth thinking about: regarding industrial pollution emissions as non-expected outputs, could polycentric spatial structure improve production efficiency while reducing industrial pollution emission intensity? What is the mechanism behind it? The existing research has not yet given theoretical analysis and empirical test. If the polycentric spatial structure has emission reduction effects on industrial pollution, the adoption of polycentric planning strategies will contribute to the realization of economic growth and air quality win-win. Behind the vigorous urbanization process, it is urgent to explore the urban development model and optimize the spatial organization form. It is of great practical and theoretical significance to analyze the urbanization mode of green development with spatial organization.
This study had the following contributions: 1) In previous studies, the impact of spatial structure on the environmental performance of city-regions has mainly played a role through factors such as traffic commuting, infrastructure, and domestic energy consumption; in this study, the relationship between spatial structure and industrial pollution has been investigated from the perspective of polycentricity and monocentricity, which provides the spatial economic activities’ evidence to explain the reduction effect of industrial pollution emission. 2) This study extends the production density model by mathematics, which reveals the non-linear interactive effects of spatial structure and agglomeration on industrial pollution emissions, proposes three mechanisms based on agglomeration theory, and test it by using non-linear threshold regression and mediation model. 3) This study explored the impact of spatial structure on industrial pollution emissions, finding polycentricity is associated with lower industrial pollution emission intensity but the emission reduction effect of polycentricity depends on agglomeration degree.
The study will enrich the research on the relationship between polycentricity and environmental pollution in city-regions. It is expected that this research will help to provide decision-making reference for emerging economies undergoing rapid urbanization to realize high-quality regional development and optimize the spatial layout of urbanization.
To answer these above two questions, the purpose of this study is to examine whether polycentricity has more obvious emission reduction effect under the same agglomeration degree, and explain the underlying mechanisms theoretically and empirically. The study proceeds as follows. Section 2 is literature review. Section 3 proposes the theoretical model and mechanism analysis. Section 4 explains the measuring method of spatial structure and introduces empirical methodology of this study. Section 5 discusses the empirical results, and Section 6 concludes the study.
2 Literature Review
The existing literature has made valuable studies on pollution emissions from the perspectives of environmental regulations (Cole et al., 2005), international trade, foreign investment (Rezza and Alief, 2013), taxation policies (Levinson, 2009), transport infrastructure (Tsakiris et al., 2014), regional economic growth, and agglomeration (Roca et al., 2001; Lalive et al., 2017). Pollution emission is an undesirable output of economic activity, and the spatial density of economic activity is also an important factor affecting pollution emission. Hence, the relative study from the perspective of agglomeration is quite abundant (Zeng and Zhao, 2009; Cheng, 2016), but the empirical study on the relationship between agglomeration and pollution emissions has not yet reached a consistent conclusion. Some studies suggest that the influence of agglomeration on pollution emission is nonlinear and that excessive agglomeration without reasonable space distribution will increase emissions (Newman and Kenworthy, 1989; Kamal-Chaoui and Robert, 2009; Glaser and Kahn, 2010; Qin and Wu, 2014).
Spatial structure first has attracted interest from urban geographers and planners as it is believed to affect economic, environmental, and social performance. Soon, urban economists were keen to discover that the environmental effects of agglomeration may depend on differences in spatial structures and their dynamics (Madlener and Sunak, 2011; Denant-Boemont et al., 2018). Camagni et al. (2002) investigated whether different urban spatial structures could be associated with specific environmental costs and the results found that a “wisely compact” and polycentric urban structure is desirable in the Milan metropolitan areas. Veneri (2014) used a database of 82 Italian metropolitan areas to investigate polycentric spatial structure effects on commuting costs and found that metropolitan areas with a higher degree of polycentricity have lower external costs of mobility which was measured by per capita CO2 emissions, while other spatial characteristics, such as functional diversification and size could not be proved to have the same effect. Burgalassi and Luzzati (2015) addressed the possible link between urban spatial structures (polycentricity or dispersity) and environmental quality originating from transport and residential heating but the empirical evidence for Italy NUTS three regions' spatial structure on CO2 and PMs could not be confirmed. Li and Zhou (2019) believed that spatial structure affects air quality through a series of mechanisms, such as commuting distance, energy consumption, and transportation layout, and empirically tested the effect of urban form on urban air quality with air monitoring data of prefecture-level cities in China, indicating that smaller, scattered, and polycentric cities have better air quality.
In addition to the concept of polycentric and monocentric spatial structure, urban compactness and urban sprawl are a set of relative concepts, which are also used to describe the characteristics of urban spatial structure. Urban sprawl refers to the excessive expansion of the urban space beyond the necessary level, which causes the economic activities originally concentrated mainly in the urban center to spread to the periphery of the city. The characteristics of the urban sprawl are dispersed in shape, low population density, polycentric, more dependent on private cars, and so on, which increases the vehicle use, commuting trips, and petrochemical energy consumption (Glaeser and Kahn, 2004). Urban sprawl usually reduces the density of residential and economic activity and increases the demand for buildings (Banzhaf and Lavery, 2010), which leads to increased emissions of dust pollutants during construction. In addition, urban sprawl will erode the green area around the city (Burchfield et al., 2005). Borrego et al. (2006) studied the relationship between urban spatial structure and air quality by simulation and they found that the total amount of air pollutants in compact urban structures was less. Although the urban sprawl is also a way to measure the urban spatial form, it is different from polycentricity which refers to balanced hierarchical relationships among space units, occurring when the vast majority of economic activity is evenly distributed in several space units of comparable size (Burgalassi and Luzzati, 2015). Urban sprawl can only reflect the spatial structure within a single city rather than among cities, so it could not explore the impact of spatial structure on pollution emission on a larger spatial scale beyond the city. In view of the above, this study uses polycentricity to measure spatial structure.
Although many empirical papers deal with air pollution and polycentricity in China (Han et al., 2020; Li et al., 2020; Wang and Zhang, 2020), and have drawn valuable conclusions, some issues still need to be studied. 1) Most of the research in this field is based on urban planning and geography which considers that the reasonable layout of urban function and the appropriate space structure can help to reduce the energy consumption and pollution emission from transport, repeated infrastructure construction, and residential heating for improving the environmental performance. However, few studies have analyzed the influence of urban spatial structure on the industrial pollution emission intensity based on the agglomeration theory. 2) Some studies believed that the agglomeration diseconomies caused by excessive agglomeration are the cause of the non-linear relationship between agglomeration and pollution emissions, but both theoretical and empirical analyses of agglomeration and agglomeration externalities on pollution emission have so far neglected the spatial form of agglomeration. 3) The measurement of polycentricity is multi-dimensional. In terms of economic polycentricity, gross domestic production, labor force, and production outputs are all appropriate indicators to measure the spatial structure of economic activity agglomeration. So, it is necessary to use different spatial structure indexes for empirical testing.
3 Theoretical Model and Mechanism Analysis
Under an agglomeration economy, industry and labor are concentrated constantly, and finally, the spatial organization structure of economic activities is formed. In this study, the relatively balanced spatial organization relationship is called polycentric spatial structure. Based on agglomeration theory, the relationship between polycentric spatial structure and regional pollution emission is discussed. Agglomeration can bring a variety of spillover effects through sharing, matching, and learning, so as to produce a certain positive externality. Ciccone and Hall (1996) constructed a production density model allowing increasing returns to scale which provided a simple and reasonable theoretical framework for agglomeration theory. Ke (2010) simplified and improved this model, and this study uses his method for reference to introduce the urban spatial structure into the model.
where qi is the output per unit area in the ith city, Qi and Ai are the total output and total urban built-up area of the ith city, and Qi/Ai obviously is the spatial density of output. πi is the total factor productivity, li is the employment density, ki is the physical capital input per unit area, α is the return on capital and labor per unit area, 0 < α ≤ 1, indicating diminishing marginal productivity due to congestion, and β is the contribution rate of labor input to output per unit area, 0 < β ≤ 1. Si is the variable for urban spatial structure. The larger the Si is, the more monocentric the city is, and conversely, the smaller the Si is, the more polycentric the city is. Therefore, spatial density of output Qi/Ai for reflecting the agglomeration degree of economic activities, and urban spatial structure Si for indicating spatial organization of agglomeration will jointly determine the externality of city-region by this model setting. λ is the parameter of output density. If λ > 1, agglomeration bring about positive externalities and increase more output per unit area in cities. Considering that the general production process is usually accompanied by pollution emissions, this study assumes that the Q unit output can be divided into two parts: the Q0 unit expected output and the w unit non-expected output (pollution emission).
Therefore, Eq. 1 can be written as
Given the lack of the capital data for cities, it can be assumed that the expression of capital requirements is as follows:
where γ is the capital price of the ith city. From Eq. (3) into Eq. (2) the following equation is obtained:
where w/Q0, the left-hand of Eq. 4, is pollution emission per unit output and the right-hand side of the equation includes labor productivity (Q0/Li), urban spatial structure (Si), and spatial density of expected output (Q0/Ai). Eq. 4 shows that the pollution intensity of the city is closely related to the labor productivity, spatial structure, and the agglomeration degree measured by output density. Eq. 4 can then be rewritten as:
And then, the equation yields the expression
The coefficient we are interested in is (αλ-1)/[1-α (1-β) λ], the coefficient of the third term on the right of the equation, which indicates the interactive effect of spatial density and spatial structure on pollution emission. (αλ-1)/[1-α (1-β) λ] may be positive or negative, depending on the parameters α, β, and λ which are closely related to the stage of regional economic development and the agglomeration degree. It is clear that a linear interactive effect is not enough to describe the complex relation, and the effect of the urban spatial structure on the pollution emission may also have a non-linear threshold effect due to the different agglomeration degrees.
The environmental effect of agglomeration is the result of increasing effect and emission reduction effect. On the one hand, agglomeration is accompanied by the expansion of total output and pollution emission (Yang, Y., 2021); on the other hand, agglomeration promotes the decline in pollution emission intensity through the professional division, pollution control cost sharing, and pollution control technology learning (Glaser and Kahn, 2010). Therefore, whether the emission reduction effect of industrial agglomeration dominates depends on a variety of influencing factors and presents spatial heterogeneity and non-linear characteristics (Yang et al., 2021). When the regional agglomeration degree is low, the inconveniences of polycentricity could be even more prominent. Because, under these circumstances, the polycentric structure is a dispersed spatial organization form, it is difficult to produce the scale effect of pollution control and the spillover effect of technology. The polycentric structure not only loses the advantage of emission reduction but also increases the expenditure on infrastructure construction and social governance. Thus, the overall spatial efficiency of the city-regions is reduced. But, when the regional agglomeration degree is low, the monocentric spatial structure can centralize the various factors of production and supporting facilities, which will help to reduce the enterprises' physical distribution costs and promote the production efficiency by matching labor force and the spillover of knowledge and technology (Yuan et al.2021). At this time, the positive agglomeration externality can be brought into full play. In addition, the unit pollution abatement cost can be reduced by sharing the pollution treatment equipment. Therefore, in the areas with low level of agglomeration, the monocentric spatial structure is conducive to promoting the sharing of facilities, cost saving, and efficiency improvement, which shows the emission reduction effect.
When the economy is in rapid development stage, the agglomeration of economic activities leads to the expansion of the capacity scale, resulting in a sharp increase in energy demand, which in turn leads to an increase in the intensity of pollution emissions. In this case, the polycentric spatial structure can play a role in pollution emission reduction through three mechanisms. 1) environmental regulation integration effect. Polycentricity is not a hierarchical system, but a city network system connected by a traffic trunk, which is not only conducive to deepening the industrial division, building closer functional links, and facilitating the flow of people, goods, and information (Glaeser et al., 2016) but also improving the production efficiency (Zhang et al., 2017). In addition, it is also possible to promote equitable distribution of educational and medical resources and infrastructure (Eraydin, 2008), which also plays a positive role in establishing a more equal cooperative relationship among regions. Therefore, polycentricity is not only a term describing spatial structure but also a policy option to promote coordinated regional development and enhance regional integration. When the level of regional agglomeration is high, the production efficiency of each spatial unit in polycentric areas has been generally improved; the flows of population, capital, and information across the spatial units have been more and more rapid; and the income gap has narrowed. Such an economic integration will also contribute to the unification of environmental regulation standards and the consensus of non-governmental environmental protection in the region, so as to avoid the decline in the overall regional environmental quality caused by pollution haven. Therefore, polycentric structure has a significant emission reduction effect. The monocentric structure has an obvious “center-periphery” distribution pattern. When the polarization effect is greater than the diffusion effect, the agglomeration center will restrain the economic growth of the marginal area, called “agglomeration shadow” or “dark under lamp,” which produces obvious boundary effect and hinders the process of regional integration. Environmental awareness in the periphery is weak and opportunities for economic growth are urgently needed, so these peripheral areas, which trade for investment at the expense of the environment, often become “havens” for polluting enterprises. Even if the center area has the emission reduction effect of agglomeration, the increase in unit pollution emissions in the peripheral areas (the pollution control facilities are generally poor, and the emission reduction efficiency is low) will lead to a decline in the overall environmental quality. 2) Energy utilization efficiency effect. When the city networks are formed by geographically adjacent and strongly functionally linked small cities, they can enjoy the same urban functions as a single megacity (Meijers et al., 2016). That is to say, based on industrial division, knowledge spillover, labor pool, and other forms of “borrowed size,” these spatial units can also produce increasing economic benefits in place of the “scale effect”. “Borrowed size” is often used as a mechanism for explaining polycentric structure to improve regional productivity. In fact, the “borrowed size” mechanism also has the effect of reducing emissions. Polycentric structure helps the spillover of industrial energy-saving technology through “borrowed size”, which is conducive to improving the energy utilization efficiency and reducing the industrial energy consumption intensity so as to realize the pollution emission reduction in the region. 3) Environmental treatment capacity effect. The unreasonable spatial structure in megacities leads to the excessive agglomeration of production factors, resulting in various symptoms of “urban problem”, which should be solved by optimizing the spatial structure and easing city functions. The space units that form polycentric structures are relatively small in size, so they have greater endogenous capacity to keep these economic, social, and environmental costs within affordable limits (Capello and Camagni, 2000). Therefore, under the same density of city-region, the polycentric structure can effectively alleviate the deterioration of urban problems and industrial problems caused by excessive agglomeration under monocentric structure. The theoretical framework for the effect of polycentric spatial structure on pollution emission was briefly constructed by the above analysis, as shown in Figure 2.
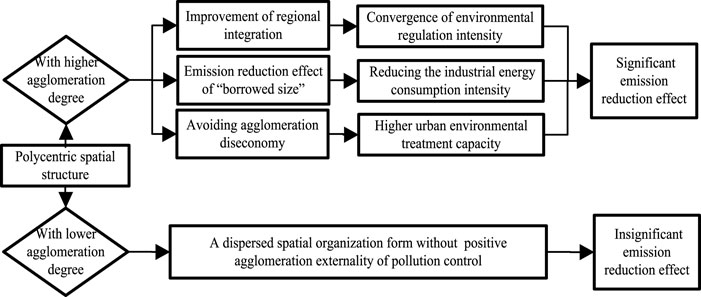
FIGURE 2. Framework for polycentric spatial structure influence on pollution emission.
4 The Measure Method of Spatial Structure and Empirical Methodology
4.1 The Concept and Measure Method of Spatial Structure
Agglomeration economy mainly refers to the increasing returns of scale formed by the industries located in the same place. With the attraction of agglomeration economy, economic activity and labor force are further concentrated. Even if the spatial density of economic activity is the same, it may be manifested in different spatial organization structures and distribution forms, forming spatial structural characteristics. In this study, the spatial structure was measured by the distribution form of the economic activity and labor force in space. The polycentric structure mainly refers to the vast majority of economic activities which are evenly distributed across space units of comparable size rather than concentrated in one spatial unit. Since the concept of spatial structure is inextricably related to geographical scale, it is necessary to consider the spatial structure of different scales in the study. Most of the foreign researches take metropolitan area as the basic research unit and think that metropolitan area is a more reasonable space scale which is superior to administrative area. Based on the reality of China, this study measures the spatial structure of China’s 21 city-regions3 (Supplementary Table SA1). The specific approach is as follows.
If a city-region has a monocentric spatial structure, it means that most of the economic activities in this area are concentrated in a central city, and there are significant differences between the central city and other cities in economic size. The polycentric structure means that most of the economic activities in the city-region are more evenly distributed in multiple cities, where the economic size and the number of labors in these central cities are relatively balanced.
There are three broad categories of empirical methods to measure polycentric city-regions. First, the rank-size-based method, based on the slope of a regression line that summarizes the statistical relationship between the size/importance and corresponding ranks of individual centers (Meijers and Burger, 2010). Second, the spatial model method, by comparing the observed distribution against certain ideal, typical benchmark scenarios (Vasanen, 2012; Hanssens et al., 2014). Third, the social network-based approach, by producing normalized polycentricity indicators based on the standard deviation of individual centers (Green, 2007; Liu et al., 2016). This study will use the first method to measure polycentricity, as the coefficient of rank-size estimation is the most commonly used (Meijers and Burger, 2010).
where Ri represents the rank of the ith city within the region, while Ci represents the economic size. The absolute value of p reflects the level of polycentricity; and the lower the absolute value P, the higher the polycentricity. In order to ensure that the measurement results do not lose comparability due to the different number of cities within the city-regions, different numbers of cities (2, 3, and 4) per city-regions are chosen, and then the average of these three scores is calculated. In addition, in order to verify the robustness of the measured results, the spatial structure index of city-region is calculated with gross domestic production (GDP) and the number of labor force (Labor).
4.2 Empirical Methodology
4.2.1 Threshold Regression Model
Threshold regression models specify that the regression functions may be not identical across all observations in a sample, and the individual observations could be divided into classes based on the value of an observed variable (Hansen, 1999). This kind of intuitive appeal makes threshold models have a wide variety of applications in economics. The theoretical study above shows that the effect of spatial structure on pollution emission will change with agglomeration, which means that the impact of spatial structure on pollution emission may have threshold effect. Therefore, in order to further verify this non-linear relationship, this study uses the panel threshold model of Hansen (1999) for reference and constructs the benchmark model as follows.
where i denotes region, t denotes time, agglomeration is the threshold variable for reflecting the agglomeration degree of spatial density of regional economic activities, I ( ) is the indicator function, and ψ is the threshold value to be estimated. The observations are divided into n “regimes” depending on whether the threshold variable agglomeration is smaller or larger than the threshold ψ. β1, β2,…,βn are the regression coefficients of spatial structure on the pollution emission intensity at different “regimes”, δ represents the coefficient of control variable, and εit is the error term.
The dependent variable (Pollution) is urban air pollution from industrial production which is measured by the ratio of industrial sulfur dioxide pollutant emission to industrial output (SI) and the ratio of industrial smoke and dust pollutant emission to industrial output (DI). Environmental regulation is an important policy affecting pollution emissions (Rigby, 2000; Cole et at., 2005). This study uses the pollution emission removal rate to measure the intensity of regional environmental regulation, the industrial sulfur dioxide removal rate (Ser), and the industrial smoke dust removal rate (Der). The threshold variable (Agglomeration) is measured by the ratio of GDP to the built-up area. With the regional agglomeration degree increasing, the polycentric spatial structure is more favorable to pollution emission reduction, and the expected coefficient is positive. Labor productivity (Pro) is also an important factor affecting pollution emission intensity. Generally speaking, the areas with higher labor productivity usually have more advanced technical facilities and human resources, which will lead to an increase in unit output and a reduction in regional pollution emission intensity. Therefore, the improvement of labor productivity has emission reduction effect. In this study, the output per unit labor force in industrial industry is used to measure the labor productivity, and the expected impact is negative. The variable Open is measured by the proportion of the region’s foreign capital actually utilized in the regional gross domestic product, which reflects the level of opening to the outside world and is beneficial to acquiring advanced emission reduction technologies from abroad. So, it has an emission reduction effect, and the expected impact is negative. Industrial structure (Ind) is measured by the ratio of the tertiary industry. The tertiary industry mainly provides clean products and services, hence increasing the proportion of tertiary industry has emission reduction effect. Science and technology input (Tech), in particular, the science and technology input on environmental protection, has a remarkable reduction effect, and will also promote emission reduction by improving the regional production efficiency.
The spatial distance and the administration across the cities are also considered in this study. The spatial distance of city-region is measured by the average traffic distance and time across the top four cities of economic aggregate in the city-region4,,. The shorter the traffic distance and the faster the traffic time, the more compact the city-region. A compact polycentric structure should have a bigger “borrowed size”, and the emission reduction effect may be more obvious. In addition, the city-region belonging to the same province has a relatively close administrative relationship and a convergence of environmental protection policies between the internal cities, which makes it possible to have a higher emission reduction effect.
4.2.2 Mediation Model
In order to explore the internal relationship between polycentric spatial structure and industrial pollution emission intensity, this study uses mediation model to verify the three mechanisms proposed above. Mediation model is well known for providing a mechanism test with impressive results in comparison with simple causal inference (Baron and Kenny, 1986; Zhao et al., 2010; Preacher and Kelley, 2011). As shown in Figure 3, mediator variables are variables that sit between independent variable and dependent variable and mediate the effect between them.
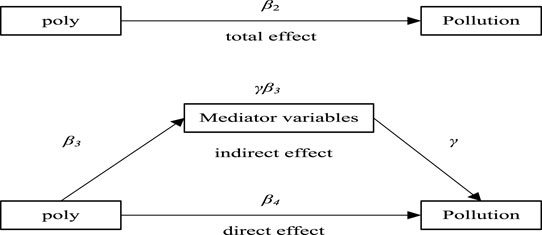
FIGURE 3. The procedure of the mediating effect test.
The procedure of the mediating effect test is, firstly, to construct the regression equation of the independent variable poly to the dependent variable pollution and the regression coefficient β2 represents total effect of polycentricity on pollution; the second step is to construct the regression of poly to mediator variable (MV) and the regression of poly and MV to pollution. β3 represents the regression coefficient for the poly when the MV is regressed on the poly, while γ is the coefficient for the MV when pollution is regressed on MV and poly. β4 represents the direct effect of the poly on pollution. If β3 and γ are significant in both the regressions, the indirect effect of the poly on pollution through MV can be concluded ; if β4 is not significant because of adding mediator variable, it can be concluded that there is a complete mediating effect between poly and pollution through MV. Mediation model is as follows:
Where i indicates city-region and t represents time. The indicators μi control for unobserved region and time effects, as well as εit is the residual of the equation. X are considered as other controlled factors. In order to correspond to the mechanism analysis above, the mediating effect of three mediator variables needs to be tested respectively. SERS and DERS represent the integration of environmental regulation stringency (ERS). SERS and DERS are measured separately by the standard deviation of Ser and Der in each prefecture-level city within the city-region. They have the same meanings; the smaller the standard deviation, the more consistent the environmental regulation stringency. This study holds that the polycentric city-regions are helpful to the convergence of environmental regulation stringency in each prefecture-level city within city-region and avoid the pollution leakage caused by pollution heaven and the deterioration of the overall quality of the environment. UEC represents the energy utilization efficiency of industry. Because the statistical caliber of energy consumption data at prefecture level in China is different, it is difficult to sum it up at city-region level, so this study uses the industrial electricity consumption per unit of industrial added value to represent the energy utilization efficiency of city-regions. The lower the unit of electricity consumption in the industrial production process, the higher the energy utilization efficiency, and less the pollution emission intensity of city-regions. HTR represents the environmental treatment capacity of city-regions, which is measured by the ratio of harmlessly treated garbage capacity to domestic garbage-treated capacity. The higher the ratio is, the stronger the environmental treatment capacity of city-regions. The dependent variable in this study is industrial pollution emission intensity, so it seems that it is more appropriate to use the index of industrial waste treatment as the mediator variable. This index may be collinear with the environmental regulation index. The harmless treatment rate of domestic garbage selected in this study is to reflect the environmental treatment capacity and environmental carrying capacity of city-regions. If the polycentric spatial structure can promote this kind of capacity, it will contribute to the environmental quality and air quality.
This study selects panel data from 21 city-regions as the analysis data setting from 2003 to 2016. The city-regions are shown in Supplementary Table SA1 in the Appendices. The city-regions’ data are aggregated by the city-level data within the city-regions. The data of the above variables are derived from the Statistical Yearbook of Chinese Cities, the Yearbook of Regional Statistics, and the statistical yearbooks and bulletins of cities. The definitions of the variables are shown in Table 1 and the descriptive statistics are shown in Table 2.
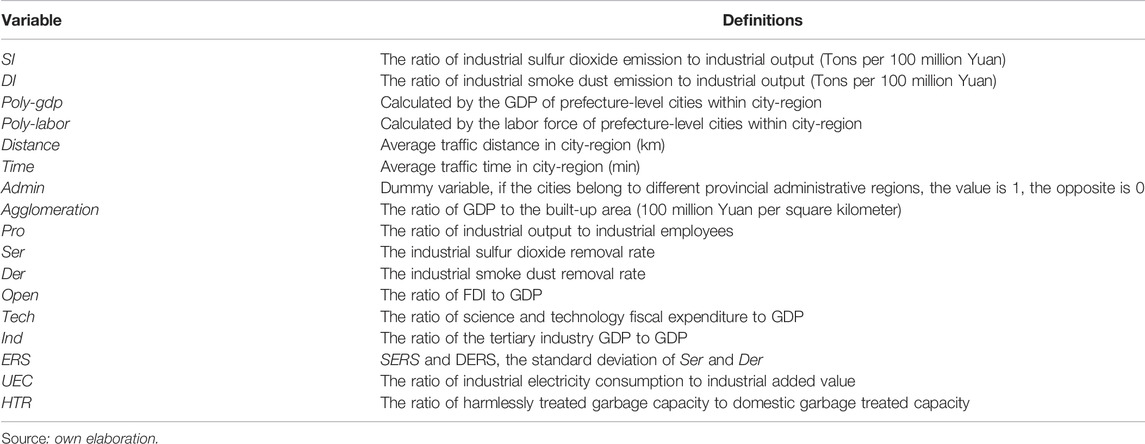
TABLE 1. Definition of variables.
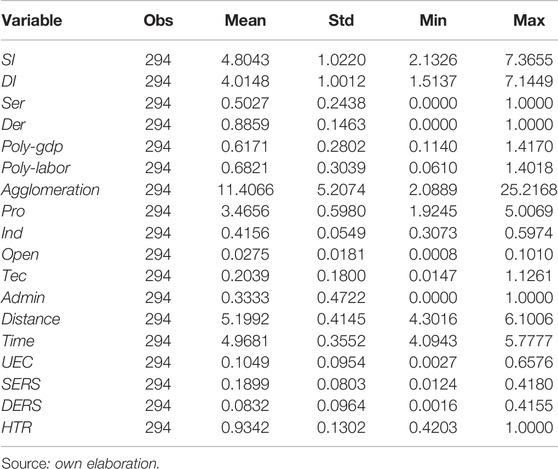
TABLE 2. The descriptive statistics of city-regions data.
5 Empirical Results
In this study, two pollutants, industrial sulfur dioxide and industrial smoke dust, are used for empirical regression to provide convincing and robust results. In city-regions samples, the number of individuals is 21, and the total observations are 294. This study uses pooled regression with cluster-robust standard error and uses the centralization method for both high- and low-order terms of interaction terms to solve the possible multiple collinearity problems.
5.1 The Interactive Emission Reduction Effect in City-Regions
The basic conclusions in Tables 3, 4 are consistent. The coefficients of Poly-gdp and Poly-labor are significantly positive, suggesting that the city-regions with lower spatial structure index restrain the pollution emission intensity. That is to say, the stronger the polycentricity of the city-regions, the more obvious emission reduction effect it has. This study adds the variable Agglomeration in regression (2) of Table 3 and it has a significantly negative parameter which indicates that it is an important factor for reducing pollution emission intensity. After the interaction term Poly-gdp*Agglomeration is added in regression (3), the coefficient of poly-gdp is still positive and the coefficient of interaction term Poly-gdp*Agglomeration is significantly positive and higher than 1, which indicates that a slight decline in spatial structure index would lead to an obvious decline in pollution emission intensity with the increase in agglomeration degree. Therefore, with the increase in agglomeration degree in city-regions, polycentric spatial structure is more conducive to the emission reduction effect. The regression results of other control variables in Tables 3, 4 are also robust. Introducing interaction term is used to investigate the linear relationship between spatial structure and pollution emission, while the possible non-linear relationship needs to be further verified.
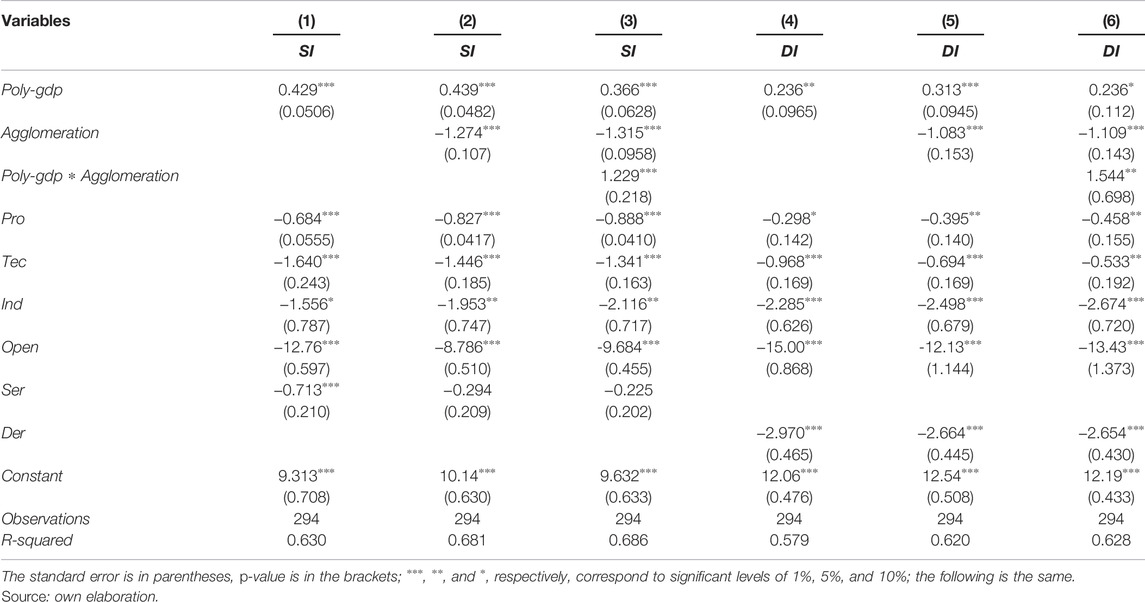
TABLE 3. The interactive emission reduction effect of economic polycentricity and agglomeration.

TABLE 4. The interactive emission reduction effect of labor force polycentricity and agglomeration.
5.2 The Threshold Effect of Spatial Structure on Pollution Emission in City-Regions
In this study, the threshold regression method proposed by Hansen (1996) is used to investigate threshold effect with pool data of city-regions, and the regression results are shown in Table 5.
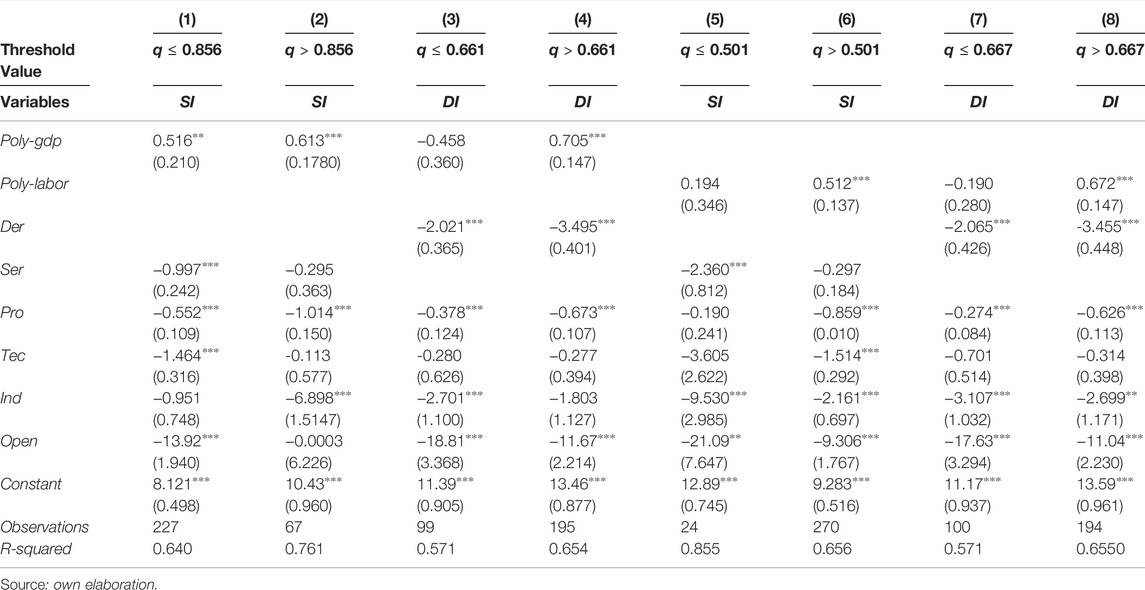
TABLE 5. The threshold regression for the effect of spatial structure on pollution emission reduction in city-regions.
Regression results of spatial structure index measured by GDP are (1)–(4) and measured by labor force are (5)–(8). In particular, when the agglomeration degree is lower than the threshold value, the coefficients of spatial structure index are positive as the industrial sulfur dioxide emission intensity is taken as the dependent variable, while in the regression of industrial smoke and dust emission intensity as the dependent variable, the coefficients of spatial structure index are negative; when the agglomeration degree is higher than threshold value, the coefficients of Poly-gdp and Poly-labor are significantly positive in all regressions. As a whole, spatial structure has no significant effect on pollution emission intensity at lower agglomeration degree, which could not support the conclusion that monocentric spatial structure has more emission reduction efficiency at a lower agglomeration degree in the above theoretical analysis. However, this conclusion has a realistic policy implication that even if the spatial structure of city-regions is changed by governmental power, it may have little effect on regional environmental pollution control at the stage of low agglomeration degree in city-regions. In city-regions with high degree of agglomeration, polycentricity has significant emission reduction effect, indicating that polycentric spatial planning would help reducing the pollution emission. This conclusion is still valid after changing different spatial structure index and pollution emission intensity index.
5.3 The Impact of Geographical Compactness and Administration on Pollution Emission in City-Regions
By adding the interaction terms in the benchmark regression respectively, this study further analyzes whether the emission reduction effect of spatial structure will be affected by the traffic distance and time across city-regions. Regression results of Table 6 show that after controlling other explanatory variables, the coefficients of spatial structure index are significantly positive, indicating that the smaller the spatial structure index of city-regions, the more obvious the emission reduction effect it has. However, the coefficient of interaction terms between the spatial structure and the compactness is significantly negative, which means that the emission reduction effect of polycentric spatial structure is attenuating with the lengthening of the distance and time of the traffic. The regression results are still robust by changing measures of interesting variables. This study further introduces the dummy variable Admin to explore whether intra-provincial city-regions or inter-provincial city-regions can reduce pollution emission intensity. The results in Table 6 show that the coefficient of Admin is positive, which indicates that the intra-provincial city-region has larger emission reduction effect than the inter-provincial city-regions. In other words, under the same conditions, it is easier for the intra-provincial city-regions to establish efficient and close environmental cooperation under the unified administrative government which is conductive to decrease pollution emission intensity. This conclusion is more significant in the regression (1)–(4), while not significant in the regression (5)–(8), in which the spatial structure index is measured with the labor force.
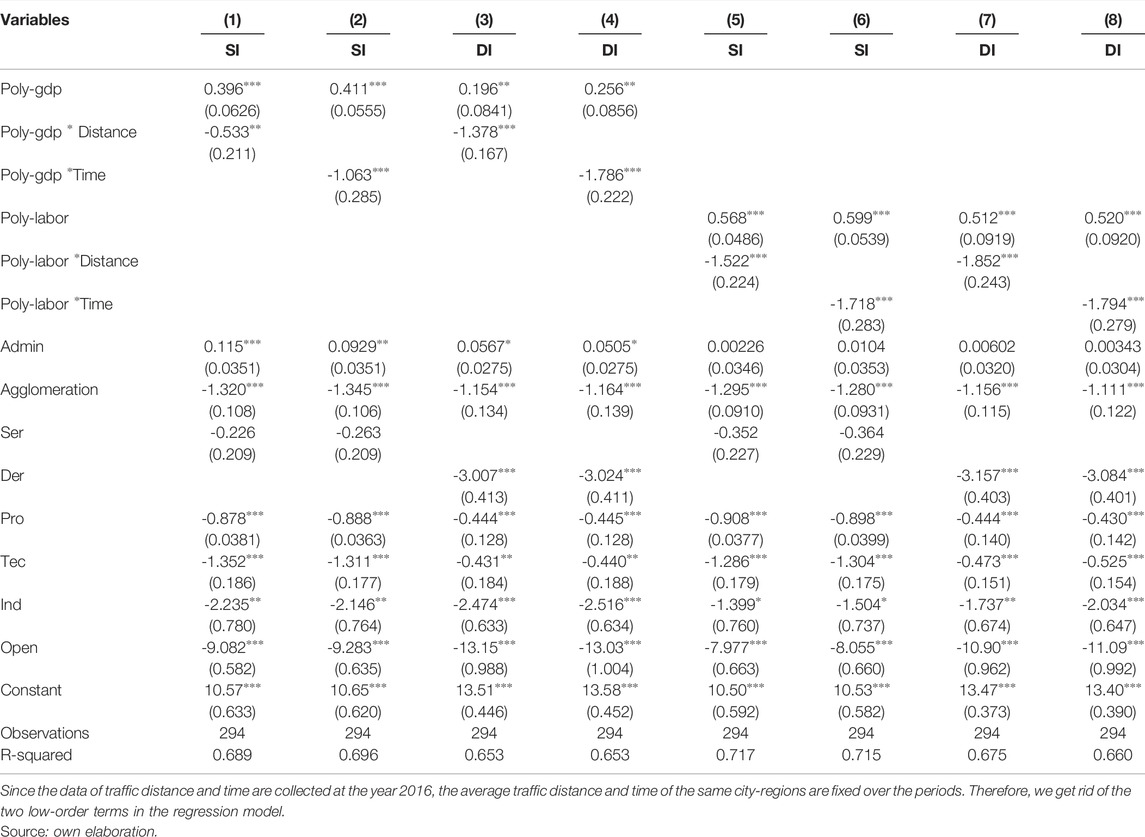
TABLE 6. The interactive emission reduction effect of polycentricity, geographical compactness, and administration.
5.4 The Mechanism Test of Spatial Structure Affecting Pollution Emission Reduction
Tables 7–9 correspond to the results of the mediation effect test with ERS, UEC, and HTR as the mediating variables, respectively. Regression results of industrial sulfur dioxide are (1)–(3). The coefficient of Poly-gdp in regression (1) is 0.411, reflecting the total effect of polycentricity on pollution emission intensity. In regression (2) of Table 7, the coefficient of Poly-gdp is significantly positive which suggests that the city-regions with lower spatial structure index would narrow the difference in environmental regulation intensity among cities in city-regions and promote the integration of environmental regulation policy. The coefficient of SERS in regression (3) is significantly positive too which shows that the smaller the standard deviation of environmental regulation intensity, the lower the pollution emission intensity. This suggests that polycentric spatial structure reduces pollution emission intensity by improving the convergence of environmental regulation stringency. The coefficient of Poly-gdp in regression (3) is 0.398 which is smaller than the total effect implying that SERS has an incomplete mediating effect. Regression results of industrial dust and smoke are (4)–(6), which have similar conclusions with regression (1)–(3).
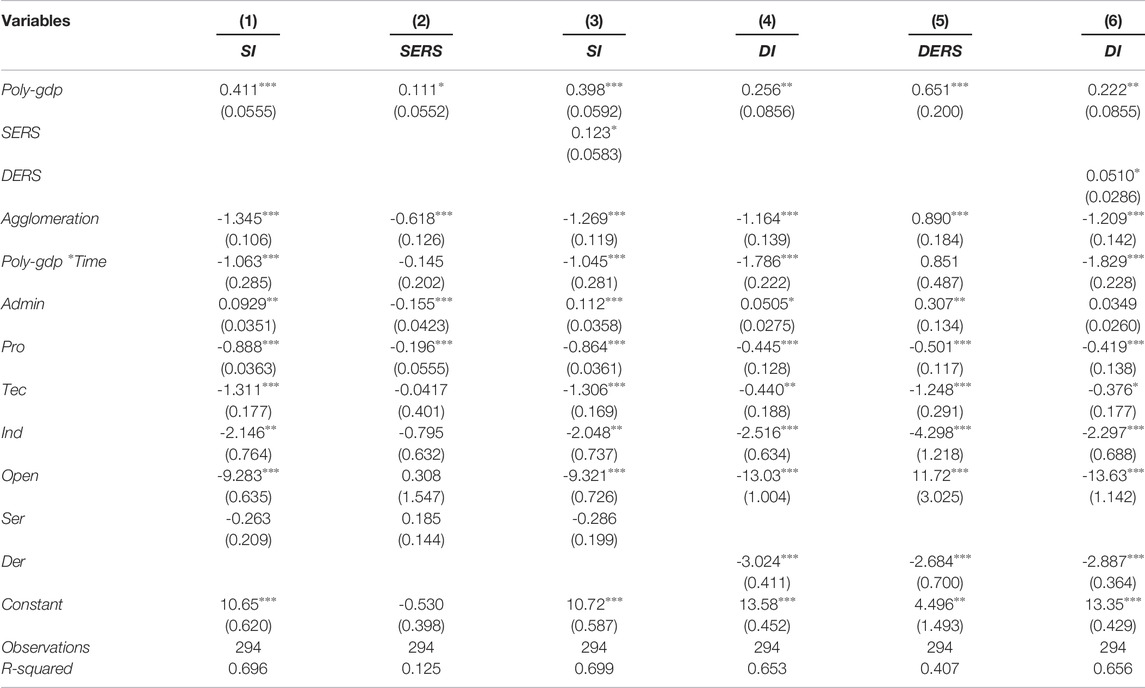
TABLE 7. The mediating emission reduction effect of ERS.
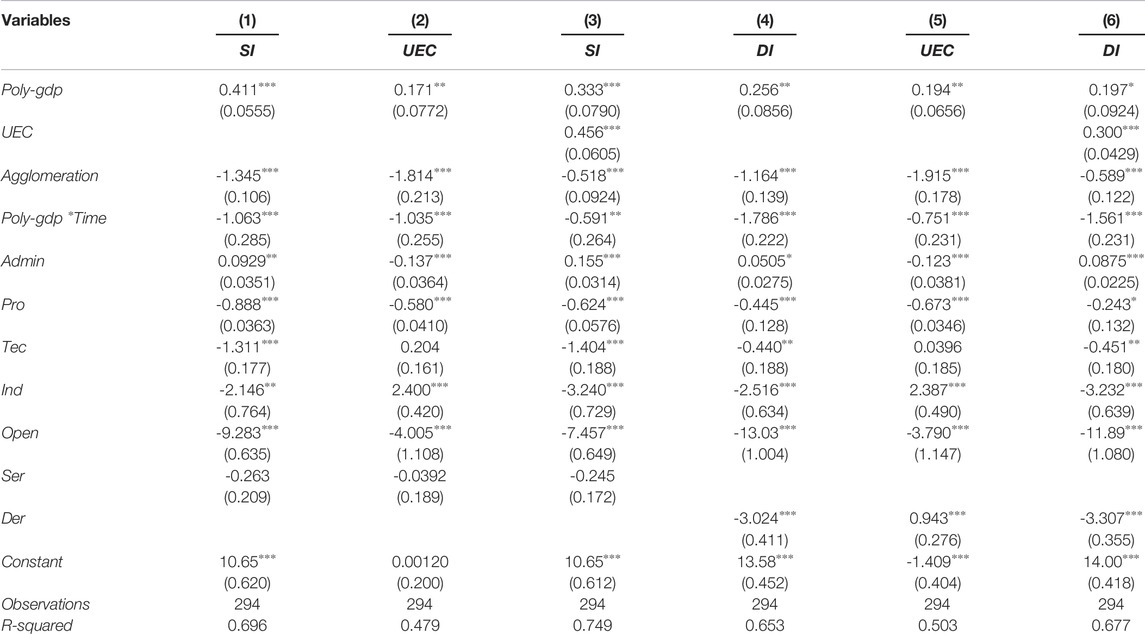
TABLE 8. The mediating emission reduction effect of UEC.
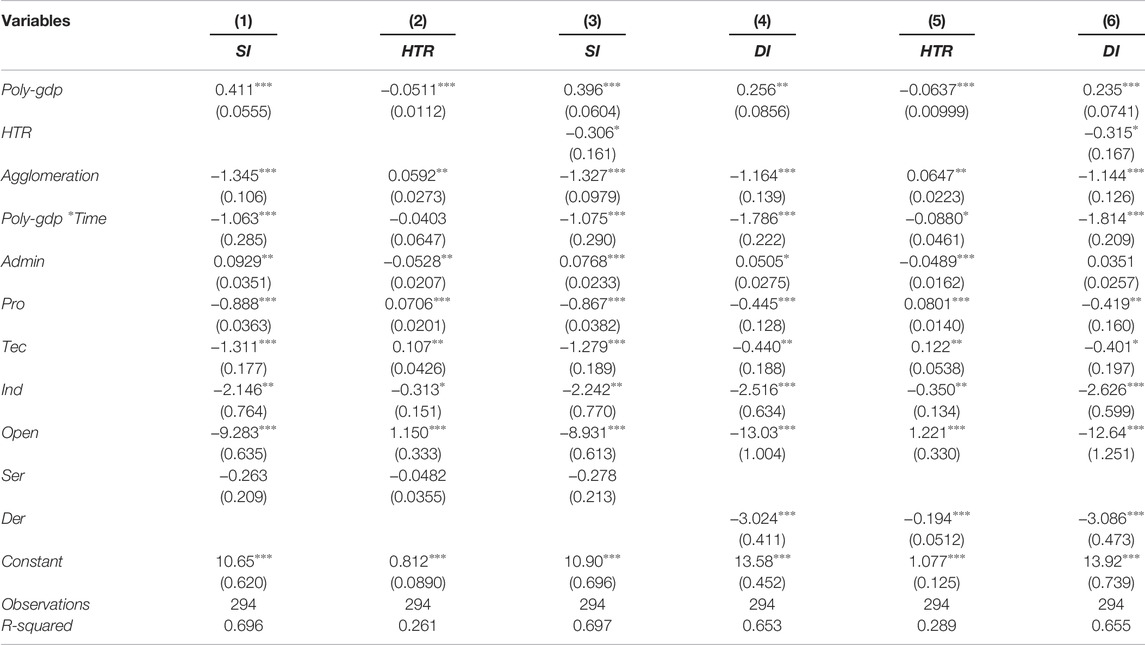
TABLE 9. The mediating emission reduction effect of HTR.
In regression (2) of Table 8, the coefficient of Poly-gdp is significantly positive which suggests that the city-regions with lower spatial structure index have a lower unit electricity consumption. The coefficient of UEC in regression (3) is significantly positive too that shows for every unit of UEC falling, SI falls by 0.456 units. This suggests that polycentric spatial structure will realize the decline in pollution emission intensity by reducing the unit energy consumption of city-regions. The coefficient of Poly-gdp in regression (3) is 0.333, which is smaller than total effect (0.411), implying that UEC is incomplete mediating effect. Regression results of industrial dust and smoke are (4)–(6), which have similar conclusions with regression (1)–(3).
In regression (2) of Table 9, the coefficient of Poly-gdp is significantly negative which suggests that the city-regions with lower spatial structure index have a higher environmental treatment capacity. The coefficient of HTR in regression (3) is significantly negative too, which shows that with the harmless garbage treatment rate increasing, pollution emission intensity falls. This suggests that polycentric spatial structure will reduce pollution emission intensity by improving the environmental treatment capacity of city-regions. The coefficient of Poly-gdp in regression (3) is 0.396, which is smaller than the total effect 0.411, implying that HTR is incomplete mediating effect. Regression results of industrial dust and smoke are (4)–(6), which have similar conclusions to regressions (1)–(3).
To sum up, the three mechanisms of polycentric spatial structure emission reduction effect proposed in this study have been verified in empirical research. Polycentric spatial structure narrows the difference of environmental regulation intensity within city-regions by promoting integration, reduces the energy consumption intensity through borrow size effect, and achieves a higher environmental treatment ability by avoiding agglomeration diseconomy, and finally, produces pollution emission reduction effect.
6 Conclusion
Based on the panel data of city-regions in China from 2003 to 2016, the study measures the spatial structure of city regions in terms of economic scale and labor force size. Based on this, the study explores the impact of spatial structure of urban regions on industrial air pollution by GMM and threshold regression methods. The main conclusions are as follows: (1) The interactive emission reduction effect of polycentric spatial structure is more and more obvious with the increase in agglomeration degree. (2) The emission reduction effect of polycentric spatial structure depends on regimes of the regional agglomeration. When the degree of agglomeration is low, spatial structure has no significant effect on pollution emission intensity, while the areas with a higher agglomeration degree, polycentric spatial structure would have significant emission reduction effect, and this effect is increasing. (3) On the scales of city-regions, the emission reduction effect of polycentric spatial structure will decrease with the lengthening of traffic distance and time across city-regions. After controlling the spatial organization form and geographical compactness of the city-regions, the intra-provincial city-regions have more emission reduction effects than the inter-provincial city-regions. (4) The emission reduction effect of polycentric spatial structure can be explained by three mechanisms: regional environmental regulation integration, energy utilization efficiency, and environmental treatment capacity.
The Chinese government has always played a dominant role in the evolution of the city-regions’ spatial structure. Even if a consensus on this issue could be formed that the rational spatial structure has a dual policy dividend of coordinating regional development and improvement of air quality, some real obstacles still need to be solved by the government, so as to achieve the expected emission reduction effect. The great practical significance of this study is as follows: (1) It is worth noting that the emission reduction effect of polycentricity depends on agglomeration degree. When the agglomeration is low, the monocentric spatial structure will play a better emission reduction effect; even if a polycentric spatial structure is achieved through administrative forces, the effect of this action on emissions reduction may be negligible. (2) The government should promote the transformation of the spatial structure from a monocentricity to polycentricity according to the actual situation of the region. Positive measures that the government can take includes rationally planning infrastructure, strengthening cooperation mechanism, breaking down the administrative barrier, and eliminating technology gap, to ensure that the expected emission reduction effect can be achieved. (3) With the increasing traffic distance and time in the city-regions, the emission reduction effect of polycentricity decreases. The city-regions should focus on the construction of efficient and fast transportation networks to promote the optimal allocation of production factors. At the same time, the joint construction and infrastructure sharing in city-regions will reduce low-level repetitive construction by central government planning guidance. (4) In addition to the geographical distance, the administrative barriers will weaken the regional connection and hinder the efficiency of polycentric spatial structure. Therefore, city-regions should actively establish a cooperation mechanism to fairly divide emission reduction responsibilities considering the industrial division, narrow the green technology gap, form a unified consensus on emission reduction, and set up the compensation mechanism for technology transfer and funds support.
Although this study examines in detail how the polycentricity in city-regions affects industrial pollution emissions and analyses the mechanisms, it considers the polycentricity mainly in terms of the level of economic development and the labor force. Richer conclusions could be drawn if functional polycentricity or the polycentricity of transport networks was used to measure the polycentric spatial structure.
Data Availability Statement
The original contributions presented in the study are included in the article/Supplementary Material; further inquiries can be directed to the corresponding author.
Author Contributions
XH: conceptualization, methodology, writing—original. JD: methodology, writing—reviewing and editing. CT: validation, resources.
Funding
This study was funded by the National Natural Science Foundation of China (No. 71974120) and Social Science Planning Project of Shanghai (No. 2018BJL005).
Conflict of Interest
The authors declare that the research was conducted in the absence of any commercial or financial relationships that could be construed as a potential conflict of interest.
Publisher’s Note
All claims expressed in this article are solely those of the authors and do not necessarily represent those of their affiliated organizations, or those of the publisher, the editors, and the reviewers. Any product that may be evaluated in this article, or claim that may be made by its manufacturer, is not guaranteed or endorsed by the publisher.
Acknowledgments
The authors would like to thank the editors and reviewers for their helpful comments and suggestions.
Supplementary Material
The Supplementary Material for this article can be found online at: https://www.frontiersin.org/articles/10.3389/fenvs.2022.879395/full#supplementary-material
Footnotes
1The full name of the Five-Year Plan is the outline of the 5-year plan of the national economy and social development of the People’s Republic of China, which is an important part of the national economic plan of China that belongs to the long-term plan. It mainly plans the major national construction projects, the distribution of productive forces, and the structure of the national economy and sets out the objectives and directions for the long-term development of the national economy. China is implementing the 13th Five-Year Plan (2016–2020), emphasizing the concept of “innovation, coordination, green, openness and sharing”.
2Spatial structure index is measured by the coefficient of rank-size estimation, which is calculated by the GDP of prefecture-level cities within city-region. For specific calculation methods, see Section 4 below.
3We deleted three city-regions, namely East Longhai, Central and South Tibet, and Northern Slope of Tianshan, which were identified in the 2013 China Regional Economic Development Report, because the number of cities in these three city-regions is so few and each of them contains only three cities. Finally, the city-region data consist of 21 individuals.
4The traffic distance and time are based on the optimal planning route of Baidu map. The top four cities of economic aggregate in the city-region can form six (c42) city pairs and take the mean value as traffic distance and time of city-region.
5This study has dealt with the 24 urban agglomerations identified in the 2013 China Regional Economic Development Report by deleting three urban agglomerations, namely East Longhai, Central and South Tibet, and Northern Slope of Tianshan. Because the number of cities in each urban agglomeration mentioned above is so few.
6The 21 urban agglomerations contain 173 urban units. But Yanbian Korean Autonomous Prefecture, Linxia Hui Autonomous Prefecture, Chuxiong, Qiandongnan Prefecture, Jiyuan, Tianmen, Xiantao, Qianjiang, and Yang Ling are not prefecture-level city, so these observations are deleted; the data of Bijie, Zhongwei, and Chaohu in the sample observation period miss more, which are deleted too.
References
Banzhaf, H. S., and Lavery, N. (2010). Can the Land Tax Help Curb Urban Sprawl? Evidence from Growth Patterns in Pennsylvania. J. Urban Econ. 67 (2), 165–179. doi:10.1016/j.jue.2009.08.005
Baron, R. M., and Kenny, D. A. (1986). The Moderator-Mediator Variable Distinction in Social Psychological Research: Conceptual, Strategic, and Statistical Considerations. J. Personality Soc. Psychol. 51 (6), 1173–1182. doi:10.1037/0022-3514.51.6.1173
Borrego, C., Martins, H., Tchepel, O., Salmim, L., Monteiro, A., and Miranda, A. I. (2006). How Urban Structure Can Affect City Sustainability from an Air Quality Perspective. Environ. Model. Softw. 21 (4), 461–467. doi:10.1016/j.envsoft.2004.07.009
Burchfield, M., Overman, H. G., Puga, D., and Turner, M. A. (2005). Causes of Sprawl: a Portrait from Space. Q. J. Econ. 121 (2), 587–633. doi:10.1162/qjec.2006.121.2.587
Burgalassi, D., and Luzzati, T. (2015). Urban Spatial Structure and Environmental Emissions: a Survey of the Literature and Some Empirical Evidence for Italian Nuts 3 Regions. Cities 49, 134–148. doi:10.1016/j.cities.2015.07.008
Camagni, R., Gibelli, M. C., and Rigamonti, P. (2002). Urban Mobility and Urban Form: The Social and Environmental Costs of Different Patterns of Urban Expansion. Ecol. Econ. 40 (2), 199–216. doi:10.1016/s0921-8009(01)00254-3
Capello, R., and Camagni, R. (2000). Beyond Optimal City Size: an Evaluation of Alternative Urban Growth Patterns. Urban Stud. 37, 1479–1496. doi:10.1080/00420980020080221
Cheng, Z. (2016). The Spatial Correlation and Interaction between Manufacturing Agglomeration and Environmental Pollution. Ecol. Indic. 61 (2), 1024–1032. doi:10.1016/j.ecolind.2015.10.060
Ciccone, A., and Hall, R. E. (1996). Productivity and the Density of Economic Activity. Am. Econ. Rev. 86 (1), 54–70.
Cole, M. A., Elliott, R. J. R., and Shimamoto, K. (2005). Industrial Characteristics, Environmental Regulations and Air Pollution: an Analysis of the UK Manufacturing Sector. J. Environ. Econ. Manag. 50 (1), 121–143. doi:10.1016/j.jeem.2004.08.001
Denant-Boemont, L., Gaigné, C., and Gaté, R. (2018). Urban Spatial Structure, Transport-Related Emissions and Welfare. J. Environ. Econ. Manag. 89, 29–45. doi:10.1016/j.jeem.2018.01.006
Eraydin, A. (2008). The Impact of Globalisation on Different Social Groups: Competitiveness, Social Cohesion and Spatial Segregation in Istanbul. Urban Stud. 45, 1663–1691. doi:10.1177/0042098008091496
Glaeser, E. L., and Kahn, M. E. (2004). Chapter 56 Sprawl and Urban Growth. Handb. Regional Urban Econ. 4, 2481–2527. doi:10.1016/s1574-0080(04)80013-0
Glaeser, E. L., Ponzetto, G. A. M., and Zou, Y. (2016). Urban Networks: Connecting Markets, People, and Ideas. Pap. Regional Sci. 95 (1), 17–59. doi:10.1111/pirs.12216
Glaser, E. L., and Kahn, M. E. (2010). The Greenness of Cites: Carbon Dioxide Emissions and Urban Development. J. Urban Econ. 67, 404–418. doi:10.1016/j.jue.2009.11.006
Green, N. (2007). Functional Polycentricity: A Formal Definition in Terms of Social Network Analysis. Urban Stud. 44 (11), 2077–2103. doi:10.1080/00420980701518941
Han, S., Sun, B., and Zhang, T. (2020). Mono- and Polycentric Urban Spatial Structure and pm2.5 Concentrations: Regarding the Dependence on Population Density. Habitat Int. 104, 102257. doi:10.1016/j.habitatint.2020.102257
Hansen, B. E. (1996). Inference when a Nuisance Parameter Is Not Identified under the Null Hypothesis. Econometrica 64, 413–430. doi:10.2307/2171789
Hansen, B. E. (1999). Threshold Effects in Non-dynamic Panels: Estimation, Testing, and Inference. J. Econ. 93 (2), 345–368. doi:10.1016/s0304-4076(99)00025-1
Hanssens, H., Derudder, B., and Van Aelst, S. (2014). Assessing the Functional Polycentricity of the Megacity Egion of Central Belgium Based on Advanced Producer Service Transaction Links. Reg. Stud. 48 (12), 1939–1953. doi:10.1080/00343404.2012.759650
Kamal-Chaoui, L., and Robert, A. (2009). Competitive Cities and Climate Changes. OECD Reg. Dev. Work. Pap., 2. doi:10.1787/218830433146
Ke, S. (2010). Agglomeration, Productivity, and Spatial Spillovers across Chinese Cities. Ann. Regional Sci. 45 (1), 157–179. doi:10.1007/s00168-008-0285-0
Lalive, R., Luechinger, S., and Schmutzler, A. (2017). Does Expanding Regional Train Service Reduce Air Pollution? J. Environ. Econ. Manag. 92 (11), 744–764. doi:10.1016/j.jeem.2017.09.003
Levinson, A. (2009). Technology, International Trade, and Pollution from Us Manufacturing. Am. Econ. Rev. 99 (5), 2177–2192. doi:10.1257/aer.99.5.2177
Li, F., and Zhou, T. (2019). Effects of Urban Form on Air Quality in China: An Analysis Based on the Spatial Autoregressive Model. Cities 89, 130–140. doi:10.1016/j.cities.2019.01.025
Li, Y., Zhu, K., and Wang, S. (2020). Polycentric and Dispersed Population Distribution Increases pm2.5 Concentrations: Evidence from 286 Chinese Cities, 2001-2016. J. Clean. Prod. 248, 119202. doi:10.1016/j.jclepro.2019.119202
Liu, X., Derudder, B., and Wu, K. (2016). Measuring Polycentric Urban Development in China: an Intercity Transportation Network Perspective. Reg. Stud. 50, 1302–1315. doi:10.1080/00343404.2015.1004535
Madlener, R., and Sunak, Y. (2011). Impacts of Urbanization on Urban Structures and Energy Demand: what Can We Learn for Urban Energy Planning and Urbanization Management? Sustain. Cities Soc. 1, 45–53. doi:10.1016/j.scs.2010.08.006
Meijers, E. J., Burger, M. J., and Hoogerbrugge, M. M. (2016). Borrowing Size in Networks of Cities: City Size, Network Connectivity and Metropolitan Functions in Europe. Pap. Regional Sci. 95 (1), 181–198. doi:10.1111/pirs.12181
Meijers, E. J., and Burger, M. J. (2010). Spatial Structure and Productivity in US Metropolitan Areas. Environ. Plan. A 42, 1383–1402. doi:10.1068/a42151
Newman, P. W. G., and Kenworthy, J. R . (1989). Cities and Automobile Dependence: An International Source Book. Aldershot: Gower publishing company.
Preacher, K. J., and Kelley, K. (2011). Effect Size Measures for Mediation Models: Quantitative Strategies for Communicating Indirect Effects. Psychol. Methods 16 (2), 93–115. doi:10.1037/a0022658
Qin, B., and Wu, J. (2014). Does Urban Concentration Mitigate CO2 Emission? Evidence from China from 1998-2008. China Econ. Rev. 35, 220–231.
Rezza, A. A. (2013). FDI and Pollution Havens: Evidence from the Norwegian Manufacturing Sector. Ecol. Econ. 90, 140–149. doi:10.1016/j.ecolecon.2013.03.014
Rigby, D. Y. T. (2000). European Environmental Regulations to Reduce Water Pollution: an Analysis of Their Impact on UK Dairy Farms. Eur. Rev. Agric. Econ. 23 (1), 59–78. doi:10.2307/1243803
Roca, J., Padilla, E., Mariona, F., and Galletto, V. (2001). Economic Growth and Atmospheric Pollution in Spain: Discussing the Environmental Kuznets Curve Hypothesis. Ecol. Econ. 39 (1), 85–99. doi:10.1016/s0921-8009(01)00195-1
Tsakiris, N., Michael, M. S., and Hatzipanayotou, P. (2014). Asymmetric Tax Policy Responses in Large Economies with Cross-Border Pollution. Environ. Resour. Econ. 58 (4), 563–578. doi:10.1007/s10640-013-9710-7
Vasanen, A. (2012). Functional Polycentricity: Examining Metropolitan Spatial Structure through the Connectivity of Urban Sub-centres. Urban Stud. 49 (16), 3627–3644. doi:10.1177/0042098012447000
Veneri, P. (2014). Spatial Structure and Carbon Dioxide Emissions Due to Commuting: an Analysis of Italian Urban Areas. Reg. Stud. 48 (12), 1993–2005. doi:10.1080/00343404.2013.827333
Wang, M., and Zhang, B. (2020). Examining the Impact of Polycentric Urban Form on Air Pollution: Evidence from China. Environ. Sci. Pollut. Res. 27 (34), 43359–43371. doi:10.1007/s11356-020-10216-1
Zeng, D. Z., and Zhao, L. (2009). Pollution Havens and Industrial Agglomeration. J. Environ. Econ. Manag. 58 (2), 141–153. doi:10.1016/j.jeem.2008.09.003
Zhang, T. L., Sun, B. D., and Li, W. (2017). The Economic Performance of Urban Structure: From the Perspective of Polycentricity and Monocentricity. Cities 68, 18–24. doi:10.1016/j.cities.2017.05.002
Keywords: polycentric city-regions, industrial air pollution, agglomeration, interactive effect, threshold effect
Citation: Han X, Dou J and Tang C (2022) Polycentricity, Agglomeration, and Industrial Air Pollution in the Chinese City-Regions. Front. Environ. Sci. 10:879395. doi: 10.3389/fenvs.2022.879395
Received: 19 February 2022; Accepted: 24 May 2022;
Published: 07 July 2022.
Edited by:
Salman Qureshi, Humboldt University of Berlin, GermanyReviewed by:
Bohdan Slavko, The University of Sydney, AustraliaClaudio Sassanelli, Politecnico di Bari, Italy
Luigi Aldieri, University of Salerno, Italy
Copyright © 2022 Han, Dou and Tang. This is an open-access article distributed under the terms of the Creative Commons Attribution License (CC BY). The use, distribution or reproduction in other forums is permitted, provided the original author(s) and the copyright owner(s) are credited and that the original publication in this journal is cited, in accordance with accepted academic practice. No use, distribution or reproduction is permitted which does not comply with these terms.
*Correspondence: Jianmin Dou, am1kb3VAbWFpbC5zaHVmZS5lZHUuY24=