- 1China Urban Construction Design and Research Institute Co., Ltd., Beijing, China
- 2Key Laboratory of Building Collapse Mechanism and Disaster Prevention, Institute of Disaster Prevention, China Earthquake Administration, Sanhe, China
- 3Shanghai Municipal Engineering Design and Research Institute (Group) Institute Co., Ltd., Shanghai, China
Understanding how external water affects the water quality of target water bodies is an important prerequisite for predicting water quality changes and formulating pollutant reduction plans. Using the EFDC modeling system platform, this study constructed the hydrodynamic and pollutant dispersion and diffusion models of Zhangze Reservoir, and by using the hydrology and water quality data from 2013 to 2018, this study examines the different water quality responses of Zhangze Reservoir under different inflow water control scenarios. The results show that the simulated value of the hydrological station is basically consistent with the measured value of the hydrological station. Under the current Class III water quality requirements for Zhangze Reservoir, direct inflow of effluent from the wastewater treatment plant of the main urban area into the reservoir will have a significant impact on the water quality. When the effluent is purified through constructed wetlands, it significantly improves the water quality of the reservoir, but the concentration of TN and TP still cannot reach the Class III standard in the short term,. When all rivers entering the reservoir meet the standard and the effluent from the wastewater treatment plant in the main urban area does not enter the reservoir, the content of COD, ammonia nitrogen and TP in water will reach the Class III standard, but reducing the TN content to meet the standard requirement will be difficult within 3 years.
1 Introduction
In recent decades, various types of pollution and ecological threats have been undermining lakes, which hold more than 90% of the available surface freshwater on earth (Gong et al., 2016a). Due to the complex sources of water pollutants, it is difficult to identify how the water quality responds to pollutants, predicting water quality change has thus become a challenge. The EFDC (Environmental Fluid Dynamics Code) model is one of the water environment ecological models recommended by the United States Environmental Protection Agency (USEPA). Compiled in FORTRAN language, its main sub-modules, including hydrodynamics, sediment transport, water quality and eutrophication, and sediments are well coupled into an overall model, which has been successfully applied to the study of rivers, lakes, reservoirs, estuaries, bays and coastal zones in various aspects, including floodplain numerical simulation, hydrodynamic simulation, thermo-salt simulation and sediment suspension simulation, among other research subjects (Huang et al., 2017; Jia et al., 2018; Luo and Li, 2018; Liang et al., 2020; Zhang et al., 2020; Claudia et al., 2021; Hwang et al., 2021; Pyo et al., 2021; Chen et al., 2021; Zheng et al., 2021; Jiang et al., 2022; Wang et al., 2022).
As an important municipal infrastructure, wastewater treatment plant plays a significant role in reducing water environmental pollution caused by direct discharge of wastewater. The environmental quality standard for surface water is not necessarily consistent with the discharge standard for wastewater treatment plant. Therefore, although the effluent of wastewater treatment plant meets the discharge standard, when it is discharged into the water body with higher water environmental quality requirements, it will still have varying degrees of influence on the water quality of receiving water body. EFDC model can be adopted to simulate the influence of wastewater treatment plant effluent on the water quality of receiving water body, which provides a basis for the selection of effluent discharge path of wastewater treatment plant and the design of water environmental quality compliance scheme. Fan Qiaoming et al. (Fan and Ding, 2016) established a hydrodynamic and pollutant transport and diffusion model based on EFDC, and quantitatively evaluated the impact of tailwater on the water environment in the port at different discharge outlet locations and under different discharge standards. Liu Cheng et al. (Cheng et al., 2003) used mathematical models to simulate the hydrodynamics of the Yangtze River, and analyzed the dilution and diffusion field of pollutants discharged from the tailwater of wastewater treatment plants. Qian Xiaojuan et al. (Qian et al., 2013) studied the influence of the tail water discharged from Guanyinshan Sewage Treatment Plant in Nantong City on the water quality of the unsteady strong tidal river section. Tian Tao et al. (Tian et al., 2014) used the EFDC model to examine both the normal abnormal discharge scenarios of a wastewater treatment plant in Xuanchenganalyze, analyzing the time that pollutant mass reaches downstream and the corresponding concentration effects. Vijay R et al. (Vijay et al., 2010) used DO, BOD and Escherichia coli as indicators to study the impact of tailwater from wastewater treatment plants on the natural water body. ZHANG et al. (Zhang et al., 2017) took the tailwater of Penglang waste water treatment plant in Kunshan City as an example and studied the comprehensive benefits of tail water recycling under six design schemes, and determined the optimal operation of tailwater recycling in the wastewater treatment plant based on the EFDC model. Zhangze Reservoir, the third largest surface water body in Shanxi Province, China, is located around the central urban area of Changzhi, and receives a large amount of effluent from wastewater treatment plant in the main urban area. To make the water quality of Zhangze Reservoir meet the standard, it is crucial to analyze the influence of effluent from wastewater treatment plant on reservoir water quality, and then scientifically design effluent discharge and water quality improvement scheme.
By using EFDC software, this study has achieved the following outcomes:
A hydrodynamic-water quality model of Zhangze Reservoir has been constructed for the first time, which lays a foundation for the water quality management of target water body;Combined with local environmental management, water quality standards and technical conditions, a variety of discharge scenarios of wastewater treatment plants have been set up, and the water quality simulation of Zhangze Reservoir has been carried out; In the process of model simulation, the influence of constructed wetlands on effluent discharge from wastewater treatment plants has been taken into consideration, and the effects of improving water quality of Zhangze Reservoir under different operating conditions have been analyzed.
2 Material and Approach
2.1 Study Area
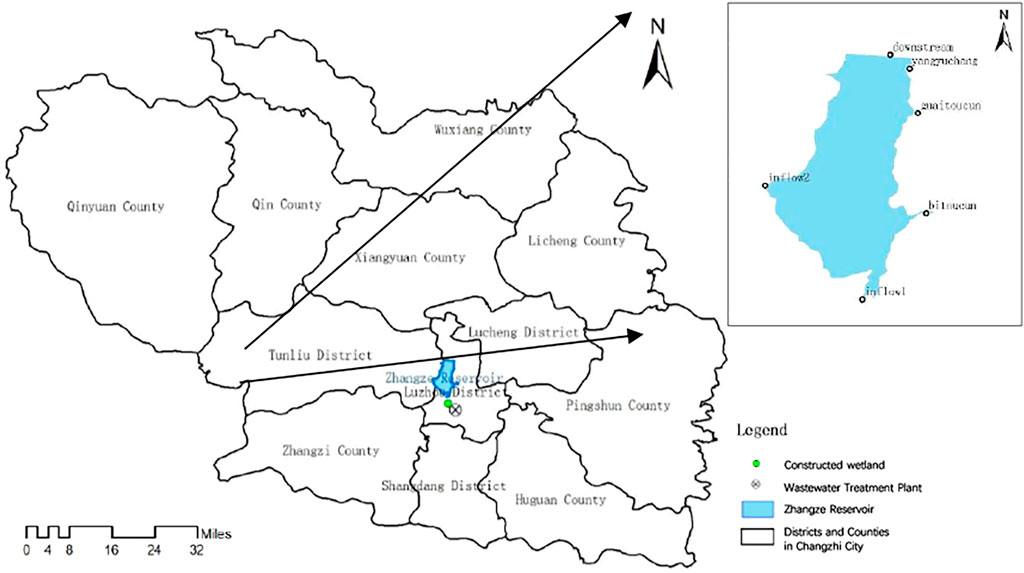
Location map of the study area in Figure 1. With a total capacity of 427 million m3 and an average annual inflow of 225 million m3, it is a large-scale water conservancy project that serves multiple purposes including industrial and urban water supply, irrigation, flood control, aquaculture and tourism (Tian et al., 2014). The reservoir plays an important role in promoting regional social and economic development, protecting lives and properties of the people downstream, as well as improving the ecological environment and protecting biodiversity.
In recent years, under the rapid social and economic development of the upper reaches of Zhangze Reservoir, people’s production activities and everyday living have had a serious impact on the water quality of the reservoir. According to the DB14/67-2014 standard for surface water quality in Shanxi Province, the water quality of Zhangze Reservoir shall be Class III as specified in China’s national standard Environmental quality standards for surface water (GB 3838-2002) (See Table 1 for selected indicators), but results of water quality monitoring in the reservoir area from 2013 to 2017 show that the maximum concentrations of TN, TP, COD, and BOD all exceed the limit of surface water Class V standard, while the average concentration of these substances exceed the limit of Class III standard; the maximum concentrations of NH3-N is also much higher than the limit of Class III for surface water, close to that of Class V (Vijay et al., 2010). In order to effectively improve the water quality of the area, Changzhi City implemented the upgrade and renovation project of the main urban area and Changbei Wastewater Treatment Plant, which improved the quality of the effluent from the wastewater treatment plant. After the upgrade and renovation, the design capacity of the wastewater treatment plant in the main urban area is 200,000 m3 per day, and the designed effluent quality shall meet the Class I A standard specified in China’s Discharge Standard of Pollutants for Municipal Wastewater Treatment Plant (GB18918-2002) (See Table 2 for Selected indicators). The three indicators of ammonia nitrogen, COD and total phosphorus shall meet the Class V standard for surface water. Besides the part of water being recycled, about 100,000 m3/day of effluent needs to be discharged, directly or indirectly into the Zhangze Reservoir, thus significantly affecting its water quality.

TABLE 1. Partial pollutant indicators of Environmental Quality standards for surface water (lakes and reservoirs) in mg/L.
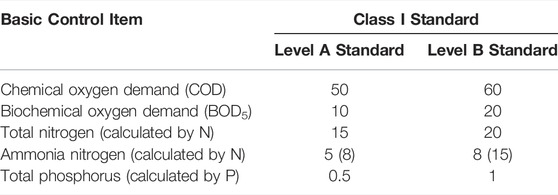
TABLE 2. Partial pollutant indicators of Discharge standard of pollutants for municipal wastewater treatment plant (daily mean average) in mg/L.
2.2 Modeling Process and Scenario Design
Based on EFDC model, a three-dimensional hydrodynamic-water quality numerical model of Zhangze Reservoir has been established to simulate the changes of hydrodynamic and water quality of Zhangze Reservoir, and the scenario analysis of the influence of effluent discharge from wastewater treatment plant on water quality has been carried out. Combined with the field situation of the studied area and the water environment control plan, the feasible scenarios have been designed: 1) the analysis of the multiple-year water quality data of the inflowing rivers of Zhangze Reservoir (Table 3) shows that in recent years, the water quality indicators of the main inflowing rivers of Zhangze Reservoir are not up to standard, and the water quality of Zhangze Reservoir will be directly affected after the rivers flow into the reservoir. In order to accurately analyze the influence of the effluent from the wastewater treatment plant on the water quality of the reservoir, the simulation analysis has been carried out on the assumption that the water quality of the inflowing rivers meets the standard and the effluent from the wastewater treatment plant in the main urban area does not enter the reservoir; 2) on the basis of maintaining the current water quality of the inflowing rivers (the inflowing water quality exceeds the standard), three discharge scenarios of wastewater treatment plant have been set up respectively: ① the effluent from the wastewater treatment plant directly enters the reservoir; ② the effluent from the wastewater treatment plant enters the reservoir after being purified by the constructed wetland system; ③ the effluent from the wastewater treatment plant does not enter the reservoir and is discharged into the downstream river. The research method flow is shown in Figure 2.
2.3 EFDC-Based Hydrodynamic Model Construction for Zhangze Reservoir
2.3.1 Basic Equations
The hydrodynamic module of the EFDC model is an important basis for the other sub-modules. The hydrodynamic control equation formulated in curvilinear-orthogonal horizontal coordinates and a σ vertical coordinate can be expressed as (Zhang et al., 2017):
where:
2.3.2 Two-Dimensional Hydrodynamic Model Data Input
The input data for the two-dimensional hydrodynamic model include grid data of the Zhangze Reservoir area (closed water and land boundaries in the reservoir area), water depth and water level elevation data of the reservoir area, open boundary flow and water level time series data, model simulation parameters, initial water level simulation and setting of flow, simulation time and time step, etc.
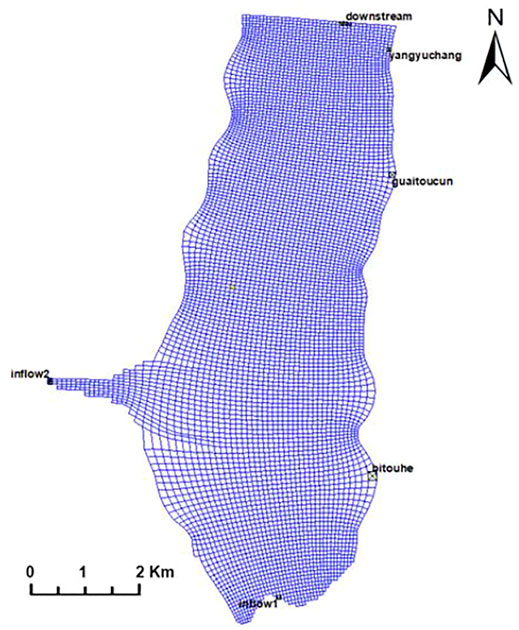
Model grid settings: The model divides the studied area with triangular grids, which have adjustable grid size and density and can better fit the water and land boundaries of the studied area. The water and land boundary line data and water depth data of the studied area are obtained from the CAD drawing, and then the water and land boundary line data are imported into the grid generator to generate the study area grid and set the model open boundary. Next, the water depth data is imported into the grid and interpolated to generate the topographic map of the studied area, as shown in Figure 3.
EFDC has good versatility, strong numerical calculation ability, and in particular high simulation accuracy of hydrodynamic module (Li, 2014). The parameters of the hydrodynamic module mainly include bed surface roughness, time step, horizontal kinetic energy or material diffusion coefficient, horizontal diffusion coefficient, background value of kinematic viscosity coefficient, background value of molecular diffusion coefficient, etc (Wang, 2019). The parameters in the model are confirmed after several calibrations, and the parameter values are shown in Table 3.
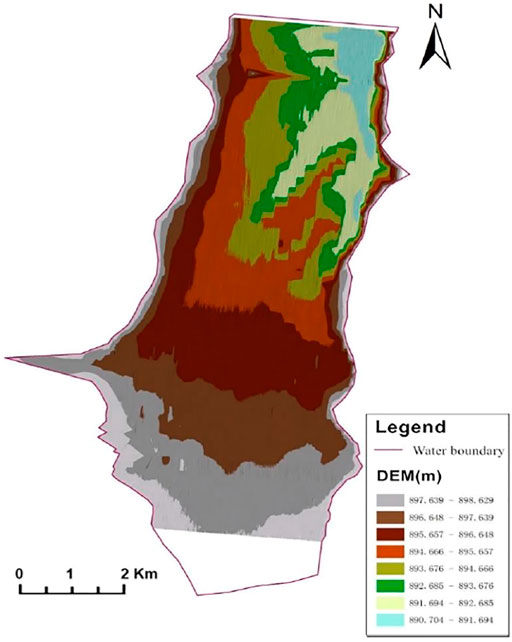
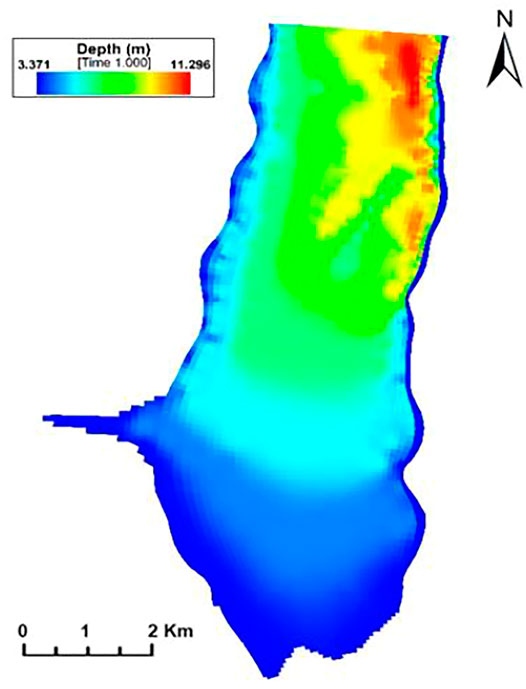
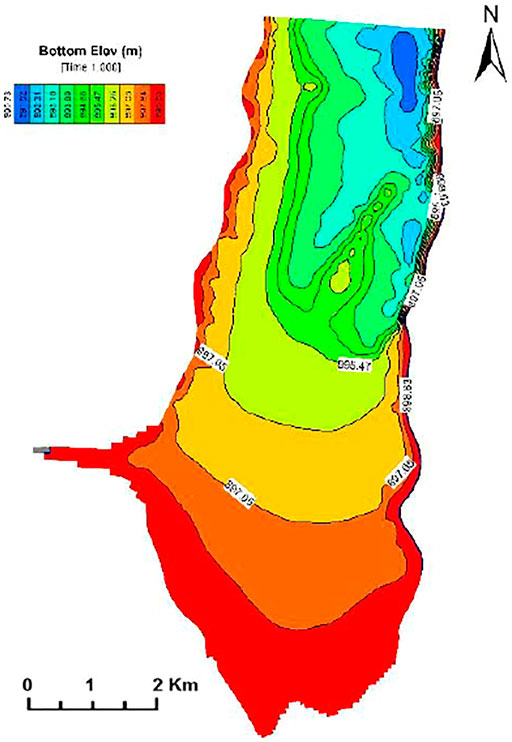
Terrain: as the model basis, the terrain grid is the most important part and the primary factor of the model. Reservoir topographic map, water depth map and reservoir bottom elevation contour map are shown in Figure 4, Figure 5 and Figure 6, respectively.
Boundary conditions: The model, starting in a static state, is warmed up for 1 month to minimize the initial condition error. Model boundary conditions include hydrodynamic and meteorological boundaries. A total of five inflow points and one outlet are set on the boundary of the simulation reservoir area. The dynamic boundary conditions mainly include the atmosphere condition, surface wind force and inbound and outbound flow.
2.3.3 Analysis and Calibration of Hydrodynamic Model Calculation Results
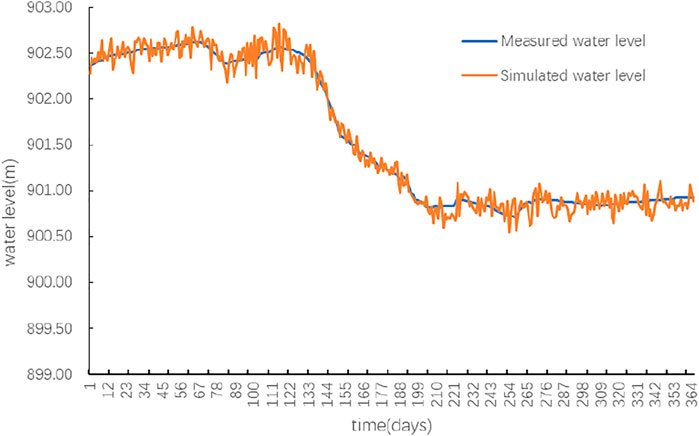
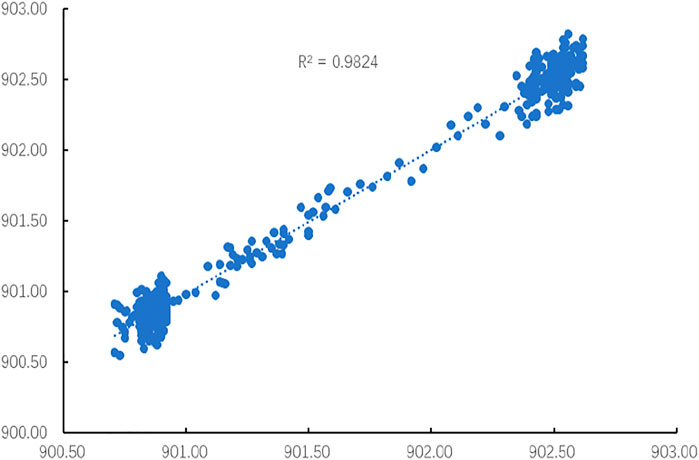
The EFDC hydrodynamic model simulates the Zhangze Reservoir area by using the observed data in 2017 and produces the simulated result of the water level in the reservoir area, which is then compared and calibrated with the measured water level in the reservoir area. The comparison between the measured water level and the simulated water level is shown in Figure 7. The correlation R2 between the simulated value and the actual value measured from Zhangze Reservoir reaches 0.98, the root mean square deviation is 0.105, and the absolute deviation is within the range of 0.1 m, as shown in Figure 8. On the whole, the simulation had been successful, and the simulation deviation is controlled within the tolerance of model calculation requirement, which provides reliable preconditions for water quality simulation.
2.4 Water Quality Modeling
Urban lakes are typically characterized by fragile ecological capacities and complex management of their hydrospheric ecosystems (Gong et al., 2016b; Bunn, 2016). After entering the water, pollutants migrate and transform under the action of various forces. The EFDC model is used to simulate the influence of various forces on the pollutants for obtaining the changing patterns of water quality, and it will be then transformed into a mathematical model for water quality prediction and analysis. Zhangze Reservoir is an important gathering spot of multi-source pollution, showing the characteristics of stagnant water body replenished by unconventional water sources. To study the water quality and water ecology of Zhangze Reservoir, the coupled hydrodynamic model is used to simulate the water quality of Zhangze Reservoir with the water quality module loaded on the basis of hydrodynamic model. According to the data represented in the bulletin on Changzhi City’s water resources, the annual average rainfall was 686.7 mm in 2016 and 617.9 mm in 2017, which were 19.8% and 7.8% higher than the multi-year average respectively, indicating that both were wet years. In this study, January to December 2016 is selected as the calibration period, and January to December of 2017, as a hydrological year with similar climatic type, is selected as the verification period, calibrated values for the key water quality parameters are shown in Table 4.
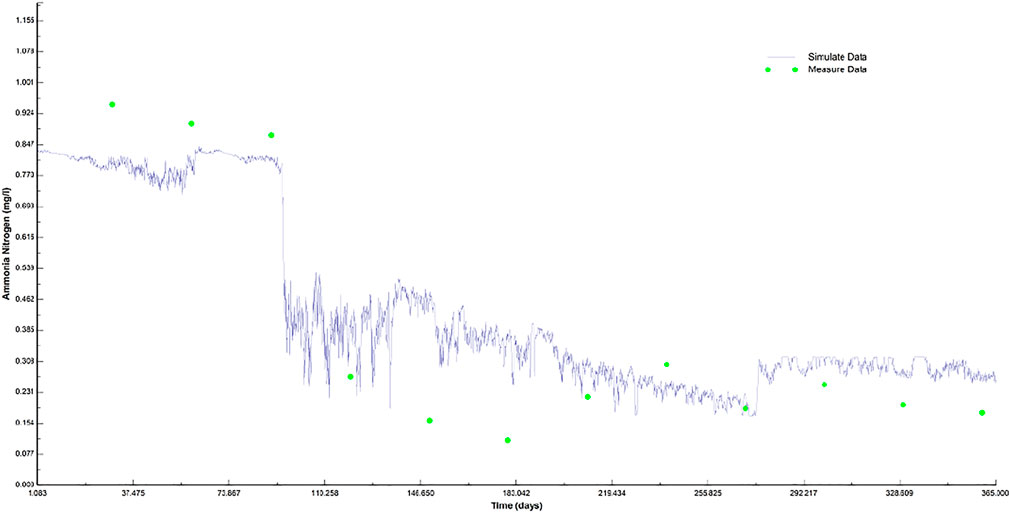
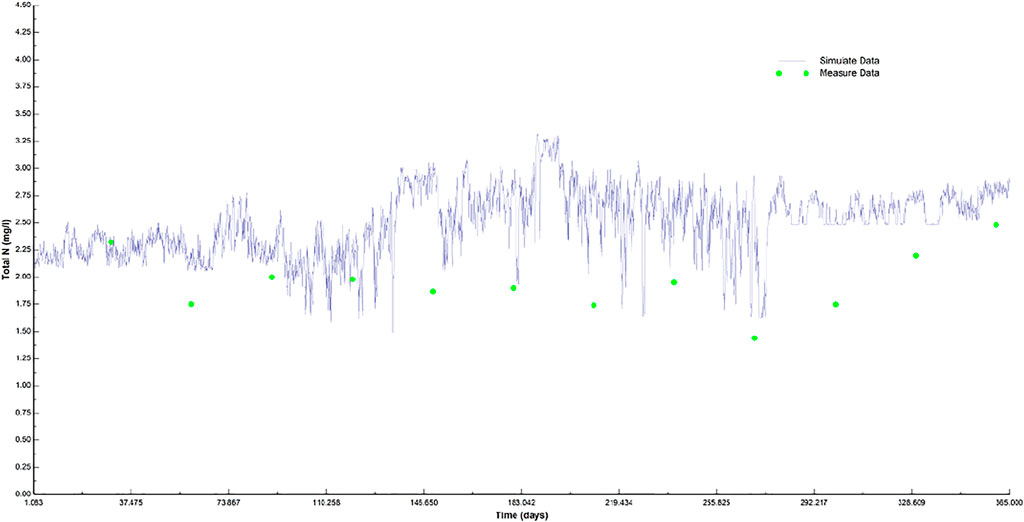
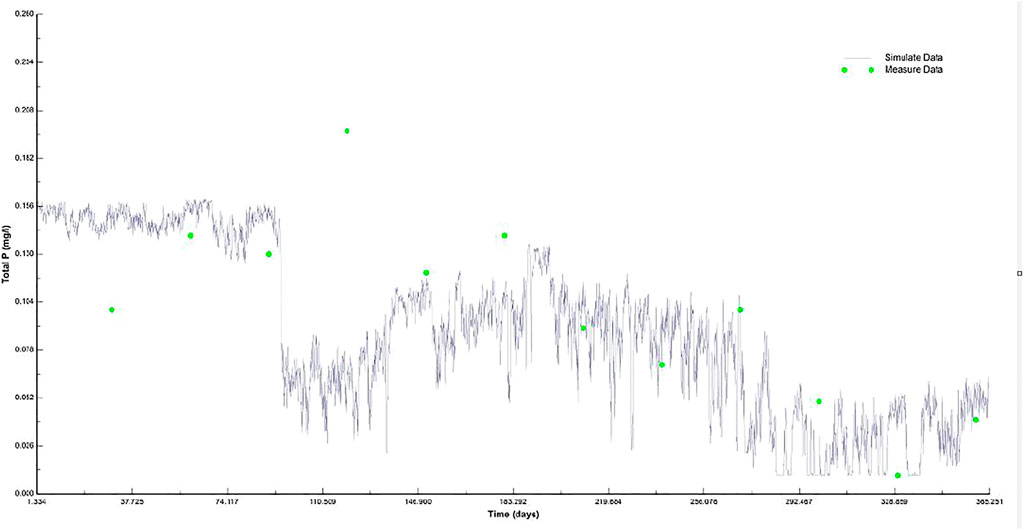
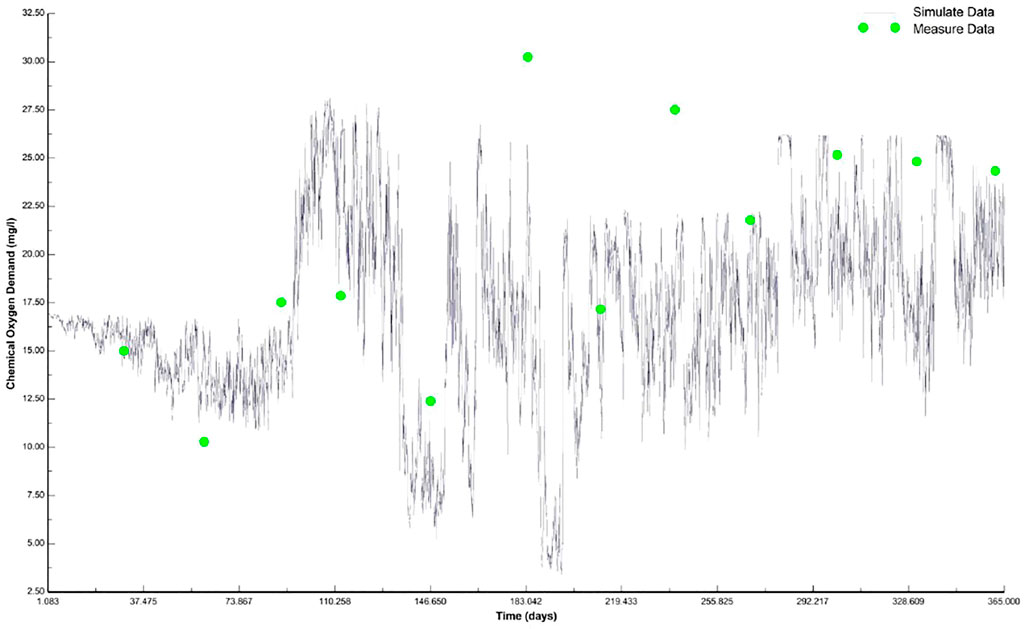
According to the measured water quality data from January 2017 to December 2017, NH3-N, TN, TP and COD have been used as verification indicators for comparative analysis with the actual water quality monitoring data. The mean relative error between measured and simulated NH3-N concentrations is 15.20%, and the minimum and maximum relative errors are 4.65% and 31.58%, respectively. The mean relative error between measured and simulated TN concentrations is 14.45%, and the minimum and maximum relative errors are 3.41% and 34.88%, respectively. The mean relative error between measured and simulated TP concentrations is 14.28%, and the minimum and maximum relative errors are 2.94% and 36.84%, respectively. The mean relative error between measured and simulated COD concentrations is 7.34%, and the minimum and maximum relative errors are 1.53% and 21.07%, respectively. According to the verification results of the above simulated values of NH3-N, TN and TP, the maximum relative error appears in May and October, followed by April and November, which may be due to the instability of water volume caused by the arrival of flood season in May and the maximum value of algae growth in reservoirs reached in October and November. Considering that the relative error of most simulated values is within 25% though the monitoring frequency is low, the predicted values of NH3-N, TN, TP and COD concentrations in Zhangze Reservoir are relatively consistent with the measured values in terms of the curve trend, and the general trend of annual changes is close, the simulated situation is acceptable. See Table 1 for the statistical data of observed and simulated values of Zhangze Reservoir. See Figure 9 to Figure 12 for the comparison between observed and simulated water quality values of Zhangze Reservoir during the verification period.
3 Conclusion and Discussion
3.1 The Effect of Wastewater Treatment Plant Effluent on Water Quality of Zhangze Reservoir When the Water Quality of the Inflowing River Reaches the Standard
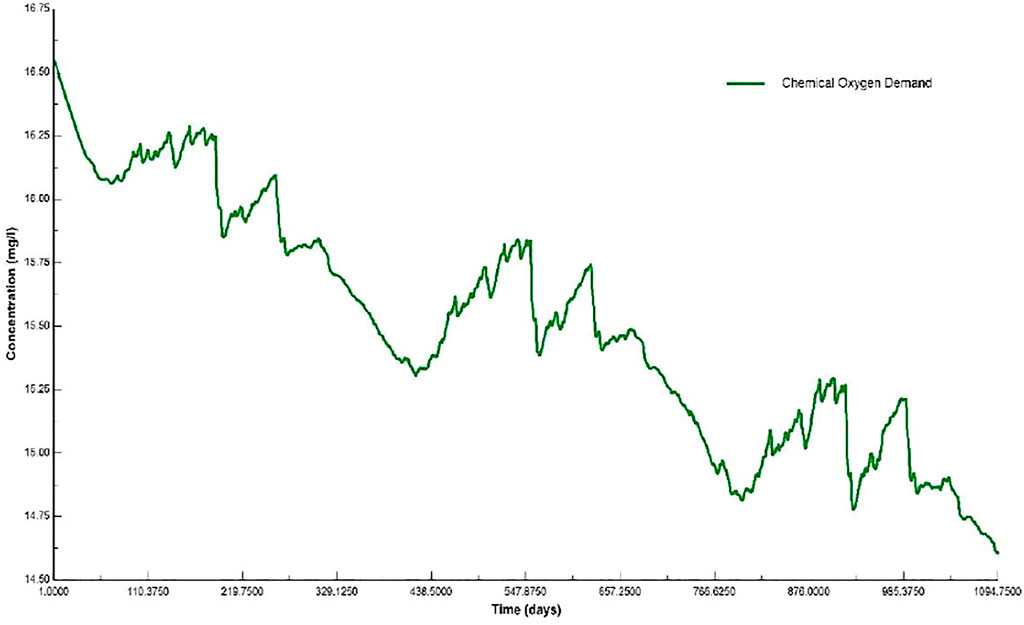
In recent years, the concentrations of COD, TP, and TN at the monitoring points outside the Zhangze Reservoir have exceeded the standard from time to time. See Table 5 for the water quality data of the main entry monitoring points of Zhangze Reservoir in 2017. By following the future water environment control plan of Changzhi City, the water quality of each incoming river is expected to reach the standard. Assuming that the water quality of other incoming rivers meets the standard, the effluent from wastewater treatment plant in the main urban area does not enter the reservoir, the change scenarios of the concentrations of COD, TP, TN and ammonia nitrogen in the reservoir are simulated, as shown in Figures 13–16. According to the simulation, the average concentrations of COD, TP, TN and ammonia nitrogen are 15.50, 0.08, 1.93, and 0.18 mg/L, respectively. Within 3 years, the concentrations of COD and ammonia nitrogen in the reservoir will reach the Class III standard, the TP concentration will be reduced close to the Class III standard, and the TN concentration will be difficult to meet the Class III standard.
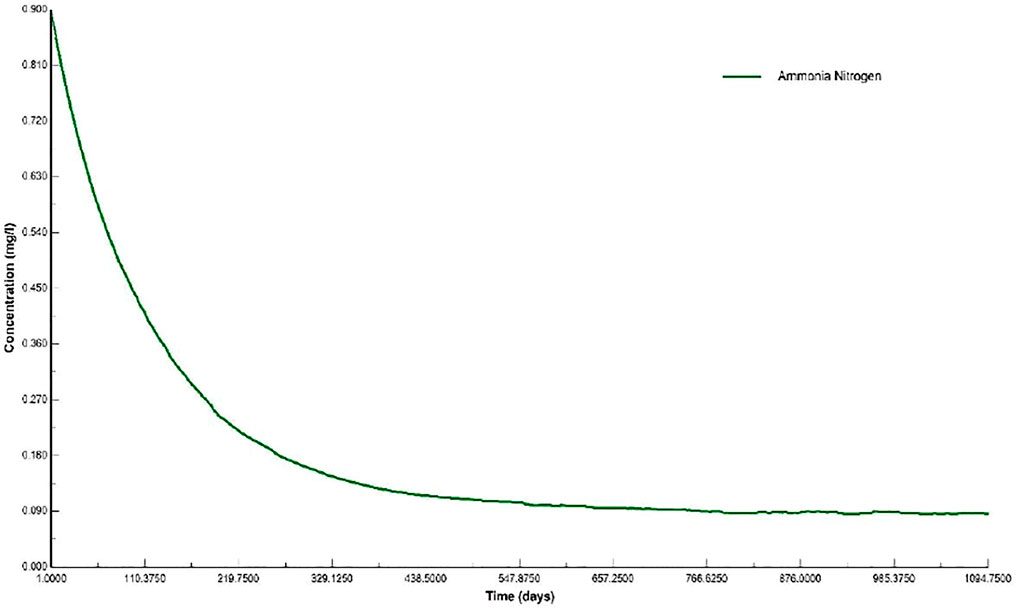
FIGURE 14. Simulation diagram of ammonia nitrogen concentration under the scenario of reaching the standard.
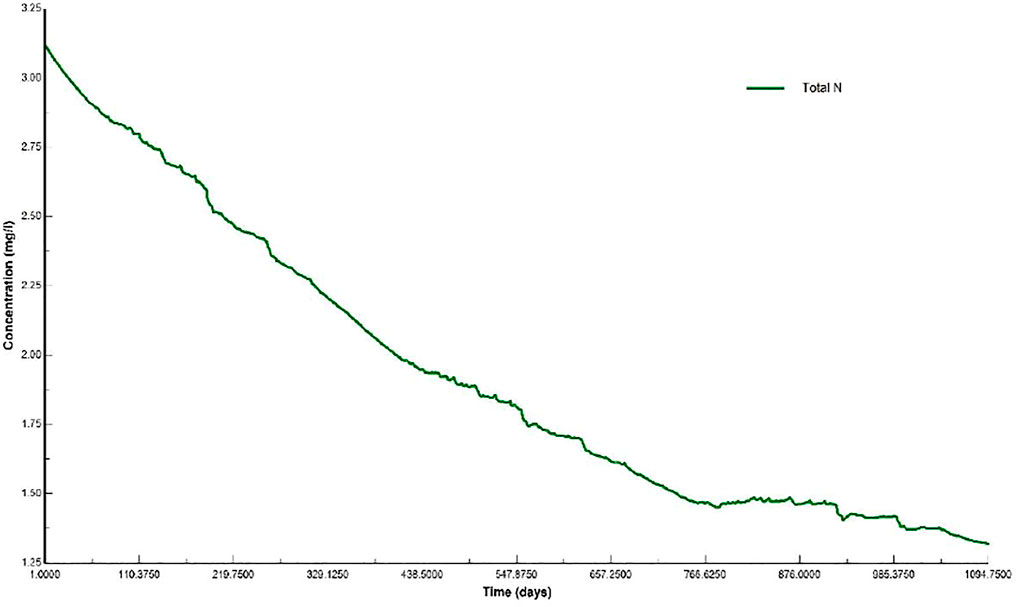
FIGURE 15. Simulation diagram of total nitrogen concentration under the scenario of reaching the standard.
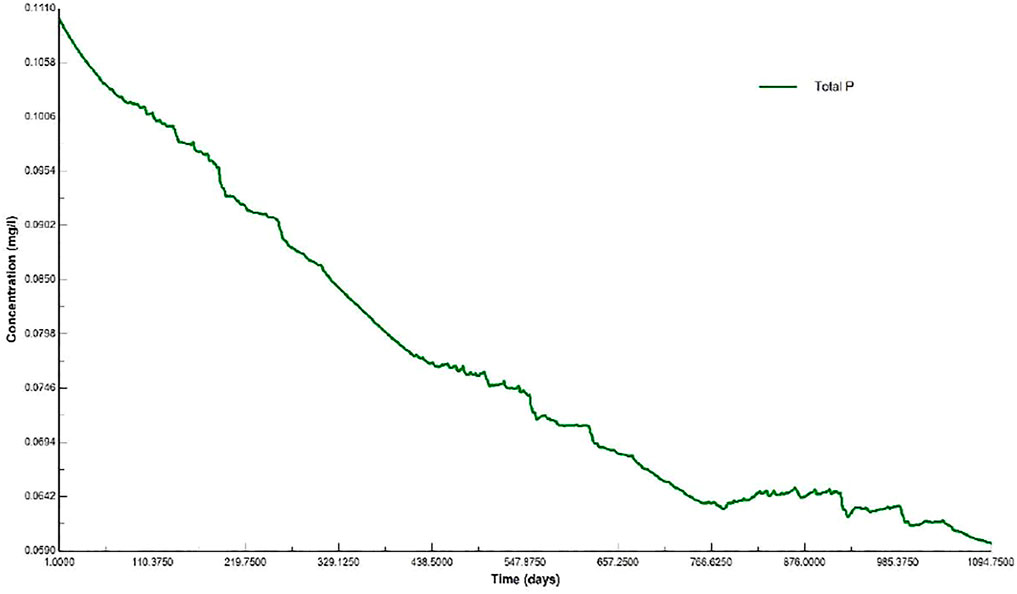
FIGURE 16. Simulation diagram of total phosphorus concentration under the scenario of reaching the standard.
In addition to the effluent from wastewater treatment plants and inflowing rivers, rural domestic pollution sources, agricultural non-point sources, urban runoff, pollutant from residents’ living and internal sources within the watershed will also affect the water quality of the reservoir. Studies have shown that the non-point source pollution load can even reach 60%–80% of the total pollution load, which has become the main pollution source of some important water bodies (Zheng et al., 2009; Lu et al., 2021; Hou et al., 2022; Tong et al., 2022). Table 6 shows the inflow and contribution ratios of pollutants such as rural domestic pollution sources, agricultural non-point sources, urban runoff, and pollutant from residents’ living and internal sources in the Zhangze Reservoir. In addition, when the external pollutants are cut off, the nitrogen, phosphorus and other pollutants that have been retained in the water still need a long time to degrade and transform. Therefore, in order to ensure a satisfactory water quality of the Zhangze Reservoir, while ensuring that the water quality of the inflowing river and the effluent of the wastewater treatment plant meet the standard, the prevention and control of non-point source pollution and the self-purification cycle of the water body within the basin should be strengthened at the same time.
3.2 The Impact of Wastewater Treatment Plant Effluent on the Water Quality of Zhangze Reservoir Under the Condition of Constant Water Quality in Other Incoming River
The proposed constructed wetland of North Village, at the upper reaches of south source of Zhuozhang River, Changzhi City, is located in the upper reaches of Zhangze Reservoir (See Figure 1). Covering an area of 290,000 m2, it adopts the horizontal subsurface flow wetland process, and the designed water treatment capacity of 120,000 m3/d forms a 290,000 m2 horizontal subsurface flow wetland. The constructed wetland is built to improve the water quality in the upper reaches of North Village, south source of Zhuozhang River and the effluent quality of wastewater treatment plants in the main urban area, thus improving the regional ecological environment. See Table 7 for the main designed effluent quality indicators of wastewater treatment plants and constructed wetlands in the main urban area.
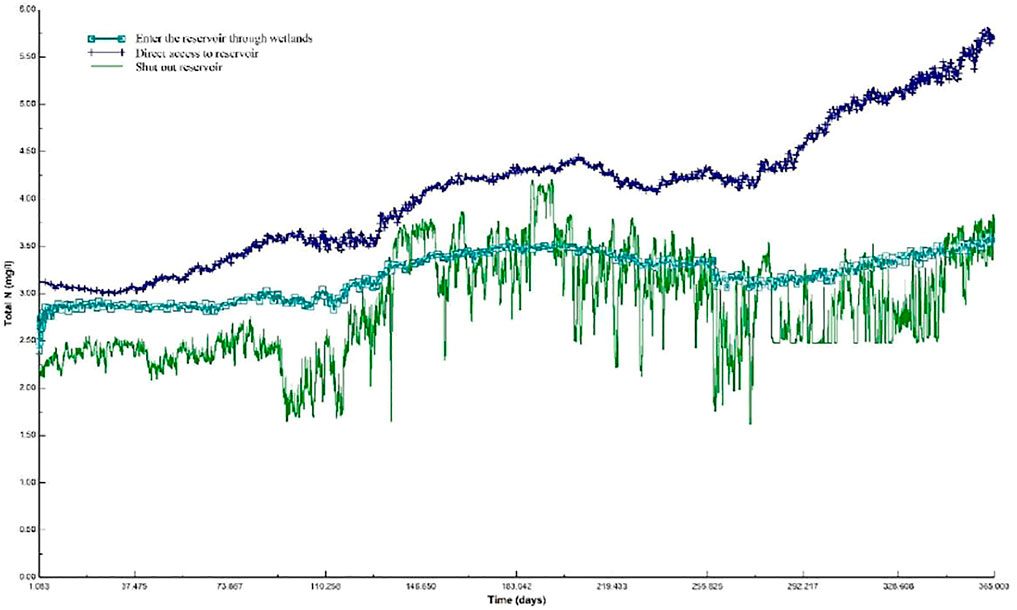
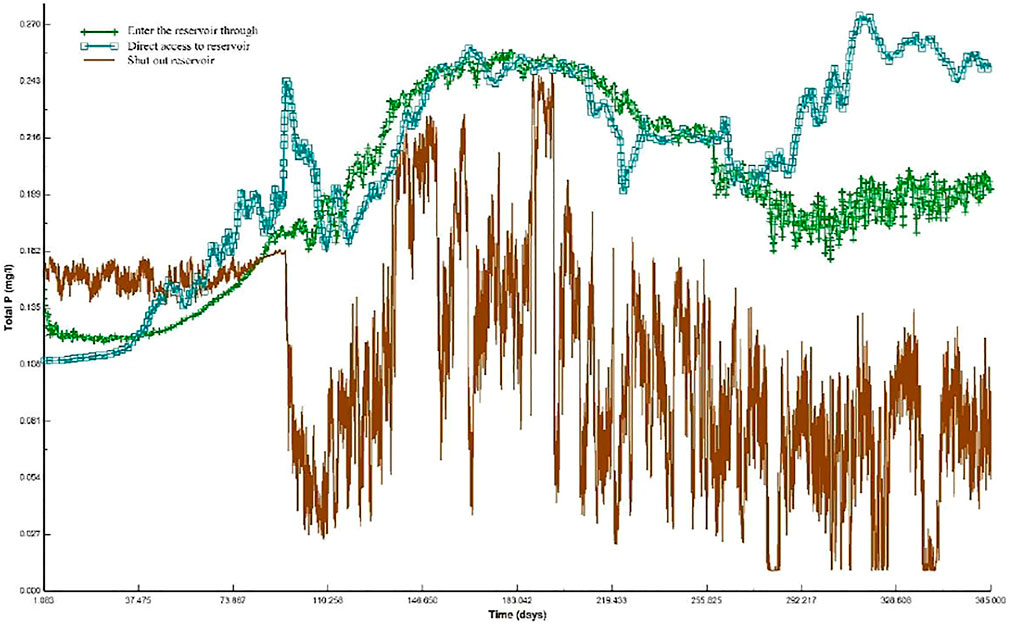
The effluent from wastewater treatment plants in the main urban area is an important source of Zhangze Reservoir. Under the condition that the water quality of other incoming rivers remains unchanged (some of the water quality indicators might exceed the standard limit), three simulation scenarios are set: the first is the change of water quality in reservoir caused by the effluent from wastewater treatment plants entering the reservoir without passing through the constructed wetland system; the second is the change of water quality in reservoir caused by the effluent from wastewater treatment plants entering the reservoir after passing through the constructed wetland system and being purified; the third is the change of water quality in reservoir caused by not receiving the effluent from wastewater treatment plants, which is discharged into the downstream river and does not enter the reservoir. See Figures 17, 18 for TN and TP simulation scenarios. The simulation results show that after the effluent from wastewater treatment plants directly enters the reservoir, the concentration of water quality indicators in the reservoir is the highest, and the average concentrations of TN and TP are 4.12 and 0.21 mg/L respectively. When the effluent from wastewater treatment plants enters the reservoir after passing through the constructed wetland, the average concentrations of TN and TP are 3.02 and 0.19 mg/L respectively. When the effluent from wastewater treatment plants does not enter the reservoir, the average concentrations of TN and TP are 2.72 and 0.09 mg/L respectively. Under all three scenarios, the average concentrations of TN and TP exceeded the Class III water quality standard limit, in which the average concentration of TN exceeded the Class V water quality standard limit, and the average concentration of TP was generally between the limits of Class IV and V water quality standards. Therefore, the effluent of the wastewater treatment plant in the main urban area discharging into the Zhangze Reservoir will directly cause the deterioration of its water quality, which struggles to meet the standard, under all three scenarios. Studies have shown that the setting of effluent quality indicators during the construction of artificial wetlands directly determines the effect of water purification (A et al., 2021; Chen et al., 2020). In order to thoroughly purify the effluent of wastewater treatment plants and improve the water quality after wetland purification, the design effluent standards of constructed wetlands should be improved, and the combination of constructed wetlands should be considered to improve water purification effect.
4 Conclusion
Based on the modeling platform of EFDC model, this paper constructs the hydrological and water quality model of Zhangze Reservoir, and studies the simulation of water quality changes of Zhangze Reservoir under different entering scenarios of effluent from wastewater treatment plants. Through model simulation, the following conclusions are drawn:
1) The simulated value of the hydrological station is basically consistent with the measured value, with the absolute deviation less than 0.1 m. It basically reflects the hydrological condition of Zhangze Reservoir. For its good adaptability to the diffusion of pollutants in Zhangze Reservoir, the simulated value is able to truly reflect the diffusion of pollutants and water quality simulation analysis. The water quality changes of Zhangze Reservoir in various scenarios were simulated around the transportation of effluent from wastewater treatment plants and the control of incoming water bodies, so as to provid technical reference for management decision-making and engineering construction.
2) The transportation of effluent from wastewater treatment plants in the main urban area has a great impact on the water quality of Zhangze Reservoir. The water quality of reservoir can be obviously improved by using constructed wetland to purify effluent from wastewater treatment plants, but the concentrations of TN and TP are still unable to meet the Class III water quality standard. For the effluent of the wastewater treatment plant in the main urban area, the highest Chinese standard, i.e., Class I A standard, of pollutant discharge in urban wastewater treatment plants has been implemented, so it will be costly to continue to upgrade and transform the standard for it. In view of the fact that its effluent concentration is much higher than the water quality requirements of the Zhangze Reservoir, the effluent, as a precious water resource, should be given priority as ecological water supply for urban rivers, so as to reduce overexploitation of local water resources and avoid discharging into water with relatively high water quality which may cause secondary pollution to important water bodies.
3) On the premise that all incoming rivers reach the standard and the effluent from wastewater treatment plants in the main urban area does not enter the reservoir, the concentrations of COD, ammonia nitrogen and TP in Zhangze Reservoir will gradually reach the Class III water quality standard, while the TN concentration will hardly reach the Class III water quality standard in recent 3 years. Therefore, the key tasks for the improvement of water environment of Zhangze Reservoir in the future lies in the following aspects: comprehensively strengthening the pollution control of rural domestic sources, urban runoff, agricultural non-point sources and internal sources of the reservoir within the Zhangze Reservoir basin, improving the water quality of the inflowing rivers, reducing the pollution load of nitrogen and phosphorus, and consolidating the self-purification capacity of the reservoir water body.
Data Availability Statement
The original contributions presented in the study are included in the article/Supplementary Material, further inquiries can be directed to the corresponding author.
Author Contributions
Conceptualization, JQ; methodology, JW; software, JQ; validation, JQ and JW; formal analysis, MZ; investigation, LY; resources, MZ; data curation, JQ; writing—original draft preparation, LY; writing—review and editing, JW; supervision, LY; project administration, LY; funding acquisition, LY. All authors have read and agreed to the published version of the manuscript.
Funding
This research was funded by Ningxia Key R&D Program (2021BEG02011), the Fundamental Research Funds for the Central Universities (Grant No. ZY20215135) and the Scientific Research Projects of China Urban Construction Design and Research Institute Co. Ltd. (Y16S22016).
Conflict of Interest
Authors LY and MZ are employed by China Urban Construction Design and Research Institute Co., Ltd.; Author JQ is employed by Shanghai Municipal Engineering Design Institute (Group) Co., Ltd.
The remaining author declares that the research was conducted in the absence of any commercial or financial relationships that could be construed as a potential conflict of interest.
Publisher’s Note
All claims expressed in this article are solely those of the authors and do not necessarily represent those of their affiliated organizations, or those of the publisher, the editors and the reviewers. Any product that may be evaluated in this article, or claim that may be made by its manufacturer, is not guaranteed or endorsed by the publisher.
References
A, D., Chen, C.-x., Zou, M.-y., Deng, Y.-y., Zhang, X.-m., Du, J.-j., et al. (2021). Removal Efficiency, Kinetic, and Behavior of Antibiotics from Sewage Treatment Plant Effluent in a Hybrid Constructed Wetland and a Layered Biological Filter. J. Environ. Manage. 288, 112435. doi:10.1016/j.jenvman.2021.112435
Bunn, S. E. (2016). Grand challenge for the Future of Freshwater Ecosystems [J]. Front. Environ. Sci. 4. doi:10.3389/fenvs.2016.00021
Chen, M., Zeng, W., Wang, G., Lu, F., Zhang, J., and Ding, J. (2020). Study on the Operation Effect of Constructed Wetland Project for Tailwater Treatment-An Example from a Sewage Plant in Zhejiang Province. E3s Web Conf. 194 (3), 04030. doi:10.1051/e3sconf/202019404030
Chen, Y., Xia, R., Wang, L., Sun, M., Zhang, L., and Ma, S. (2021). Evaluation of Water Environment Treatment Engineering Effect in Xinfeng River Basin Based on SWMM-EFDC Coupling Simulation [J]. J. Environ. Eng. Tech. 11 (4), 777–788. doi:10.12153/j.issn.1674-991X.20200283
Cheng, L., Li, H., and Heping, W. (2003). Numerical Simulation of the Hydrodynamics and Sewage Diffusion in the Changjiang River Estuary [J]. Oceanologia et Limnologia Sinica 34 (5), 15–24. doi:10.3321/j.issn:0029-814X.2003.05.002
Claudia, V. L., Cuevas Clemente, R., Bejarano Franklin, T., Cisneros-Pérez, R., Cisneros-Almazán, R., and Couder-Castañeda, C. (2021). Applying EFDC Explorer Model in the Gallinas River, Mexico to Estimate its Assimilation Capacity for Water Quality protection [J]. Scientific Rep. 11 (1), 13023. doi:10.1038/S41598-021-92453-Z
Fan, Q., and Ding, Z. (2016). Effluent Standards and Sewage Outfalls Selection of the Wastewater Treatment Plants in Harbour Based on EFDC [J]. Environ. Eng. 34 (12), 147–152. doi:10.13205/j.hjgc.201612031
Gong, R., He, Y., Xu, L., Wang, D., and Xu, J. (2016). The Application Progress of Environmental Fluid Dynamics Code (EFDC) in Lake and Reservoir Environment [J]. Trans. Oceanology Limnology (06), 12–19. doi:10.13984/j.cnki.cn37-1141.2016.06.002
Gong, R., Xu, L., Wang, D., Li, H., and Xu, J. (2016). Water Quality Modeling for a Typical Urban Lake Based on the EFDC Model. Environ. Model. Assess. 21 (5), 643–655. doi:10.1007/s10666-016-9519-1
Hamrick, J. M., and Mills, W. B. (2000). Analysis of Water Temperatures in Conowingo Pond as Influenced by the Peach Bottom Atomic Power Plant thermal Discharge. Environ. Sci. Pol. 3, 197–209. doi:10.1016/s1462-9011(00)00053-8
Hou, L., Zhou, Z., Wang, R., Li, J., Dong, F., and Liu, J. (2022). Research on the Non-Point Source Pollution Characteristics of Important Drinking Water Sources. Water 14 (2), 211. doi:10.3390/w14020211
Huang, J., Qi, L., Gao, J., and Kim, D.-K. (2017). Risk Assessment of Hazardous Materials Loading into Four Large Lakes in China: A New Hydrodynamic Indicator Based on EFDC. Ecol. Indicators 80 (sep), 23–30. doi:10.1016/j.ecolind.2017.04.051
Hwang, S., Jun, S.-M., Song, J.-H., Kim, K., Kim, H., and Kang, M.-S. (2021). Application of the SWAT-EFDC Linkage Model for Assessing Water Quality Management in an Estuarine Reservoir Separated by Levees. Appl. Sci. 11 (9), 3911. doi:10.3390/app11093911
Jia, H., Xu, T., Liang, S., Zhao, P., and Xu, C. (2018). Bayesian Framework of Parameter Sensitivity, Uncertainty, and Identifiability Analysis in Complex Water Quality Models. Environ. Model. Softw. 104, 13–26. doi:10.1016/j.envsoft.2018.03.001
Jiang, J., Pang, T., Zhang, F., Men, Y., Yadav, H., Zheng, Y., et al. (2022). Pathway to Encapsulate the Surface Water Quality Model and its Applications as Cloud Computing Services and Integration with EDSS for Managing Urban Water Environments. Environ. Model. Softw. 148 (prepublish), 105280. doi:10.1016/j.envsoft.2021.105280
Li, J. (2014). Study of Water Self-Purification Capacity and Law of the Zhangze Reservoir [J]. Shanxi Hydrotechnics (03), 76–77. doi:10.3969/j.issn.1006-8139.2014.03.029
Liang, Z., Zou, R., Chen, X., Ren, T., Su, H., and Liu, Y. (2020). Simulate the Forecast Capacity of a Complicated Water Quality Model Using the Long Short-Term Memory Approach. J. Hydrol. 581 (C), 124432. doi:10.1016/j.jhydrol.2019.124432
Lu, Shibao., Zhong, Weijun., Li, Wei., and Taghizadeh-Hesary, F. (2021). Regional Non-point Source Pollution Control Method: A Design of Ecological Compensation Standards [J]. Front. Environ. Sci. 9. doi:10.3389/fenvs.2021.724483
Luo, X., and Li, X. (2018). Using the EFDC Model to Evaluate the Risks of Eutrophication in an Urban Constructed Pond from Different Water Supply Strategies. Ecol. Model. 372, 1–11. doi:10.1016/j.ecolmodel.2018.01.020
Pyo, J., Kwon, Y. S., Min, J. H., Nam, G., Song, Y. S., Ahn, J. M., et al. (2021). Effect of Hyperspectral Image-Based Initial Conditions on Improving Short-Term Algal Simulation of Hydrodynamic and Water Quality Models. J. Environ. Manage. 294, 112988. doi:10.1016/j.jenvman.2021.112988
Qian, X., Xiao, Y., and Yan, C. (2013). Prediction of Influence of Large-Scale Sewage Outlet in Nantong Reach of Yangtze River [J]. Water Resour. Prot. (2), 52–56. doi:10.3969/j.issn.10046933.2013.02.010
Tian, T., Zhao, K., and Bu, M. (2014). The Quantitative Evaluation of Effect on Water Quality of Urban Sewage Treatment Plant Discharge. J. Environ. 32 (6), 135–139. doi:10.13205/j.hjgc.201406032
Tong, X., Zhou, Y., Liu, J., Qiu, P., and Shao, Y. (2022). Non-point Source Pollution Loads Estimation in Three Gorges Reservoir Area Based on Improved Observation experiment and export Coefficient Model. Water Sci. Tech. 85 (1), 27–38. doi:10.2166/wst.2021.508
Vijay, R., Khobragade, P. J., and Sohony, R. A. (2010). Water Quality Simulation of Sewage Impacts on the West Coast of Mumbai, India. Water Sci. Technol. 62 (2), 279–287. doi:10.2166/wst.2010.237
Wang, S., Peng, H., and Liang, S. (2022). Prediction of Estuarine Water Quality Using Interpretable Machine Learning Approach[J]. J. Hydrol., 605. doi:10.1016/J.JHYDROL.2021.127320
Wang, X. (2019). Analysis of Water Quality Changes in Zhangze Reservoir from 2013 to 2017 [J]. Shanxi Hydrotechnics (1), 59–61. doi:10.3969/j.issn.1006-8139.2019.01.018
Wang, Z., Liu, Y., Qin, C. H., and Zhang, W. (2014). Study on Characteristics of Hydrodynamic and Pollutant Transport of the Tributary Estuary in the Three Gorges Reservoir Area. Amm 675-677 (1352), 912–917. doi:10.4028/www.scientific.net/amm.675-677.912
Wool, T. A., Davie, S. R., and Rodriguez, H. N. (2003). Development of Three-Dimensional Hydrodynamic and Water Quality Models to Support Total Maximum Daily Load Decision Process for the Neuse River Estuary, North Carolina. J. Water Resour. Plann. Manage. 129 (4), 295–306. doi:10.1061/(asce)0733-9496(2003)129:4(295)
Zhang, J., Wu, Y., Tian, Z., Chu, Z., Yuan, J., and Hou, Z. (2020). Temperature Simulation of Erhai Lake Based on EFDC Model [J]. J. Environ. Eng. Tech. 10 (3), 368–376. doi:10.12153/j.issn.1674-991X.20190197
Zhang, S., Pan, Y., Li, Y., Lu, X., Xu, Y., Wnag, C., et al. (2017). Optimization Calculation of Tail Water Reused in Urban Landscape Water Based on EFDC Model[J]. Water Resour. Prot. 33 (6), 74–78. 91. doi:10.3880/j.issn.10046933.2017.06.11
Zheng, B., Wang, L., and Gong, B. (2009). Load of Non-point Source Pollutants from Upstream Rivers into Three Gorges Reservoir [J]. Environ. Sci. Res. 22 (02), 125–131. doi:10.13198/j.res.2009.02.3.zhengbh.007
Keywords: EFDC model, water quality, simulation, sewage treatment plant, zhangze reservoir
Citation: Yang L, Wei J, Qi J and Zhang M (2022) Effect of Sewage Treatment Plant Effluent on Water Quality of Zhangze Reservoir Based on EFDC Model. Front. Environ. Sci. 10:874502. doi: 10.3389/fenvs.2022.874502
Received: 12 February 2022; Accepted: 28 March 2022;
Published: 21 April 2022.
Edited by:
Rajendra Prasad Singh, Southeast University, ChinaReviewed by:
Elena Neverova-Dziopak, AGH University of Science and Technology, PolandZbigniew Kowalewski, AGH University of Science and Technology, Poland
Copyright © 2022 Yang, Wei, Qi and Zhang. This is an open-access article distributed under the terms of the Creative Commons Attribution License (CC BY). The use, distribution or reproduction in other forums is permitted, provided the original author(s) and the copyright owner(s) are credited and that the original publication in this journal is cited, in accordance with accepted academic practice. No use, distribution or reproduction is permitted which does not comply with these terms.
*Correspondence: Jia Wei, d2VpamlhQGNpZHAuZWR1LmNu
 Long Yang
 Jia Wei2*