 Wanna Angthong1
 Akinori Mori2Haruthairat Kitwetcharoen3Ornvimol Kaeokliang1Sukanya Kamphayae1
 Tomoyuki Suzuki2
 Yimin Cai4
 Koki Maeda4*
- 1Ruminants Feeding Standard Research and Development Center, Khon Kaen, Thailand
- 2Institute of Livestock and Grassland Science, National Agriculture and Food Research Organization (NARO), Nasu-shiobara, Japan
- 3Department of Biotechnology, Faculty of Technology, Khon Kaen University, Khon Kaen, Thailand
- 4Crop, Livestock and Environment Division, JIRCAS, Tsukuba, Japan
We measured the greenhouse gas (GHG) emissions following beef cattle feeding and evaluated the manure management in northeast Thailand (Khon Kaen) to obtain the country-specific emission factor (EF) and replace the Intergovernmental Panel on Climate Change (IPCC) default value. We fed four Thai native cattle their typical diet of the region and then used the head-cage and dynamic chamber methods to measure the enteric methane (CH4) and GHG emissions during manure storage, respectively. The effect of amending the cattle manure with rice straw on the manure’s GHG emission was evaluated. The manure microbiome was monitored by 16S rRNA gene amplicon sequencing and qPCR assay of the functional genes that are required for the methanogenesis and nitrification/denitrification process. The estimated CH4 conversion factor (Ym: 6.87 ± 0.11% gloss energy intake (GEI)) was slightly higher than the IPCC default value. The CH4 emission from the manure accounted for 0.69 ± 0.26% GEI. The addition of rice straw slightly lowered the CH4 emission from the manure, but the manure microbiome analysis results showed that it significantly reduced the relative abundance of methanogens (Methanobacteriales), and the functional estimation of manure microbiome agreed with this inhibition effect. The addition of rice straw also showed potential mitigation of the N2O emission with lowered nitrification activity and lower nitrifier abundance, but the results were not consistent between runs. Together these findings will be useful for the higher-tier approach to GHG emissions from beef cattle production systems in tropical regions.
Introduction
The livestock sector—including its greenhouse gas (GHG) emissions—is a significant source of environmental pollution, it accounted for 5.6–7.5 Gt CO2 eq yr−1 of GHG emissions during the period 1995–2005 (Herrero et al., 2016). The major contributors are the emissions of enteric methane (CH4) (1.6–2.7 Gt CO2 eq yr−1) and nitrous oxide (N2O) (1.3–2.0 Gt CO2 eq yr−1) associated with feed production, but manure is also a significant source for both CH4 (0.2–0.4 Gt CO2 eq yr−1) and N2O (0.2–0.5 Gt CO2 eq yr−1). Since the global GHG emissions from livestock increased by 51% during the 50-year period 1961–2010, mostly because of the strong growth of emissions in developing countries (Caro et al., 2014), it is an urgent issue how to mitigate GHG emissions from the livestock sector for the sustainable growth of the livestock industry.
As the fourth-ranked livestock-producing country in Southeast Asia, Thailand has 4.8 million head of cattle (FAO, 2014), most of which are native cattle and native crossbred (57.69%); the rest are Brahman, Charolais, or their cross-breeds. The majority (96.45%) of Thailand’s beef cattle farmers are small-scale farmers with <20 cattle (DLD, 2018). For the management of the manure from the country’s livestock sector, there has been some developments on its utilization for biogas production (Chaiprasert, 2011). However, most of the livestock manure in Thailand is still treated in the traditional way; the majority of the small-scale cattle farmers spread the raw manure on their fields directly after piling it, or they sell the manure to other local farmers after drying it. This scenario is similar to that in Vietnam (Nguyen et al., 2022).
To estimate the GHG emission during beef cattle production, the Intergovernmental Panel on Climate Change (IPCC 2006) guideline for national greenhouse gas inventories provided default values for the countries that do not have a country-specific emission factor (so-called tier 1 approach). For higher tier approaches which reflects the country-specific factors such as cattle breeds, feed composition or environmental parameters, a comprehensive dataset obtained in the local condition is needed. However, there have been only a few studies focusing on GHG emissions from manure management in Thailand (Aggarangsi et al., 2013; Vichairattanatragul et al., 2015), and none provided an emission factor from beef cattle manure, which is the strong limitation of the current circumstance for precise estimation of GHG emission from this sector.
Here, we made a series of comprehensive GHG measurements covering the period from enteric fermentation to during manure storage for 84 days. The head-cage chamber method and the dynamic chamber method were used to measure the enteric CH4 emission and GHG emission from beef cattle manure, respectively. In addition, we monitored the manure microbiome by molecular microbiological approaches since microbes in the manure are responsible for both CH4 and N2O emission through methanogenesis (Conrad, 2020) and nitrification-denitrification process, respectively (Zumft, 1997; Meinhardt et al., 2015). We also estimated the effect of mixing rice straw into the beef cattle manure on the GHG emission and manure microbial community, since straw addition can make the physical structure of the manure porous and expected to inhibit the CH4 emission through deactivating the methanogens. As far as we know, this study provides the first dataset which enables the country specific GHG emission factor value estimation from the manure management in Thailand. Also, our dataset covers both enteric CH4 and GHG emissions from manure for estimations of the entire GHG emission from beef cattle production in Thailand.
Materials and Methods
Cattle, Feed, and the Measurement of CH4 Emission by a Ventilated Head-Hood System
We conducted two runs of gaseous emission measurement experiments at the Ruminants Feeding Standard Research and Development Center. Four Thai native cattle with the initial average body weights (BW) 313.8 ± 20.4 kg (Run 1) and 354.7 ± 21.6 kg (Run 2) were used for the experiment. The cattle were fed a restricted amount (2% of BW, dry matter [DM] basis) of a diet comprised of 70% Pangola grass and 30% commercial concentrate to meet their digestible energy requirements. The cattle were kept in individual tie stall pens equipped with a ventilated head-hood system, and they were fed at 09:30 and 17:00 each day. Water and a mineral block were freely accessed.
The emission of CH4 was measured by the head-hood system installed at the Ruminants Feeding Standard Research and Development Center for 6 days with three periods (Supplementary Figure S1, Suzuki et al., 2008). Briefly, a constant airflow from the hood into the measurement system was made by blowers, and the concentrations of CO2 and CH4 were measured continuously by a non-dispersive infrared sensor (VA-5000, Horiba, Japan; IR-200, Yokogawa Electric, Tokyo). The cattle were always placed in the ventilated head-hood system for the entire days during the experimental period. The feed intake including the amount of leftover feed was recorded, and the total feces and urine were collected, weighed and samples (manure, 1 kg head−1 d−1; urine, 350 g head−1 d−1) were stored in a freezer (−20°C) for further analysis.
During the experimental period, manure was collected every day and accumulated for 3 weeks in the chamber for the subsequent GHG emission measurement as described below.
The Measurement of the GHG Emission During Manure Storage
CH4 and N2O emissions from manure were measured using a dynamic chamber system as described (Osada and Fukumoto, 2001; Maeda et al., 2013) (Supplementary Figure S2). The chamber system was designed to estimate the total GHG emission from manure. It consisted of a polyvinyl chloride (PVC) chamber equipped with an air-blowing ventilator and a gas-sampling port on the ventilation exhaust. The chamber was 3 m width, 3 m depth, and 2 m height. Four 10-cm-dia. vent holes were installed in the upper part of the chamber and connected by PVC pipe to the ventilation blower, which was installed outside the chamber. The airflow was measured by a micromanometer and kept constant throughout the experimental period. Fresh air was introduced under the skirt of the chamber.
Air samples for the determination of the CH4 and N2O concentrations were collected in 15-ml vials by an automatic gas-sampling unit (Akiyama et al., 2009). The CH4 concentrations were determined with a gas chromatograph equipped with a flame ionization detector (GC-8A, molecular sieve 5A column; Shimadzu, Japan), and the N2O concentrations were determined with a gas chromatograph equipped with an electron capture detector (GC-14B, Porapak Q column, Shimadzu, Japan). The respective rates of emission were estimated as described (Fukumoto et al., 2003). The gas concentration of the ambient air was subtracted from that of the outlet air and then multiplied by the ventilation rate.
To test the reliability of chamber system, we conducted a recovery test by introducing a known amount of CH4 into the chamber three times: 17 g of standard pure CH4 gas (99.99%) was introduced into the chamber, and the CH4 concentration was determined every 5 min for 2 h and every 10 min thereafter. The concentration of CH4 was determined as described above. The recovery rates were 97–98% (Supplementary Table S1).
Manure was collected during the feeding experiment and accumulated in the chamber on a waterproof concrete floor, until the mass of manure reached ∼500 kg in total. Rice straw (25 kg) was mixed into one manure heap, while the other manure heap did not receive any bulking agent (control heap). Both manure heaps were mixed completely by hand at the beginning of the storage. At the start of the experiment, each 3-m2, 0.2-m-high heap had a volume of 0.18 m3. For the monitoring of the manure microbiome, the manure heaps were mixed every 2 weeks to obtain homogenized samples. The temperatures of the manure and ambient air were measured hourly with an automated thermocouple (TR-73U, T&D, Matsumoto, Japan). Fresh samples (1 kg) were taken at every mixing, at the start and the end of the experiments.
Chemical Analyses of the Feed, Feces (Including Stored Manure), and Urine Samples
The value of the total solids (TS) was measured after drying the samples at 105°C for 24 h. Volatile solids (VS) were measured after the samples were processed at 600°C for 2 h. The levels of crude protein (CP), ether extract (EE), and crude ash were determined by the standard method (Chemists and Horwitz, 1990). The gross energy was determined by an automatic adiabatic bomb calorimeter (C6000; IKA-Werke, Staufen, Germany). The neutral detergent fiber exclusive of residual ash without the inclusion of sodium sulfite (NDF) was determined as described (Van Soest et al., 1991). The apparent digestibility for nutrients was calculated according to the formula: (nutrient consumed − nutrient in feces)/nutrient consumed.
For the measurement of the inorganic-N in the manure, the pH, and the electrical conductivity, 5 g of fresh manure was placed in a 50-ml polypropylene tube with 40 ml of deionized water and then shaken (200 rpm, 15 min) and centrifuged (3000 g, 10 min). The supernatant was collected, and the inorganic-N (NH4+, NO2− and NO3−) concentrations in the supernatant were measured by the colorimetrical method (Bio-Rad, Hercules, CA, United States). The pH and electrical conductivity (EC) were determined with calibrated electrodes (Horiba, Fukuoka, Japan).
DNA Extraction and 16S rRNA Gene Amplicon Sequencing
DNA was extracted from 0.2 g of manure samples using Isofecal for Beads Beating (Nippon Gene, Tokyo), quantified by a NanoDrop Lite spectrophotometer (Thermo Fisher Scientific, Waltham, MA, United States), and stored at −20°C until further analysis. Partial fragments of the 16S rRNA gene (the V4 hypervariable region) were amplified by a two-step polymerase chain reaction (PCR). Primers 515F and 806R (Caporaso et al., 2011) with Illumina adapter overhang sequences were used for the first-round PCR with 20 cycles, and indexes were attached to the amplicon with eight additional cycles. Each 20-µl PCR mixture contained 0.2 µl TaKaRa ExTaq HS DNA polymerase (TaKaRa Bio, Shiga, Japan) with 2 µl of buffer (10×buffer), 1.6 µl of 2.5 mM dNTP mix, 1 µl of each forward and reverse primer (10 mM), and 1 µl of template DNA.
The first-round PCR conditions were as follows: 94°C for 2 min; 20 cycles of 94°C for 30 s, 50°C for 30 s, and 72°C for 30 s; and a final round of 72°C for 5 min. The PCR products were purified using an Agencourt AMPure XP purification system (Beckman Coulter, Indianapolis, IN, United States), and used for the second-round PCR with the following conditions: 94°C for 2 min; eight cycles of 94°C for 30 s, 60°C for 30 s, and 72°C for 30 s; and a final round of 72°C for 5 min. Tag-indexed PCR products were purified again, and their quality and quantity were checked by an Agilent 2100 Bioanalyzer (Agilent Technologies, Santa Clara, CA, United States) and a Qubit 2.0 Fluorometer and dsDNA HS Assay Kit (Life Technologies, Carlsbad, CA, United States), respectively. Qualified amplicons were pooled in equal amounts and sequenced with a 250-bp paired-end sequencing protocol (Illumina, San Diego, CA, United States).
Raw sequence reads were processed by Qiime2-2019.7 (Bolyen et al., 2019). Paired-end sequences were merged and quality-filtered by DADA2 (Callahan et al., 2016), and the denoised feature table and amplicon sequence variants (ASVs) were used for the taxonomic diversity analysis. Taxonomic classifications were assigned using a naïve Bayes classifier trained on the Greengenes 13_8_99% database, and mitochondria or chloroplast sequences were removed (Bokulich et al., 2018). The statistical analyses for the diversity metrics and the principal component analysis were performed through QIIME 2 (diversity “core-metrics-phylogenetic”).
PICRUSt was used for predicting the function of the manure microbiome (Langille et al., 2013). The closed-reference OTUs were normalized by copy number, and a new matrix of predicted functional categories was created with the KEGG database. We used STAMP to analyze the PICRUSt output file (Parks et al., 2014). The DNA sequences from this study were deposited in the DDBJ Sequence Read Archive (accession numbers: DRR347213 to DRR347239).
The qPCR Assay of Functional Genes Required for Methanogenesis, Nitrification and Denitrification
The qPCR assays were performed with iTaq Universal SYBR Green Supermix and CFX96 (Bio-Rad) with 20 µl of a reaction mix that contained 20 ng of template DNA. The primer pairs for amplifying bacterial 16S rRNA gene, bacterial and archaeal amoA gene, and bacterial denitrification genes (nirS, nirK and nosZ) were used. The PCR conditions for each reaction are summarized in Supplementary Table S3. An external standard curve was prepared using serial dilutions of a known copy number of the plasmid pGEM-T Easy vector (Promega, Madison, WI, United States) containing each gene. The insert gene for the 16S rRNA gene and nirS was Paracoccus denitrificans (NCIMB 16712), and that for the amoA gene was Nitrosomonas europaea (NBRC 14298). Plasmids containing the cloned nirK gene (AB441832) were used for the standard curve for these genes.
Statistical Analysis
The chemical analysis and gaseous concentration data were analyzed by an analysis of variance (ANOVA) using the general linear model procedure described by SAS (SAS Institute, 2001). Tukey’s multiple range comparison tests were used to separate the means. Probability (p)-values <0.05 were considered significant.
Results
The Emission of CH4 and Digestibility in the Feeding Experiment
The results of the CH4 emission measurement and feed digestibility are summarized in Table 1. In Runs 1 and 2, the cattle’s dry matter intake (DMI) values during the experiment were 5.42 kg/day ± 0.35 kg/day (n = 4) and 5.64 kg/day ± 0.35 kg/day (n = 4) and the emissions of CH4 were 155.0 L/day ± 15.7 L/day and 174.1 L/day ± 22.1 L/day, respectively. The digestibility of DM, organic matter (OM), CP, ethyl extract (EE), NDF and gross energy (GE) ranged from 46.45 ± 1.95% to 81.3 ± 6.62%; all values were in the normal range, indicating that the values and manure obtained in this study can be used as representative of the typical beef manure in the local production of beef cattle.
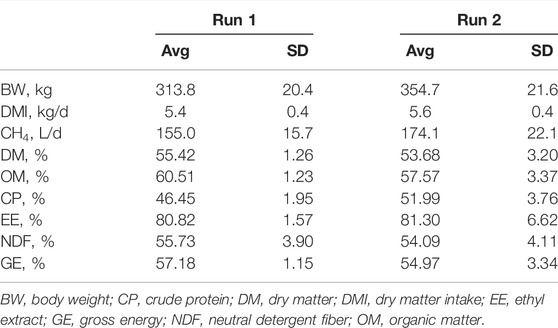
TABLE 1. Body weight, dry matter intake, CH4 emission and nutrient digestibility.
Temperature and GHG Emissions During Manure Storage
The temperature profiles of the manure with and without the addition of rice straw are summarized in Supplementary Figure S3. The maximum temperatures in the manure heap without rice straw were 43.8 and 47.4°C for Runs 1 and 2, respectively, whereas the max. temperatures reached 66.2 and 65.1°C in the heap with rice straw mixed into it. These temperature increases are due to the active degradation of organic matter in the manure. It can thus be said that the addition of rice straw, which is abundantly available from local farmers, can enhance the active organic matter degradation of the manure.
The gaseous emission (CH4 and N2O) profile during the manure storage is provided in Figure 1. We detected significant emissions (especially for CH4) during the manure accumulation period. The manure heap with rice straw had lower CH4 and N2O emission peaks in both runs. In Run 2, the manure mixed with rice straw did not have obvious N2O emission peak, and the manure-only heap had an emission peak between weeks 4 and 6.
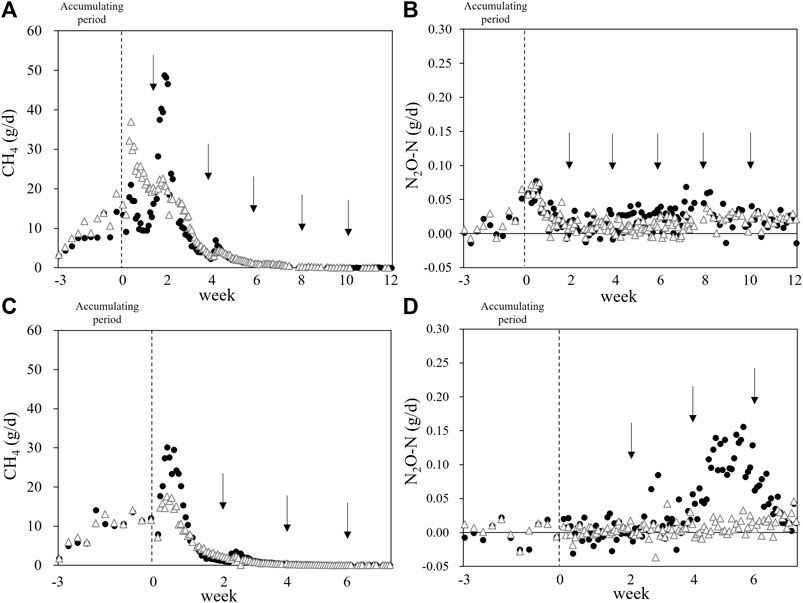
FIGURE 1. Methane and N2O emission during the beef cattle manure storage. Black circles: Control heap. White triangles: Rice straw-mixed heap. Arrows: The mixings for the sampling to monitor manure microbiome. (A,B): Run 1. (C,D): Run 2. Dashed lines: The end of the manure accumulation period.
The total gaseous emissions in these runs are summarized in Table 2. The CH4 emission in the control heap was 5.91 g/kgVS ± 2.39 g/kgVS, whereas the rice straw-mixed manure emitted 6.32 g/kgVS ± 3.69 g/kgVS, showing no significant difference between the treatments due to the large variation between two runs. These values can be converted to 4.58 kg-CH4 head−1 yr−1 ± 0.8 kg-CH4 head−1 yr−1 with no addition control, and 4.47 kg-CH4 head−1 yr−1 ± 2.23 kg-CH4 head−1 yr−1 for the rice straw-amended manure.
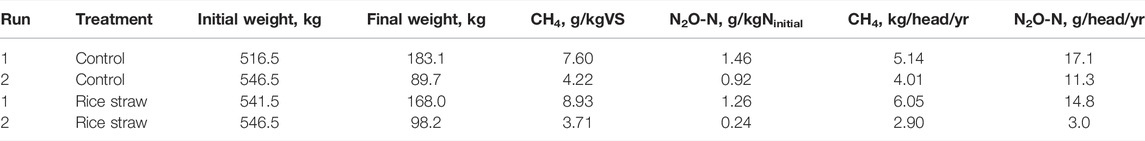
TABLE 2. Summary of the GHG emission during beef manure storage.
Regarding the emission of N2O, the control heap emitted 1.19 gN2O-N/kgNinitial ± 0.39 gN2O-N/kgNinitial and the rice straw-added manure emitted 0.75 gN2O-N/kgNinitial ± 0.72 gN2O-N/kgNinitial; the difference between the treatments was not significant. These values could be converted into 14.19 gN2O-N head−1 yr−1 ± 4.16 gN2O-N head−1 yr−1 and 8.89 gN2O-N head−1 yr−1 ± 8.39 gN2O-N head−1 yr−1 in the control and the rice straw-added heaps, respectively.
Based on the above-described findings, the fates of the energy contained in the feed are summarized in Table 3. The results show that 6.87 ± 0.11% of the total energy in the feed was emitted and lost as enteric CH4, and 43.1 ± 1.7% was emitted as manure. The manure was further degraded by the microbes and emitted as CH4, which accounted for 0.69 ± 0.26% of the total energy contained in the feed.
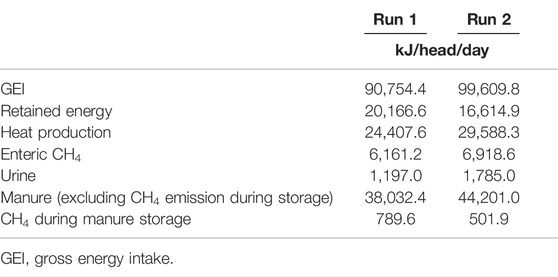
TABLE 3. Fate of the energy contained in the feedstuff.
Shift of the Manure Microbial Community and Its Function
We monitored the manure microbial community every 2 weeks (at every turning event) during the 12-week storage (Supplementary Figure S4). In both the control and rice straw treatments, the bacterial/archaeal community significant changed over time. In the comparison of the values obtained at the beginning (week 0) and those at the end of the storage (week 12), the relative abundance (n = 2) increased significantly in the phylums Actinobacteria (4.6 ± 2.1% to 8.3 ± 0.5% in the control heap and 4.8 ± 1.3% to 14.0 ± 3.8% in the rice straw-mixed heap), Chloroflexi (1.6 ± 1.7% to 12.7 ± 1.8% in the control heap and 1.8 ± 0.7% to 10.0 ± 4.1% in the rice straw-amended heap), and Planctomycetes (1.7 ± 0.5% to 3.5 ± 2.0% in the control heap and 1.4 ± 0.1% to 2.9 ± 1.5% in the rice straw heap). Over the same period, the relative abundance decreased significantly in the phylums Firmicutes (41.6 ± 3.2% to 25.3 ± 9.6% in the control heap and 35.4 ± 4.4% into 25.1 ± 5.2% in the rice straw heap) and Bacteroidetes (12.5 ± 8.1% to 9.7 ± 2.4% in the control heap and 13.7 ± 5.1% to 10.8 ± 1.5% in the rice straw heap) and the archaeal phylum Eurarchaeota (4.3 ± 0.3% to 0.6 ± 0.2% in the control heap and 3.0 ± 0.6% to 0.2 ± 0.1% in the rice straw heap).
Significant between-treatment differences were observed at the order level especially in Run 1 (Figure 2). The abundance of the order Methanobacteriales decreased significantly during the process in both treatments, but the decrease of their relative abundance was much faster in the rice straw-mixed heap than the control heap-, indicating that the rice straw amendment significantly enhanced the decay of the methanogens. Another significant difference between treatments was the abundance of Roseiflexales, which proliferated in the rice straw heap; it increased in particular from 1.2 to 12.1% between weeks 0 and 2. Mixing in the rice straw also affected other orders: the relative abundances of Actinomycetales, Cyatophagales, Bacillales were significantly higher, and those of the orders Clostoridiales, Bacteroidales, and TG3-1 were significantly lower in the rice straw heap compared to the control heap.
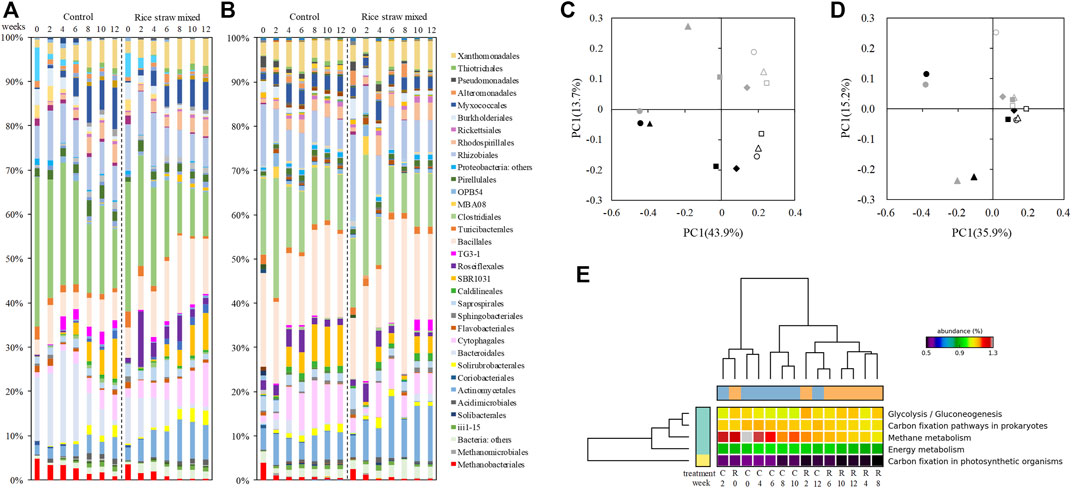
FIGURE 2. Changes in the bacterial/archaeal community at the order level (A,B) and the results of the principal component analysis (PCA) (C,D). (C) Run 1. (D) Run 2. Black symbols: Control manure heap. Gray symbols: Rice straw-amended heap. Filled circles: week 0. Filled triangles: week 2. Filled squares: week 4. Filled diamonds: week 6. Open circles: week 8. Open triangles: week 10. Open squares: week 12. (E) Estimated microbiome functions in Run 1.
These significant differences between treatments were not so consistent for some of the orders in Run 2. The relative abandance of Roseiflexales increased in both treatments, and TG3-1 were more abundant in the rice straw heap at the end of the storage; the abundance of Methanobacteriales decreased significantly in both treatments. The results of the principal component analysis (PCA) on the microbial communities in Runs 1 (Figure 2C) and 2 (Figure 2D) well summarize this inconsistency. The plot for Run 1 shows that mixing rice straw into the manure induced significant differences in the microbial community, whereas for Run 2 the results of both treatments are plotted in similar positions.
The changes in several diversity indices are illustrated in Supplementary Figure S5. All five indices show that a significant reduction in microbial diversity occurred in the rice straw heap at day 14, at the beginning of the storage period; the values were restored on day 28 and were relatively stable thereafter. This significant reduction of diversity was estimated to be induced by the significant temperature increase in the rice straw heap.
The results of the estimated function of the manure microbiome by PICRUst are shown in Figure 2E and Supplementary Figure S6. The addition of rice straw significantly affected the function of the manure microbiome, in 65 (Run 1) and 60 (Run 2) of the 328 features in total. In Run 1 with clear difference between the treatments, the methane metabolism (p = 0.042) and some other microbiome functions such as glycolysis/gluconeogenesis (p < 0.001) were significantly affected by addition of rice straw, but the addition of rice straw did not have a significant effect on nitrogen metabolism (p = 0.368). In Run 2, the mixing in of rice straw significantly affected the metabolism of fatty acids (p < 0.01) including propionate (p = 0.01) and butanoate acid (p = 0.015), which are the precursors of CH4, but the addition of rice straw did not significantly affect the CH4 metabolism (p = 0.227) or N metabolism (p = 0.638). Since the metabolisms of CH4 (p = 0.038) and N (p = 0.046) changed significantly over time (Supplementary Figure S7)—especially the methane metabolism, which jumped up in week 2 in both treatments—these high variations within the treatment might have masked differences produced by the two treatments.
Figure 3 shows the results of the qPCR for total bacteria, methanogens (mcrA), nitrifiers including ammonia-oxidizing bacteria (AOB) and archaea (AOA) by amoA gene, and denitrifiers (nitrite reducers: nirK and nirS, N2O reducer: nosZ). The amount of total bacteria was relatively stable in both treatments and both runs, ranging from 7.5 × 10¹¹ to 5.7 × 10¹² copies g−1 TS. In Run 1, the abundance of methanogens (mcrA) ranged from 5.3 × 10⁸ to 5.3 × 10⁹ copies g−1 TS in the control heap, which tend to be higher than the rice straw-added heap (1.9 × 10⁸ to 1.3 × 10⁹ copies g−1 TS). This result agrees well with the 16S rRNA gene amplicon sequencing data, and both sets of results well support the concept that methanogens were inactivated by the mixing of rice straw into the manure.
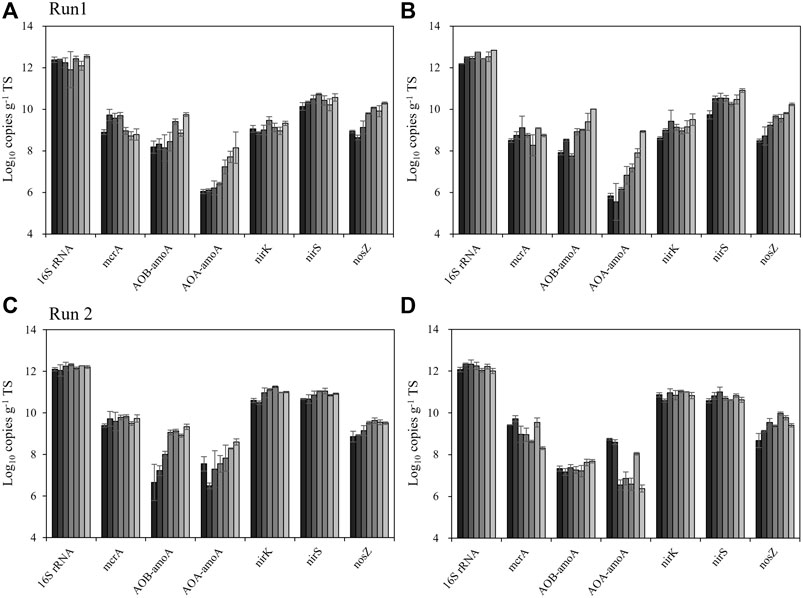
FIGURE 3. Changes in the abundance of the marker gene (16SrRNA) and functional genes (mcrA, AOA-amoA, AOB-amoA, nirK, nirS and nosZ) related to CH4 and N2O emission during the beef cattle manure storage. (A) Run 1, control heap. (B) Run 1, rice straw heap. (C) Run 2, control. (D) Run 2, rice straw heap. Gradient from black to light gray indicates the time, from week 0 to 12. Error bars: SD (n = 4).
Regarding nitrifiers, AOB-amoA were more abundant than AOA-amoA, indicating that AOB were the main nitrifiers in the beef cattle manure. Both nitrifiers significantly increased during the storage period: in the control heap, AOB-amoA increased from 1.4 × 10⁸ to 5.5 × 10⁹ and AOA-amoA increased from 1.1 × 10⁶ to 1.4×10⁸ copies g−1 TS. These results were also obtained in the rice straw-added heap in Run 1, which showed increases of AOB-amoA from 8.2 × 10⁷ to 1.0 × 10¹⁰ copies g−1 TS and AOA-amoA from 3.5 × 10⁵ to 8.5 × 10⁸ copies g−1 TS. This was not consistent in Run 2, in which AOB-amoA and AOA-amoA increased from 4.6 × 10⁶ to 2.2 × 10⁹ copies g−1 TS and from 3.1 × 10⁶ to 4.0 × 10⁸ copies g−1 TS in the control heap; in the rice straw heap, AOB-amoA and AOA-amoA were stable or even decreased, ranging from 1.5 × 10⁷ to 4.8 × 10⁷ copies g−1 TS and from 2.7 × 10⁹ to 2.6 × 10⁵ copies g−1 TS, respectively.
Concerning the denitrifiers, the abundances of nirK and nirS were relatively stable or slightly increased during the storage in both runs with both treatments. The nirK abundance ranged from 4.1 × 10⁸ to 3.2 × 10⁹ copies g−1 TS in Run 1 but higher in Run 2, from 3.1 × 10¹⁰ to 1.8 × 10¹¹ copies g−1 TS. The abundance values of nirS were more stable, indicating that it was not affected by the treatment, ranging from 5.4 × 10⁹ to 1.1 × 10¹¹ copies g−1 TS in both runs. Regarding the N2O reducer, the nosZ abundance generally increased slightly during the storage in both treatments, from 3.1 × 10⁸ to 2.0 × 10¹⁰ copies g−1 TS in Run 1 and from 4.7 × 10⁸ to 9.3 × 10⁹ copies g−1 TS in Run 2.
Discussion
This study obtained the GHG emission data throughout the system of production of beef cattle including both enteric and manure CH4 emissions with N2O emission from manure. The cattle were fed a standard diet in the conventional farms in this region, and thus the data reported herein can be used as the representative value for beef cattle production systems in Thailand.
We obtained the CH4 conversion factor (Ym) for enteric CH4 as 6.79 and 6.95% GEI for Runs 1 and 2, respectively (Table 3). These values match or are slightly higher than the IPCC default value for a Tier 2 estimation (6.5 ± 1.0%; (Eggleston et al., 2006)) or the more recent intercontinental dataset with >1,000 observations demonstrating that the Ym value for beef cattle is 6.0 ± 1.5% (Van Lingen et al., 2019) (Supplementary Table S4). Our obtained Ym values are lower than those of the previous reports which summarized the enteric CH4 emission Ym values in the tropics (8.2–8.3%; (Kaewpila and Sommart, 2016; Suzuki et al., 2018)) but are in the same range in more recent studies for Thai native or dairy cattle in the same region (Subepang et al., 2019; Kaeokliang et al., 2019). Since we fed the cattle the typical diet used in this region and confirmed that all four cattle digested the nutrients in the diet properly with the digestion experiment (Table 1), it is apparent that the cattle received enough energy for growth. The Ym value is known to be high (>10% GEI) if the feeding level is close to the under-feeding limitation (supply only to fulfilling the energy required for the body’s maintenance) (Chaokaur et al., 2015), but our results are in agreement with the previous reports that appropriate feeding can provide efficient energy utilization with lower CH4 emission.
The energy contained in the cattle’s feed was partly converted into manure, accounting for 41.9 and 44.4% of the GEI in Runs 1 and 2, respectively (Table 3). We collected the manure from each head of cattle daily and accumulated it (until its volume reached 500 kg) in the chamber for the gas emission measurements. Methane emission occurred mainly at the beginning of the storage (the first 2–4 weeks, after the accumulation period), but we also detected significant CH4 emission during in the accumulating period (Figures 1A,C). We mixed the manure every 2 weeks for homogenization in order to investigate the manure microbiome, and the mixing significantly increased the CH4 emission. In Runs 1 and 2, the peak CH4 emission values were 48.7 and 30.1 g d−1 in the control heap and lower at 37.0 and 17.6 g d−1 in the rice straw-amended heap, respectively. These results collectively suggest that a part of CH4 produced in the deep portion of heaps could be oxidized in the surface layer of heaps, especially in the rice straw mixed heaps. The calculated Ym values for the control heap were 0.87 and 0.50% GEI for Runs 1 and 2, respectively.
There is only limited study about the EF value for manure management available for this region (Nguyen et al., 2022), and the SE Asian countries are currently estimating its GHG emission from manure management by Tier 1 approach with default value provided by IPCC. The total CH4 emission during the manure storage was 4.58 kg head−1 yr−1 ± 0.80 kg head−1 yr−1 in the control heap and 4.47 kg head−1 yr−1 ± 2.23 kg head−1 yr−1 in the rice straw-mixed heap, respectively (Table 2). These values are much higher than the IPCC default value, 1 kg head−1 yr−1 (Eggleston et al., 2006) for the category “solid storage.” This value for beef cattle (included in “other cattle”) is fixed across different climate conditions, and the corresponding value for dairy cattle ranges from 9 to 31 kg head−1 yr−1. Recent update for this IPCC official values with change in the unit shows that CH4 emission from “solid storage” category are 4.4 g CH4 kg−1 VS for non-dairy cattle with low productivity (cattle used in this study belong to this group) and 6.0 g CH4 kg−1 VS for non-dairy cattle with high productivity (Eduardo et al., 2019). These values are closer to our estimate (control heap: 5.91 g kg−1 VS ± 2.39 g kg−1 VS, rice straw-mixed manure: 6.32 g kg−1 VS ± 3.69 g kg−1 VS), and much higher than the manure sun-drying in Vietnam; 0.295 g kg−1 VS (Nguyen et al., 2022). The discrepancy in values might be due mainly to the limitations of the dataset; our present findings therefore provide concrete values obtained with comprehensive measurements taken throughout the production of beef cattle in a tropical climate.
We compared the treatments with and without the mixing of rice straw into the manure. Such an addition of rice straw can make the manure porous, which enables the penetration of fresh air into the manure; it also makes the manure microbiome active for organic matter decomposition. Methanogens are known to be activated in a strictly anaerobic condition (Conrad, 2007; Conrad, 2020), and the addition of rice straw is thus expected to inactivate the methanogens in the manure and reduce the CH4 emission. However, we observed herein that the effect of the rice straw amendment on the CH4 emission was limited, and the differences between the treatments were not statistically significant. (Maeda et al., 2013) showed that the addition of straw can significantly reduce the CH4 emission from dairy manure compost, and more recent meta-analysis also shows that the use of bulking agent can mitigate CH4 emission (Pardo et al., 2015), which does not agree well with our present findings.
Two potential reasons for this difference are as follows. 1) Beef cattle manure has a lower moisture content (75–80%) compared to dairy cattle manure (>80%), which makes the anaerobic zone inside the manure heap much smaller. 2) The amount of manure used in the present study was ∼500 kg, which is far smaller than the amount of dairy manure used by (Maeda et al., 2013) (4,000 kg) with much higher CH4 emission (20.8 g kg−1 VS ± 1.3 g kg−1 VS This could also shrink the size of anaerobic zone with active CH4 production. These differences reflect the CH4 emission ratio to initial volatile solids. Since majority of the beef cattle farmers in Thailand are smallholders with less than 20 cattle (DLD, 2018), the amount of accumulated manure tested in our present study is appropriate to mimic the actual situation in Thailand. The CH4 emission factor measured in herein thus has potential to be the representative country-specific value.
We also measured the N2O emission from manure (Figures 1B,D). There were two peaks in Run 1, one at day 0 (i.e., the first mixing for homogenization in both treatments), and the other small peak was obtained in the control heap at ∼week 8. The second small peaks come from the higher nitrification activity which is underpinned by the higher NO2− or NO3− content (Supplementary Figure S2) and the increases of both bacterial and archaeal amoA genes (Figure 3). There was only a small difference in the N2O emission between the treatments in Run 1. In Run 2, a major peak was observed only for the control heap at ∼week 6, whereas the rice straw-mixed heap showed very low N2O emission throughout the measurement. Although the effect of the addition of rice straw was not consistent, the results of Run 2 show that it has some potential to mitigate N2O emission.
The estimated emission factor was 1.46 g N2O-N kg−1 Ninitial ± 0.92 g N2O-N kg−1 Ninitial and 0.75 g N2O-N kg−1 Ninitial ± 0.72 g N2O-N kg−1 Ninitial for the control and rice straw-amended heaps, respectively. The original official emission factor (IPCC default value) for N2O from solid manure storage is 5 g N2O-N kg−1 N excreted (Eggleston et al., 2006), which originally came from the measurement reported by (Amon et al., 2001) with dairy manure under a temperate climate (8.1–22.1°C), and that situation is very much different from the present study’s, i.e., beef cattle manure under tropical conditions. Recent update for IPCC default value (Eduardo et al., 2019) are 10 g N2O-N kg−1 N excreted for “solid storage” category, and additional category “solid storage-bulking agent addition” shows the same value with the original one (5 g N2O-N kg−1 N). The results of our present study demonstrate that the current IPCC default value could be a considerable overestimation, at least for the beef cattle production systems and their manure management in Southeast Asian countries. Moreover, the values obtained herein are the extension of the feeding experiment with enteric CH4 measurement, and the values therefore have some advantages over the previous works.
We measured the amount of inorganic N periodically (Supplementary Figure S2), which enabled the observation of the N conversion in the manure over time. We detected both NO2− and NO3− during this period in the control heap, whereas very small amounts of these were detected in the rice straw-added heap. We also measured the abundance of nitrifiers (both AOA and AOB) in the manure (Figure 3) and observed that the rice straw-added heap had lower nitrifier abundance. This result partially explains why the rice straw-amended heap did not show N2O emission, but this phenomenon was observed only in Run 2.
In Run 1, both NO2− and NO3− were detected in the rice straw-mixed heap, and in both treatments the nitrifier abundance increased throughout the storage period (Supplementary Figure S2). A potential explanation for these inconsistent results is the effect of the high temperature on the nitrifiers, since nitrifiers generally prefer mesophilic conditions (22–45°C) (Taylor et al., 2017) with some exceptions; some thermophilic (> 45°C) nitrifiers in specific ecosystems prefer hot springs (De la Torre et al., 2008). Our present findings indicate that the addition of rice straw has some potential to inhibit the activity of nitrifiers, which may lead to lower N2O emission.
Indeed, although the underlying mechanism is not well understood, our previous study of dairy manure revealed that the N2O emission was mitigated by 62.8% with the addition of rice straw (Maeda et al., 2013). Since rice straw is easily available in Southeast Asian countries at 65 million tons per year (OAE, 2019; Rice Department Ministry of Agriculture and Cooperative, 2020), its potential utilization to mitigate GHG emission from livestock manure should be further investigated.
To understand our GHG emission results and the differences between the treatments during the manure storage more thoroughly, we monitored the total bacterial/archaeal community (Figure 2). The effect of the rice straw addition was very much clear in Run 1: it reduced the relative abundance of Methanobacteriales (a hydrogenotrophic methanogen) within 2 weeks, which indicates that amending manure with rice straw has the potential to inhibit methanogen activity. The addition of rice straw also increased the relative abundance of Bacillales, which is frequently reported as an important active degrader of organic matter in manure (Chachkhiani et al., 2004; Maeda et al., 2010; Bhattacharya and Pletschke, 2014) and has a thermostable enzyme with a wide pH range (Arikan, 2008).
We observed that the abundance of another order, Roseiflexales, was significantly increased in the rice straw-amended manure, especially in Run 1. The proliferation of this order might be associated with the large temperature difference between treatments (Supplementary Figure S1); that is, the significantly higher temperature (66.2°C) in the rice straw-mixed heap, which might drive the manure microbiome. Roseiflexales is also known to contain thermophilic and photomixotrophic filamentous bacteria, which are frequently detected in the microbial mat in the hot springs (Hanada, 2003). These bacteria have a symbiotic relationship with cyanobacteria in these environments, utilizing the substrate (i.e., acetate) provided by the cyanobacteria (Klatt et al., 2013; Steinke et al., 2020). Since the environment in the manure is much different from that of a microbial mat in hot springs, the function of the order Roseiflexales in the total community must be different. We speculate that this order has some relationship with the emission of CH4, since it consumes acetate (the precursor of CH4), and manure heaps with a high abundance of Roseiflexales have tended to have lower CH4 emission.
With the significant difference in the methanogen abundance between the present study’s treatments, the results of our functional estimation of the microbiome also support the effects on the methanogens; i.e. the mixing of rice straw into the beef cattle manure had a significant effect on the metabolism of CH4 and some others in Run 1 (Figure 2D). This clear difference was not observed in Run 2: the relative abundance of Methanobacteriales decreased significantly in both treatments (Figure 2B).
However, this result explains well why both the control and rice straw treatments in Run 2 resulted in lower CH4 emission compared to Run 1 (Table 2). These results are also supported by the qPCR results for mcrA gene, the key and marker gene which encodes the last step of the methanogenesis. The rice straw-added manure tended to show lower mcrA abundance (Figure 3). Altogether, our findings indicate that the cumulative CH4 emission during manure storage was not significantly different between the runs due to the large between-run variations, but these microbiological data clearly show that the addition of rice straw has some potential to mitigate the CH4 emission during the storage of manure.
In conclusion, we measured the GHG emission from feeding to manure management in a replication of the typical beef cattle production system in Thailand. The values that we obtained can be used for the potential national emission factor. The amendment of the manure with rice straw tended to result in lower GHG emission, and the manure microbiome data support that this technique has some potential to inhibit the activity of methanogens and nitrifiers during manure storage. The results of our functional estimation of the manure microbiome also suggest that many metabolism pathways were affected by the addition of rice straw. Nevertheless, the relationship between rice-straw amendment and the emission of GHG is not yet clear, and further studies are required to elucidate this relationship. Since beef cattle are the major GHG-emitting livestock in Southeast Asian countries, our data can be used to estimate the important GHG emission data with a higher-tier approach for this region.
Data Availability Statement
The datasets presented in this study can be found in online repositories. The names of the repository/repositories and accession number(s) can be found below: DDBJ (accession: DRR347213-DRR347239).
Ethics Statement
The animal study was reviewed and approved by Science and Technology Committee of RFSRDC.
Author Contributions
WA: investigation, Data curation, writing original draft. AM: Investigation, Writing-review and editing. HK: Investigation. OK: Investigation. SK: Project administration, Supervision. TS: Investigation, Project administration. YC: Conceptualization, Writing-review and editing. KM: Conceptualization, Data curation, Formal analysis, Investigation, Methodology, Writing – original draft, Writing – review and editing.
Funding
This work was implemented under the Japan International Research Center for Agricultural Sciences project Climate Change Measures in Agricultural Systems.
Conflict of Interest
The authors declare that the research was conducted in the absence of any commercial or financial relationships that could be construed as a potential conflict of interest.
Publisher’s Note
All claims expressed in this article are solely those of the authors and do not necessarily represent those of their affiliated organizations, or those of the publisher, the editors and the reviewers. Any product that may be evaluated in this article, or claim that may be made by its manufacturer, is not guaranteed or endorsed by the publisher.
Supplementary Material
The Supplementary Material for this article can be found online at: https://www.frontiersin.org/articles/10.3389/fenvs.2022.872911/full#supplementary-material
References
Aggarangsi, P., Tippayawong, N., Moran, J. C., and Rerkkriangkrai, P. (2013). Overview of Livestock Biogas Technology Development and Implementation in Thailand. Energy Sustain. Dev. 17, 371–377. doi:10.1016/j.esd.2013.03.004
Akiyama, H., Hayakawa, A., Sudo, S., Yonemura, S., Tanonaka, T., and Yagi, K. (2009). Automated Sampling System for Long-Term Monitoring of Nitrous Oxide and Methane Fluxes from Soils. Soil Sci. Plant Nutr. 55, 435–440. doi:10.1111/j.1747-0765.2009.00379.x
Amon, B., Amon, T., Boxberger, J., and Alt, C. (2001). Emissions of NH3, N2O and CH4 from Dairy Cows Housed in a Farmyard Manure Tying Stall (Housing, Manure Storage, Manure Spreading). Nutr. Cycl. Agroecosys. 60, 103–113. doi:10.1023/A:1012649028772
Arikan, B. (2008). Highly Thermostable, Thermophilic, Alkaline, SDS and Chelator Resistant Amylase from a Thermophilic Bacillus Sp. Isolate A3-15. Bioresour. Technol. 99, 3071–3076. doi:10.1016/j.biortech.2007.06.019
Bhattacharya, A., and Pletschke, B. I. (2014). “Thermophilic Bacilli and Their Enzymes in Composting,” in Composting for Sustainable Agriculture (Cham: Springer), 103–124. doi:10.1007/978-3-319-08004-8_6
Bokulich, N. A., Kaehler, B. D., Rideout, J. R., Dillon, M., Bolyen, E., Knight, R., et al. (2018). Optimizing Taxonomic Classification of Marker-Gene Amplicon Sequences with QIIME 2's Q2-Feature-Classifier Plugin. Microbiome 6, 90. doi:10.1186/s40168-018-0470-z
Bolyen, E., Rideout, J. R., Dillon, M. R., Bokulich, N. A., Abnet, C. C., Al-Ghalith, G. A., et al. (2019). Reproducible, Interactive, Scalable and Extensible Microbiome Data Science Using QIIME 2. Nat. Biotechnol. 37, 852–857. doi:10.1038/s41587-019-0209-9
Callahan, B. J., McMurdie, P. J., Rosen, M. J., Han, A. W., Johnson, A. J. A., and Holmes, S. P. (2016). DADA2: High-Resolution Sample Inference from Illumina Amplicon Data. Nat. Methods 13, 581–583. doi:10.1038/nmeth.3869
Caporaso, J. G., Lauber, C. L., Walters, W. A., Berg-Lyons, D., Lozupone, C. A., Turnbaugh, P. J., et al. (2011). Global Patterns of 16S rRNA Diversity at a Depth of Millions of Sequences Per Sample. Proc. Natl. Acad. Sci. U.S.A. 108, 4516–4522. doi:10.1073/pnas.1000080107
Chachkhiani, M., Dabert, P., Abzianidze, T., Partskhaladze, G., Tsiklauri, L., Dudauri, T., et al. (2004). 16S rDNA Characterisation of Bacterial and Archaeal Communities during Start-Up of Anaerobic Thermophilic Digestion of Cattle Manure. Bioresour. Technol. 93, 227–232. doi:10.1016/j.biortech.2003.11.005
Chaiprasert, P. (2011). Biogas Production from Agricultural Wastes in Thailand. J. Sustain. Energy Environ. Spec. Issue 2011, 63–65.
Chaokaur, A., Nishida, T., Phaowphaisal, I., and Sommart, K. (2015). Effects of Feeding Level on Methane Emissions and Energy Utilization of Brahman Cattle in the Tropics. Agric. Ecosyst. Environ. 199, 225–230. doi:10.1016/j.agee.2014.09.014
Chemists, A. A., and Horwitz, W. (1990). Official Methods of Analysis. 15th ed., Arlington, VA: AOAC, 489.
Conrad, R. (2020). Importance of Hydrogenotrophic, Aceticlastic and Methylotrophic Methanogenesis for Methane Production in Terrestrial, Aquatic and Other Anoxic Environments: A Mini Review. Pedosphere 30, 25–39. doi:10.1016/S1002-0160(18)60052-9
Conrad, R. (2007). Microbial Ecology of Methanogens and Methanotrophs. Adv. Agron. 96, 1–63. doi:10.1016/S0065-2113(07)96005-8
De la Torre, J. R., Walker, C. B., Ingalls, A. E., Könneke, M., and Stahl, D. A. (2008). Cultivation of a Thermophilic Ammonia Oxidizing Archaeon Synthesizing Crenarchaeol. Environ. Microbiol. 10, 810–818. doi:10.1111/j.1462-2920.2007.01506.x
DLD (Department of Livestock Development) (2018). Livestock Statistics of Thailand 2018. Cham: Statistic of beef and farmer, 25.
Eduardo, C., Sabin, G., Bundit, L., Riitta, P., Yasna, R., Rob, S., et al. (2019). Refinement to the 2006 IPCC Guidelines for National Greenhouse Gas Inventories. Report. Genève, Switzerland: IPCC.
Eggleston, S., Buendia, L., Miwa, K., Ngara, T., and Tanabe, K. (2006). IPCC Guidelines for National Greenhouse Gas Inventories. Japan: Institute for Global Environmental Strategies Hayama, 2006.
Fukumoto, Y., Osada, T., Hanajima, D., and Haga, K. (2003). Patterns and Quantities of NH3, N2O and CH4 Emissions during Swine Manure Composting without Forced Aeration-Effect of Compost Pile Scale. Bioresour. Technol. 89, 109–114. doi:10.1016/S0960-8524(03)00060-9
Hanada, S. (2003). Filamentous Anoxygenic Phototrophs in Hot Springs. Microb. Environ. 18, 51–61. doi:10.1264/jsme2.18.51
Herrero, M., Henderson, B., Havlík, P., Thornton, P. K., Conant, R. T., Smith, P., et al. (2016). Greenhouse Gas Mitigation Potentials in the Livestock Sector. Nat. Clim. Change 6, 452–461. doi:10.1038/nclimate2925
Kaeokliang, O., Kawashima, T., Narmseelee, R., Butcha, P., Sunato, S., Thinowong, A., et al. (2019). Effects of Physically Effective Fiber in Diets Based on Rice Straw and Cassava Pulp on Chewing Activity, Ruminal Fermentation, Milk Production, and Digestibility in Dairy Cows. Anim. Sci. J. 90, 1193–1199. doi:10.1111/asj.13271
Kaewpila, C., and Sommart, K. (2016). Development of Methane Conversion Factor Models for Zebu Beef Cattle Fed Low‐quality Crop Residues and By‐products in Tropical Regions. Ecol. Evol. 6, 7422–7432. doi:10.1002/ece3.2500
Klatt, C. G., Liu, Z., Ludwig, M., Kühl, M., Jensen, S. I., Bryant, D. A., et al. (2013). Temporal Metatranscriptomic Patterning in Phototrophic Chloroflexi Inhabiting a Microbial Mat in a Geothermal Spring. ISME J. 7, 1775–1789. doi:10.1038/ismej.2013.52
Langille, M. G. I., Zaneveld, J., Caporaso, J. G., McDonald, D., Knights, D., Reyes, J. A., et al. (2013). Predictive Functional Profiling of Microbial Communities Using 16S rRNA Marker Gene Sequences. Nat. Biotechnol. 31, 814–821. doi:10.1038/nbt.2676
Maeda, K., Hanajima, D., Morioka, R., and Osada, T. (2010). Characterization and Spatial Distribution of Bacterial Communities within Passively Aerated Cattle Manure Composting Piles. Bioresour. Technol. 101, 9631–9637. doi:10.1016/j.biortech.2010.07.057
Maeda, K., Hanajima, D., Morioka, R., Toyoda, S., Yoshida, N., and Osada, T. (2013). Mitigation of Greenhouse Gas Emission from the Cattle Manure Composting Process by Use of a Bulking Agent. Soil Sci. Plant Nutr. 59, 96–106. doi:10.1080/00380768.2012.733868
Meinhardt, K. A., Bertagnolli, A., Pannu, M. W., Strand, S. E., Brown, S. L., and Stahl, D. A. (2015). Evaluation of Revised Polymerase Chain Reaction Primers for More Inclusive Quantification of Ammonia‐oxidizing Archaea and Bacteria. Environ. Microbiol. Rep. 7, 354–363. doi:10.1111/1758-2229.12259
Nguyen, V. T., Maeda, K., Nishimura, Y., Nguyen, T. T. H., La, K. V., Nguyen, D. D., et al. (2022). Emission Factors for Vietnamese Beef Cattle Manure Sun-Drying and the Effects of Drying on Manure Microbial Community. PLoS ONE 17 (3), e0264228. doi:10.1371/journal.pone.0264228
OAE (Office of Agricultural Economic) (2019). Agricultural Statistics of Thailand. Available at: www.oae.go.th/assets/portals/1/files/jounal/2563/yearbook62edit.pdf. (Accessed September 19, 2021)
Osada, T., and Fukumoto, Y. (2001). Development of a New Dynamic Chamber System for Measuring Harmful Gas Emissions from Composting Livestock Waste. Water Sci. Technol. 44, 79–86. doi:10.2166/wst.2001.0513
Pardo, G., Moral, R., Aguilera, E., and Prado, A. (2015). Gaseous Emissions from Management of Solid Waste: a Systematic Review. Glob. Change Biol. 21, 1313–1327. doi:10.1111/gcb.12806
Parks, D. H., Tyson, G. W., Hugenholtz, P., and Beiko, R. G. (2014). STAMP: Statistical Analysis of Taxonomic and Functional Profiles. Bioinformatics 30, 3123–3124. doi:10.1093/bioinformatics/btu494
Rice Department Ministry of Agriculture and Cooperative (2020). Rice Straw Management from Paddy Field in Irrigation System Area. Available at: http://www.ricethailand.go.th/Rkb (Accessed September 19, 2021).
Steinke, L., Slysz, G. W., Lipton, M. S., Klatt, C., Moran, J. J., Romine, M. F., et al. (2020). Short-term Stable Isotope Probing of Proteins Reveals Taxa Incorporating Inorganic Carbon in a Hot Spring Microbial Mat. Appl. Environ. Microbiol. 86, e01829. doi:10.1128/AEM.01829-19
Subepang, S., Suzuki, T., Phonbumrung, T., and Sommart, K. (2019). Enteric Methane Emissions, Energy Partitioning, and Energetic Efficiency of Zebu Beef Cattle Fed Total Mixed Ration Silage. Asian-Australas J. Anim. Sci. 32, 548. doi:10.5713/ajas.18.0433
Suzuki, T., Phaowphaisal, I., Pholsen, P., Narmsilee, R., Indramanee, S., Nitipot, P., et al. (2008). In Vivo nutritive Value of Pangola Grass (Digitaria Eriantha) Hay by a Novel Indirect Calorimeter with a Ventilated Hood in Thailand. JARQ 42 (2), 123–129. doi:10.6090/jarq.42.123
Suzuki, T., Sommart, K., Angthong, W., Nguyen, T. V., Chaokaur, A., Nitipot, P., et al. (2018). Prediction of Enteric Methane Emission from Beef Cattle in Southeast Asia. Anim. Sci. J. 89, 1287–1295. doi:10.1111/asj.13058
Taylor, A. E., Giguere, A. T., Zoebelein, C. M., Myrold, D. D., and Bottomley, P. J. (2017). Modeling of Soil Nitrification Responses to Temperature Reveals Thermodynamic Differences between Ammonia-Oxidizing Activity of Archaea and Bacteria. ISME J. 11, 896–908. doi:10.1038/ismej.2016.179
Van Lingen, H. J., Niu, M., Kebreab, E., Valadares Filho, S. C., Rooke, J. A., Duthie, C.-A., et al. (2019). Prediction of Enteric Methane Production, Yield and Intensity of Beef Cattle Using an Intercontinental Database. Agric. Ecosyst. Environ. 283, 106575. doi:10.1016/j.agee.2019.106575
Van Soest, P. J., Robertson, J. B., and Lewis, B. A. (1991). Methods for Dietary Fiber, Neutral Detergent Fiber, and Nonstarch Polysaccharides in Relation to Animal Nutrition. J. Dairy Sci. 74, 3583–3597. doi:10.3168/jds.S0022-0302(91)78551-2
Vichairattanatragul, P., Thanee, N., and Keeratiurai, P. (2015). Carbon Massflow and Greenhouse Gases Emission from Pork and Goat Meat Productions in Thailand: Case Study of Nakhon Ratchasima, Chon Buri and Prachin Buri Provinces. J. Agr. Technol. 11, 1973–1986.
Keywords: methane, nitrous oxide, emission factor, enteric fermentation, manure management, Southeast Asia
Citation: Angthong W, Mori A, Kitwetcharoen H, Kaeokliang O, Kamphayae S, Suzuki T, Cai Y and Maeda K (2022) Comprehensive Assessment of Greenhouse Gas Emissions From Thai Beef Cattle Production and the Effect of Rice Straw Amendment on the Manure Microbiome. Front. Environ. Sci. 10:872911. doi: 10.3389/fenvs.2022.872911
Received: 10 February 2022; Accepted: 29 April 2022;
Published: 25 May 2022.
Edited by:
Xander Wang, University of Prince Edward Island, CanadaReviewed by:
Seung Gu Shin, Gyeongsang National University, South KoreaChiqian Zhang, University of Missouri, United States
Copyright © 2022 Angthong, Mori, Kitwetcharoen, Kaeokliang, Kamphayae, Suzuki, Cai and Maeda. This is an open-access article distributed under the terms of the Creative Commons Attribution License (CC BY). The use, distribution or reproduction in other forums is permitted, provided the original author(s) and the copyright owner(s) are credited and that the original publication in this journal is cited, in accordance with accepted academic practice. No use, distribution or reproduction is permitted which does not comply with these terms.
*Correspondence: Koki Maeda, a19tYWVkYUBhZmZyYy5nby5qcA==