
94% of researchers rate our articles as excellent or good
Learn more about the work of our research integrity team to safeguard the quality of each article we publish.
Find out more
ORIGINAL RESEARCH article
Front. Environ. Sci. , 01 June 2022
Sec. Freshwater Science
Volume 10 - 2022 | https://doi.org/10.3389/fenvs.2022.872739
 Gaute Kjærstad1*
 Markus Majaneva2
 Mohsen Falahati-Anbaran1
 Lasse Topstad3Anders Gravbrøt Finstad1Jo Vegar Arnekleiv1Torbjørn Ekrem1
The botanical compound rotenone is extensively used to eradicate populations and reduce the negative impacts of freshwater invasive animals. The method is controversial as non-target organisms often are negatively affected, but these effects are highly variable among taxa and may be difficult to monitor on species-level as many invertebrates are challenging or costly to identify using morphology. We investigated the effect of rotenone treatment on freshwater invertebrates in two Nordic lakes using both traditional morphological identification and DNA metabarcoding of the preservative ethanol DNA (peDNA). We used a before-after-control-impact design in assessing the effect of the rotenone treatment, with two treated and two control lakes, all sampled immediately before the rotenone treatment, immediately after and 1 year after the treatment. The two methods of identification gave different results: The peDNA based method detected 333 taxa, while 90 taxa were recorded by morphological identification. Twenty-eight taxa were in common for both methods. Both traditional morphological identification and identification using metabarcoding of peDNA showed a significant effect of the rotenone treatment on invertebrate community composition expressed as Bray-Curtis dissimilarities. Using the results from peDNA, the number of taxa decreased just after the treatment and increased again 1 year after the treatment in the treated lakes, indicating a short-term effect of the treatment and a subsequent recovery of the invertebrate community. We conclude that DNA metabarcoding of preservative ethanol has a promising potential to record effects of anthropogenic stressors such as rotenone treatment. However, as peDNA based metabarcoding missed several taxa, and detected DNA from species not living in the actual sampling sites, the method needs further improvement and should perhaps be used in combination with morphological-based identification until sufficiently refined.
Human activities threaten natural biodiversity and ecosystems at an increasing rate (IPBES, 2019). Freshwater ecosystems, which hold a disproportionately high share of species compared to their area, are among the most threatened habitat types, and need particular attention by nature management authorities (Tickner et al., 2020). Invasive alien species are species introduced into an environment outside of their natural habitats that may cause negative effects for the native biota. They are presently considered one of the most serious threats to freshwater biodiversity (Dudgeon et al., 2006; Reid et al., 2018).
The problems with invasive alien species are currently increasing (Pyšek et al., 2020) and several measures are taken to detect presence and to prevent colonization, or limit the spread of such species. However, for aquatic ecosystems, the options for removal are limited after a new species is introduced. One of the few effective measures is the piscicide rotenone. It is widely used as a management tool to control or remove undesirable fish species and their parasites, but non-target organisms may be negatively affected (Beal and Anderson, 1993; Ling, 2003). The effect of rotenone treatment on benthic invertebrate abundances may vary considerably and range from minor (Dudgeon, 1990; Blakely et al., 2005) to severe (Binns, 1967; Hamilton et al., 2009), and tolerance to rotenone varies considerably among invertebrate taxa (e.g., Engstrom-Heg et al., 1978; Arnekleiv et al., 1997; Mangum and Madrigal, 1999; Dalu et al., 2015). Some groups like Ephemeroptera, Plecoptera and Trichoptera are known to be particularly rotenone sensitive (Dudgeon, 1990; Arnekleiv et al., 1997; Gladsø and Raddum, 2002). However, there are large variations also within taxonomic groups, and several rotenone tolerant taxa are known within these orders. Other invertebrates like Coleoptera and Gastropoda are reported to be little or not affected by rotenone (Holocombe et al., 1987; Kjærstad and Arnekleiv, 2011). For species rich groups like Oligochaeta, Chironomidae and Hydrachnidia, effects of rotenone are poorly known since they rarely are identified below the family level. However, a few studies indicate that the rotenone tolerance within these groups also varies considerably (Koksvik and Aagaard, 1984; Arnekleiv et al., 1997; Melaas et al., 2001; Fjellheim, 2004).
Recovery of an invertebrate community following rotenone treatments may take a year or shorter for common taxa to several years for rarer taxa (Vinson et al., 2010 and references therein). However, Vinson et al. (2010) pointed out that the variation in reported effects may primarily be due to natural variation among species and habitats, and that the observed variation also may be due to inadequate pre- and post-treatment sampling, thus preventing the observation of the true impacts of rotenone treatments on invertebrate assemblages.
An additional factor that may prevent clear differences in before-after studies is the coarse taxonomic resolution in many studies investigating rotenone effects. This is a particular challenge if the effects of rotenone vary across closely related taxa. Generally, long- and short-term effects of rotenone treatment on benthic invertebrates have been studied using traditional sampling methods like kick or Surber sampling along with morphological identification. The taxonomic breadth of such studies is often limited due to lack of taxonomic expertise or simply the inability to reliably identify some taxon groups by morphological cues. In answer to this, new methods combining DNA metabarcoding with community DNA or environmental DNA (eDNA) have emerged as alternatives. These methods are relatively low cost and more time-efficient, with a higher potential to detect taxa that are difficult to identify morphologically (Chang, 2020; Liu et al., 2020; Rimet et al., 2021).
DNA metabarcoding of eDNA from water samples often register more macroinvertebrate taxa than approaches using morphological identification (Deiner et al., 2016; Wang et al., 2021). Several studies have also mapped biodiversity by a combination of DNA metabarcoding of aquatic eDNA and DNA from tissues of bulk samples. Generally, DNA metabarcoding from water produce a higher number of taxa/OTUs, but for macroinvertebrates or smaller targeted taxonomic groups like Ephemeroptera, Plecoptera and Trichoptera, DNA metabarcoding from grinded bulk samples performs better (Macher et al., 2018; Gelason et al., 2020). However, neither metabarcoding of aquatic eDNA nor metabarcoding of homogenized bulk-samples leave behind material for morphological verification and so far lack the possibility of reliably associating sequence read counts with abundances or biomass of each species. Thus, methods that allow for preservation of a physical vouchers are beneficial for both verification of results and abundance data. DNA metabarcoding of DNA from preservative fluids, first shown by Shokralla et al. (2010), is one such method as it avoids specimen destruction. Although barcoding of preservative ethanol has shown some promising results compared to barcoded specimens of the corresponding bulk samples (Hajibabaei et al., 2012), and to eDNA from water samples (Wang et al., 2021), a recent study showed few shared taxa compared to bulk tissue samples (Persaud et al., 2021).
Here, we investigate the effects of rotenone treatment on invertebrate diversity in two lakes in Central Norway using both morphological identification and metabarcoding of DNA from preservative ethanol (peDNA). We used a before-after-control-impact design to compare the inference drawn from the different methodologies and also compare how the methods perform in detecting taxa present at the sampling sites. Two treated lakes and two control lakes were sampled immediately before and after the rotenone treatment as well as 1 year after.
The studied lakes are situated in a coniferous dominated boreal forest area just outside the city of Trondheim in Central Norway. The study included two rotenone treated and two control lakes with relatively similar characteristics (Figure 1; Table 1).
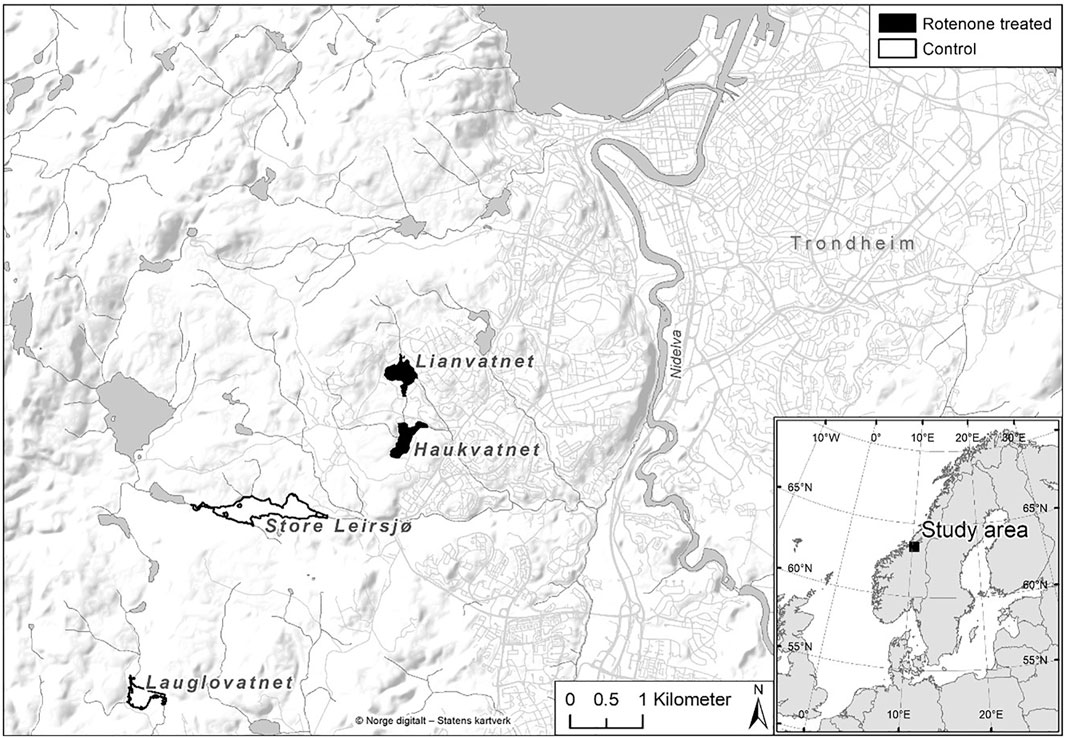
FIGURE 1. Overview of the Bymarka area in Central Norway with the rotenone treated and control lakes.
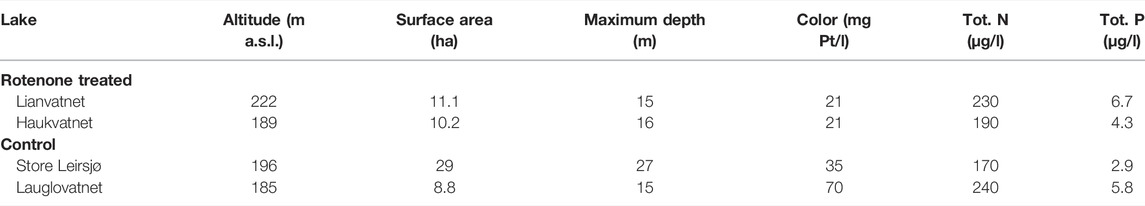
TABLE 1. Abiotic characteristics of the study lakes. Water quality parameters were sampled in July 2019.
In the rotenone treated lakes (Haukvatnet and Lianvatnet), roach (Rutilus rutilus) and pike (Esox lucius) were the dominating fish species before treatment. Roach was introduced to the treated lakes in the 1980s, whereas pike was introduced before 1900. Whitefish (Coregonus lavaretus) was present in both lakes in the 1970s, but probably disappeared a few years after the introduction of roach. Brown trout (Salmo trutta) has occasionally been stocked in the treated lakes for recreational fishing. The natural non-anadromous freshwater fish fauna in the area is restricted to brown trout, arctic char (Salvelinus alpinus) and three-spined stickleback (Gasterosteus aculeatus). In the control lakes, brown trout is the dominating fish species. In Lake Lauglovatnet, brown trout was the only fish species observed, while also three-spined stickleback and arctic char were observed in Store Leirsjø.
The purpose of the rotenone treatment was to eradicate the roach, a non-native fish species to the Trondheim area. The roach was considered as a potential threat to water quality if it spread to the nearby Lake Jonsvatnet, the drinking water source for the city of Trondheim. The treatment was conducted between 19–22 September 2016. The rotenone solution CFT-Legumine, with a 3.3% active ingredient was applied with 563.5 L in Lianvatnet and 833 L in Haukvatnet and their tributaries (Bardal et al., 2018). Immediately after the treatment, the concentration of CFT-Legumine in Lianvatnet and Haukvatnet were on average (sd) 1.23 (0.71) and 1.42 (0.59) ppm, respectively. Concentrations subsequently decreased to non-detectable values by January 2017 in both lakes (Bardal et al., 2018).
After rotenone treatment, the treated lakes remained fishless throughout the study period. Fish fauna in the control lakes remained unchanged during the study.
Benthic invertebrates were sampled by z-sweeps in both rotenone treated and control lakes. Sampling took place just before and after the rotenone treatment on 14–15 September and 4–5 October 2016, respectively, as well as 1 year after the treatment in October 2017. At each sampling occasion, three stations each with three replicated samples were taken in each lake. To reflect the habitat variation within each lake, two stations were located in sheltered areas with aquatic vegetation and soft bottom and one station in wind exposed areas with little or no aquatic vegetation and gravel bottom. Each z-sweep was taken in shallow water (<1 m depth) approximately 1.5 m ashore. We used a kick net with a frame of 25 × 25 cm and a mesh size of 250 µm. Each sample was taken by moving the net swiftly 2–3 cm over the bottom in three sweeps parallel to the shore for one second and 1 m each way (sweep). Sweep 1 catches animals on and partly dug down in the substrate, whereas sweep 2 and 3 catch animals that are whirling up in the water column (Dolmen, 1992). To ensure consistency the same person (GK) collected all the benthic samples and performed the morphological identification of taxa. The samples were stored in ethanol for further processing in the lab. Using a stereo microscope, the benthic invertebrates were determined to the lowest possible taxonomic level. The identifier regularly participates in intercalibration tests for benthic freshwater invertebrates commonly used in routine biomonitoring programs. The following literature for identification were used: Engblom (1996) for Ephemeroptera, Lillehammer (1988) for Plecoptera, Rinne and Wiberg-Larsen (2017) for Trichoptera, Norling and Sahlén (1997) for Odonata, Jansson (1996) for Hemiptera, Holmen (1987) and Nilsson and Holmen (1995) for Coleoptera and Glöer (2002) for Gastropoda.
DNA from preservative ethanol was extracted from all z-sweep samples using Qiagen DNeasy Blood and T issue K it for plate or individual tube extractions. For each sample, a maximum of 300 ml was filtered using an electrical vacuum pump connected to a manifold (Pall Laboratory, Port Washington, NY, United States) carrying three individually operated filter holder bases. For some samples containing less than 300 ml preservative, the full volume was used (ranging from 150–300 ml). Filters were completely dried on the manifold, folded three times with sterile forceps and placed in individual Eppendorf tubes containing the ATL lysis buffer and Proteinase K following the manufacturer’s protocol. Volumes of lysis buffer and Proteinase K were increased to completely submerge filters in the buffer. Samples were incubated at 56 °C for 18 h, vortexed at low speed every 15–30 min during the first 4 hours, then every hour for the following 2 hours. Ninety-three samples were extracted with plate kit; 13 with single spin columns. Final elution volume was 100 µl. Two negative extraction controls were performed (one for the plate extraction; one for individual tube extraction).
In addition, water samples were collected from all stations of the four study lakes and always prior to and on the same day as the benthic sampling as described in Majaneva et al. (2018). However, DNA metabarcoding of the water eDNA samples failed to recover enough species (median 3 species per sample) to provide a sensible comparison in our study. Only 1% of the good-quality and chimera-checked water eDNA reads were from targeted organisms. Therefore, the water eDNA data was discarded from further analyses.
Each peDNA extract was amplified and sequenced in three replicates (technical replicates called PCR replicates hereafter). The PCR replicates were amplified using the forward primer BF2 and the reverse primer BR2 (Elbrecht and Leese, 2017) with attached Illumina adapters 5′-TCGTCGGCAGCGTCAGATGTGTATAAGAGACAG-3′ (forward) and 5′-GTCTCGTGGGCTCGGAGATGTGTATAAGAGACAG-3′ (reverse) in the first PCR. The primers are targeting freshwater macroinvertebrates and amplify an approximately 420 bp long fragment of the mitochondrial cytochrome c oxidase subunit I gene (COI). As negative control PCR, molecular grade water in place of the template was amplified along the samples. The peDNA extracts were purified with DNeasy PowerClean K it prior to amplification to remove PCR inhibitors. Each PCR had a total volume of 20 μl containing 2 μl DNA template, 2 μl 10 × PCR buffer, 0.15 μl TaKaRa Ex Taq DNA Polymerase Hot-Start Version (Takara Bio Europe), 2 μl dNTPs mix (10 mM), 2 μl MgCl2 (25 mM), 0.5 μl of each primer (10 μM), 1 μl BSA (New England BioLabs) and 10.35 μl molecular biology grade water. The PCR conditions were, with a heated lid, 94°C for 5 min, followed by a total of 35 cycles of 94°C for 40 s, 50°C for 1 min, and 72°C for 30 s, and a final extension at 72°C for 2 min. PCR products were visualized on a 1.5% agarose gel to check the amplification success.
In the second PCR, the Illumina tailed amplicons (N = 96) were dual indexed, using NextEra XT Index 1 and 2 primers and NextEra XT Index v2 Sets A and D (FC-131–2001 and FC-131–2004) in a reduced-cycle PCR (10 cycles) according to the manufacturer’s protocol. The indexed PCR for the samples contained the same mixture as the first PCR, excluding BF2 and BR2 primers and BSA and using 0.8 µl of each index primer. No purification was performed for the PCRs between the first and second amplification.
Indexed amplicons were pooled by equal volume (5 µl each) into several libraries. The DNA libraries were purified and size-selected (>200 bp fragments retained), using SPRIselect (Beckman Coulter) with a ratio of 0.92. Libraries were quantified using Qubit™ dsDNA HS Assay Kit (Thermo Fisher), following the manufacturer’s protocol. The libraries were loaded at a 14 pM concentration with 6% PhiX added. Sequencings were performed on MiSeq v3 flow cells, sequencing paired end 2 × 300 bp and index 8 + 8 bp at the Genomics Core Facility, University Hospital St. Olavs, Trondheim, Norway. The resulting raw reads are deposited in ENA SRA with accession number PRJEB49099.
Raw sequencing data were converted to fastq format using bcl2fastq v2.20 (https://support.illumina.com/sequencing/sequencing_software/bcl2fastq-conversion-software.html). Primers were removed from both the 5′ and 3’ ends of the forward and reverse reads, allowing up to 15% mismatch across the length of the primer, using cutadapt v1.9.1 (Martin, 2011). Quality trimming of the reads was carried out in DADA2 1.14 (Callahan et al., 2016), excluding reads with >2 expected error rate and >0 ambiguous bases. The reads were truncated if a base had a phred score 2 or smaller and after 220–260 bases adjusted based on the quality profiles of the sequencing runs. The error model was trained using the function “learnErrors” and used for sample inference of dereplicated reads using the function “dada”. Paired reads were merged using the function “mergePairs”. Only 420–422 bases long reads were selected, and peDNA libraries were combined into a table that was chimera checked on a per-sample basis. If an amplicon sequence variant (ASV) was flagged as chimeric in more than 90% of the samples in which it occurred, it was removed. Taxonomic affiliations of the generated ASVs were identified, using RDP classifier v 2.12 (Wang et al., 2007) with a trained reference database (Porter and Hajibabaei 2018), which had been modified to fit the Norwegian fauna. ASVs were given taxonomic affiliation if assignment probability was 0.8 or higher for family, genus or species level. Metazoan ASVs were selected, and the taxonomic affiliations were cross-checked against BOLD v.4 (Ratnasingham and Hebert, 2007) and list of Norwegian species. If assignments were incongruent, BOLD affiliation and Norwegian species were used. A two-step abundance threshold was used to minimize the effect of tag-jumps: 1) based on read abundance of metazoan ASVs in negative controls, all ASVs <4 reads/sample were removed; and 2) all ASVs with less than 0.01% of total reads/sample were removed. Finally, the peDNA PCR replicates were merged to peDNA samples, number of reads was normalized to 36,534 reads/sample, and species list was narrowed to include animals that have freshwater stage.
Bray-Curtis dissimilarity values were calculated based on Hellinger transformed data, using R-package vegan 2.5.6 (Oksanen et al., 2019) in R 3.6.3 (R Core Team, 2020). The Bray-Curtis dissimilarity values were compared within different units of comparisons taking into account the sampling design: the values were calculated for pairs of biological replicates taken from the same stations, for pairs of stations within a lake, and for pairs of lakes. The values were calculated both for samples taken at the same time and at different times. To test the effect of rotenone treatment, three linear mixed effect models were fitted to both the morphological and peDNA data, using R package lme4 1.1.26 (Bates et al., 2015). The first two models were constructed with the number of taxa and number of specimens or sequence reads as a dependent variable, rotenone treatment, time and their interaction as fixed variables and the lakes as a random variable. The third model was constructed with the Bray-Curtis dissimilarity values as a dependent variable, rotenone treatment, time and their interaction as fixed variables and the units of comparison as a random variable.
Additionally, we compared community composition before and after the rotenone treatment in both treated and control lakes and estimated with peDNA and morphological identification using non-metric multidimensional scaling (NMDS) (Buttigieg and Ramette, 2014) using the R package vegan 2.5.6 (Oksanen et al., 2019).
The three Illumina MiSeq sequencing libraries included 12.1, 12.6 and 13.3 million raw reads, and after all quality filtering, 1.3, 1.4 and 1.3 million target reads remained, respectively. Morphological identification of samples yielded a median of 13 and an interquartile range (IQR) of 10 taxa per sample and 408 (IQR = 1,011) specimens per sample. The number of taxa identified by metabarcoding of the peDNA samples was higher with a median of 19 (IQR = 13) taxa per sample than in morphologically identified samples.
A comparison of the two identification methods showed a total of 333 taxa detected by metabarcoding of peDNA, 90 taxa based on morphology with 28 taxa shared by both methods (Figure 2, Supplementary material). Metabarcoding of peDNA failed to detect 55 of the taxa identified by morphology. However, a relatively high proportion of the taxa names were given above the species level (29% based on peDNA and 43% based on morphology). In some cases, one of the methods determined a taxon above the species level and the other method determined it to the species level within the same taxon group. If this is considered as an overlap, the two methods had 40 taxa in common. When taxa were grouped by order and the class Gastropoda, more taxa were generally detected by metabarcoding of peDNA. For Hirudinea, Coleoptera, Hemiptera and Odonata, morphological identification produced the highest numbers of taxa (Figure 2). For Gastropoda, six taxa were detected by both methods. Diptera was the most taxon-rich, mainly consisting of non-biting midges (Chironomidae). In this family 103 taxa were detected by metabarcoding of peDNA, while only family level identification was done by morphology. The most taxon rich orders recorded by morphology were Coleoptera and Trichoptera, each with 16 taxa; the corresponding number of taxa recorded by identification with metabarcoding of peDNA in these orders were 8 and 24. A complete list of identified taxa with the number of reads from metabarcoding and the number of specimens identified by morphology is given in the Supplementary material.
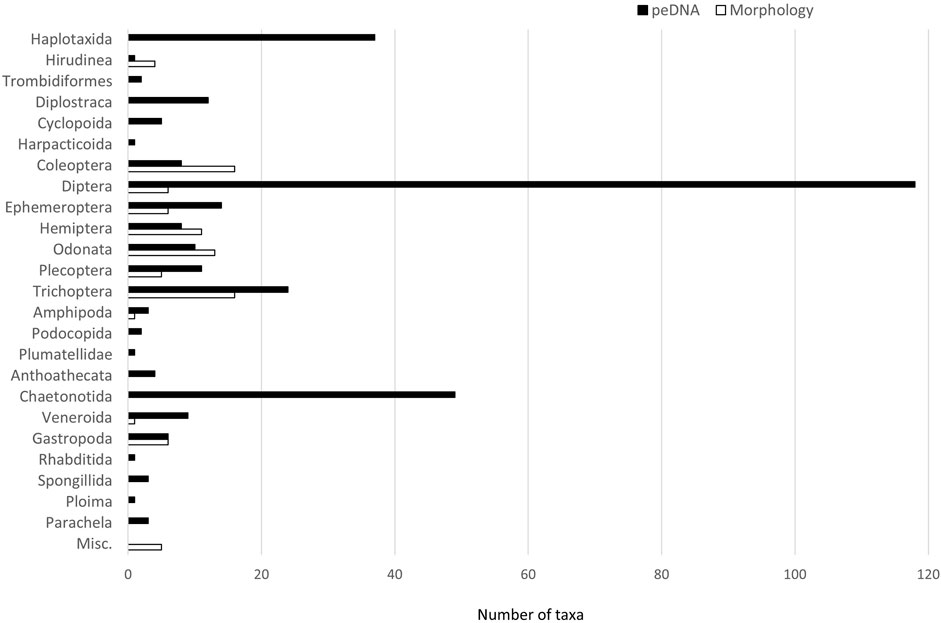
FIGURE 2. Number of taxa by orders (and class Gastropoda) identified by metabarcoding of peDNA and morphology. Misc. = taxa determined only by morphology above the order level (Ostracoda, Oligochaeta, Nematoda, Hydrozoa and Hydrachnidia).
There was a significant temporal trend in the number of taxa identified morphologically. The number of taxa dropped immediately after the treatment both in the rotenone treated and the control lakes. This decline in number of observed taxa was similar in both the treated and control lakes, and no treatment effects were found (Table 2). The number of taxa identified by morphology increased again 1 year later for both treated and control lakes (Figure 3A).
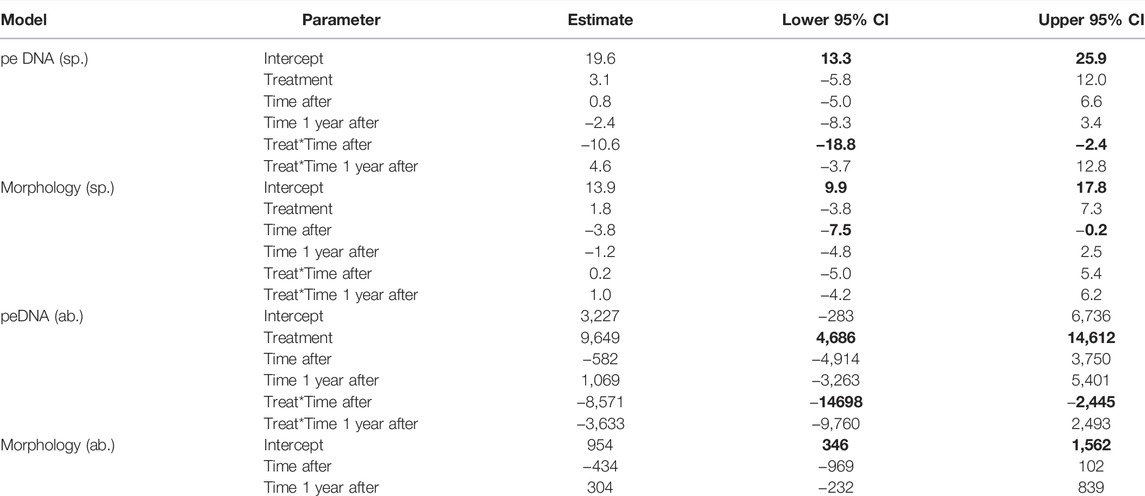
TABLE 2. Fixed effects of linear mixed effects models of morphological and peDNA samples. Time after = 2 weeks after the rotenone treatment, Time 1 year after = 1 year after the rotenone treatment. The number of taxa (sp.) and abundance (ab.) determined with either morphological or peDNA based methodology were dependent variables. Rotenone treatment and time and the interaction between treatment and time were fixed variables; lakes were random variables in all models. The abundance models with rotenone treatment became singular fit, and therefore, only time was a fixed variable. Lower and upper confidence limits (95% CI) for statistically significant covariates (i.e., not overlapping zero) are highlighted in bold.
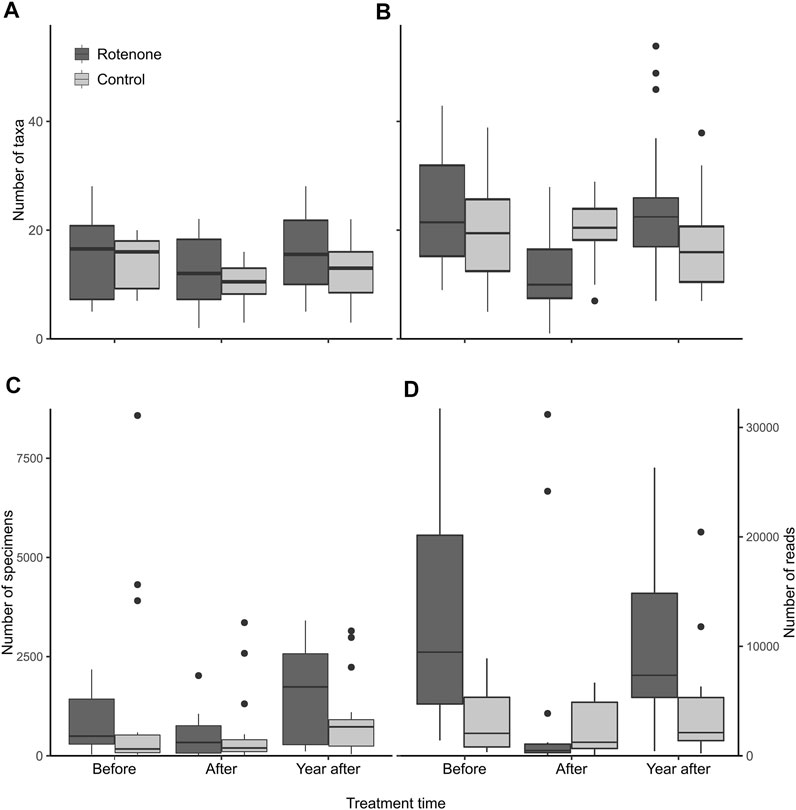
FIGURE 3. The number of taxa in the rotenone treated and control lake samples based on morphological identification (A), identification using DNA metabarcoding of peDNA (B), the number of specimens based on morphological identification (C) and the number of reads using DNA metabarcoding of peDNA (D). The sample size for each category is 18. The horizontal line in each box represents the median, the boxes depict the 1st to the 3rd quartile and the blind end of the whiskers represent the maximum and minimum values, except outliers which are marked with dots.
For the peDNA-based identification, there was a decline in the number of taxa detected in the samples taken immediately after the treatment compared to the samples taken immediately before the treatment in the rotenone treated lakes. However, there was no comparable decline in the control lakes in the same time period. A significant interaction effect was present between rotenone treatment and time on the number of taxa (Table 2, 95-% confidence interval did not include zero). The number of recorded taxa using peDNA based identification did increase the year after compared to the situation just after the treatment, but only for the treated lakes (Figure 3B).
For peDNA, we used the number of sequence reads as an experimental proxy for abundance. The rotenone treated lakes had a drop both in the number of specimens and the number of reads just after the treatment (Figures 3C,D, respectively) and for the number of reads this drop was significant (Table 2). For the control lakes there were only minor changes in the same period. One year after the treatment the number of reads in the treated lake rose, but only to about half of the amount before the treatment, whereas the number of specimens were more than doubled compared to pre-treatment amounts. For the control lakes there was an increase in the number of specimens after the treatment, but only minor changes in the number or reads (Figures 3C,D, respectively).
There was a discrepancy between the experimental abundance proxy based on peDNA and actual abundance of individual taxa. Ephemeroptera had the most reads, constituting 42% of the total of approximately 4 mill reads, whereas the number of specimens constituted only 4% of the total of approximately 100,000. Within Ephemeroptera, Cloeon inscriptum and Leptophlebia vespertina were the dominating species for the metabarcoding-based identification, while Leptophlebiidae and Caenis horaria dominated the morphology-based identification. All these taxa, except for C. horaria showed a marked decrease in reads and specimens immediately after the rotenone treatment in the treated lakes, but not in the control lakes. This was also the case for Plecoptera and Trichoptera. Diptera was the most abundant order with 74% of the specimens. Thirteen percent of the reads belonged to this order. Nearly all specimens and reads of Diptera belonged to the family Chironomidae where the number of reads and specimens dropped immediately after the treatment in both treated and control lakes (Supplementary material).
For most of the taxa, both the number of reads and number of morphologically determined specimens decreased immediately after the treatment. In some taxa, the number of reads increased. This was the case for some of the chironomids, one Sphaeriidae (Pisdium sp 1) which increased from 6 to approximately 300,000 reads and for tardigrades, the latter group only detected after the treatment (Supplementary material).
Community compositions were more congruent when identified by morphology compared to identification by peDNA based metabarcoding (Figure 4). Using non-metric multidimensional scaling (NMDS), the distance to the group centroid was significantly smaller in morphology than in peDNA (permutation test with 999 permutations, p < 0.001). The NMDS plots did not reveal any clear grouping of the samples by time (before, after, 1 year after the treatment). However, there was a tendency that both methods showed the most diverging samples in the treated lakes just after the treatment (triangles).
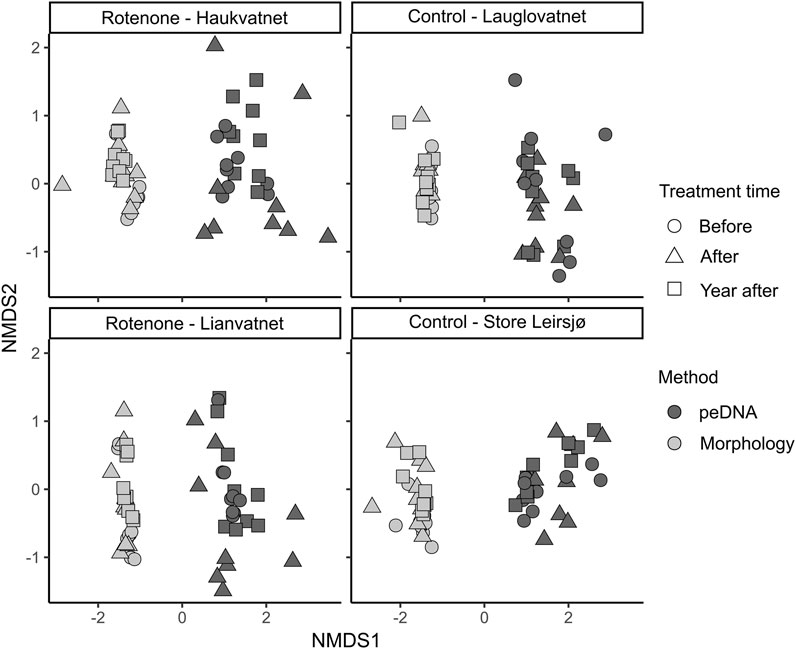
FIGURE 4. NMDS plot of the same samples identified by morphology or metabarcoding of peDNA just before, just after and 1 year after the rotenone treatment (Stress = 0.09). Treated lakes are in the left panels and control lakes in the right panels.
Bray-Curtis dissimilarity values were generally higher when identifications were based on metabarcoding of peDNA than morphological based identifications (Figure 5). Furthermore, except for samples within stations at the same time, the Bray-Curtis dissimilarity was always higher for the rotenone treated lakes compared to the control lakes for both methods. The linear mixed effect models indicated an effect of the interaction between time and treatment for both peDNA and morphology (Table 3, 95-% confidence interval did not include zero).
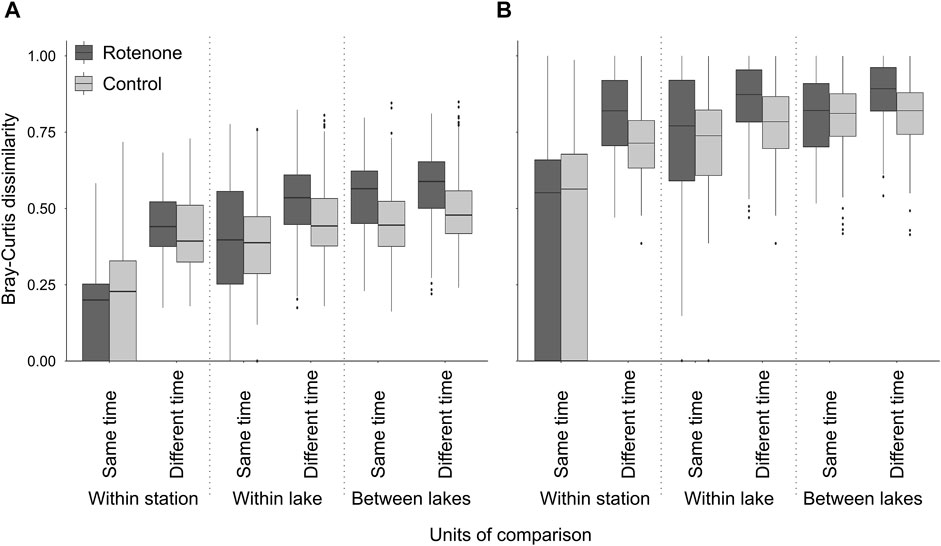
FIGURE 5. Pairwise Bray-Curtis dissimilarity values of rotenone treated lakes and control lakes. For morphological identifications (A). For identifications based on metabarcoding of peDNA (B). The horizontal line in each box represents the median, the boxes depict the 1st to the 3rd quartile and the blind end of the whiskers represent the maximum and minimum values, except outliers which are marked with dots. The stippled line differentiates the units of comparisons (within stations, within lakes and between lakes).
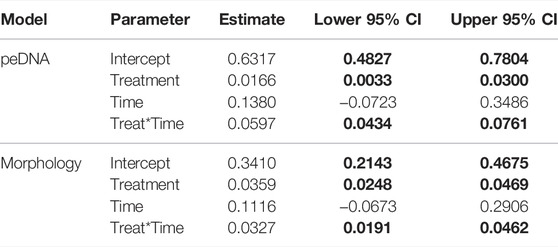
TABLE 3. Fixed effects of linear mixed effects models of morphological and peDNA samples. Bray-Curtis dissimilarity values were dependent variables while the rotenone treatment and time and their interaction were fixed variables. Lower and upper confidence limits (95% CI) for statistically significant covariates (i.e., not overlapping zero) are highlighted in bold.
We observed a change in relative abundances of invertebrates over time, both among taxon groups and between the two identification methods (Figure 6). Ephemeroptera showed a decrease immediately after the rotenone treatment for both identification methods, but more so for morphology. The recovery of this order to pre-treatment levels 1 year after the treatment was evident in the peDNA data of both treated lakes, but only for one of them in the morphological data. The relative abundance of Diptera seems to be the same or higher in the treated lakes 1 year after treatment compared to the two former sampling events for both methods. Metabarcoding of peDNA indicated a huge negative impact of the treatment on Diplostraca, a group not identified by morphology, both immediately after and 1 year after the treatment.
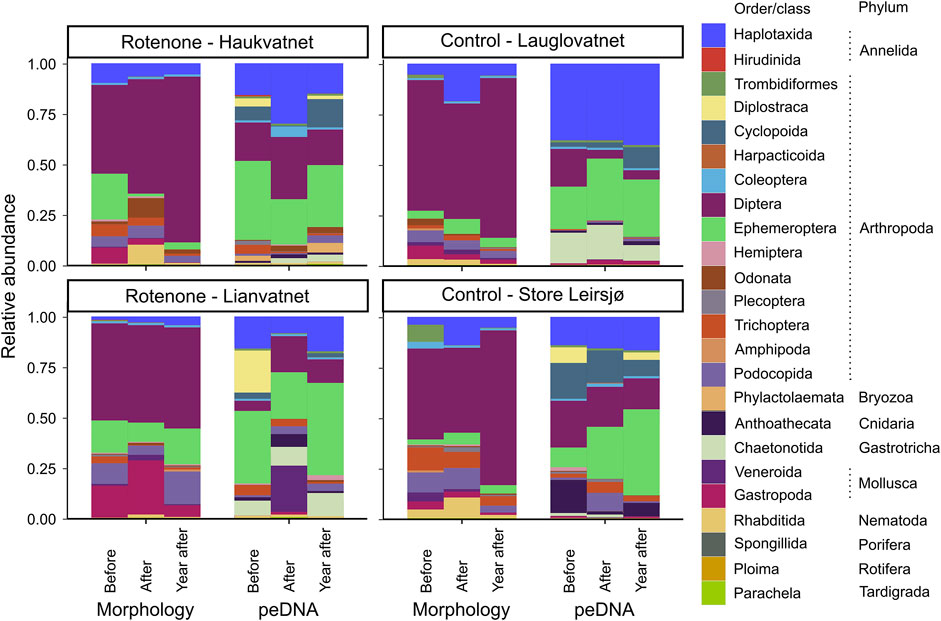
FIGURE 6. Relative abundances of invertebrates grouped by orders/classes and phylum just before, just after and 1 year after the rotenone treatment for identification based on morphology and on metabarcoding of peDNA. Treated lakes are in the left panels and control lakes in the right panels.
We show that rotenone treatment had significant impacts on the invertebrate community. The increase in Bray-Curtis dissimilarity over time was higher for the rotenone-treated lakes than for the control lakes. Additionally, the community composition of the treated lakes tended to be more similar just before and 1 year after the treatment and to diverge more immediately after the treatment.
We observed a significant effect of the rotenone treatment when considering the number of taxa identified by metabarcoding of DNA from preservative ethanol (peDNA). For peDNA from treated lakes, the number of taxa decreased just after the treatment followed by an increase in the samples taken 1 year after. This indicates both an initial negative effect of the treatment, but also a subsequent recolonization. There was a similar pattern for the number of taxa determined by morphology. However, this was visible both in treated and control lakes, indicating that it was not the rotenone treatment, but rather natural variation in the occurrence of the identified taxa or variation in identification that caused the change.
Conclusions from other studies on the effects of rotenone treatment on invertebrates are contradictory. The recorded negative effects range from minor (Dudgeon, 1990; Melaas et al., 2001; Blakely et al., 2005) to major (Binns, 1967; Hamilton et al., 2009) and the observed recovery time following rotenone treatments vary from one to several years (Mangum and Madrigal, 1999; Pham et al., 2018). Vinson et al. (2010) listed several factors likely to influence impacts and recovery of invertebrate assemblages following rotenone treatment: rotenone concentration, temporal and spatial scope of the treatment, morphology and life history characteristics of the affected invertebrates, the presence of refugia and distances from untreated colonization sources. In addition, and as demonstrated by the current study, the ability to detect taxa may have a huge impact on the results.
The two methods for identification differed in their ability to detect taxa, especially at the species-level. While morphological identification is dependent on taxonomic knowledge, adequate taxonomic keys and the ability to identify small individuals or early life stages, DNA metabarcoding needs high quality reference libraries and suffers from primer bias and the absence of abundance data (e.g., Weigand et al., 2019; Liu et al., 2020). Nevertheless; DNA metabarcoding of eDNA or peDNA of bulk samples, has the potential to drastically reduce the limitations of morphology-based identification in being more objective and allow for species-level identification of all taxonomic groups and life stages. They will also help reduce several impediments or shortfalls of biodiversity (Cardoso et al., 2011; Hortal et al., 2015), especially for the high number of undescribed species (the Linnean shortfall), the poorly known distribution and abundance of species (the Wallacean and Prestonina shortfalls, respectively) and the largely unknown species way of life and their sensitivity to habitat change (the Hutchinsonian shortfall). These methods, together with image-based automated species identification methods (Høye et al., 2021) will substantially improve the quality of future arthropod inventory and monitoring. However, such methods, including DNA-based methods are still in need of development and 55 taxa identified by morphology in our study were not recorded in the peDNA based metabarcoding. We note, however, that this number, as well as the total number of taxa, probably is too high since the morphological method in several cases have determined different taxonomic levels within the same order, e.g., Zygoptera, Coenagrionidae, Coenagrion, Coenagrion hastulatum, C. johanssoni. Specimens identified to the three taxa above the species-level could potentially belong to either or both of the species registered, but for various reasons they could not be identified to species-level. This was not the case for the peDNA-based method since all taxa were genetically separated at the species-level.
Important sources of biases in DNA metabarcoding are related to the process of DNA extraction and PCR amplification, cross-contamination during the amplicon library preparation, as well as issues with downstream bioinformatic analyses (Liu et al., 2020). High quality and complete reference libraries are crucial for reliable identifications (Ekrem et al., 2007; Weigand et al., 2019; Rimet et al., 2021) as is a better understanding of the origin, state, transport, and fate of DNA in the environment (Barnes and Turner, 2016; Harrison et al., 2019). For instance, the amphipod Gammarus pulex, a species never registered in Norway, was detected by metabarcoding of peDNA in our study, while morphological identification only registered the common G. lacustris, also after a quality check of all specimens. A presence of G. pulex in Norway is possible since it occurs in Sweden close to the Norwegian border, but it is more likely that there is an error in the reference library used as the two species are separable by correctly identified COI sequences.
There is also a need to better clarify the relationships between the number of DNA reads with the biomass and abundance of invertebrate species (Elbrecht et al., 2017; Liu et al., 2020). Quantifying species abundance with DNA metabarcoding is still in its infancy, and direct comparison of the total number of reads with the total number of specimens is often inappropriate. As an example, the small bivalve determined as Pisidum sp 1 by DNA metabarcoding in our study, the number of reads rose from six just before the treatment to approximately 300,000 just after treatment. Even if the number of specimens of bivalves (Sphaeriidae) increased immediately after the treatment, the number of reads for Pisidium sp. 1 is clearly not reflecting a real increase in abundance. The reason for this outcome is not clear, but an increase of Pisidium DNA due to breakage of shells in the bulk sample followed by release into the preservative ethanol is a possibility. On the other hand, for both the total number of reads and total number of specimens, there was a decrease immediately after the rotenone treatment, and an increase 1 year after the treatment, indicating that there is some relationship between the number of reads and abundance. The general decrease in abundance/reads is likely to be a result of the rotenone treatment and the subsequent increase a result of recolonization in the absence of predatory fish.
The two methods for identification resulted in lists with little overlap in the identified taxa. Of the 333 taxa detected by metabarcoding of peDNA and 90 by morphology, only 28 taxa were registered by both methods. The overlap is higher (40 taxa) when considering taxa within the same group to be equal if determined to different taxonomic levels. This could be the case when specimens are determined to genus-level for one method and species-level within the same genus for the other method. Despite the relatively low taxonomic overlap, the Bray-Curtis dissimilarity of both methods showed an effect of the treatment. The results suggest that more sensitive taxa were detected by metabarcoding of peDNA than by morphology. A few taxa found by metabarcoding of peDNAonly are known to be rotenone sensitive like the Chironomidae Chironomus, Tanytarsus, Orthocladius and Synendodentipes dispar (Koksvik and Aagaard, 1984; Fjellheim, 2004), and the aquatic annelids in Tubificidae (Mangum and Madrigal, 1999). Among these taxa only S. dispar was detected before but not after the treatment in the treated lakes, but present both before and after the treatment in the control lakes. The absence of taxa just after the treatment could also be due to low number of reads making taxa detection more difficult. No clear rotenone effects, even at the species-level, could be seen for Chironomus or the tubificids. For most of the taxa found by metabarcoding of peDNA, rotenone tolerance is unknown. A few of the species showed a clear reduction in the number of reads in the treated lakes, but not in the control lakes, possible due to low rotenone tolerance. This was the case for the oligochaete Limnodrilus hoffmeisteri and the non-biting midges Cricotopus pilitarsis and Tanytarsus inaequalis. Most taxa registered by morphology are known to be rotenone tolerant, but Ephemeroptera, Plecoptera and Trichoptera are generally known to be rotenone sensitive (Dudgeon, 1990; Mangum & Madrigal, 1999). This is in accordance with our results where all these groups showed a reduction in the number of reads and specimens in the treated lakes, whereas the control lakes showed a smaller decrease or an increase in the same period. Species rich groups like non-biting midges and aquatic annelids were only determined to Chironomidae and Oligochaeta, respectively using morphology and gastrotrichs were not registered at all. As indicated by the results from metabarcoding peDNA, these species rich groups could potentially contain sensitive taxa missed by morphological identification. Studies that rely on a coarse taxonomic resolution may fail to detect responses on the species or OTU level to stressors (Macher et al., 2016; Beermann et al., 2018) and since many biomonitoring programs are based on higher-level taxonomic identification (e.g., genus and family), anthropogenic impacts may be overlooked (Beermann et al., 2018).
The high number of taxa detected by metabarcoding of peDNA compared to morphology came as no surprise as morphological determination to lower taxonomic level was not possible for many groups. Additionally, some groups with multiple species, like Diplostraca, were not attempted to be determined by morphology at all. Diptera was the most taxon rich order with 118 taxa detected by metabarcoding of peDNA, including 103 taxa of the family Chironomidae. Even though Diptera constituted 74% of the total number of specimens, only six taxa were identified by morphology, all above the species-level. The number of taxa identified by metabarcoding of peDNA may have been overestimated since the DNA in the ethanol can originate from sources other than the specimens of the bulk samples. This is a well-known issue for eDNA water samples where DNA may originate from upstream areas (Deiner et al., 2016; Taberlet et al., 2018). Generally, eDNA from water will be more useful for detection of biodiversity on a broader scale compared to DNA from preservative ethanol which is more suited for detection of local diversity (Wang et al., 2021). Nevertheless, metabarcoding of peDNA identified several species that are lotic and likely originate from lake tributaries: the mayflies Baetis rhodani, B. muticus and Ephemerella aurivillii, the caddisflies Rhyacophila fasciata and Ecclisopteryx dalecarlica and the chironomid Rheotanytarsus pentapoda. Although hard to control, DNA also from lentic taxa not present in the study lakes may have been transferred by streams and registered in the preservative ethanol. Persaud et al. (2021) speculated that DNA from preservative ethanol can originate from sediment substrate and aquatic plants associated with the sampling. This may be the case for our study as both sediment and plant remains were present in the samples. DNA from other taxa than those sampled or present at the sampling site could attach to sediments, plants or even the sampled invertebrates and be released into the preservative.
For several groups like Coleoptera, Hemiptera, Hirudinea and Odonata, more taxa were detected by morphology than by metabarcoding of peDNA, and for Gastropoda the number of taxa were the same for the two methods. This might be due to the fact that animals with a hard outer surface (either chitin or CaCO3) and/or small body size release less DNA into the preservative ethanol compared to larger and more soft bodied specimens (Zizka et al., 2019; Derycke et al., 2021). In our study, Diptera, which were mostly small bodied Chironomidae larvae, constituted only 13% of the total number of reads but 74% of the total number of specimens, while the larger-bodied Ephemeroptera accounted for 42% of the reads but only 4% of the specimens. For Hemiptera, Hirudinea and Odonata there must be other reasons than small body size or a hard outer exoskeleton for the comparatively low number of taxa detected using metabarcoding of peDNA compared to morphology. It could simply be related to the overestimation of taxa by the morphological method as discussed earlier, or to biomass. We did not measure biomass, but due to very few specimens for most taxa within these orders in our samples, their total biomass and DNA concentration also is low and taxa with low abundance/biomass in bulk samples may go undetected by ethanol-based DNA taxa identification (Hajibabaei et al., 2012). A possible solution to improve detection of poorly represented taxa could be to extract a higher volume of ethanol (Martins et al., 2019; Zizka et al., 2019) or extract DNA through lysis of specimen tissue in the bulk samples. The latter approach could potentially also remove false positives from molecular identification.
This study has shown that the rotenone treatment had a significant impact on the community composition of invertebrates, in terms of Bray-Curtis dissimilarity, detected both by morphology and metabarcoding of peDNA. However, the number of taxa detected by metabarcoding of peDNA indicated a negative impact of the treatment and a subsequent increase 1 year after treatment, whereas this was not recorded using morphological identification. This discrepancy may be due to the higher taxonomic resolution offered by metabarcoding of species rich groups that cannot easily be identified by morphology, similar to the observations made by Sun et al. (2019) for road-water treatment ponds. The outcome of similar studies will depend on which taxa are detected and their response to stressors. Our study highlights the ability of DNA-based identification methods to detect more taxa than morphological methods, and therefore provide a higher potential to register impact of stressors. However, since metabarcoding of the preservative ethanol missed several of the taxa detected by morphological identification and detected taxa that probably were absent from the sampling sites, it still needs refinement and calibration before replacing, morphological-based identification in monitoring of freshwater invertebrate community responses to rotenone treatment.
The resulting raw reads deposited in ENA SRA with accession number PRJEB49099.
GK, TE, and MM conceived the initial ideas. MF-A and LT led the lab work. MM led the data analyses and GK the writing. All authors contributed to the writing and final version of the text as submitted here.
This work received funding from the Norwegian Environment Agency and Trondheim Municipality.
The authors declare that the research was conducted in the absence of any commercial or financial relationships that could be construed as a potential conflict of interest.
All claims expressed in this article are solely those of the authors and do not necessarily represent those of their affiliated organizations, or those of the publisher, the editors and the reviewers. Any product that may be evaluated in this article, or claim that may be made by its manufacturer, is not guaranteed or endorsed by the publisher.
Thanks to Marc Daverdin, NTNU University Museum, for making the map of the study area. We would also like to thank the Norwegian Environment Agency for financial support to conduct the eDNA and peDNA analysis, and the Trondheim Municipality for financial support, collecting permits and access to roads normally closed to the public.
The Supplementary Material for this article can be found online at: https://www.frontiersin.org/articles/10.3389/fenvs.2022.872739/full#supplementary-material
Alida Zizka, V. M., Leese, F., Peinert, B., and Geiger, M. F. (2019). DNA Metabarcoding from Sample Fixative as a Quick and Voucher Preserving Biodiversity Assessment Method. Genome 62. doi:10.1101/287276
Arnekleiv, J. V., Dolmen, D., Aagaard, K., Bongard, T., and Hanssen, O. (1997). Rotenonbehandlingens Effekt På Bunndyr I Rauma Og Hensvassdraget, Møre & Romsdal. Del I: Kvalitative Undersøkelser. Vitenskapsmuseet Rapp. Zool. Ser., 1997–1998.
Bardal, H., Sandodden, R., Moen, A., and Nøst, T. H. (2018). Bekjempelse Av Mort I Sju Vatn I Bymarka, Trondheim Kommune, I 2016. – Veterinærinstituttets Rapportserie 8-2018.
Barnes, M. A., and Turner, C. R. (2016). The Ecology of Environmental DNA and Implications for Conservation Genetics. Conserv. Genet. 17, 1–17. doi:10.1007/s10592-015-0775-4
Bates, D., Mächler, M., Bolker, B., and Walker, S. (2015). Fitting Linear Mixed-Effects Models Usinglme4. J. Stat. Soft. 67, 1–48. doi:10.18637/jss.v067.i01
Beal, D. L., and Anderson, R. V. (1993). Response of Zooplankton to Rotenone in a Small Pond. Bull. Environ. Contam. Toxicol. 51, 551–556. doi:10.1007/BF00192171
Beermann, A. J., Zizka, V. M. A., Elbrecht, V., Baranov, V., and Leese, F. (2018). DNA Metabarcoding Reveals the Complex and Hidden Responses of Chironomids to Multiple Stressors. Env. Sci. Eur. 30, 26. doi:10.1186/s12302-018-0157-x
Binns, N. A. (1967). Effects of Rotenone Treatment on the Fauna of the Green River, Wyoming. Fish. Res. Bull. 1, 1–114.
Blakely, T. J., Chadderton, L., and Harding, J. S. (2005). The Effect of Rotenone on Orchard-Pond Invertebrate Communities in the Motueka Area, South Island, New Zealand. DOC Res. Dev. Ser. 220, 1–26.
IPBES (2019). in Global Assessmet Report of the Intergovernmental Science-Policy Platform on Biodiversity and Ecosystem Services. Editors E. S. Brondízio, J. Settele, S. Díaz, and T. H. Ngo (Bonn, Germany: IPBES secretariat), 1144.
Buttigieg, P. L., and Ramette, A. (2014). A Guide to Statistical Analysis in Microbial Ecology: a Community-Focused, Living Review of Multivariate Data Analyses. FEMS Microbiol. Ecol. 90, 543–550. doi:10.111/1574-6941.12437
Callahan, B. J., McMurdie, P. J., Rosen, M. J., Han, A. W., Johnson, A. J. A., and Holmes, S. P. (2016). DADA2: High-Resolution Sample Inference from Illumina Amplicon Data. Nat. Methods 13, 581–583. doi:10.1038/nmeth.3869
Cardoso, P., Erwin, T. L., Borges, P. A. V., and New, T. R. (2011). The Seven Impediments in Invertebrate Conservation and How to Overcome Them. Biol. Conserv. 144, 2647–2655. doi:10.1016/j.biocon.2011.07.024
Chang, J. (2020). Monitoring Biodiversity and Water Pollution via High-Throughput eDNA Metabarcoding. Berkel. Sci. J. 24 (2). doi:10.5070/BS3242049349
Dalu, T., Wasserman, R. J., Jordaan, M., Froneman, W. P., and Weyl, O. L. F. (2015). An Assessment of the Effect of Rotenone on Selected Non-target Aquatic Fauna. PloS ONE 10, e0142140. doi:10.1371/journal.pone.0142140
Deiner, K., Fronhofer, E. A., Mächler, E., Walser, J.-C., and Altermatt, F. (2016). Environmental DNA Reveals that Rivers Are Conveyer Belts of Biodiversity Information. Nat. Commun. 7, 12544. doi:10.1038/ncomms12544
Derycke, S., Maes, S., Van den Bulcke, L., Vanhollebeke, J., Wittoeck, J., Hillewaert, H., et al. (2021). Detection of Macrobenthos Species with Metabarcoding Is Consistent in Bulk DNA but Dependent on Body Size and Sclerotization in eDNA from the Ethanol Preservative. Front. Mar. Sci. 8, 637858. doi:10.3389/fmars.2021.637858
Dolmen, D. (1992). Dammer I Kulturlandskapet - Makroinvertebrater, Fisk Og Amfibier I 31 Dammer I Østfold. NINA Forskningsrapport 20.
Dudgeon, D., Arthington, A. H., Gessner, M. O., Kawabata, Z.-I., Knowler, D. J., Lévêque, C., et al. (2006). Freshwater Biodiversity: Importance, Threats, Status and Conservation Challenges. Biol. Rev. 81, 163–182. doi:10.1017/S1464793105006950
Dudgeon, D. (1990). Benthic Community Structure and the Effect of Rotenone Piscicide on Invertebrate Drift and Standing Stocks in Two Papua New Guinea Streams. Archiv Hydrobiologie 119, 35–53. doi:10.1127/archiv-hydrobiol/119/1990/35
Ekrem, T., Willassen, E., and Stur, E. (2007). A Comprehensive DNA Sequence Library Is Essential for Identification with DNA Barcodes. Mol. Phylogenetics Evol. 43, 530–542. doi:10.1016/j.ympev.2006.11.021
Elbrecht, V., and Leese, F. (2017). Validation and Development of COI Metabarcoding Primers for Freshwater Macroinvertebrate Bioassessment. Front. Environ. Sci. 5. doi:10.3389/fenvs.2017.00011
Elbrecht, V., Peinert, B., and Leese, F. (2017). Sorting Things Out: Assessing Effects of Unequal Specimen Biomass on DNA Metabarcoding. Ecol. Evol. 7, 6918–6926. doi:10.1002/ece3.3192
Engblom, E. (1996). “Ephemeroptera, Mayflies,”. Editor A. Nilsson (Stenstrup: Apollo Books), Vol. 1, 13–53.Aquatic insects North Eur. A taxonomic Handb.
Engstrom-Heg, R., Colesante, R. T., and Silco, E. (1978). Rotenone Tolerances of Stream-Bottom Insects. N. Y. Fish. Game J. 25, 31–41.
Fjellheim, A. (2004). Effekt av rotenonbehandling på bunndyrsamfunnene i et område ved Stigstu, Hardangervidda Laboratoriet for ferskvannsøkologi og innlandsfiske. Univ. i Bergen. Rapp. 122, 1–37.
Gladsø, J. A., and Raddum, G. G. (2002). Rotenone Treatment of a West Norwegian River: Effects on Drift of Invertebrates. SIL Proc. 1922-2010 28, 764–769. doi:10.1080/03680770.2001.11901816
Gleason, J. E., Elbrecht, V., Braukmann, T. W. A., Hanner, R. H., and Cottenie, K. (2020). Assessment of Stream Macroinvertebrate Communities with eDNA Is Not Congruent with Tissue‐based Metabarcoding. Mol. Ecol. 30, 3239–3251. doi:10.1111/mec.15597
Glöer, P. (2002). Süsswassergastropoden Nord- und Mitteleuropas. Bestimmungsschlussel, Lebenweise, Verbreitung. Hackenheim: ConchBooks.
Hajibabaei, M., Spall, J. L., Shokralla, S., and van Konynenburg, S. (2012). Assessing Biodiversity of a Freshwater Benthic Macroinvertebrate Community through Non-destructive Environmental Barcoding of DNA from Preservative Ethanol. BMC Ecol. 12, 28. doi:10.1186/1472-6785-12-28
Hamilton, B. T., Moore, S. E., Williams, T. B., Darby, N., and Vinson, M. R. (2009). Comparative Effects of Rotenone and Antimycin on Macroinvertebrate Diversity in Two Streams in Great Basin National Park, Nevada. North Am. J. Fish. Manag. 29, 1620–1635. doi:10.1577/M08-178.1
Harrison, J. B., Sunday, J. M., and Rogers, S. M. (2019). Predicting the Fate of eDNA in the Environment and Implications for Studying Biodiversity. Proc. R. Soc. B 286, 20191409. doi:10.1098/rspb.2019.1409
Holcombe, G. W., Phipps, G. L., Sulaiman, A. H., and Hoffman, A. D. (1987). Simultaneous Multiple Species Testing: Acute Toxicity of 13 Chemicals to 12 Diverse Freshwater Amphibian, Fish, and Invertebrate Families. Arch. Environ. Contam. Toxicol. 16, 697–710. doi:10.1007/BF01055420
Hortal, J., de Bello, F., Diniz-Filho, J. A. F., Lewinsohn, T. M., Lobo, J. M., and Ladle, R. J. (2015). Seven Shortfalls that Beset Large-Scale Knowledge of Biodiversity. Annu. Rev. Ecol. Evol. Syst. 46, 523–549. doi:10.1146/annurev-ecolsys-112414-054400
Høye, T. T., Ärje, J., Bjerge, K., Hansen, O. L. P., Iosifidis, A., Leese, F., Mann, H. M. R., Meissner, K., Melvad, C., and Raitoharju, J. (2021). Deep Learning and Computer Vision Will Transform Entomology. Proc. Natl. Acad. Sci. U.S.A. 118 (2). doi:10.1073/pnas.2002545117
Jansson, A. (1996). “Hetroptera Nepomorpha Aquatic Bugs,” in The Aquatic Insects of North Europe. Editors A. Nilsson (Stenstrup: Apollo Books), 91–104.
Kjærstad, G., and Arnekleiv, J. V. (2011). Effects of Rotenone Treatment on Lotic Invertebrates. Int. Rev. Hydrobiology 96, 58–71. doi:10.1002/iroh.201111261
Koksvik, J. I., and Aagaard, K. (1984). Effects of Rotenone Treatment on the Benthic Fauna of a Small Eutrophic Lake. SIL Proc. 1922-2010 22, 658–665. doi:10.1080/03680770.1983.11897361
Lillehammer, A. (1988). Stoneflies (Plecoptera) of Fennoscandia and Denmark, 21. Leiden, The Netherlands: Brill/Scandinavian Science Press Ltd.
Ling, N. (2003). Rotenone - Review of its Toxicity and Use for Fisheries Management. Sci. conservation 211.
Liu, M., Clarke, L. J., Baker, S. C., Jordan, G. J., and Burridge, C. P. (2020). A Practical Guide to DNA Metabarcoding for Entomological Ecologists. Ecol. Entomol. 45, 373–385. doi:10.1111/een.12831
Macher, J.-N., Vivancos, A., Piggott, J. J., Centeno, F. C., Matthaei, C. D., and Leese, F. (2018). Comparison of Environmental DNA and Bulk-Sample Metabarcoding Using Highly Degenerate Cytochrome C Oxidase I Primers. Mol. Ecol. Resour. 18, 1456–1468. doi:10.1111/1755-0998.12940
Macher, J. N., Salis, R. K., Blakemore, K. S., Tollrian, R., Matthaei, C. D., and Leese, F. (2016). Multiple-stressor Effects on Stream Invertebrates: DNA Barcoding Reveals Contrasting Responses of Cryptic Mayfly Species. Ecol. Indic. 61, 159–169. doi:10.1016/j.ecolind.2015.08.024
Majaneva, M., Diserud, O. H., Eagle, S. H. C., Boström, E., Hajibabaei, M., and Ekrem, T. (2018). Environmental DNA Filtration Techniques Affect Recovered Biodiversity. Sci. Rep. 8, 4682. doi:10.1038/s41598-018-23052-8
Mangum, F. A., and Madrigal, J. L. (1999). Rotenone Effects on Aquatic Macroinvertebrates of the Strawberry River, Utah: A Five-Year Summary. J. Freshw. Ecol. 14, 125–135. doi:10.1080/02705060.1999.9663661
Martin, M. (2011). Cutadapt Removes Adapter Sequences from High-Throughput Sequencing Reads. EMBnet J. 17, 10–12. doi:10.14806/ej.17.1.200
Martins, F. M. S., Galhardo, M., Filipe, A. F., Teixeira, A., Pinheiro, P., Paupério, J., et al. (2019). Have the Cake and Eat it: Optimizing Nondestructive DNA Metabarcoding of Macroinvertebrate Samples for Freshwater Biomonitoring. Mol. Ecol. Resour. 19, 863–876. doi:10.1111/1755-0998.13012
Melaas, C. L., Zimmer, K. D., Butler, M. G., and Hanson, M. A. (2001). Effects of Rotenone on Aquatic Invertebrate Communities in Prairie Wetlands. Hydrobiol 459, 177–186. doi:10.1023/A:1012514124430
Nilsson, A. N., and Holmen, M. (1995). The Aquatic Adephaga (Coleoptera) of Fennoscandia and Denmark, Volume II. Dytiscidea. Leiden: Brill.
Norling, U., and Sahlén, G. (1997). “Odonata, Dragonflies and Damselflies,”. Editor A. Nilsson (Stenstrup: Apollo Books), 2, 13–65.aquatic insects North Eur.
Oksanen, J., Blanchet, F. M., Friendly, M., Kindt, R., Legendre, P., McGlinn, D., et al. (2019). Vegan: Community Ecology Package. R Package Version 2.5-6. Available at: https://CRAN.R-project.org/package=vegan.
Persaud, S. F., Cottenie, K., and Gleason, J. E. (20212021). Ethanol eDNA Reveals Unique Community Composition of Aquatic Macroinvertebrates Compared to Bulk Tissue Metabarcoding in a Biomonitoring Sampling Scheme. Diversity 13, 34. doi:10.3390/d13010034
Pham, L., Jarvis, M. G., West, D., and Closs, G. P. (2018). Rotenone Treatment Has a Short-Term Effect on New Zealand Stream Macroinvertebrate Communities. N. Z. J. Mar. Freshw. Res. 52, 42–54. doi:10.1080/00288330.2017.1330273
Porter, T. M., and Hajibabaei, M. (2018). Automated High Throughput Animal CO1 Metabarcode Classification. Sci. Rep. 8, 4226. doi:10.1038/s41598-018-22505-4
Pyšek, P., Hulme, P. E., Simberloff, D., Bacher, S., Blackburn, T. M., Carlton, J. T., et al. (2020). Scientists' Warning on Invasive Alien Species. Biol. Rev. 95, 1511–1534. doi:10.1111/brv.12627
R Core Team, (2020). R: A Language and Environment for Statistical Computing. Vienna, Austria: R Foundation for Statistical Computing. Available at: https://www.R-project.org/.
Ratnasingham, S., and Hebert, P. D. N. (2007). BARCODING: Bold: The Barcode of Life Data System. Available at: http://www.barcodinglife.org 7, 355–364. doi:10.1111/j.1471-8286.2007.01678.x
Reid, A. J., Carlson, A. K., Creed, I. F., Eliason, E. J., Gell, P. A., Johnson, P. T. J., et al. (2018). Emerging Threats and Persistent Conservation Challenges for Freshwater Biodiversity. Biol. Rev. 94, 849–873. doi:10.1111/brv.12480
Rimet, F., Aylagas, E., Borja, Á., Bouchez, A., Canino, A., Chauvin, C., et al. (2021). Metadata Standards and Practical Guidelines for Specimen and DNA Curation when Building Barcode Reference Libraries for Aquatic Life. Mbmg 5, 17–33. doi:10.3897/mbmg.5.58056
Rinne, A., and Wiberg-Larsen, P. (2017). Trichoptera Larvae of Finland: Identification Key to the Caddis Larvae of Finland and Nearby Countries. Tampere: Trificon books.
Shokralla, S., Singer, G. A. C., and Hajibabaei, M. (2010). Direct PCR Amplification and Sequencing of Specimens' DNA from Preservative Ethanol. BioTechniques 48, 305–306. doi:10.2144/000113362
Sun, Z., Majaneva, M., Sokolova, E., Rauch, S., Meland, S., and Ekrem, T. (2019). DNA Metabarcoding Adds Valuable Information for Management of Biodiversity in Roadside Stormwater Ponds. Ecol. Evol. 9, 9712–9722. doi:10.1002/ece3.5503
Taberlet, P., Bonin, A., Zinger, L., and Coissac, E. (2018). Environmental DNA: For Biodiversity Research and Monitoring. Oxford University Press. doi:10.1093/oso/9780198767220.001.0001Environmental DNA
Tickner, D., Opperman, J. J., Abell, R., Acreman, M., Arthington, A. H., Bunn, S. E., et al. (2020). Bending the Curve of Global Freshwater Biodiversity Loss: An Emergency Recovery Plan. BioSc 70, 330–342. doi:10.1093/biosci/biaa002
Vinson, M. R., Dinger, E. C., and Vinson, D. K. (2010). Piscicides and Invertebrates: After 70 years, Does Anyone Really Know? Fisheries 35, 61–71. doi:10.1577/1548-8446-35.2.61
Wang, Q., Garrity, G. M., Tiedje, J. M., and Cole, J. R. (2007). Naïve Bayesian Classifier for Rapid Assignment of rRNA Sequences into the New Bacterial Taxonomy. Appl. Environ. Microbiol. 73, 5261–5267. doi:10.1128/AEM.00062-07
Wang, Y., Chen, K., Gao, J., Wang, M., Dong, J., Xie, Y., et al. (2021). Environmental DNA of Preservative Ethanol Performed Better Than Water Samples in Detecting Macroinvertebrate Diversity Using Metabarcoding. Divers. Distributions 27, 1989–2002. doi:10.1111/ddi.13284
Keywords: benthic invertebrates, rotenone, beta diversity, lakes, invasive species
Citation: Kjærstad G, Majaneva M, Falahati-Anbaran M, Topstad L, Finstad AG, Arnekleiv JV and Ekrem T (2022) DNA Metabarcoding of Preservative Ethanol Reveals Changes in Invertebrate Community Composition Following Rotenone Treatment. Front. Environ. Sci. 10:872739. doi: 10.3389/fenvs.2022.872739
Received: 09 February 2022; Accepted: 16 May 2022;
Published: 01 June 2022.
Edited by:
Albert Chakona, South African Institute for Aquatic Biodiversity, South AfricaReviewed by:
Paulo AV Borges, University of the Azores, PortugalCopyright © 2022 Kjærstad, Majaneva, Falahati-Anbaran, Topstad, Finstad, Arnekleiv and Ekrem. This is an open-access article distributed under the terms of the Creative Commons Attribution License (CC BY). The use, distribution or reproduction in other forums is permitted, provided the original author(s) and the copyright owner(s) are credited and that the original publication in this journal is cited, in accordance with accepted academic practice. No use, distribution or reproduction is permitted which does not comply with these terms.
*Correspondence: Gaute Kjærstad, Z2F1dGUua2phcnN0YWRAbnRudS5ubw==
Disclaimer: All claims expressed in this article are solely those of the authors and do not necessarily represent those of their affiliated organizations, or those of the publisher, the editors and the reviewers. Any product that may be evaluated in this article or claim that may be made by its manufacturer is not guaranteed or endorsed by the publisher.
Research integrity at Frontiers
Learn more about the work of our research integrity team to safeguard the quality of each article we publish.