 Kun Huo
 Yunfeng Ruan
 Haizhou Fan1,2*
95% of researchers rate our articles as excellent or good
Learn more about the work of our research integrity team to safeguard the quality of each article we publish.
Find out more
ORIGINAL RESEARCH article
Front. Environ. Sci. , 10 November 2022
Sec. Land Use Dynamics
Volume 10 - 2022 | https://doi.org/10.3389/fenvs.2022.871482
Comprehending the change characteristics and controlling factors of regional cultivated land resources is one of the important preconditions for their healthy development. The main objective of this study is to analyze the spatial–temporal variation characteristics of cultivated land and controlling factors in the Yangtze River Delta region. Thus, the mathematical–statistical, land use dynamic degree model, principal component analysis, and geographically weighted regression model were used to analyze the change in cultivated land area and social–economic factors in the Yangtze River Delta region from 2009 to 2018. The results showed that the cultivated land area and per capita cultivated land area had a decreasing trend from 2009 to 2018, decreasing by 8.5 × 10⁴ ha and 0.0039 ha, respectively. From the perspective of spatial patterns, the rapidly decreasing areas of cultivated land were mainly distributed in the southeast, while the slowly decreasing areas of cultivated land were becoming concentrated in the northwest, and the slowly increasing areas presented as scattered distribution, which was also the same spatial distribution for the per capita cultivated land area in the Yangtze River Delta region. Among these factors, population (POP) and the total power of agricultural mechanization (TPAM) had a positive spatial correlation with cultivated land. The gross domestic product (GDP) had a negative spatial correlation with cultivated land, which revealed that cultivated land was intensely affected by human activities. Moreover, the spatial distribution and influence degree of the controlling factors differed in regions. Our research is expected to reveal the relationship between economic development and cultivated land protection for providing references for strengthening regional cultivated land management, maintaining the healthy development of regional resources, and rational utilization of cultivated land.
Cultivated land is the most precious natural resource of mankind. It is also an important material basis for maintaining social order and stability, ensuring ecology and food security, and promoting urban–rural coordination (Li X. L. et al., 2021). The economic construction of China has made great progress since the implementation of the reform and opening-up policy, but the rapid progress of urbanization and continuous growth of population have brought great pressure to the existing cultivated land, as well as the contradiction between the supply and demand of cultivated land is increasing (Fu and Liu, 2013). Therefore, protecting cultivated land resources and coordinating their relationship with economic development have become an important task in China. The Yangtze River Delta region is the largest economic zone and a fast-growing urban agglomeration in China. However, due to the high degree of economic agglomeration and population density in this region, human activities have the strongest impact on the transformation of land resources, which has caused a series of environmental problems such as disorderly expansion of construction land, high-quality farmland becoming eroded, and the rapid deterioration of the ecological environment.
Most scholars have not studied single cultivated land but land use from different perspectives within a certain time series for the whole or central urban agglomeration of the Yangtze River Delta region (Shi et al., 2019; Wang H. Y. et al., 2021; Yang et al., 2021; Zhao et al., 2021). For example, some scholars have focused on the relationship between the ecological environment and land use change in the Yangtze River Delta region (Shi et al., 2019; Wang W. J. et al., 2021; Yang et al., 2021). Zhao et al. (2021) used the TOPSIS analysis method to quantitatively evaluate the land use benefits of 26 prefecture-level cities in the Yangtze River Delta region. Song and Chen (2021) have established the Super-EBM model to evaluate the eco-efficiency of land use in the Yangtze River Delta region from 2005 to 2016. However, some scholars have studied land use in a specific area of the Yangtze River Delta region. Chen and Yu (2019) explored the driving mechanism of land use changes in Jiangsu, Zhejiang, and Shanghai from 1985 to 2015. Wang et al. (2020) used the kernel density method to analyze the evolution of land use patterns in the Yangtze River Delta Coastal Zone from 1980 to 2018.
Although research on cultivated land has been strengthened, the focus has mainly been on the small scale research of the Yangtze River Delta region, where the functions of the cultivated land, the degree of intensive utilization, ecological security, and other attributes for the provincial, municipal, or county level have been studied (Zhao et al., 2021; Yin et al., 2020; Dong and Zhao, 2019; Xing et al., 2019; Cao, 2018; Chen and Wu, 2018; Zhao et al., 2019; Cai et al., 2020). Some studies have quantitatively revealed the multifunctional trade-offs and synergy of cultivated land in Zhejiang, Jiangsu, and Shanghai (Dong and Zhao, 2019; Yin et al., 2020; Zhao et al., 2021). Xing et al. (2019) studied the driving factors of the intensive utilization level of cultivated land from the provincial perspective. Cao (2018) suggested a significant relationship of coupling and coordination between the intensive utilization of cultivated land and the development of new urbanization. Chen and Wu (2018) evaluated the efficiency of cultivated land use in the Anhui province. Additionally, some research studies were concerned about cultivated land ecological security; Zhao et al. (2019) assessed the ecological security level of cultivated land and analyzed its temporal and spatial evolution patterns at the provincial level. Cai et al. (2020) focused on the landscape ecological security of cultivated land and explored its temporal and spatial variations and controlling factors at the city level.
At present, research studies on land use in the Yangtze River Delta region mostly discuss the variations of all land types, while targeted discussion of cultivated land is relatively less. Meanwhile, most research studies have focused on the functions, utilization, ecology, and other attributes of cultivated land at a smaller scale and still lack comprehensive analysis of the spatial–temporal variations of the characteristics of cultivated land and controlling factors in the Yangtze River Delta region.
The principal component analysis (PCA) provides the most important and meaningful variables that reduce the dimension of some related variables while maintaining maximum variability in data (Voukantsis et al., 2011). This technique has been applied to study the driving factors, which include groundwater pollution (Salim et al., 2019; Zhang et al., 2020; Lee et al., 2021), the quality of land (Akinyemi and Speranza, 2021; Pessoa et al., 2022), the quality of air (Halim et al., 2020), and the development of urban land (Wang et al., 2021). Additionally, the geographically weighted regression (GWR) model was considered as a powerful tool to study spatial variation (Kashki et al., 2021; Zhang et al., 2021; Jiang et al., 2022). Compared with the traditional multiple linear regression, the GWR model has been proven to be a more effective method (Zhu et al., 2020a; Permai et al., 2021). Thus, we identified the primary factors on cultivated land variations using PCA first, and then established the GWR model by the primary factors for spatial variation analysis, which was beneficial in minimizing the uncertainty of model simulation.
Therefore, we mainly focused on the research contents of two aspects in this study. The first is the research scale. We took the whole region of the Yangtze River Delta as the research object and explored the change characteristics of cultivated land comprehensively in order to avoid one-sidedness of research results from the micro perspective. The second is the differences in the spatial effects of the influencing factors. The traditional multiple linear regression could not reflect the spatial nonstationarity between variables, which results from the change of geographical location. Based on establishing the GWR model, the spatial nonstationarity of major socioeconomic factors on cultivated land area can be effectively analyzed for reaching more comprehensive conclusions (Brunsdon et al., 1996; Wang et al., 2017).
Consequently, we attempted to analyze the change in cultivated land and identify its controlling factors in the Yangtze River Delta region from 2009 to 2018 by using the mathematical–statistical, land use dynamic degree model, principal component analysis, and geographically weighted regression model. Since the drivers of cultivated land change are closely related to social–economic development, this study aims to explore how the spatial relationships between social–economic factors and cultivated land change in order to reveal the differences in the spatial effects of the influencing factors and provide a theoretical basis for not only the establishment of a new development paradigm between ecology and economy but also the formulation of protection policies to adjust to local conditions in the Yangtze River Delta region.
The Yangtze River Delta region is located in the middle and lower reaches of the Yangtze River in China, bordering the East China Sea and the Yellow Sea, with a total area of 35.8 × 10⁴ km2 and abundant inland water systems (Figure 1). The overall terrain of the Yangtze River Delta region has a stair-like trend of decreasing from the southwest to northeast, with plains in the northern and central regions, whereas the hilly terrain is mainly distributed in the southwest region. The plain area accounts for 54.58% of the total area, and the main hilly area is located in the south region of Zhejiang and the west and south regions of Anhui in the Yangtze River Delta region. The main crops are paddy and wheat in the Yangtze River Delta region, which is mostly distributed in the northern plains (Wang M. M. et al., 2020). More than 50% of the total area is subtropical evergreen broad-leaved forest in the hilly area of the south region of Zhejiang. Besides, this area has a subtropical monsoon climate, with four distinct seasons and sufficient rainfall. The mean maximum temperature in summer can reach up to 28.3°C, while the mean minimum temperature in winter is 5.5°C and the mean annual rainfall exceeds 1,300 mm (Kong et al., 2021). The sufficient rainfall makes the Yangtze River Delta region have plentiful lakes and abundant water resources. Because of large areas of plains and suitable climatic conditions, the Yangtze River Delta region has extensive cultivated land areas and provides good geographical conditions for research.
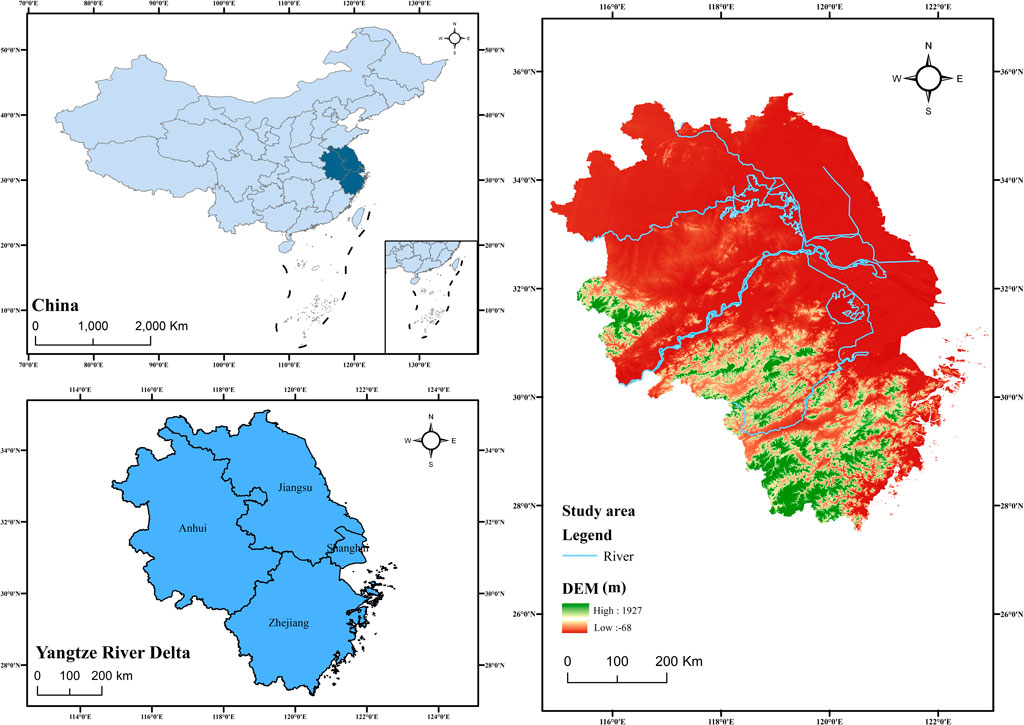
FIGURE 1. Location and topographic layout of the study area.
The data used in this study mainly include basic geographic, cultivated land, and socioeconomic data. The basic geographic data include administrative division data of China and the digital elevation model. The administrative division data include the vector map of China’s provinces and cities in 2021. The digital elevation data were mainly obtained from the Resource and Environmental Science and Data Center of the Chinese Academy of Sciences (http://www.resdc.cn/, accessed on 11 October 2021). The cultivated land data were obtained from the official website of the Natural Resources Department. The socioeconomic data were mainly obtained from the Statistical Yearbook and the National Economic and Social Development Statistical Bulletin, which include Shanghai, Zhejiang, Jiangsu, and Anhui provinces from 2009 to 2018.
The core part of this study is to use the PCA to identify the main controlling factors on cultivated land variations and use the GWR model to explore how these factors contribute to cultivated land variations. Figure 2 shows an overview of the workflow.
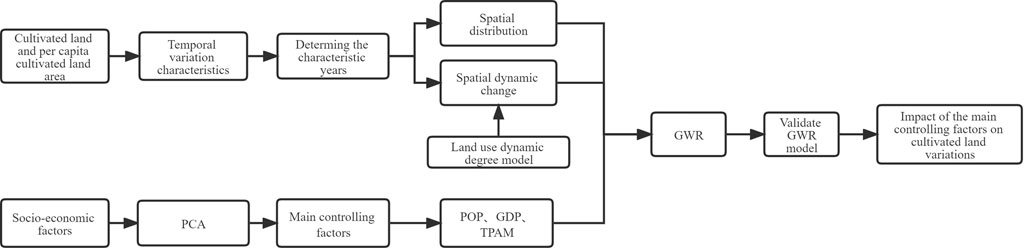
FIGURE 2. Research flowchart.
The quantitative change of land use types can be represented by a single land use dynamics model. Therefore, the model can be used to quantitatively analyze the change rate of cultivated land in the the Yangtze River Delta region The specific formula is as follows:
where Ki is a dynamic degree that represents the change rate of i-type land use. Uia and Uib are the quantities of i-type land use in the first year and last year of the study period, respectively. Ti is the duration of study time. When Ti was set as years, Ki is the annual change rate of i-type land use in the study area (Wang and Bao, 1999).
Utilizing a single variable to analyze a certain problem may cause one-sided conclusions. However, when considering more variables, there is a problem of colinearity among various factors. Therefore, the basic idea of the principal component analysis (PCA) is to achieve the purpose of dimension reduction while preserving as much original information as possible, simplifying the problem, and grasping its main contradiction (He, 2004). The principle is to make a linear change to the original variables that may have colinearity, and then to transform them into new mutually independent variables and rank them according to their variances. The new variable with the larger variance contains more original information, which will be recognized as the more significant variable. According to the variance value, we will find the first principal component, the second principal component, and the third principal component, etc. (Li and Zhang, 2017). In this study, we used the PCA to explore and identify the main controlling factors on the variations of cultivated land in the Yangtze River Delta region.
Before performing geographically weighted regression analysis, the dependent variable should be tested for spatial autocorrelation because the results of whether the dependent variable has a certain degree of gathering in spatial distribution must be taken into consideration (Li J. H. et al., 2020). Therefore, this study used the Moran’s Ⅰ index to test the spatial correlation of the cultivated land area in the characteristic years. This is calculated as follows:
where Wij is the space weight function calculated by the Gaussian function. Xi and Xj are the values of X on the corresponding spatial units.
Compared with the traditional global regression model that only generates one global regression coefficient, the geographically weighted regression (GWR) model can combine the geographic features with the regression model, reflecting the spatial distribution of regression parameters (Qin et al., 2005). Therefore, the GWR model can clearly show the spatial distribution of the regression coefficients of 41 prefecture-level cities in the Yangtze River Delta region. The specific formula is as follows:
In this equation, the dependent variable is yi. (ui, vi) is the coordinate of the sample point i.
The temporal variation characteristics of the cultivated land from 2009 to 2018 are shown in Table 1 and Figure 3. The cultivated land area shows a fluctuated change in the Yangtze River Delta region, but the overall trend is declining (Table 1 and Figure 3), a total decrease of 8.6 × 10⁴ ha from 2009 to 2018, with a mean annual decrease of 0.86 × 10⁴ ha (or 0.68%). Meanwhile, the cultivated land area of the three provinces and one city decreased to different degrees from 2009 to 2018, with the maximum decrease (3.9 × 10⁴ ha) occurring in Jiangsu, whereas the cultivated land of Shanghai, Zhejiang, and Anhui decreased by 1.2 × 10⁴ ha, 1.3 × 10⁴ ha, and 2.1 × 10⁴ ha, respectively (Table 1).
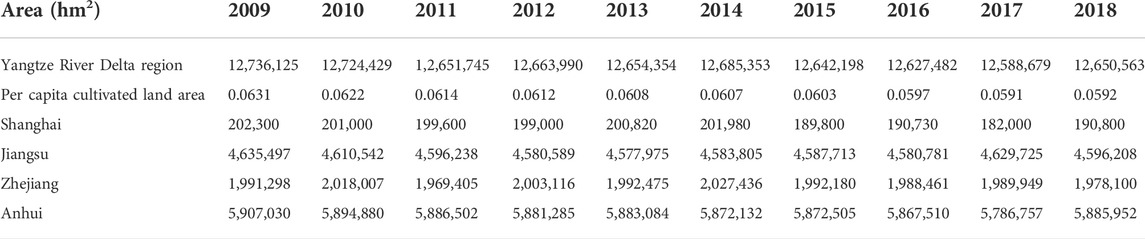
TABLE 1. Cultivated land area in the Yangtze River Delta from 2009 to 2018.
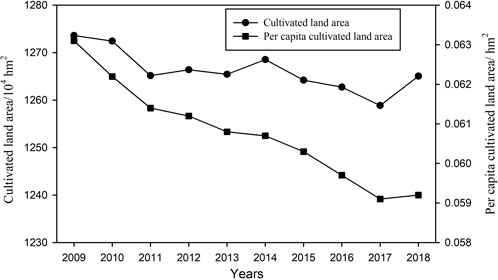
FIGURE 3. Change trend of total cultivated land area and per capita cultivated land area in Yangtze River Delta region.
Previous studies have shown that the protection policies of cultivated land have matured basically from 2009 to 2013 (Wang Z. et al., 2018). Furthermore, these have become the policy system of cultivated land with more systematization normalization from 2013 to 2018 (Wang W. X. et al., 2020). Thus, we have divided it into two stages for analyzing the change process of cultivated land area in the Yangtze River Delta region. As shown in Figure 3, in the first stage (2009–2013), the cultivated land area has declined by a large margin in the Yangtze River Delta region. Although there was a slight increase in 2011–2012, the overall decline has been relatively rapid. The cultivated land area decreased by 8.2 × 10⁴ ha, with a mean annual decrease of 1.6 × 10⁴ ha. Due to the ecological conversion of farmland in the Yangtze River Delta region and the construction of urban and rural infrastructure, a large amount of cultivated land has been invaded during this period. In addition, the cultivated land policy protection system of China was immature, resulting in the serious loss of cultivated land. In the second stage (2013–2018), the cultivated land area has decreased slightly in the Yangtze River Delta region, but the decline has slowed down when compared to the first stage. The cultivated land area decreased by 0.38 × 10⁴ ha, with a mean annual reduction of 0.063 × 10⁴ ha. The decline of cultivated land area was effectively inhibited due to the national and local governments put forward new requirements for the protection of cultivated land.
Due to the rapid population growth and the continuous decrease of cultivated land, the change of per capita cultivated land area showed a speedy downward trend from 2009 to 2018 in the Yangtze River Delta region. The per capita cultivated land area fell from 0.0631 ha in 2009 to 0.0592 ha in 2018, which is lower than the national per capita cultivated land area of 0.097 ha. Therefore, the man–land relationship in the Yangtze River Delta region is apprehensive, causing a more serious situation of cultivated land protection.
Based on the aforementioned results, we analyzed the spatial distribution of cultivated land and per capita cultivated land area in the selected three characteristic years. As shown in Figure 4, the cultivated land area and per capita cultivated land area distributed more in the north and less in the south of the Yangtze River Delta region. First, the northern part of the Yangtze River Delta region is the main grain-producing area in the middle and lower reaches of the Yangtze River. Meanwhile, the prefecture-level cities with cultivated land above 40 × 104 ha and per capita cultivated land area above 0.05 ha were mainly concentrated in this area. Second, due to the rapid development of urbanization in the central and southern regions of the Yangtze River Delta region, most of the cultivated land area of prefecture-level cities in this region were below 20 × 104 ha. Furthermore, the per capita cultivated area of these cities were also below 0.05 ha. This indicates that the increase in population is causing great pressure on the cultivated land in the central and southern regions.
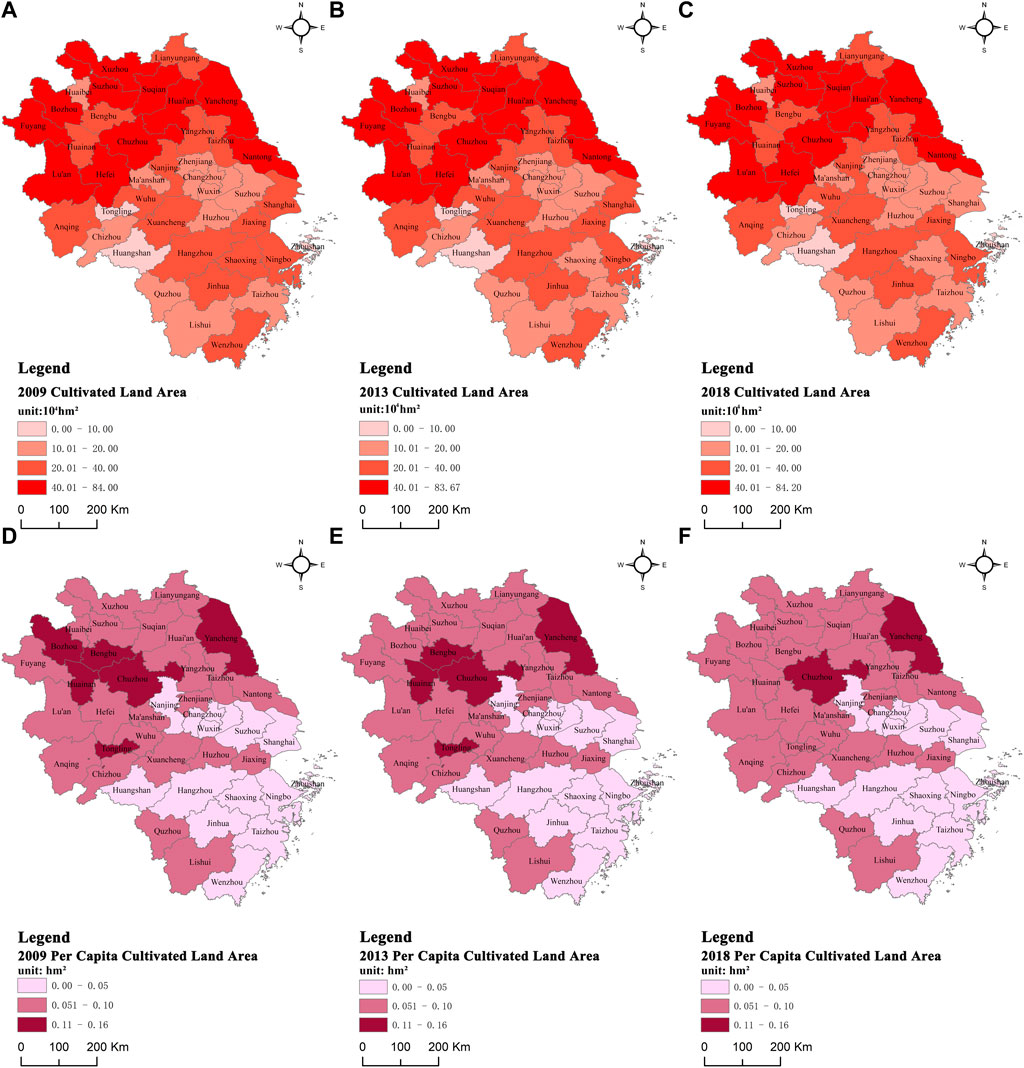
FIGURE 4. Spatial distribution of cultivated land area and per capita cultivated land area in 2009, 2013, and 2018. (A–C) represent cultivated land area in 2009, 2013, and 2018, respectively. (D–F) represent per capita cultivated land area in 2009, 2013, and 2018, respectively.
Through the comparative analysis of the spatial distribution of cultivated land and per capita cultivated land area in various stages and the overall time series, it can be found that there were obvious spatial variation characteristics in them (Figure 5). The cultivated land decreased by 8.2 × 10⁴ ha from 2009 to 2013 in the Yangtze River Delta region (Figure 5A). Of all the cities, 32 cities showed a decreasing trend in cultivated land area, with a total decrease of 1.2 × 10⁵ ha. Furthermore, Suzhou and Nantong of Jiangsu province and Ma’anshan of Anhui province decreased by more than 1.0 × 10⁴ ha of cultivated land area. However, nine cities showed an increasing trend in cultivated land area, which was presented as a scattered distribution in the Yangtze River Delta region, with a total increase of 4.3 × 10⁴ ha. Moreover, only Wuhu City, located in southern Anhui, increased more than 1.0 × 10⁴ ha of cultivated land area, while the increase of cultivated land of the remaining eight prefecture-level cities did not exceeded 1.0 × 10⁴ ha. Compared with the cultivated land change in 2009–2013, the per capita cultivated land area also showed a decreasing trend, with a total decrease of 0.063 ha (Figure 5D). First of all, 35 cities exceeded 0.001 ha, with a total decrease of 0.066 ha. Among these, the reduction of more than 0.002 ha of the per capita cultivated area mostly concentrated in the northern part of the Yangtze River Delta region. Suzhou and Ma’anshan whose cultivated land decreased by more than 1.0 × 10⁴ ha also belong to this area. Only six cities showed that the per capita cultivated land area increased over 0.0001 ha, with a total increase of 0.003 ha. Meanwhile, Wuhu had the largest per capita cultivated land area of 0.0009 ha.
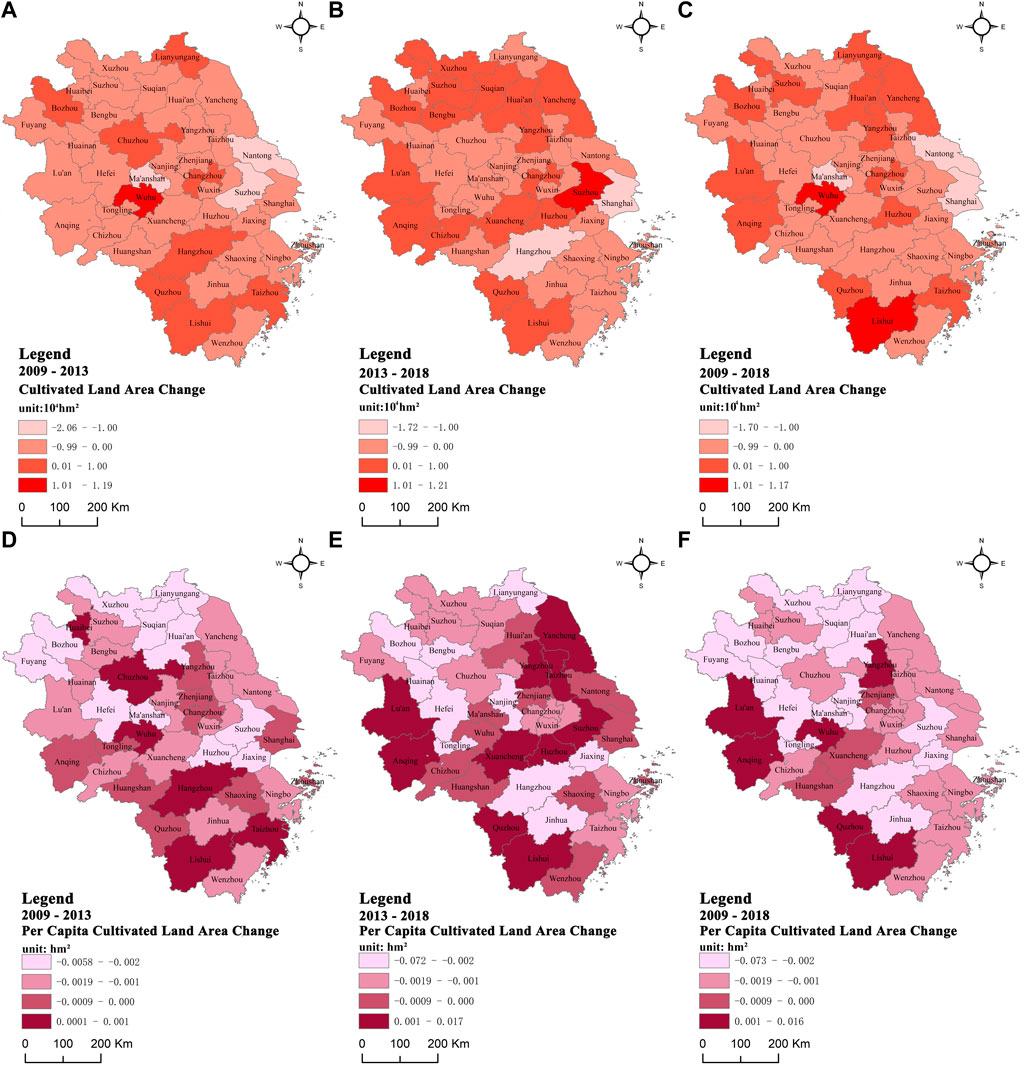
FIGURE 5. Changes in cultivated land area and per capita cultivated land area in different periods. (A-C) represent cultivated land area change in 2009-2013, 2013-2018, and 2009-2018, respectively. (D-F) represent per capita cultivated land area change in 2009-2013, 2013-2018, and 2009-2018, respectively.
During the time period 2013–2018, the cultivated land in the Yangtze River Delta region decreased by 0.4 × 10⁴ ha, showing less decrease than during the time period 2009–2013 (Figure 5B). Of all the cities, 24 cities showed a decreasing trend in cultivated land area, with a total decrease of 6.4 × 10⁴ ha, while the remaining 17 cities had a total increase of 6.0 × 10⁴ ha. Compared with the time period 2009–2013, more cities showed increased cultivated land area and the spatial distribution was different. Furthermore, the distribution of increased area had extended up to the north of Jiangsu and Anhui provinces. However, the decreasing trend of per capita cultivated land area had become stronger than in the first period in the Yangtze River Delta (Figure 5E). Of all cities, the sum of the per capita cultivated land area of 30 cities had reduced by 0.173 ha. Most of these cities are located in the northern region of the Yangtze River Delta region. Only 10 cities showed an increasing trend of per capita cultivated land area, with a total increase of 0.033 ha. The sum of the decrease was reached 0.14 ha.
During the time period 2009–2018, the cultivated land in the Yangtze River Delta region decreased by 8.6 × 10⁴ ha. Of all the cities, only 14 cities showed an increasing trend, with a total increase of 4.7 × 10⁴ ha (Figure 5C). However, 27 cities had decreased by 1.3 × 10⁵ ha, indicating that the situation of cultivated land resources was not optimistic in the study area. Therefore, exploring the controlling factors on the cultivated land change can effectively coordinate the relationship between cultivated land protection and economic development in order to provide reasonable reference suggestions for the sustainable utilization of cultivated land in the Yangtze River Delta region. As shown in Figure 5F, the relationship between population and cultivated land was very apprehensive in the Yangtze River Delta region. The per capita cultivated land area of most cities had shown a declining trend in 2009–2018, with a total decrease of 0.23 ha. The cities with an increase in per capita cultivated land area presented as a scattered distribution in the study area, with a total increase of 0.027 ha. This indicates that the increased range of the cultivated land area could not adapt to the rapidly increasing population in the Yangtze River Delta region from 2009 to 2018.
The results of the change rate of cultivated land area from 2009 to 2013 have shown a rapid decline in the Yangtze River Delta, with hotspots for reduction occurring in the central and southeast coastal areas (Figure 6A). The dynamic change rate of cultivated land ranged from −2.42% to −0.10%, and the decline of cultivated land was relatively rapid. In the northern part of the Yangtze River Delta region, the cultivated land area was decreased slowly in some agricultural-oriented cities, with a dynamic change rate from −0.09% to 0.00%. However, a few cities had slowly increased cultivated land area, but the increase rate has been slower, below 1%. This indicates that the protection policy of cultivated land was immature, reflecting that the phenomenon of economic development at the expense of cultivated land resources was serious in the Yangtze River Delta region during this period. During the time period 2013–2018, less decline in cultivated land area in the Yangtze River Delta region was seen because of the continuous improvement of the national farmland protection policy, especially for the central and northern cities that rapidly decreased from 2009 to 2013, showing a slower reduction of change rate from 2013 to 2018 (Figure 6B). Moreover, more than 40% of the urban cultivated land area slowly increased, indicating that most cities have gradually realized it is unsustainable to occupy cultivated land for blindly pursuing economic development. During the time period 2009–2018, there were obvious spatial differences in the dynamic rate of cultivated land change in the Yangtze River Delta region (Figure 6C). More than 60% of the cultivated land area has shown a decreasing trend to different degrees, which were mainly distributed in the southern and central regions of Jiangsu and Shanghai. However, the cultivated land has been slowly decreasing in the Anhui province, which includes the northern, central, and southern areas of the Anhui province. More importantly, the slowly increased regions of cultivated land area have shown no spatial aggregation, suggesting that the development situation of cultivated land was not optimistic in the Yangtze River Delta region.
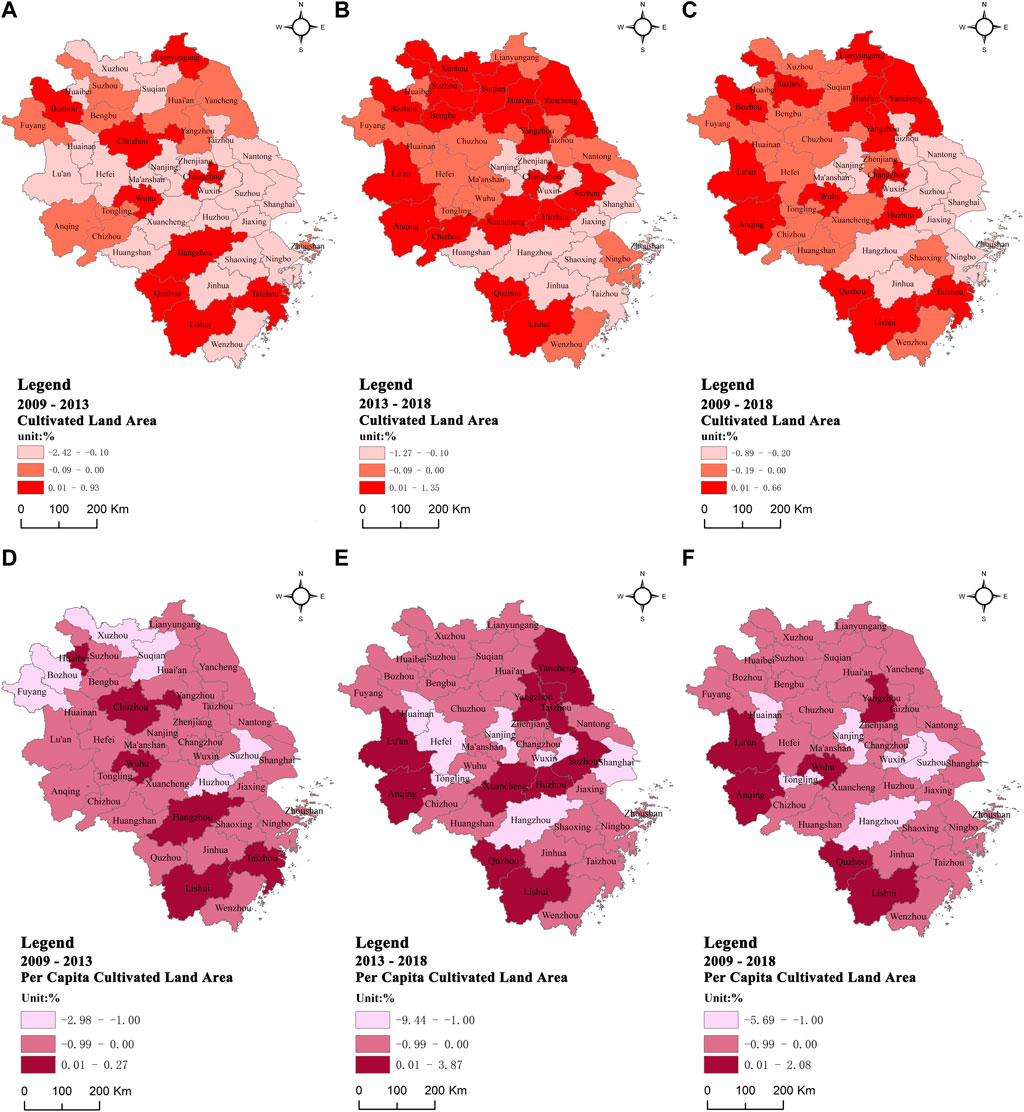
FIGURE 6. Dynamic change rate of cultivated land area and per capita cultivated land area in different periods. (A–C) represent the dynamic change rate of cultivated land area in 2009–2013, 2013–2018, and 2009–2018, respectively. (D–F) represent the dynamic change rate of per capita cultivated land area in 2009-2013, 2013–2018, and 2009–2018, respectively.
The dynamic change rate of the per capita cultivated land area also showed a decreasing trend in different periods (Figures 6D–F). The dynamic change rate of most cities ranged from −0.99 to 0.00. However, a few cities have shown an increased dynamic rate and a spatial distribution that is scattered in the study area. When comparing Figures 6A–C, the cities with a dynamic change rate of over 0.01% belonged to the slowly increasing region of cultivated land. Moreover, the cities with a dynamic change rate below −1% and above 0.01% had the same spatial distribution, and they showed a scattered distribution as well in the Yangtze River Delta region.
This shows that although the reduction of cultivated land had been controlled by the implementation of the protection policy of cultivated land, the rapid increase of population had threatened the carrying capacity of the cultivated land in the Yangtze River Delta region. Therefore, coordinating the relationship between population increase, economic development, and cultivated land reduction should be a critical task in the Yangtze River Delta region.
We used the method of the principal component analysis to quantitatively analyze the controlling factors by taking the cultivated land area as the dependent variable in the Yangtze River Delta region. Based on the development status of the study area, 12 indicators were selected as independent variables (Table 2), which included three aspects, namely, population, economic development, and agricultural technological progress. Meanwhile, there is no strong correlation between the variables if the related coefficient is less than 0.3, suggesting that the group of influencing factors is unsuitable for the principal component analysis (Xue, 2011). As shown in Table 3, except for X7, X10, and X11, there were strong correlations among variables. Therefore, the selected independent variables were suitable for the principal component analysis.
TABLE 2. Influence factors.
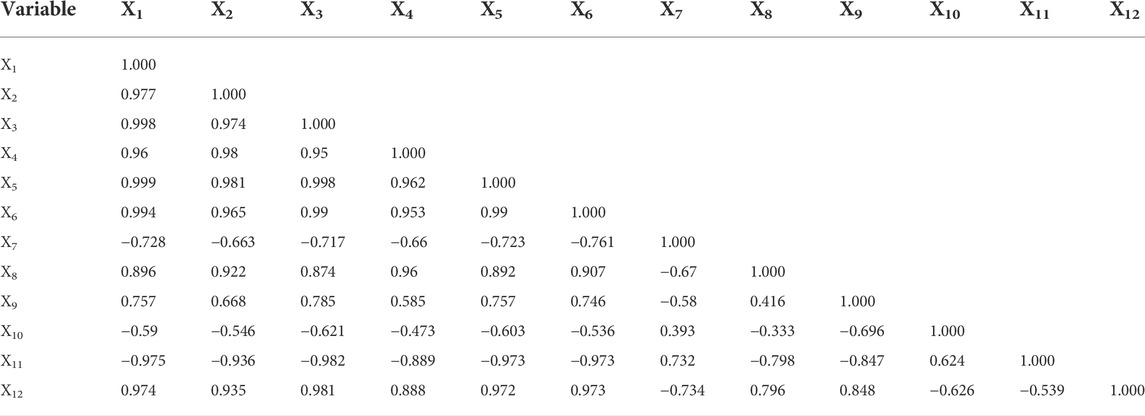
TABLE 3. Correlation matrix.
The common method that confirms the number of principal components is to select the components with a characteristic value greater than 1 and a cumulative contribution rate more than 85% (Lin and Zhang, 2005). As shown in Table 4, the characteristic values of the first and second components were 10.155 and 1.01, respectively. Meanwhile, the cumulative variance contribution rate of the two components had exceeded 85%, showing that these two components contained all the information of the 12 controlling factors. Therefore, the number of principal components was determined as two.
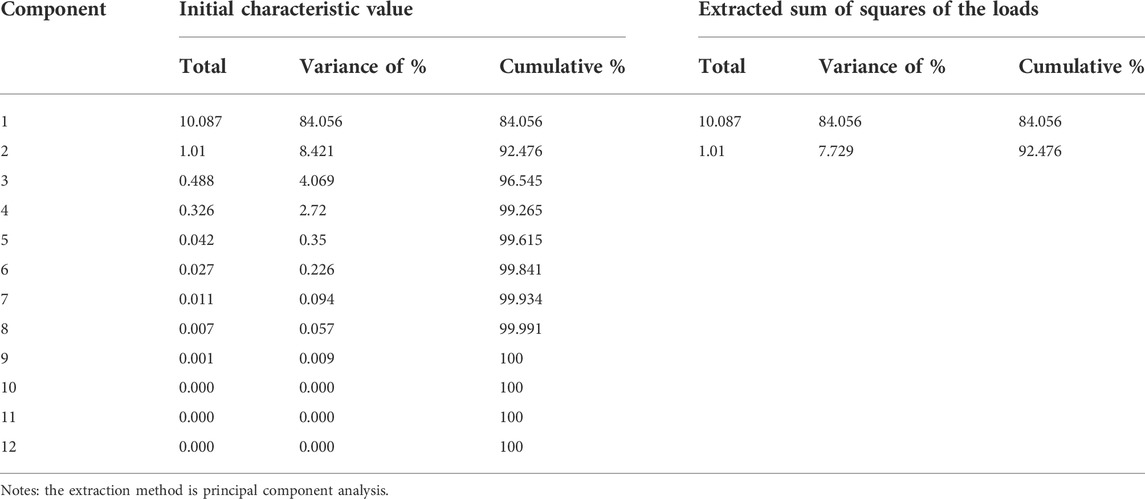
TABLE 4. Total variance explained.
As shown in Table 5, the first principal component consisted of X1 (population), X3 (urbanization rate), X5 (added value of industry), X6 (total investment in fixed assets), and X12 (proportion of secondary and tertiary industries). The correlation between these controlling factors and the first principal component was above 0.95, showing the significant effects of population growth and economic development on the change of cultivated land area in the Yangtze River Delta region. The second principal component consists of X8 (total power of agricultural mechanization) and X10 (consumption of fertilizer), showing significant effects of technological progress on the change of cultivated land area in the Yangtze River Delta region.
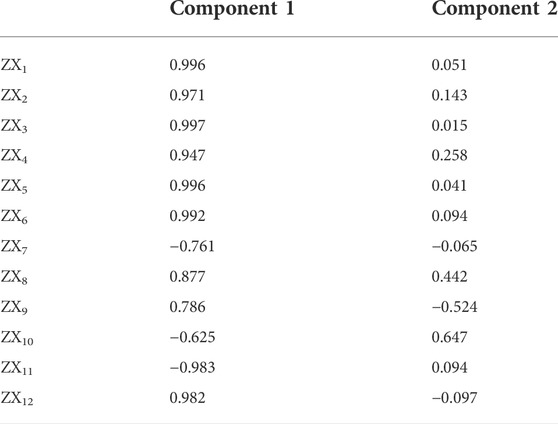
TABLE 5. Component matrix.
Based on the quantitative results of the principal component analysis (Table 5), we selected population (POP), gross domestic product (GDP), and the total power of agricultural mechanization (TPAM) as the independent variables of the GWR model. First, we used Moran’s I to test the spatial autocorrelation of the cultivated land area in 2009, 2013, and 2018. As shown in Figure 7, the cultivated land area of the three characteristic years had spatial agglomeration, which provided a foundation for the construction of the GWR model. Besides, we analyzed the correlation between the selected three independent variables in order to evaluate the possibility of collinearity problem (Table 6). The results showed that the correlation coefficients of the three variables were all less than 0.8 in different characteristic years, indicating that there was no multicollinearity for these indicators. Therefore, the GWR model can be built using these indicators. Moreover, we tested the spatial autocorrelation of the residual error of the GWR model (Table 7), which showed random spatial distribution. Therefore, further regression analysis can be performed on the selected independent and dependent variables using the GWR model.
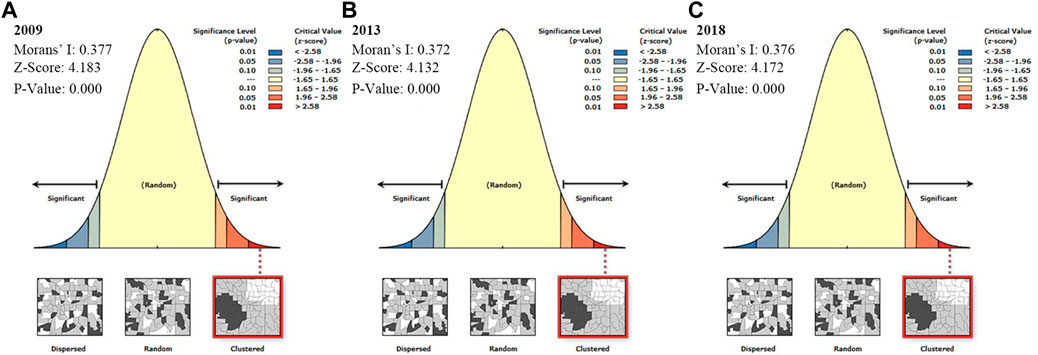
FIGURE 7. Moran’s I index of 2009, 2013, and 2018.
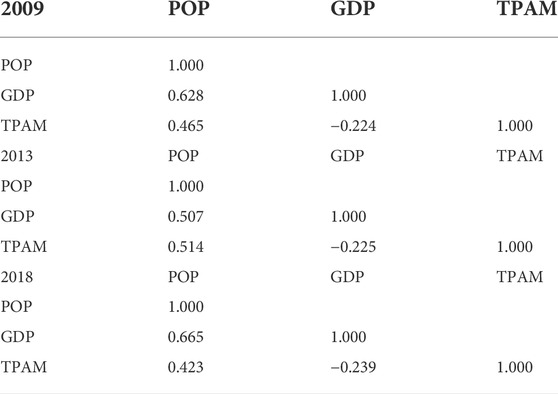
TABLE 6. Correlation coefficient of independent variables.
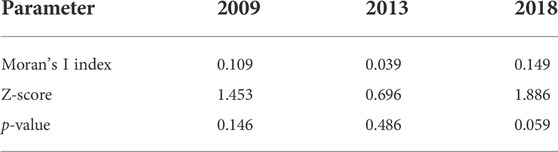
TABLE 7. Spatial autocorrelation of residual error.
According to the aforementioned results, we used the spatial kernel function of FIXED for calculation. In addition, we applied the AICc method to determine the optimal bandwidth. It can be found that the values of R2 and adjusted R2 explained 84%, 84%, and 89% of the variations in 2009, 2013, and 2018, respectively (Table 8). The results had indicated that the GWR model can well simulate the influence of controlling factors on the change of cultivated land resources in the Yangtze River Delta region.
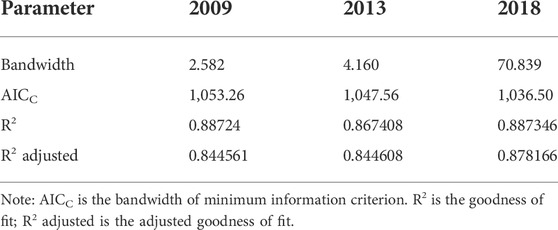
TABLE 8. Parameter estimation and test results of GWR.
There was a positive correlation between the population and cultivated land (Figures 8A–C), suggesting that the growing population played positive effects in promoting the increase of cultivated land. It showed a stronger impact of population on the cultivated land in the northeast coastal area than in the southwest area, with a higher degree of differentiation in the southeast coastal areas. The spatial distribution of population regression coefficients gradually changed from 2009 to 2013, showing that a greater impact was not only concentrated in the coastal areas but also began to move to the north of the Yangtze River Delta region. Meanwhile, this positive effect also had a strong impact on some cities in the Anhui province. However, the distribution of the regression coefficient of the population showed of high in the north and low in the south in the Yangtze River Delta region from 2013 to 2018. The center of gravity for the spatial regression coefficient moved from the coastal area of the northeast to the inland area of the north in the Yangtze River Delta region. During this time period, the positive impact of the population had gradually extended to some inland cities in the northern Yangtze River Delta region. The perfect medical security system and infrastructure construction of some coastal cities in the Jiangsu province led to a large population moving in. However, it will inevitably raise the cost of living and employment in these cities because urban development reaches a certain degree of saturation, resulting in the population moving to small cities (Wang L. W. et al., 2018).

FIGURE 8. Spatial distribution of regression coefficients of GWR model in Yangtze River Delta from 2009 to 2018. (A–C) represent the spatial distribution of regression coefficients of POP in 2009, 2013, and 2018, respectively. (D–F) represent the spatial distribution of regression coefficients of GDP in 2009, 2013, and 2018, respectively. (H–G) represent the spatial distribution of regression coefficients of TPAM in 2009, 2013, and 2018, respectively.
There was a negative correlation between the GDP and cultivated land area in the Yangtze River Delta region, with significant spatial change (Figures 8D–F). The negative effect of the GDP on the cultivated land area gradually increased from the north to south region to the central to eastern region in 2009, which was especially obvious in the eastern coastal and central regions of the Yangtze River Delta region, attributing to the impact of the macro-control of national policies. For example, the Anhui province put forward the economic development strategy of “developing the Wanjiang River and calling for Pudong” in the 1990s. Furthermore, it also attended the forum of major leaders of the Yangtze River Delta region in 2008 (Zhang et al., 2019), suggesting that the form of regional cooperation and development in the Yangtze River Delta region extended to the Anhui province. The aggregation area of low value located in the coastal area of the Jiangsu province spread southward continually, showing that the restraining effect of the GDP on cultivated land area was continuously increasing in the coastal cities of the Zhejiang province and some inland cities. For example, the National Development and Reform Commission promulgated the “Regional Plan for the Yangtze River Delta” in 2010, a policy document that included eight prefecture-level cities in the Zhejiang province (Liu et al., 2020). Some cities in the Zhejiang province had developed because of the implementation of this policy that enabled the negative effects of the GDP to spread to the southern area of the Yangtze River Delta region from 2009 to 2013. In addition, the negative effects of the GDP also existed from 2013 to 2018, with a stronger effect in the northeast and weaker effect in the southwest.
The regression coefficients of the TPAM region were all positive in the Yangtze River Delta region, suggesting positive effects of TPAM on the cultivated land (Figures 8G–I). In 2009, the center of gravity of the regression coefficient of TPAM gradually moved to the central area of the Yangtze River Delta region. However, spatial distribution of the regression coefficients of TPAM in the Yangtze River Delta region moved from the central area to the southeast coastal area from 2009 to 2013, with a stronger positive effect in the southeast, whereas a weaker one in the northwest. In 2013–2018, the spatial distribution of regression coefficients showed higher values in the south and lower values in the north. The center of gravity for the high-value gathering area moved to the south, mainly getting distributed in the hilly and coastal areas of the Zhejiang province. This phenomenon may be attributed to the investment of agricultural mechanization conducted by the government of the Zhejiang province in 2013 (Gao, 2014). Besides, the Zhejiang province has promoted the development of agricultural mechanization in hills and mountainous areas by renovating scattered and fragmented hilly cultivated land in recent years, leading to a stronger positive impact of this factor.r in the southern area than in the northern area in the Yangtze River Delta region (Liu et al., 2019).
At present, the analysis of the controlling factors of cultivated land change mainly focuses on natural and socioeconomic factors (Wang et al., 2020). Natural factors usually play a role over a long period of time, while socioeconomic factors have a great influence over a short period of time. Moreover, due to the implementation of the reform and opening-up policy, the influence of natural factors on the change of cultivated land resources has gradually decreased, but the influence of human economic activities has been increasing (Li Q. et al., 2020). Yuan et al. (2021) analyzed the regional evolution of China’s cultivated land resources from 2009 to 2018, showing that the Yangtze River Delta region was a key area of cultivated land loss. The same results were also found in our study, which showed a decreasing trend of the total cultivated land area and the per capita cultivated land area in the Yangtze River Delta region from 2009 to 2018. Meanwhile, the cultivated land area in most prefecture-level cities of the Yangtze River Delta region decreased from a spatial perspective. Of all the cities, the cultivated land area in Ma’anshan, Shanghai, and Nantong had decreased by more than 10,000 ha. On the one hand, due to the continuous acceleration of urbanization and new rural construction, industrial and mining construction as well as water conservancy facilities had occupied a large amount of cultivated land (Wei and Zhang, 2019). On the other hand, in order to protect and improve the ecological environment, some cities had begun to gradually implement the policy of returning farmland to forests and grasslands, which also caused the loss of cultivated land resources to some extent (Chen et al., 2021).
Some scholars applied natural factors to the qualitative analysis of the change in cultivated land area, which included elevation, precipitation, and temperature (Levers et al., 2018; Li Y. S. et al., 2021). However, these factors are often difficult to quantitatively analyze. Therefore, most scholars choose socioeconomic factors for discussion. Fu et al. (2020) pointed out that the proportion of secondary and tertiary industries, fixed assets per land, and urbanization rate had a negative effect on the transformation of the cultivated land of the Beijing–Tianjin–Hebei region, while population density and peasants per income had positive effects to some extent. Cao et al. (2016) established an auto-logistic model to explore the controlling factors of cultivated land changes in the Pearl River Delta region, suggesting that the population density change, fixed asset investment, and the changes in per land GDP played positive, negative, and positive contribution on the changes in cultivated land in the Pearl River Delta region, respectively. Liu et al. (2019) conducted a comprehensive analysis of the controlling factors of the change of cultivated land in 12 major urban agglomerations in China, and the results showed that TPAM had a significant positive correlation with cultivated land in coastal urban agglomerations (Yangtze River Delta, Pearl River Delta, Beijing–Tianjin–Hebei, etc.). Therefore, compared to the studies conducted in the Pearl River Delta and Beijing–Tianjin–Hebei regions, it can be found that POP and TPAM had positive effects on the three major economic circles, which revealed that the concentration of population will increase the demand for agricultural products as a result of stimulating the increase of cultivated land to some extent. In addition, the investment of agricultural technology had a positive effect on cultivated land, especially for the hilly area in the Yangtze River Delta region. However, fixed asset investment, GDP, urbanization, and other controlling factors that are related closely to economic development generally have negative effects on the changes of cultivated land.
According to the analysis of the controlling factors, it revealed that pursuing economic growth blindly at the early and middle stages of urban development of the Yangtze River Delta region depleted plenty of cultivated land. Although the positive effect of POP and TPAM offset the negative effect caused by GDP to some degree, the phenomenon of occupation of cultivated land for economic development still existed. Therefore, this indicates that exploring the social-economic controlling factors on the cultivated land change is beneficial in balancing the relationship between economic development and cultivated land, which can also provide regional references for ensuring food security and sustainable development of the man–land relationship (Wei et al., 2019; Liu et al., 2019).
In recent years, other research studies have also shown similar results that social–economic factors have significant effects on land use change (Maimaitijiang et al., 2015; Dadashpoor et al., 2019; Chidi et al., 2021; Zhang et al., 2022). Dadashpoor et al. (2018) found that urbanization effected changes in landscape patterns of the Tabriz metropolitan area from 1996 to 2016, which was analyzed by the GWR model. Maimaitijiang et al. (2019) used two methods of ordinary least squares (OLS) and GWR model to analyze the magnitude and direction of the relationship between land use changes, urbanization, and changes in landscape patterns, finding that built-up land changes were positively correlated with population changes during the 1970–2010 time interval. Chidi et al. (2021) explored land use intensity dynamics in the Andhikhola watershed, Middle Hills of Nepal, showing that depopulation in recent decades was a major driving factor on land use intensity change, but physical suitability, accessibility, and availability of natural resources had strong impacts on the spatial variability of land use intensity. Zhang et al. (2022) analyzed the land use and land cover (LULC) change patterns and population dynamics in Collin County, Texas, and the results of the GWR model indicated that population growth can explain 75.15% of the built-up area change in Collin County during 2010–2019. The rapid progress of urbanization and population growth has brought great pressure on land use, which was not only found in the Yangtze River Delta region of China but also found in other parts of the world. This indicates that we should be highly concerned about the situation and find an appropriate method to deal with it.
This research analyzed spatial-temporal variation characteristics of cultivated land and controlling factors in the Yangtze River Delta region from 2009 to 2018 by using multiple methods, including the mathematical-statistical, land use dynamic degree model, principal component analysis, and geographically weighted regression model. The principal conclusions are as follows.
The cultivated land area and the per capita cultivated land area showed an overall decreasing trend from 2009 to 2018 in the Yangtze River Delta region. Compared with 2009–2013, the decline range of the cultivated land area had slowed down in 2013–2018. However, the reduction of the per capita cultivated land area had been rapid from 2009 to 2018.
Prefecture-level cities with a reduction of cultivated land area below 10,000 ha had occupied a dominant position in the spatial distribution of cultivated land resources in the Yangtze River Delta region. Agriculture-dominated cities mostly distributed in the northwest area of the Yangtze River Delta region. Thus, this area was a gathering region with slow reduction in cultivated land area and per capita cultivated land area. The cultivated land area had been compressed, attributing to the development of urbanization, the adjustment of industrial structure, and the increase of construction land, which led to the southeast coastal areas becoming rapidly reduced in regions of cultivated land area and per capita cultivated land area. However, the distribution of the rapidly increasing regions of cultivated land area and per capita cultivated land area was scattered because of differences in agricultural technology investment of local governments and the different reclamation degrees of cultivated land resources.
The population had a positive effect on the cultivated land area in the Yangtze River Delta region, with the influence degree gradually increasing from the southwest to northeast. However, the eastern coastal area was more sensitive to GDP than the inland areas in the Yangtze River Delta region, causing a stronger negative effect on the economic development of the cultivated land area than the inland cities. The spatial regression coefficient of TPAM constantly moved from the central to southern areas. This phenomenon may be attributed to the influence of local policies. Thus, there existed strong regional characteristics about the distribution of the spatial regression coefficients of the controlling factors on cultivated land change in the Yangtze River Delta region. Therefore, protection policies for cultivated land based on reality should be established, utilizing cultivated land resources in a reasonable way, developing agricultural technology in accordance with local conditions, and reforming the land supply mechanism for construction land. In addition, this study can provide references for the protection and sustainable development of regional cultivated land resources.
Publicly available data sets were analyzed in this study. These data can be found at: http://www.stats.gov.cn/tjsj/ndsj.
KH, YR, and HF conceived the idea and administrated this project. KH and CG collected the original data. KH wrote the manuscript and contributed to the graphics. YR, HF, and HC contributed to the revision of the manuscript and funding support. GC contributed to the proofreading of the manuscript. All authors contributed to the discussion and approved the final manuscript before submission.
This research was funded by the Natural Resources Science and Technology Project of Anhui Province (2021-k-3), the Doctoral Foundation Project of Anhui Jianzhu University (2019QDZ57), the Social Scientific Innovation and Development Research Project of Anhui Province (2021CX090), the Natural Science Foundation Project of universities of Anhui Province (KJ 2021A063), the National Social Science Foundation Project (13BJY079), and the Innovation Collaborative Project of Universities of Anhui Province (GXXT-2021-044).
The authors would like to thank the teachers who offered suggestions on this work.
KH was employed by Tianjin Urban Planning and Design Institute Co, Ltd.
The remaining authors declare that the research was conducted in the absence of any commercial or financial relationships that could be construed as a potential conflict of interest.
All claims expressed in this article are solely those of the authors and do not necessarily represent those of their affiliated organizations, or those of the publisher, editors, and reviewers. Any product that may be evaluated in this article, or claim that may be made by its manufacturer, is not guaranteed or endorsed by the publisher.
The Supplementary Material for this article can be found online at: https://www.frontiersin.org/articles/10.3389/fenvs.2022.871482/full#supplementary-material
Akinyemi, F. O., and Speranza, C. I. (2021). Agricultural landscape change impact on the quality of land: An African continent-wide assessment in gained and displaced agricultural lands. Int. J. Appl. Earth Obs. Geoinf. 106, 102644. doi:10.1016/j.jag.2021.102644
Brunsdon, C., Fotheringham, A. S., and Charlton, M. (1996). Geographically weighted regression: A method for exploring spatial nonstationarity. Geogr. Anal. 28 (4), 281–298. doi:10.1111/j.1538-4632.1996.tb00936.x
Cai, H., Zhu, Q., Luo, Y. J., and Ma, K. (2020). Evolution characteristic and driving mechanisms of cultivated landscape eco-security patterns in rapid urbanization areas. J. Nanjing For. Univ. 44 (05), 181–188. doi:10.3969/j.issn.1000-2006.201907047
Cao, C. Y. (2018). Research on the coupled and coordinated development of intensive use of cultivated land and new urbanization-a case study in Jiangsu Province. Chin. J. Agric. Resour. Reg. Plann. 39 (06), 67–73. doi:10.7621/cjarrp.1005-9121.20180610
Cao, Q. W., Wu, J. S., Tong, D., Zhang, X. N., Lu, Z. Q., and Si, M. L. (2016). Drivers of regional agricultural land changes based on spatial autocorrelation in the Pearl River Delta, China. Res. Sci. 38 (04), 714–727. doi:10.18402/resci.2016.04.13
Chen, C., and Wu, G. Y. (2018). An analysis on efficiency of arable land utilization in Anhui Province based on four-stage DEA model. Bull. Soil Water Conserv. 38 (04), 288–294. doi:10.13961/j.cnki.stbctb.2018.04.046
Chen, Z., Zhang, L. G., Zhi, L., Fu, W., and Luo, M. C. (2021). The evolution of research on the grain to green program: Process, characteristic and outlook. Issue. For. Eco. 41 (01), 91–96. doi:10.16832/j.cnki.1005-9709.2020003
Cheng, S. L., and Yu, S. J. (2019). Analysis on the land use and its driving force in the Yangtze River Delta region during 1985-2015. For. Eco. 41 (11), 49–54. doi:10.13843/j.cnki.lyjj.2019.11.007
Chidi, C. L., Sulzer, W., Xiong, D. H., Wu, Y. H., Zhao, W., and Pradhan, P. K. (2021). Land use intensity dynamics in the Andhikhola watershed middle hill of Nepal. J. Mt. Sci. 18, 1504–1520. doi:10.1007/s11629-020-6652-8
Dadashpoor, H., Azizi, P., and Moghadasi, M. (2019). Land use change, urbanization, and change in landscape pattern in a metropolitan area. Sci. Total Environ. 655, 707–719. doi:10.1016/j.scitotenv.2018.11.267
Dong, P. Y., and Zhao, H. F. (2019). Study on trade-off and synergy relationship of cultivated land multifunction: A case of qingpu district, Shanghai. Resour. Environ. Yangtze Basin. 28 (02), 368–375. doi:10.11870/cjlyzyyhj201902013
Fu, C., and Liu, Y. S. (2013). Coordinated development between land use change and population change in urbanizing China. Econ. Geogr. 33 (03), 47–51. doi:10.15957/j.cnki.jjdl.2013.03.008
Fu, H., Liu, Y. J., Sun, H. R., and Zhou, G. L. (2020). Spatio-temporal characteristics and dynamic mechanism of cultivated land use transition in the Beijing-Tianjin-Hebei region. Prog. Geogr. 39 (12), 1985–1998. doi:10.18306/dlkxjz.2020.12.003
Gao, J. (2014). Study on the development level and policy research of agriculture mechanization in Anhui Province. [He Fei (Anhui)]: Anhui Agriculture University. [master’s thesis]. [Anhui].
Halim, N. D. A., Latif, M. T., Mohamed, A. F., Maulud, K. N. A., Idrus, S., Azhari, A., et al. (2020). Spatial assessment of land use impact on air quality in mega urban regions, Malaysia. Sustain. Cities Soc. 63, 102436. doi:10.1016/j.scs.2020.102436
Jiang, D., Zhao, W, J., and Wang, Y, H. (2022). Analysis of urban road spatiotemporal situation by geographically weighted regression with spatial grid computing. Geomatics Inf. Sci. Wuhan. Univ., 1–13. doi:10.13203/j.whugis20210173
Kashki, A., Karami, M., Zandi, R., and Roki, R. (2021)., 37. Iran, 100832. doi:10.1016/j.uclim.2021.100832Evaluation of the effect of geographical parameters on the formation of the land surface temperature by applying OLS and GWR, A case study Shiraz City, IranUrban Clim.
Kong, X. S., Chen, J. L., Wang, J., and Zhao, X. D. (2021). Evaluation of ecological disturbance coupling land use pattern and process change: Taking the Yangtze River Delta as an example. Sci. Geogr. Sin. 41 (11), 2031–2041. doi:10.13249/j.cnki.sgs.2021.11.016
Lee, C. M., Choi, H. N., Kim, Y. C., Kim, M. S., Kim, H. K., and Hamm, S. Y. (2021). Characterizing land use effect on shallow groundwater contamination by using self-organizing map and buffer zone. Sci. Total Environ. 800, 149632. doi:10.1016/j.scitotenv.2021.149632
Levers, C., Schneider, M., Prishchepov, A. V., Estel, S., and Kuemmerle, T. (2018). Spatial variation in determinants of agricultural land abandonment in Europe. Sci. Total Environ. 644 (10), 95–111. doi:10.1016/j.scitotenv.2018.06.326
Li, J. H., Zhou, K. C., Dong, H. M., and Xie, B. G. (2020a). Cultivated land change, driving forces and its impact on landscape pattern changes in the Dongting Lake Basin. Int. J. Environ. Res. Public Health 17 (21), 7988. doi:10.3390/ijerph17217988
Li, Q., Xu, B., and Wei, J. F. (2020b). Research on the spatio-temporal evolution and influencing factors of economic development in the Yangtze River Delta: An empirical analysis based on the data of 307 county units. Urban. Probl. 12, 14–23.
Li, X. L., Wu, K. N., Zhao, R., Liu, Y. N., Li, X., and Yang, Q. J. (2021a). Spatial analysis of cultivated land productivity and health condition: A case study of gaoping city, China. Land 10 (12), 1–19. doi:10.3390/land10121296
Li, Y. S., Chang, C. Y., Zhao, Y. C., Wang, Z. R., Li, T., Li, J. W., et al. (2021b). Evaluation system transformation of multi-scale cultivated land quality and analysis of its spatio-temporal variability. Sustainability 13 (18), 10100. doi:10.3390/su131810100
Li, Y., and Zhang, X. Q. (2017). Assessment on carrying capacity of water resources in Yangtze River economic zone based on principal component analysis. Bull. Soil Water Conserv. 37 (04), 172–178. doi:10.13961/j.cnki.stbctb.2017.04.029
Lin, H. M., and Zhang, W. L. (2005). The similarities and differences of principal component analysis and factor Analysis and SPSS software—Concurrently discuss with Liu yumei and Lu wendai. Stat. Res. 03, 65–69.
Liu, C. X. (2019). On the effect, problems and countermeasure of Zhejiang agriculture machine replacement. Issues. Agric. Econ. 03, 11–18. doi:10.13246/j.cnki.iae.2019.03.002
Liu, D. F., Zhou, B. Y., He, J. H., Kong, X. S., and Li, Y. L. (2019). Analysis of influencing factors of cultivated land change in Chinese urban agglomerations considering spatially inter-city interactions. Trans. Chin. Soc. Agric. Eng. 35 (16), 274–283.
Liu, D., Yang, Y., Zhang, W. H., and Xu, M. J. (2020). Study on planning and policy system of regional integration development in Yangtze River Delta. Environ. Prot. 48 (20), 9–15. doi:10.14026/j.cnki.0253-9705.2020.20.002
Maimaitijiang, M., Ghulam, A., Sandoval, J. S. O., and Maimaitiyiming, M. (2015). Drivers of land cover and land use changes in St. Louis metropolitan area over the past 40 years characterized by remote sensing and census population data. Int. J. Appl. Earth Obs. Geoinf. 35, 161–174. Part B. doi:10.1016/j.jag.2014.08.020
Permai, S. D., Christina, A., and Gunawan, A. A. S. (2021). Fiscal decentralization analysis that affect economic performance using geographically weighted regression (GWR). Procedia Comput. Sci. 179, 399–406. doi:10.1016/j.procs.2021.01.022
Pessoa, L. G. M., Freire, M. B. G. S., Green, C. H. M., Miranda, M. F. A., Filho, J. C. A., and Pessoa, W. R. L. S. (2022). Assessment of soil salinity status under different land-use conditions in the semiarid region of Northeastern Brazil. Ecol. Indic. 141, 109139. doi:10.1016/j.ecolind.2022.109139
Qin, W. Z., Wang, J. M., and Liu, M. L. (2005). Spatial nonstationarity of geographically weighted regression analysis of spatial data. J. Liaoning Norm. Univ. Nat. Sci. 04, 476–479. doi:10.3969/j.issn.1000-1735.2005.04.028
Salim, H., Sajjad, R. U., Paule-Mercado, M. C., Memon, S. A., Lee, B. Y., Sukhbaatar, C., et al. (2019). Comparison of two receptor models PCA-MLR and PMF for source identification and apportionment of pollution carried by runoff from catchment and sub-watershed areas with mixed land cover in South Korea. Sci. Total Environ. 663, 764–775. doi:10.1016/j.scitotenv.2019.01.377
Shi, H. H., Cheng, J. M., Fei, L. C., and Cheng, J. (2019). Land use transition and change of ecosystem service function in urban agglomerations of the Yangtze River Delta from 1990 to 2015. Res. Soil Water Conserv. 26 (01), 301–307. doi:10.13869/j.cnki.rswc.2019.01.044
Song, J. P., and Chen, S. L. (2021). Impact of economic agglomeration on land use eco-efficiency of three major urban agglomerations in China. J. Nat. Resour. 36 (11), 2865–2877. doi:10.31497/zrzyxb.20211111
Voukantsis, D., Karatzas, K., Kukkonen, J., Räsänen, T., Karppinen, A., and Kolehmainen, M. (2011). Intercomparison of air quality data using principal component analysis, and forecasting of PM10 and PM2.5 concentrations using artificial neural networks, in Thessaloniki and Helsinki. Sci. Total Environ. 409 (7), 1266–1276. doi:10.1016/j.scitotenv.2010.12.039
Wang, A., Lu, L., and Bao, S. J. (2017). Spatially non- stationary analysis between commercial land price and driving force in Hefei city. Sci. Geo. Sina. 37 (10), 1535–1545. doi:10.13249/j.cnki.sgs.2017.10.010
Wang, H. Y., Qin, F., Xu, C. D., Li, B., Guo, L. P., and Wang, Z. (2021a). Evaluating the suitability of urban development land with a Geodetector. Ecol. Indic. 123, 1–13. doi:10.1016/j.ecolind.2021.107339
Wang, L. W., Wang, S. P., Chen, Y., and Xia, S. Y. (2018b). The trend of new migration and influencing factors among cities in Jiangsu Province since 2001. Econ. Geogr. 38 (12), 89–96. doi:10.15957/j.cnki.jjdl.2018.12.012
Wang, M. M., Zhang, H. Y., Zhang, Y. G., Lin, M. S., and Gong, P. (2020a). Evolution analysis of land use pattern in the Changjiang River Delta Costal Zone in recent 39 years. Hai. Yang. Hsueh. Pao. 42 (11), 142–154. doi:10.3969/j.issn.0253–4193.2020.11.014
Wang, Q. (2020). On measurement and zoning of ecological compensation of cultivated land: A case study of Yangtze River Delta. [Hang Zhou (Zhejiang)]: Zhejiang University. [master’s thesis].
Wang, W. X., Cao, Y. G., Su, R, Q., Qiu, M., Song, L., and Zhou, W. (2020). Cultivated land protection policy in China: A background, effect and future trends. Chin. J. Agric. Resour. Reg. Plann. 41 (10), 40–51. doi:10.7621/cjarrp.1005-9121.20200703
Wang, W. J., Wang, Q., Zhu, A. S., Huang, L., Gu, Y., Wang, Y. J., et al. (2021b). Role of land use changes on ammonia emissions from agricultural ecosystems in the Yangtze River Delta Region from 2000 to 2018. Environ. Sci. 42 (07), 3442–3450. doi:10.13227/j.hjkx.202010202
Wang, W. X., Cao, Y. G., Su, R. Q., Song, L., Zhang, Y. N., and Zhou, W. (2020b). Driving force of cultivated land change in China- driving factors and driving mechanism. Chin. J. Agric. Resour. Reg. Plann. 41 (07), 21–30.
Wang, X. L., and Bao, Y. H. (1999). Discussion on research methods of land use dynamic change. Pro. Geogr. 01, 83–89.
Wang, Z., Zhuo, C. G., and Huang, K. L. (2018a). Study on the pathways and features of cultivated land protection in China from the perspective of the policy instruments—an quantitative analysis based on policy tests from 1986 to 2017. Hubei. Agric. Sci. 57 (13), 109–116. doi:10.14088/j.cnki.issn0439-8114.2018.13.028
Wei, Y. C., and Zhang, L. Q. (2019). Spatial characteristic of cultivated land changes and influence factors in Hubei and He’nan Province. Bull. Soil Water Conserv. 39 (02), 293–300. doi:10.13961/j.cnki.stbctb.2019.02.046
Xing, L. P., Fang, B., and Xiang, M. J. (2019). Temporal and spatial variation of cultivated land intensive use level and its influencing factors in Jiangsu Province Based on GWR model. Resour. Environ. Yangtze Basin. 28 (02), 376–386.
Yang, Q. K., Duan, X. J., Wang, L., and Wang, Y. Z. (2021). Mechanism of interaction between urban land expansion and ecological environment effects in the Yangtze River Delta. Prog. Geogr. 40 (02), 220–231. doi:10.18306/dlkxjz.2021.02.004
Yin, R. M., Li, X., Cao, J. X., and Fang, B. (2020). Study on the trade-off/synergy of multifunctional cultivated land in Jiangsu Province. J. Nanjing Norm. Univ. Nat. Sci. 43 (01), 69–75.
Yuan, C. C., Zhang, D. X., Liu, L. M., and Ye, J. W. (2021). Regional characteristics and spatial-temporal distribution of cultivated land change in China during 2009-2018. Trans. Chin. Soc. Agric. Eng. 37 (01), 267–278. doi:10.11975/j.issn.1002-6819.2021.01.032
Zhang, B., Li, W. D., and Zhang, C. R. (2022). Analyzing land use and land cover change patterns and population dynamics of fast-growing US cities: Evidence from Collin County, Texas. Remote Sens. Appl. Soc. Environ. 27, 1–24. doi:10.1016/j.rsase.2022.100804
Zhang, J., Cheng, S. Q., Li, H. F., Fu, K., and Xu, Y. (2020). Groundwater pollution source identification and apportionment using PMF and PCA-APCA-MLR receptor models in a typical mixed land-use area in Southwestern China. Sci. Total Environ. 741, 140383. doi:10.1016/j.scitotenv.2020.140383
Zhang, Q., Shen, J., and Sun, F. H. (2021). Spatiotemporal differentiation of coupling coordination degree between economic development and water environment and its influencing factors using GWR in China's province. Ecol. Modell. 462, 109794. doi:10.1016/j.ecolmodel.2021.109794
Zhang, X. L., Lin, Y. R., and Meng, M. X. (2019). The evolution of regional integration development mechanism in the Yangtze River Delta: Experience and future trends. J. Anhui Univ. 43 (01), 138–147. doi:10.13796/j.cnki.1001-5019.2019.01.017
Zhao, H. N., Zhao, Y. H., Ning, J., Gong, T. T., and Sun, Z. X. (2021). Evaluation of the land use benefit of urban agglomeration in the Yangtze River Delta based on TOPSIS Method. Res. Soil Water Conserv. 28 (05), 355–361. doi:10.13869/j.cnki.rswc.2021.05.041
Zhao, K., Li, W. F., Mao, J. X., Kou, X. W., and Yin, C. X. (2019). Evaluation of cultivated land ecological security and spatial-temporal pattern evolution based on PSR model. Ecol. Sci. 38 (01), 186–193. doi:10.14108/j.cnki.1008-8873.2019.01.024
Zhu, C. M., Li, W. Y., Du, Y. Y., Xu, H. W., and Wang, K. (2020b). Spatial-temporal change, trade-off and synergy relationship of cropland multifunctional value in Zhejiang Province, China. Trans. Chin. Soc. Agric. Eng. 36 (14), 263–272. doi:10.11975/j.issn.1002-6819.2020.14.032
Keywords: Yangtze River Delta region, cultivated land, spatial–temporal variation characteristics, principal component analysis, geographically weighted regression model
Citation: Huo K, Ruan Y, Fan H, Guo C and Cai H (2022) Spatial-temporal variation characteristics of cultivated land and controlling factors in the Yangtze River Delta region of China. Front. Environ. Sci. 10:871482. doi: 10.3389/fenvs.2022.871482
Received: 08 February 2022; Accepted: 13 October 2022;
Published: 10 November 2022.
Edited by:
Wiwin Ambarwulan, National Research and Innovation Agency, IndonesiaReviewed by:
Lei Wang, North China University of Water Conservancy and Electric Power, ChinaCopyright © 2022 Huo, Ruan, Fan, Guo and Cai. This is an open-access article distributed under the terms of the Creative Commons Attribution License (CC BY). The use, distribution or reproduction in other forums is permitted, provided the original author(s) and the copyright owner(s) are credited and that the original publication in this journal is cited, in accordance with accepted academic practice. No use, distribution or reproduction is permitted which does not comply with these terms.
*Correspondence: Yunfeng Ruan, cnVhbnl1bmZlbmcxM0BtYWlscy51Y2FzLmFjLmNu; Haizhou Fan, NDIyMzA1NDAwQHFxLmNvbQ==
Disclaimer: All claims expressed in this article are solely those of the authors and do not necessarily represent those of their affiliated organizations, or those of the publisher, the editors and the reviewers. Any product that may be evaluated in this article or claim that may be made by its manufacturer is not guaranteed or endorsed by the publisher.
Research integrity at Frontiers
Learn more about the work of our research integrity team to safeguard the quality of each article we publish.