 Xiao Liu
 Jun Zhang2
95% of researchers rate our articles as excellent or good
Learn more about the work of our research integrity team to safeguard the quality of each article we publish.
Find out more
ORIGINAL RESEARCH article
Front. Environ. Sci. , 28 March 2022
Sec. Environmental Economics and Management
Volume 10 - 2022 | https://doi.org/10.3389/fenvs.2022.870019
Addressing global climate change is the responsibility of all mankind, and original green technology innovation is the key to achieving the goal of “carbon neutrality”. Under the target of “carbon neutrality”, it remains to be seen whether China’s special economic zones can promote the green technology innovation of enterprises, which is very important for achieving green and high-quality development. This study examines the impact of special economic zones (SEZs) on enterprises’ green technology innovation by constructing a quasi-natural experiment using data of Chinese listed companies (collected from 2000 to 2017) and green patent applications. The empirical results showed that the SEZ program significantly promoted the green technology innovation of enterprises. The number of green patent applications of enterprises in zones has increased by 17.02%. The promotion effect was more significant on enterprises in provincial development zones, those that are owned by the central state, and those in central and eastern regions. In the short term, the green innovation promotion effect is mainly derived from the effect of preferential policy subsidies, while in the long run, the role of the agglomeration effect gradually emerged. This study provides empirical evidence for green and high-quality development. This study also provides a new policy reference for achieving a win–win situation between industrial agglomeration and ecological environment.
Although the economy of China has grown rapidly, energy consumption and environmental pollution restrict the sustainability of economic development (Gu et al., 2019; Gu et al., 2020a; Gu et al., 2020b; Zhao et al., 2020; Zhao et al., 2021; Zhou et al., 2021). According to the report of the 19th CPC National Congress, China’s economy has moved from a stage of high-speed growth to a stage of high-quality development. It means that the extensive development model relying on energy consumption can no longer promote the high-quality and sustainable growth of the economy of China (Sui, 2017; Zhang et al., 2018; Peng et al., 2020a; Zhang et al., 2020). At the same time, the emission restrictions and energy constraints under the “carbon neutrality” target have put forward higher requirements for economic growth (Shen et al., 2019; Sheng et al., 2019; Tu et al., 2020). Therefore, green and intensive development has become the key to ensure high-quality economic development (Wang, 2020; Elahi et al., 2022a; Elahi et al., 2022b). Adoption of green technology innovation leads to high-quality development in the agriculture and industrial sectors (Elahi et al., 2019a; Elahi et al., 2019b; Elahi et al., 2021a). Enterprises are the principal body and actual implementation of technological innovation, and patents are important carriers of enterprises’ technology. Promoting enterprise green technology innovation is of great significance to high-quality economic development (Odhiambo et al., 2020; Peng et al., 2021; Wang et al., 2021).
China’s special economic zones (SEZs) have been introduced nearly 40 years ago. As a typical place-based policy, it is widely used in many countries. In practice, since the implementation of SEZs, the main economic indicators, such as the productivity, innovation level, and scale of enterprises in SEZs, have been greatly improved (Alder et al., 2016; Lu et al., 2019), which has become an important driving force for China to promote economic growth (Peng et al., 2018a; Peng et al., 2019a; Wang Q. et al., 2019). However, whether SEZs balance economic construction and environmental protection is an urgent question to be answered—for example, during the COVID-19 pandemic in 2021, a large number of enterprises in special economic zones were restricted by the policy of power rationing and shutdown due to the rise in coal prices. Promoting green development and upgrading of enterprises have become the key for SEZs to promote sustainable economic development in China. At the same time, in the process of promoting the economic development of special economic zones, air pollution, environmental damage, and other problems that are not conducive to sustainable development have gradually emerged, and environmental constraints have become an important factor hindering the further development of China’s economy (Peng et al., 2019b; Peng et al., 2020b; Zhong et al., 2020; Peng et al., 2022b). Therefore, SEZs more and more tend to promote enterprise green and intensive development. Among them, the green development policy in SEZs mainly includes pollution supervision and green development encouragement policies for enterprises in the zone, such as the policy of sewage treatment, the strict supervision policy on pollution discharge of chemical industry, and the policy of encouraging enterprises to save energy and reduce environmental emissions (Elahi et al., 2017a; Elahi et al., 2017b; Elahi et al., 2018b; Zhong et al., 2021). These policies will promote enterprises to enhance their awareness of green development and promote green technology innovation to reduce pollution emissions (Peng et al., 2018b; Wu B. et al., 2021; Peng et al., 2022a). Therefore, it was found that, in the enterprise’s green technology innovation, a large number of green inventions and utility model patents are used to reduce the discharge of wastewater and energy consumption (Peng et al., 2019c; Tu et al., 2019; Huang et al., 2021).
Based on the “China SEZ Audit Announcement List” and the panel data of listed companies and corporate green patent application data from 2000 to 2017, this paper empirically determines the causal relationship between the SEZ program and corporate green technology innovation using the method of staggered differences-in-differences (DID). Moreover, this paper analyzes the heterogeneity of the policy effects from the types of the SEZ program, the regional level, and the enterprise ownership. Finally, from the perspective of policy subsidy mechanism and agglomeration effect mechanism, the study estimates the intermediary mechanism of the SEZ program to promote green technology innovation of enterprises.
The study has three main contributions. Firstly, this study examines the impact of the SEZ program on corporate green technology innovation, which expands the existing academic literature on factors affecting green and high-quality development. Secondly, it evaluates the policy effect and mechanism of the SEZ program in the context of China and provides empirical evidence for further improvement and promotion of the SEZ program. Thirdly, it is the first study that focuses on the long-term effect of agglomeration in the SEZ program, which provides a reference for the sustainable development of the SEZ program.
The central government of China implemented a series of economic policies to promote regional economic growth (Neumark and Simpson, 2015). In particular, SEZs are a form of incremental development usually used in developing countries. In 1984, the State Council of China approved the first batch of 14 coastal economic and technological SEZs that established the developing guideline. The main focus was on industrial projects, FDI absorption, and export value, with emphasis on the development of high and new technology. The SEZs effectively drive the economic development of the coastal areas (Wei, 1995). The success of coastal urban SEZs has gradually replicated to inland areas, and all regions have actively built SEZs, which have fully covered 31 provinces. There are several types of special economic zones in which the preferential policies have some different emphases—for example, the National Economic and Technical Development Zones (NETDZ) are approved by the central government, which are more privileged and broad, with a wide range of investors. The National High-Tech Industrial Development Zones (NHIDZ) are aiming to develop high-tech industries and promote technological innovation. Both NETDZ and NHIDZ are state-level SEZs and have some similar functions. Provincial development zones (PDZs) are initiated by the provincial government and usually develop industries that are suited to local comparative advantages. According to the China SEZ Audit Announcement List (revised in 2018), there are 2,543 SEZs at or above the provincial level, including 552 state-level zones (which comprised 219 NETDZs, 156 NHIDZs, and other types) and 1,991 PDZs. These SEZs contribute more than 30% of the whole economy of China. As the economic engine, SEZs have promoted the coordinated and orderly economic development of China (Ren, 2018).
The environmental governance and encouraging green development of enterprises in SEZs are important measures for the sustainable economic development of China. In recent years, the Chinese government issued a series of important documents, such as “Action Plan for the Prevention and Control of Water Pollution”, “Industrial Green Development Plan”, “Several Opinions on Promoting the Transformation, Upgrading, and Innovation and Development of the National Economic and Technological SEZ”, and so on. These put forward the guidance of green development of the SEZs. Accordingly, the local governments have also introduced supporting measures to promote the green development of enterprises in the SEZs. The important path to promote green development is to promote the green technology innovation of enterprises, which can reduce energy consumption and pollution emissions and thus fundamentally achieve green development.
The construction of green development in SEZs is a strategic decision to promote China’s economic development, so the concept of “green development” and “low-carbon operation” is put in an important position. Studying the impact of the SEZs on the enterprise green technology innovation is an important issue. Meanwhile, the establishment time of each zone is relatively scattered, which is conducive to separating the impact of policy and the unobservable annual fixed effect. This provides an appropriate quasi-natural experiment for the quantitative evaluation of the impact of the SEZ program on enterprise green technology innovation.
Previous studies focused on China’s SEZ program and explored the policy effects of zone construction from macro, meso, and micro perspectives. From the regional macro level, existing research found the positive economic effects of the SEZ program from the perspectives of regional economic growth (Alder et al., 2016; Brachert et al., 2019), regional innovation (Wu M. et al., 2021), FDI (Wang, 2013), and regional employment (Ham et al., 2011; Busso et al., 2013). From the industrial meso level, starting from the leading industries of the SEZ program, extant literature has studied the integration of policy and the local economy in SEZs from the perspectives of comparative advantages (Chen and Xiong, 2015) and industrial upgrading (Li and Shen, 2015). From the enterprise micro level, the studies found that SEZs promoted firm productivity (Lin et al., 2018) and increased the enterprises’ scale generally (Li and Wu, 2018). Most studies indicated that the policy effects of China’s SEZs have been positive and effective. However, some studies also highlighted that SEZs rely too much on financial subsidies and lead to efficiency loss (Hanson and Rohlin, 2013).
Previous literature focused on the economic effects of SEZs that have already been concerned with the impact on enterprise innovation. However, to the best of our knowledge, until now, no study examined the impact of SEZs on green technology innovation. Actually, in the construction of SEZs, both state-level and provincial-level SEZ programs regard green development as a necessary condition for high-quality economic development. Therefore, the government provides favorable policy support for enterprise green technology innovation in SEZs, which may enhance the motivation of enterprises for green technology innovation, and significantly promotes the improvement of the green technology innovation level of enterprises in SEZs. In addition, the SEZ programs enhance enterprise clustering in specific geographical areas, and the consequent industrial agglomeration promotes green technology innovation (Li et al., 2021). Based on the above-mentioned analysis, we propose the following hypothesis:
Hypothesis 1:. Special economic zones could promote green technology innovation of enterprises.The micro influence of the SEZs establishment on enterprise green technology innovation is mainly reflected in two aspects: First, the government provides more tax incentives and financial subsidies to enterprises and thus directly or indirectly broadens the financing channels of enterprises in SEZs, namely, the preferential policy effect. Second, the establishment of SEZs helps to strengthen the formation of industrial agglomeration and improve the availability of enterprise innovation resources in the zone, namely, the agglomeration effect.
Preferential policies for enterprises in SEZs mainly include government financial subsidies and tax incentives. Government subsidies were facilitated as a gratuitous transfer of funds. Its original intention is to influence the innovation decision-making of enterprises by increasing the number of funds owned by enterprises to improve the willingness of enterprises to invest in innovation. Moderate financial subsidies are conducive to making up for market failures in the innovation process, driving innovation investment at the enterprise level, and promoting enterprise technological innovation activities (Görg and Strobl, 2007; Lee, 2011). However, government subsidies may fail to have the expected positive effect. It cannot be ruled out that companies are more likely inclined to invest subsidies into non-productive investment activities than innovation and upgrading activities in the face of high government financial subsidies. In addition, the information asymmetry between the government and enterprises can easily lead to problems, such as reverse selection before enterprises apply for subsidies. Tax incentives help to ease the tax burden of micro-market subjects and reduce the marginal cost of enterprise innovation activities, thus improving the expected income of enterprise innovation investment. It has been demonstrated that tax incentives can promote enterprises to increase R&D investment and innovation output (Bloom et al., 2002; Beck et al., 2016). However, some studies found that tax has a significant incentive effect on enterprise R&D investment, but not obviously on innovation output (Yuan et al., 2016). The previous literature has not found a relationship between financial subsidies and enterprise innovation. Therefore, this paper proposes the following research hypotheses:
Hypothesis 2a:. Special economic zones can facilitate green technology innovation of enterprises by the preferential policy effect.
Hypothesis 2b:. The preferential policies of special economic zones could not influence green technology innovation of enterprises.
Governments at all levels attract companies to SEZs with preferential policies and convenient services to promote the formation of industrial clusters (Wang, 2013). The concentration of economic activities helps to reduce transaction costs, transportation costs, equipment usage costs, and labor costs, enabling enterprises to obtain higher economic returns and devote more resources to developing new products and technologies (Andersson et al., 2007). The SEZs, like many place-based programs, attempt to foster agglomeration economies by building clusters (Combes et al., 2011). The essence of an agglomeration economy is the high concentration of factors in a specific geographic area to generate an external economy, and the circular cumulative process of innovative activities and economy of scale plays a role in the formation of agglomeration economy (Xu, 2006). The SEZ achieves self-improvement and sustainable development through the “positive feedback” process of “circular accumulation” of agglomeration effect. The strong agglomeration effect helps enterprises in the zone to obtain external resources more easily and improve the efficiency of using existing resources (Duranton and Puga, 2004). In the meantime, the continuous growth of enterprises in SEZs enhances the overall industrial agglomeration of the zone, further strengthening the effect of economies of scale and external economies. In addition, from the perspective of knowledge generation, the SEZ triggers the spatial reconfiguration of production factors, such as human resources, financial resources, and scientific research resources, among which professional labor and financial resources are fundamental elements for enterprises to engage with technological innovation (Sun et al., 2018; Zulfiqar et al., 2020a; Zulfiqar and Hussain, 2020; Zulfiqar et al., 2021). Enterprises in the development area can share production factors associated with R&D innovation activities, such as R&D personnel, R&D infrastructure, and R&D knowledge (Zulfiqar et al., 2020b), which, in turn, stimulate them to engage in green technology innovation (Carlino and Kerr, 2015). Lastly, knowledge and technology spillover is the most fundamental factor for industrial agglomeration to promote green technology innovation of enterprises. Industrial agglomeration creates conditions for cognitive proximity, social proximity, institutional proximity, and organizational proximity among innovation subjects. It helps promote the division of labor and collaboration among enterprises and leverage knowledge and technology spillover effects (Mariotti et al., 2010). It should be noted that the agglomeration effect needs to be accumulated over a long time period. Therefore, this paper argues that there may be a lag in the agglomeration effect of SEZs on enterprises’ green technology innovation. We proposed the following hypotheses.:
Hypothesis 3a:. Special economic zones can facilitate green technology innovation of enterprises by the agglomeration effect.
Hypothesis 3b:. The agglomeration effect of special economic zones could not influence green technology innovation of enterprises.
The database used in this study consists of three parts: SEZ data, enterprise green patent data, and enterprise characteristics and financial data. SEZ data was obtained from the China SEZ Audit Announcement List (Revised in 2018). This list included the characteristics of China’s existing SEZs by 2018, establishment time, geographic boundary information, and the type of SEZs. Enterprise green patent application data was obtained from the State Intellectual Property Office of China. Enterprise characteristics and financial data were obtained from the China Stock Market & Accounting Research Database. The number of SEZs established before 2000 accounted for a small proportion, and they are located in coastal cities with a high level of economic development. After 2000, SEZs sprang up rapidly in all regions of China. Consequently, the study period is from 2000 to 2017.
We eliminated special treatment, particular transfer, and financial enterprises (e.g., banks, insurance, and security companies) because they generally have special properties that may lead to biased results. After that, we excluded enterprises listed for less than 1 year to reduce the bias caused by the impact of IPO events. Then, we eliminated the sample of areas where no SEZs were established in the research period. Therefore, the impact of the regional effect was removed. Moreover, to avoid extreme values, the main continuous variables are winsorized by 1%.
To identify whether the enterprise is in SEZs, precise geographical information about enterprises’ locations (specific coordinates) is needed. For this purpose, processing was carried out using various steps:
Step 1:. We used Baidu Map’s geocoding Application Programming Interface and the detailed address of the enterprises to obtain the geographical coordinates of each enterprise. The detailed Chinese address of each enterprise was used with Baidu Map to get a map with the specific location of the address; then, the latitude and longitude of the enterprise were extracted.
Step 2:. We mapped the SEZs according to the boundary address of each zone. ArcGIS software was used to merge and intersect the longitude and latitude of enterprises with the map of the SEZ. This process allows determining whether the enterprise is in SEZs.
Step 3:. To avoid systematic errors in localization resolution, we further verified and identified the type of SEZs where the enterprise is located through the special vocabulary contained in the address. The addresses of enterprises in SEZs have some common characteristics—for instance, “158 Jinghai 4th Road, Beijing Economic and Technological Development Zone, Beijing” contains the words “economic and technological development zone”; it is a listed company in NETDZ. Therefore, we identified the enterprises whose address contains the “economic and technological development zone” as being in the NETDZ. Similarly, the enterprises whose address contained “high-tech industrial development zone” were identified as being in the NHIDZ, and the enterprises whose address contained “industrial development zone” or “industrial park” were identified as being in the PDZ.After the above-mentioned processing, the final dataset of this paper has a total observation value of 28,625 and 1,795 enterprises. Among them, there were 796 enterprises in the state-level SEZs (44.35%), 268 enterprises in the NETDZs (14.93%), 235 enterprises in the NHIDZs (13.09%), and 293 enterprises in the PDZs (16.32%).
Since the establishment of SEZs was carried out in batches, this means that the timing and the location of the SEZs in the sample are different. Thus, this paper takes the establishment of the SEZs as a quasi-experiment to evaluate the net effect of the establishment of SEZs on the green technology innovation of enterprises by constructing a time-varying DID model. As a major tool in evaluation methods of policy effects, the use of a DID model has been preferred because it can avoid the endogeneity problem. Moreover, the use of fixed effects estimation alleviates the omitted variable bias problem to a certain extent. Its basic idea is to construct a double difference statistic reflecting the effect of the policy by comparing the difference between the control and the treatment groups before and after the implementation of the policy. However, an important potential threat of this identification method is that the empirical results may be confounded by regional factors. Therefore, in this paper, enterprises inside and outside the SEZs in the same city are set as the treatment and control groups, respectively. The regression function can be written as follows:
where the subscript i and t represent the individual and the year, respectively. The dependent variable
This paper analyzes the green technology innovation of enterprise in three dimensions: innovation output, innovation efficiency, and innovation input. We used the number of green patent applications (Gpatent) to indicate green technology innovation (Wang Y. et al., 2019). It is the indicator that most represents the green technology innovation level of enterprises, which can be further decomposed into the number of green invention patent applications (Gpatent_i) and the number of green utility model patent applications (Gpatent_u). Innovation efficiency is represented by the green technology innovation efficiency (GIE), which refers specifically to the number of patents produced per unit of R&D input. R&D is used to denote innovation input.
Following He and Tian (2013), Kafouros et al. (2015), and Liu (2021), the enterprise characteristic variables were selected to control the factors affecting enterprise innovation: enterprise assets (ASSET), enterprise profitability (ROA), enterprise liability ratio (LEV), firm liquidity (LIQ), and firm fixed assets per capita (CLR).
The specific measurement and descriptive statistics of the variables are shown in Table 1. The results found that the average number of green patents was 0.2107, of which the average number of green invention patents was 0.0679, and the average number of green utility model patents was 0.1767 (Table 1). The main patent types in green patents were utility model patents. In addition, the green invention patents ranged from 0 to 3.0445, which indicated that there are great differences in the green invention patents among different enterprises in China.
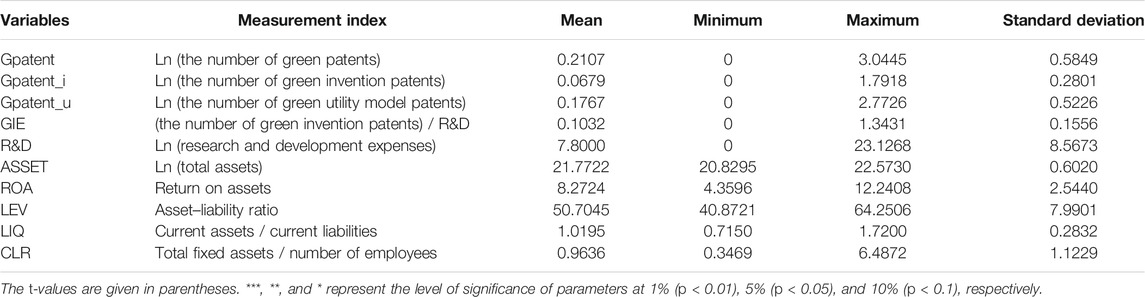
TABLE 1. Summary of descriptive statistics.
The average number of patent applications of enterprises in SEZs has increased from 0.0373 in 2000 to 2.3123 in 2017. Figure 1 illustrates the kernel density curves of the green patent application. The line of the green patent application of enterprises in SEZs is skewed to the right, indicating that the enterprises in SEZs have a higher level in green patent application than enterprises not in SEZs. Similarly, the picture on the right side of Figure 1 illustrates the dynamic evolution of the green patent application of enterprises in every kind of SEZs and non-SEZs. The line of non-SEZs is at the bottom, and the gap with lines of SEZs is getting bigger, which indicates the advantage in green innovation of enterprises in SEZs, especially those in NHIDZs, which is relatively obvious compared to enterprises not in SEZs.
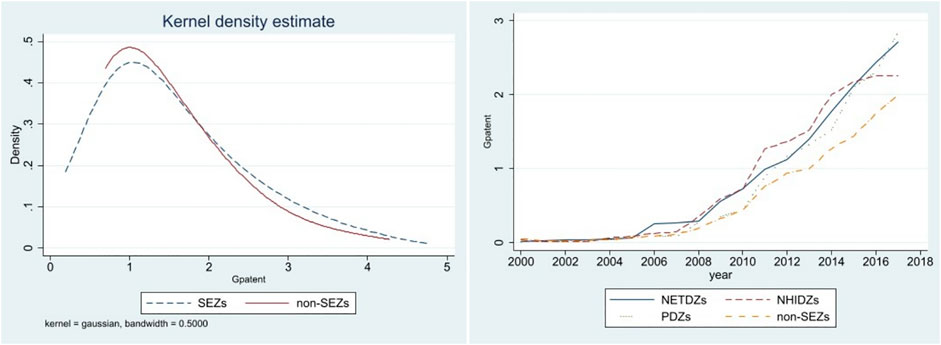
FIGURE 1. Static and dynamic advantages of green technology innovation of enterprises in special economic zones (SEZs). The left side of the picture shows the kernel density distribution map of the green patent application, and the right side of the picture shows the dynamic evolution of the green patent application of enterprises in every kind of SEZs and non-SEZs.
Column 1 of Table 2 shows the effect of the policy of the SEZs on enterprises’ green technology innovation. The SEZs can significantly promote the green technology innovation of enterprises in the zone. The coefficient of

TABLE 2. Baseline regression results.
An important assumption for the assessment of the SEZs using the DID method is that the explained variables satisfy the parallel trend assumption between the treatment and the control groups. It means that the explained variables would have the same trend in both groups in the absence of the policy intervention. In other words, if there are no SEZs, the green technology innovation of the treatment group and the control group will not change significantly over time. Following Beck et al. (2010) and Wang (2013), this study uses the event to conduct a parallel trend test, which also allows for dynamic effects analysis to examine whether there are time lags and decay in the policy effects. The specific regression function can be written as follows:
where the explained variable
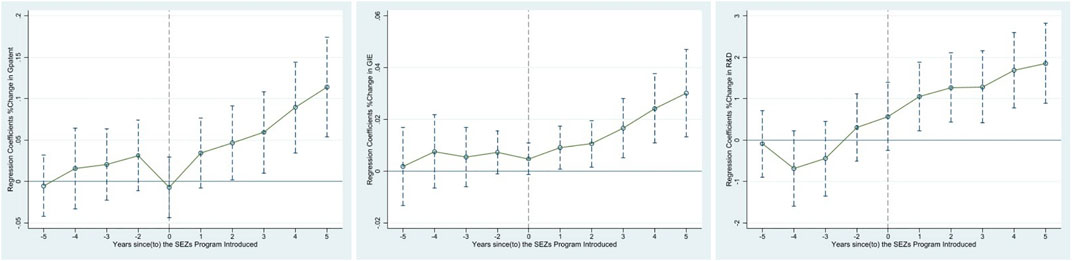
FIGURE 2. Results of the parallel trend test.
This paper further conducted a placebo test by constructing a pseudo-treatment group and a control group to rule out differences in green technology innovation between enterprises in SEZs and non-SEZs. From the overall sample of 1,795 enterprises, 796 enterprises were randomly selected as the treatment group, and other enterprises were used as the control group. Afterward, we make a regression analysis by adding control variables. The random sample was repeated 500 times to get precise results. Figure 3 illustrates the distribution of the estimated coefficients of the 500 “pseudo-policy dummy variables” and the corresponding p-values, where the X-axis represents the magnitude of the estimated coefficients of the “pseudo-policy dummy variables”, and the Y-axis represents the density values and p-values. The curve in Figure 3 is the kernel density distribution of the estimated coefficients. The dots are the p-values corresponding to the estimated coefficients, and the vertical dashed line shows a true estimate (0.1702) of the time-varying DID model. Furthermore, it was found that the estimated coefficients obtained by 500 random processing are distributed nearly 0, and all p-values >0.1. It indicates that the effect of a placebo on dependent variables is not statistically significant. The results of the real DID regression analysis are reliable, and the robustness of the regression results is verified.
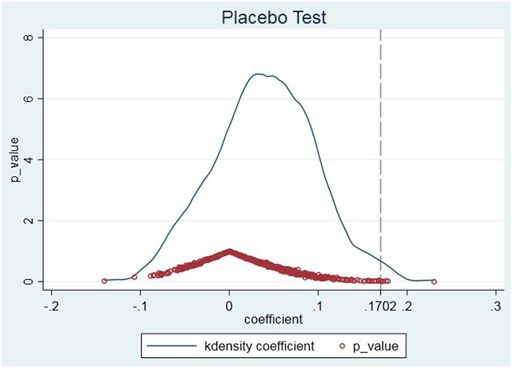
FIGURE 3. Results of the placebo test.
It was found that the SEZs can significantly promote the green technology innovation of enterprises, but the impact of the results on different types of SEZs, different regional types, and enterprise attributes needs to be further tested. To identify the heterogeneity of the policy effect of the SEZ construction, we have considered the following tests.
Since different types of SEZs adopt different policy measures, the impact on enterprises’ green technology innovation also differs to a certain extent. Therefore, we further distinguish the types of SEZs to estimate the differentiated impact of SEZs on enterprise innovation. Columns 1 and 2 of Table 3 represent the results of an empirical analysis of the NETDZ. It was found that the establishment of NETDZ can promote the number of enterprise green patent applications that increased by 11.58% and also has a significantly positive impact on the innovation efficiency of enterprises. Columns 3 and 4 of Table 3 shows the empirical analysis results of the NHIDZ and PDZs. It was found that the SEZs can significantly improve the green technology innovation level and innovation efficiency of enterprises in the zone, but there are differences to a certain extent. First, the number of green patent applications in PDZs has increased the most, which is higher than those of NHIDZs and NETDZs. Compared with national-level SEZs, provincial-level SEZs are the “main battlefield zone” for provincial-level governments to attract investment, and local governments attach great importance to them. At the same time, considering environmental pressures, local governments have higher environmental requirements for enterprises in provincial-level SEZs. Second, provincial-level SEZs have a significant contribution to the efficiency of green innovation. The reason might be that the level of R&D expenditure in PDZs is far lower than those of NHIDZs and NETDZs. According to the measurement method of innovation efficiency, the innovation efficiency of PDZs is higher and more significant.
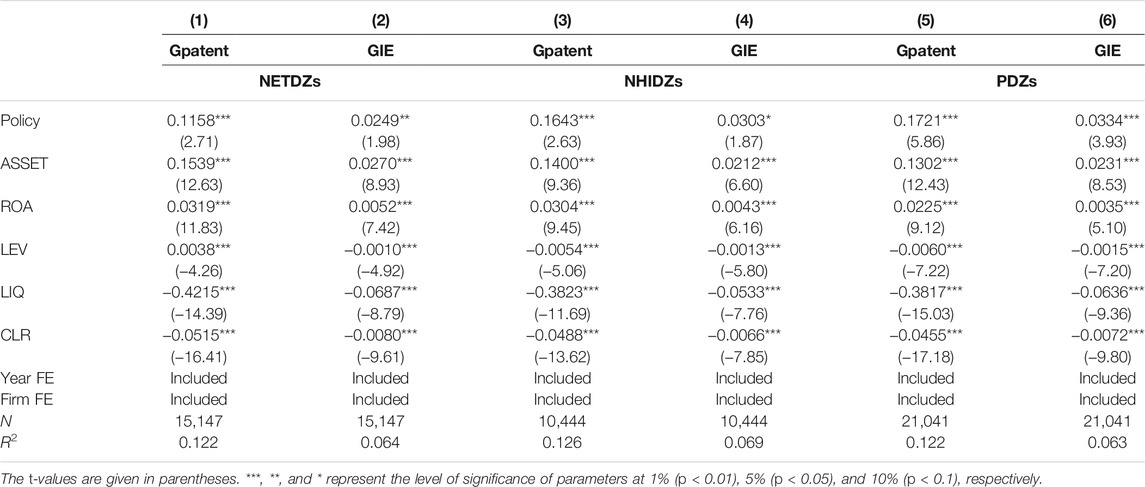
TABLE 3. Test of heterogeneity.
Regional economic disparities are common in China. Since the reform and opening-up, the eastern and central regions have achieved rapid economic development, while other regions are comparatively slow to economic development. In general, China’s economic development level decreases from east to west, with the south being higher than the north. On June 13, 2011, the National Bureau of Statistics divided China’s economic regions into four regions, namely: Northeast, East, Central, and West. Specifically, the East region includes the 10 provinces and cities of Beijing, Tianjin, Hebei, Shanghai, Jiangsu, Zhejiang, Fujian, Shandong, Guangdong, and Hainan. The Central region includes the six provinces of Shanxi, Anhui, Jiangxi, Henan, Hubei, and Hunan. The West region includes the 12 provinces and cities of Inner Mongolia, Guangxi, Chongqing, Sichuan, Guizhou, Yunnan, Tibet, Shaanxi, Gansu, Qinghai, Ningxia, and Xinjiang. The Northeast region includes three provinces, particularly Liaoning, Jilin, and Heilongjiang. Such economic differences can also affect the effectiveness of the implementation of SEZs. To better study the regional heterogeneity of SEZs, this study conducts a regression analysis of Gpatent on sub-samples. The results are given in Table 4. It was found that the SEZs have a heterogeneous impact on the enterprise green technology innovation of different regions. SEZs can significantly promote enterprise green technology innovation in the eastern and central regions. Specifically, the coefficients of policy (in columns 2 and 3 of Table 4) are positively and statistically significant. It indicates that SEZs can promote the green patent applications of enterprises in the eastern region and central region, which significantly increased by 17.49 and 21.99%, while the corresponding coefficients (in columns 1 and 4 of Table 4) are not statistically significant. This implies that, after controlling for other regional factors, the SEZs can significantly reduce the energy intensity in eastern regions but has no significant impact on the energy intensity in the central and western regions. The great differences in the economic development level in different regions make the subsidies and various preferential policies obtained by enterprises in the SEZs in different regions greatly different, which, in turn, lead to differences in the motivation of enterprises for green technology innovation.
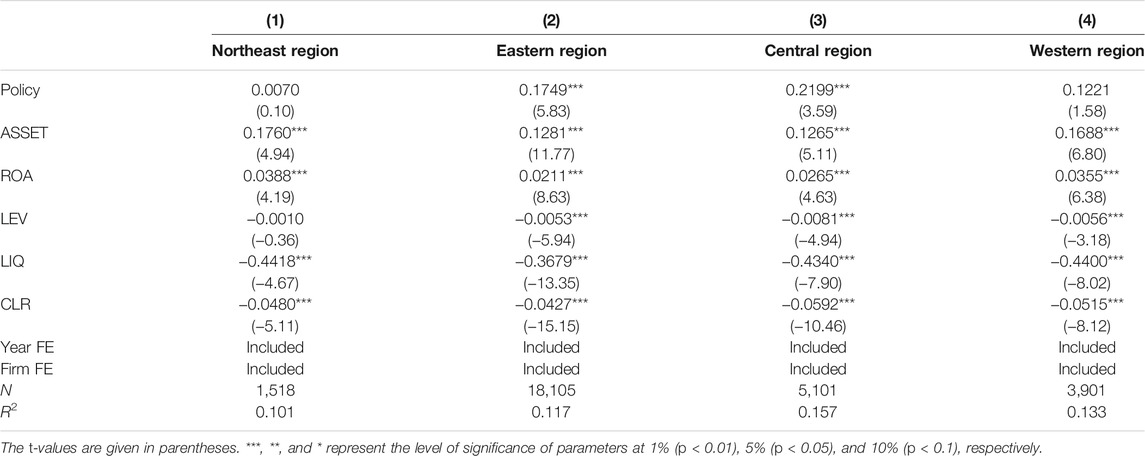
TABLE 4. Results of the regional heterogeneity analysis.
There are differences in the types of ownership of enterprises in SEZs, including central state-owned, local state-owned, and private enterprises. There are significant differences in the policies and measures of the SEZs for enterprises with different ownership, and there are also differences in the responses of various enterprises to the policies of SEZs. Therefore, in this study, we estimate differences in the effects of the SEZs on enterprises with different ownership; particularly, we focus on the green patent applications.
The results shown in Table 5 depict that the SEZs significantly improved the green technology innovation level of all three types of enterprises. Specifically, the SEZs increase the green patent applications of central state-owned enterprises, local state-owned enterprises, and private enterprises to 30.95, 15.62, and 16.40%, respectively. Therefore, the SEZs have the highest impact on central state-owned enterprises, followed by private enterprises, and finally state-owned enterprises. Moreover, this study distinguishes the types of patent applications as green invention patents and green utility model patents. For central state-owned enterprises, the SEZs increase the number of green invention patent applications by 20.78% and the number of green utility model patent applications by 20.49%. For local state-owned enterprises, the SEZs increase the number of green utility model patent applications by 15.98%. For private enterprises, the SEZs increase the number of green invention patent applications by 5.70% and the number of green utility model patent applications by 15.53%. Unlike central state-owned enterprises, local state-owned enterprises and private enterprises accounted for a larger proportion of the total number of green utility model patents. It is easier to apply for green utility model patents than green invention patents. It can be inferred that local state-owned enterprises and private enterprises in SEZs might seek subsidies with more low-quality inventions.
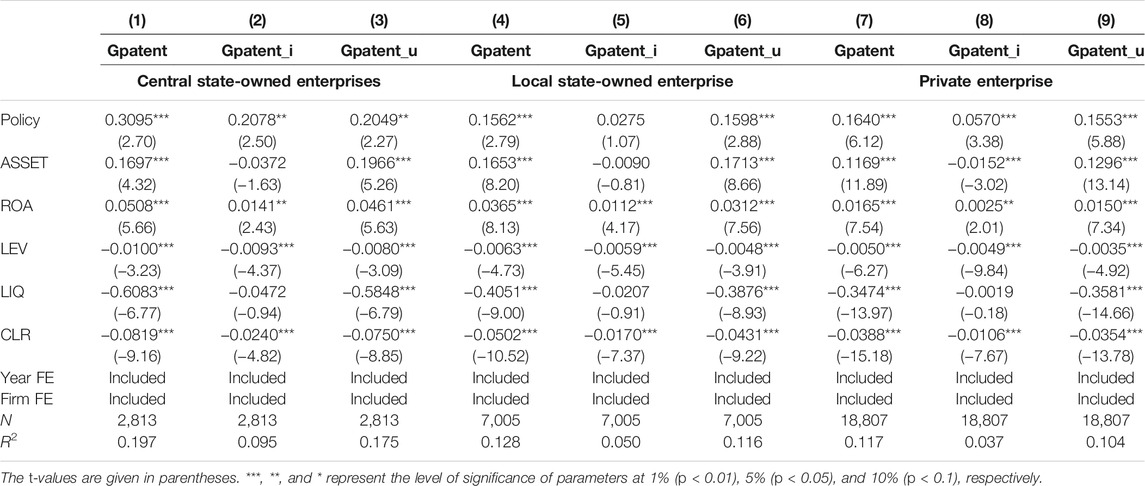
TABLE 5. Results of the heterogeneity of enterprise ownership.
In this article, we further explored the impact mechanism of SEZs based on two perspectives, particularly, the preferential policy effect and the agglomeration effect using the regression function as follows:
where
The realization of the agglomeration effect requires not only an increase in the number of enterprises but also an expansion of the scale of the industry. Following Lin et al. (2018), the agglomeration effect can be represented by firm_cluster and ind_agglom, where firm_cluster denotes the number of enterprises clustered in SEZs, and ind_agglom denotes the industrial agglomeration caused by clustering of enterprises within the same industry.
The results are given in Table 6. For the policy effect, it was found that the coefficients of Policy * subsidy and Policy * taxp are positive and statistically significant. Meanwhile, for the agglomeration effect, the coefficients of Policy * firm_cluster and Policy * ind_agglom are not significant. The results indicate that SEZs promote the green innovation of enterprises by the preferential policy effect, while the agglomeration effect has no significant role in the promotion of green innovation.
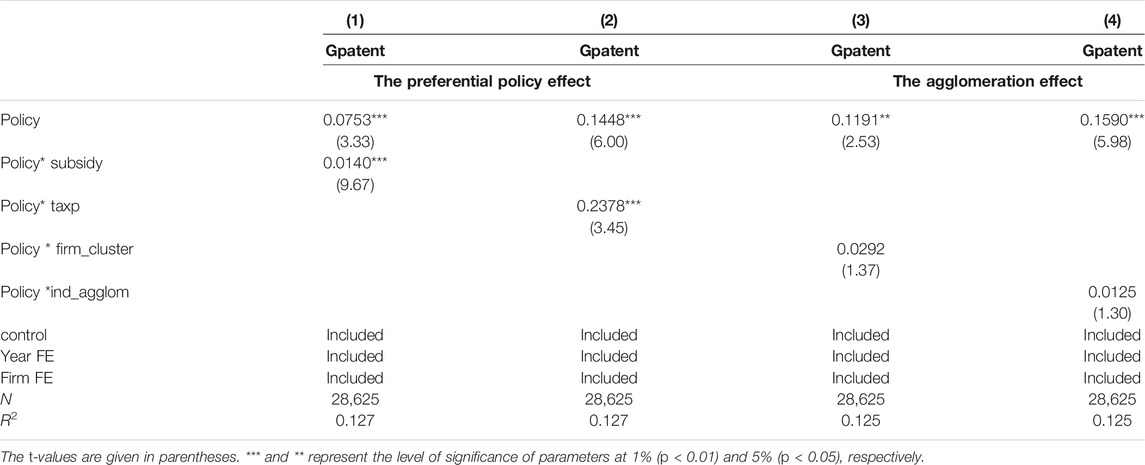
TABLE 6. Analysis of mechanism: the preferential policy and the agglomeration effect.
It was found that the agglomeration effect is not statistically significant to promote green innovation in the short term (Table 6). Therefore, we further focused on the lagging effect of the agglomeration effect by incorporating the lagged terms of the explanatory variables into the regression function (Eq. 3). The superscript indicates the number of lag terms, e.g., Policy *firm_cluster1 denotes the Lag of Policy * firm_cluster by one period.
The results of Table 7 found that the agglomeration effect of the SEZs has an obvious lag effect. Compared with the agglomeration effect represented by the industry association of enterprises, the agglomeration effect represented by the entry of enterprises is consistent with our intuition because, after the establishment of the SEZs, the policy of attracting investment will attract a large number of enterprises to settle in. The number of enterprises will increase rapidly, but there is no guarantee that these enterprises are in the same industry. Therefore, the industry association of enterprises will play a strong agglomeration effect after the three-phase lag. For different types of SEZs, the conclusions are consistent with the results of the overall analysis, but there are also differences, mainly reflected in the time differences in the agglomeration effect. Moreover, the results confirmed that there is a lag in the agglomeration effect of SEZs. Therefore, in the process of giving play to the role of SEZs in promoting green technology innovation, we should not only pay attention to the short-term effects brought about by subsidy policies but also pay attention to the long-term effects of the agglomeration effects of SEZs.

TABLE 7. The lagging effect of agglomeration effect in promoting enterprise green technology innovation.
To assess the green development promotion effect of the SEZs, this study adopted a quasi-natural experiment method to empirically investigate the impact of the SEZs on the green technology innovation of enterprises based on the microdata of Chinese listed companies and green patent application data. The results relieved the following conclusions:
The SEZs significantly promoted the green technology innovation of enterprises. Overall, the number of green patent applications of enterprises in the zone has increased by 17.02%. In terms of classification, the number of invention patent applications has increased by 6.11%, and the number of utility model patent applications has increased by 15.68%.
From the perspective of the types of SEZs, both the establishment of NETDZs and NHIDZs promoted the improvement of the level of green technology innovation.
From a regional perspective, the green innovation promotion effect was mainly reflected in the central and eastern regions.
From the perspective of enterprise ownership, the SEZs have increased the green patent applications of central state-owned enterprises by 30.95%, while the improvement of local state-owned enterprises and private enterprises is relatively lower.
Moreover, in the short term, the green innovation promotion effect of the SEZs mainly derived from the preferential policy effect rather than the agglomeration effect. The agglomeration effect has a certain lag, but in the long run, the promoting effect of green technology innovation will become more significant.
The original contributions presented in the study are included in the article/Supplementary Material, further inquiries can be directed to the corresponding author.
XL contributed to conceptualization, methodology, formal analysis, and writing—original draft and editing. JZ contributed to investigation, data curation, methodology, and software. TL contributed to conceptualization, project administration, funding acquisition, and writing—review and editing. XZ contributed to supervision, validation, and visualization. All authors contributed to manuscript revision and approved the submitted version.
We are grateful for the financial support from the General Project of the National Social Science Foundation of China (number 21BJL035).
The authors declare that the research was conducted in the absence of any commercial or financial relationships that could be construed as a potential conflict of interest.
All claims expressed in this article are solely those of the authors and do not necessarily represent those of their affiliated organizations or those of the publisher, the editors, and the reviewers. Any product that may be evaluated in this article or claim that may be made by its manufacturer is not guaranteed or endorsed by the publisher.
Abid, M., Scheffran, J., Schneider, U. A., and Elahi, E. (2019). Farmer Perceptions of Climate Change, Observed Trends and Adaptation of Agriculture in Pakistan. Environ. Manag. 63 (1), 110–123. doi:10.1007/s00267-018-1113-7
Alder, S., Shao, L., and Zilibotti, F. (2016). Economic Reforms and Industrial Policy in a Panel of Chinese Cities. J. Econ. Growth 21 (4), 305–349. doi:10.1007/s10887-016-9131-x
Andersson, F., Burgess, S., and Lane, J. I. (2007). Cities, Matching and the Productivity Gains of Agglomeration. J. Urban Econ. 61 (1), 112–128. doi:10.1016/j.jue.2006.06.005
Beck, M., Lopes-Bento, C., and Schenker-Wicki, A. (2016). Radical or Incremental: Where Does R&D Policy Hit? Res. Pol. 45 (4), 869–883. doi:10.1016/j.respol.2016.01.010
Beck, T., Levine, R., and Levkov, A. (2010). Big Bad banks? the Winners and Losers from Bank Deregulation in the United States. J. Finance 65 (5), 1637–1667. doi:10.1111/j.1540-6261.2010.01589.x
Bloom, N., Griffith, R., and Van Reenen, J. (2002). Do R&D Tax Credits Work? Evidence from a Panel of Countries 1979-1997. J. Public Econ. 85 (1), 1–31. doi:10.1016/S0047-2727(01)00086-X
Brachert, M., Dettmann, E., and Titze, M. (2019). The Regional Effects of a Place-Based Policy - Causal Evidence from Germany. Reg. Sci. Urban Econ. 79, 103483. doi:10.1016/j.regsciurbeco.2019.103483
Busso, M., Gregory, J., and Kline, P. (2013). Assessing the Incidence and Efficiency of a Prominent Place Based Policy. Am. Econ. Rev. 103 (2), 897–947. doi:10.1257/aer.103.2.897
Carlino, G., and Kerr, W. R. (2015). Agglomeration and Innovation. Handbook Reg. Urban Econ. 5, 349–404. doi:10.1016/B978-0-444-59517-1.00006-4
Chen, Z., and Xiong, R. (2015). Comparative Advantage and Industrial Policy Effects. Management World 8, 67–80. doi:10.19744/j.cnki.11-1235/f.2015.08.008
Combes, P.-P., Duranton, G., and Gobillon, L. (2011). The Identification of Agglomeration Economies. J. Econ. Geogr. 11 (2), 253–266. doi:10.1093/jeg/lbq038
Duranton, G., and Puga, D. (2004). Micro-foundations of Urban Agglomeration Economies," in Handbook Of Regional and Urban Economics. Elsevier, 2063–2117. doi:10.1016/s1574-0080(04)80005-1
Elahi, E., Zhang, L., Abid, M., Javed, M. T., and Xinru, H. (2017b). Direct and Indirect Effects of Wastewater Use and Herd Environment on the Occurrence of Animal Diseases and Animal Health in Pakistan. Environ. Sci. Pollut. Res. Int. 24, 6819–6832. doi:10.1007/s11356-017-8423-9
Elahi, E., Abid, M., Zhang, H., Cui, W., and Ul Hasson, S. (2018a). Domestic Water Buffaloes: Access to Surface Water, Disease Prevalence and Associated Economic Losses. Prev. Vet. Med. 154, 102–112. doi:10.1016/j.prevetmed.2018.03.021
Elahi, E., Abid, M., Zhang, L., Ul Haq, S., and Sahito, J. G. M. (2018b). Agricultural Advisory and Financial Services; Farm Level Access, Outreach and Impact in a Mixed Cropping District of Punjab, Pakistan. Land use policy 71, 249–260. doi:10.1016/j.landusepol.2017.12.006
Elahi, E., Khalid, Z., Tauni, M. Z., Zhang, H., and Lirong, X. (2021a). Extreme Weather Events Risk to Crop-Production and the Adaptation of Innovative Management Strategies to Mitigate the Risk: A Retrospective Survey of Rural Punjab, Pakistan. Technovation 117, 102255. doi:10.1016/j.technovation.2021.102255
Elahi, E., Khalid, Z., Weijun, C., and Zhang, H. (2020). The Public Policy of Agricultural Land Allotment to Agrarians and its Impact on Crop Productivity in Punjab Province of Pakistan. Land Use Policy 90, 104324. doi:10.1016/j.landusepol.2019.104324
Elahi, E., Khalid, Z., and Zhang, Z. (2022a). Understanding Farmers' Intention and Willingness to Install Renewable Energy Technology: A Solution to Reduce the Environmental Emissions of Agriculture. Appl. Energ. 309, 118459. doi:10.1016/j.apenergy.2021.118459
Elahi, E., Weijun, C., Jha, S. K., and Zhang, H. (2019a). Estimation of Realistic Renewable and Non-renewable Energy Use Targets for Livestock Production Systems Utilising an Artificial Neural Network Method: A Step towards Livestock Sustainability. Energy 183, 191–204. doi:10.1016/j.energy.2019.06.084
Elahi, E., Weijun, C., Zhang, H., and Abid, M. (2019b). Use of Artificial Neural Networks to rescue Agrochemical-Based Health Hazards: A Resource Optimisation Method for Cleaner Crop Production. J. Clean. Prod. 238, 117900. doi:10.1016/j.jclepro.2019.117900
Elahi, E., Weijun, C., Zhang, H., and Nazeer, M. (2019c). Agricultural Intensification and Damages to Human Health in Relation to Agrochemicals: Application of Artificial Intelligence. Land use policy 83, 461–474. doi:10.1016/j.landusepol.2019.02.023
Elahi, E., Zhang, H., Lirong, X., Khalid, Z., and Xu, H. (2021b). Understanding Cognitive and Socio-Psychological Factors Determining Farmers' Intentions to Use Improved Grassland: Implications of Land Use Policy for Sustainable Pasture Production. Land Use Policy 102, 105250. doi:10.1016/j.landusepol.2020.105250
Elahi, E., Zhang, L., Abid, M., Javed, M. T., and Xinru, H. (2017a). Direct and Indirect Effects of Wastewater Use and Herd Environment on the Occurrence of Animal Diseases and Animal Health in Pakistan. Environ. Sci. Pollut. Res. 24 (7), 6819–6832. doi:10.1007/s11356-017-8423-9
Elahi, E., Zhixin, Z., Khalid, Z., and Xu, H. (2022b). Application of an Artificial Neural Network to Optimise Energy Inputs: An Energy-And Cost-Saving Strategy for Commercial Poultry Farms. Energy 244, 123169. doi:10.1016/j.energy.2022
Görg, H., and Strobl, E. (2007). The Effect of R&D Subsidies on Private R&D. Economica 74 (294), 215–234. doi:10.2139/ssrn.86408510.1111/j.1468-0335.2006.00547.x
Gu, H., Bian, F., and Elahi, E. (2020a). Effect of Air Pollution on Female Labor Supply: an Empirical Analysis Based on Data of Labor Force Dynamic Survey of China. Soc. Work Public Health 35 (4), 187–196. doi:10.1080/19371918.2020.1764433
Gu, H., Cao, Y., Elahi, E., and Jha, S. K. (2019). Human Health Damages Related to Air Pollution in China. Environ. Sci. Pollut. Res. 26 (13), 13115–13125. doi:10.1007/s11356-019-04708-y
Gu, H., Yan, W., Elahi, E., and Cao, Y. (2020b). Air Pollution Risks Human Mental Health: an Implication of Two-Stages Least Squares Estimation of Interaction Effects. Environ. Sci. Pollut. Res. 27 (2), 2036–2043. doi:10.1007/s11356-019-06612-x
Ham, J. C., Swenson, C., İmrohoroğlu, A., and Song, H. (2011). Government Programs Can Improve Local Labor Markets: Evidence from State enterprise Zones, Federal Empowerment Zones and Federal enterprise Community. J. Public Econ. 95 (7-8), 779–797. doi:10.1016/j.jpubeco.2010.11.027
Hanson, A., and Rohlin, S. (2013). Do spatially Targeted Redevelopment Programs Spillover? Reg. Sci. Urban Econ. 43 (1), 86–100. doi:10.1016/j.regsciurbeco.2012.05.002
He, J., and Tian, X. (2013). The Dark Side of Analyst Coverage: The Case of Innovation. J. Financial Econ. 109 (3), 856–878. doi:10.1016/j.jfineco.2013.04.001
Huang, Q., Peng, B., Elahi, E., and Wan, A. (2021). Evolution and Driving Mechanism of Ecological Security Pattern: a Case Study of Yangtze River Urban Agglomeration. Integr. Environ. Assess. Manag. 17 (3), 573–583. doi:10.1002/ieam.4358
Kafouros, M., Wang, C., Piperopoulos, P., and Zhang, M. (2015). Academic Collaborations and Firm Innovation Performance in China: The Role of Region-specific Institutions. Res. Pol. 44 (3), 803–817. doi:10.1016/j.respol.2014.11.002
Lee, C.-Y. (2011). The Differential Effects of Public R&D Support on Firm R&D: Theory and Evidence from Multi-Country Data. Technovation 31 (5-6), 256–269. doi:10.1016/j.technovation.2011.01.006
Li, B., and Wu, L. (2018). Development Zone and Enterprises’ Growth Research on Heterogeneity and Mechanism. China Ind. Econ. 4, 79–97. doi:10.19581/j.cnki.ciejournal.2018.04.005
Li, L., and Shen, G. (2015). Special Economic Zones, Comparative Advantage, and Industrial Structural Transformation. China Econ. Q. 14 (3), 885–910. doi:10.13821/j.cnki.ceq.2015.03.003
Li, X., Lai, X., and Zhang, F. (2021). Research on green Innovation Effect of Industrial Agglomeration from Perspective of Environmental Regulation: Evidence in China. J. Clean. Prod. 288, 125583. doi:10.1016/j.jclepro.2020.125583
Lin, Y., Xiang, W., and Yu, M. (2018). Place-based Industrial Policy and Firm Productivity. China Econ. Q. 17 (2), 781–800. doi:10.13821/j.cnki.ceq.2018.01.14
Liu, G. (2016). Analysis of the Incentive Effect of Tax Preference and Financial Subsidy Policies–An Empirical Study Based on the Perspective of Information Asymmetry Theory. Manag. World 10, 62. doi:10.19744/j.cnki.11-1235/f.2016.10.005
Liu, T. (2021). Study on the Influence of Commercial Credit on Technological Innovation of Enterprises Beijing: China Social Sciences Press.
Lu, Y., Wang, J., and Zhu, L. (2019). Place-based Policies, Creation, and Agglomeration Economies: Evidence from China's Economic Zone Program. Am. Econ. J. Econ. Pol. 11 (3), 325–360. doi:10.1257/pol.20160272
Mariotti, S., Piscitello, L., and Elia, S. (2010). Spatial Agglomeration of Multinational Enterprises: the Role of Information Externalities and Knowledge Spillovers. J. Econ. Geogr. 10 (4), 519–538. doi:10.2139/ssrn.142783810.1093/jeg/lbq011
Neumark, D., and Simpson, H. (2015). Place-based Policies In Handbook Of Regional and Urban Economics. Elsevier, 1197–1287. doi:10.1016/b978-0-444-59531-7.00018-1
Odhiambo, M. R. O., Abbas, A., Wang, X., and Elahi, E. (2020). Thermo-environmental Assessment of a Heated Venlo-type Greenhouse in the Yangtze River delta Region. Sustainability 12 (24), 10412. doi:10.3390/su122410412
Peng, B., Chen, H., Elahi, E., and Wei, G. (2020a). Study on the Spatial Differentiation of Environmental Governance Performance of Yangtze River Urban Agglomeration in Jiangsu Province of China. Land Use Policy 99, 105063. doi:10.1016/j.landusepol.2020.105063
Peng, B., Chen, S., Elahi, E., and Wan, A. (2021). Can Corporate Environmental Responsibility Improve Environmental Performance? an Inter-temporal Analysis of Chinese Chemical Companies. Environ. Sci. Pollut. Res. 28 (10), 12190–12201. doi:10.1007/s11356-020-11636-9
Peng, B., Huang, Q., Elahi, E., and Wei, G. (2019a). Ecological Environment Vulnerability and Driving Force of Yangtze River Urban Agglomeration. Sustainability 11 (23), 6623. doi:10.3390/su11236623
Peng, B., Li, Y., Elahi, E., and Wei, G. (2019b). Dynamic Evolution of Ecological Carrying Capacity Based on the Ecological Footprint Theory: A Case Study of Jiangsu Province. Ecol. indicators 99, 19–26. doi:10.1016/j.ecolind.2018.12.009
Peng, B., Li, Y., Wei, G., and Elahi, E. (2018a). Temporal and Spatial Differentiations in Environmental Governance. Ijerph 15 (10), 2242. doi:10.3390/ijerph15102242
Peng, B., Tu, Y., Elahi, E., and Wei, G. (2018b). Extended Producer Responsibility and Corporate Performance: Effects of Environmental Regulation and Environmental Strategy. J. Environ. Manage. 218, 181–189. doi:10.1016/j.jenvman.2018.04.068
Peng, B., Wang, Y., Elahi, E., and Wei, G. (2019c). Behavioral Game and Simulation Analysis of Extended Producer Responsibility System's Implementation under Environmental Regulations. Environ. Sci. Pollut. Res. 26 (17), 17644–17654. doi:10.1007/s11356-019-05215-w
Peng, B., Yan, W., Elahi, E., and Wan, A. (2022a). Does the green Credit Policy Affect the Scale of Corporate Debt Financing? Evidence from Listed Companies in Heavy Pollution Industries in China. Environ. Sci. Pollut. Res. 29 (1), 755–767. doi:10.1007/s11356-021-15587-7
Peng, B., Zhang, X., Elahi, E., and Wan, A. (2022b). Evolution of Spatial-Temporal Characteristics and Financial Development as an Influencing Factor of green Ecology. Environ. Dev. Sustain. 24 (1), 789–809. doi:10.1007/s10668-021-01469-y
Peng, B., Zheng, C., Wei, G., and Elahi, E. (2020b). The Cultivation Mechanism of green Technology Innovation in Manufacturing Industry: From the Perspective of Ecological Niche. J. Clean. Prod. 252, 119711. doi:10.1016/j.jclepro.2019.119711
Ren, H. e. a. (2018). No Confusion in Parks: 40 Years of Reform and Opening-Up Process in China's Industrial Parks. Shanghai, China: Shanghai People's Press.
Shen, D., Xia, M., Zhang, Q., Elahi, E., Zhou, Y., and Zhang, H. (2019). The Impact of Public Appeals on the Performance of Environmental Governance in China: A Perspective of Provincial Panel Data. J. Clean. Prod. 231, 290–296. doi:10.1016/j.jclepro.2019.05.089
Sheng, X., Peng, B., Elahi, E., and Wei, G. (2019). Regional Convergence of Energy-Environmental Efficiency: from the Perspective of Environmental Constraints. Environ. Sci. Pollut. Res. 26 (25), 25467–25475. doi:10.1007/s11356-019-05749-z
Sui, H. (2017). Study on the Influence of Foreign Direct Investment on the Quality of Economic Growth: Mechanism, Effect and Structural Evolution Beijing: Post and Telecom Press.
Sun, X., Guo, X., and Wang, Y. (2018). Industrial Relocation, Elements Agglomeration and Regional Economic Development. Manag. World 34 (05), 47–62. doi:10.19744/j.cnki.11-1235/f.2018.05.004
Tu, Y., Peng, B., Elahi, E., and Wu, W. (2020). Initiator or Intermediary? A Case Study on Network Relation of Environmental Regulatory Capture in China. Ijerph 17 (24), 9152. doi:10.3390/ijerph17249152
Tu, Y., Peng, B., Wei, G., Elahi, E., and Yu, T. (2019). Regional Environmental Regulation Efficiency: Spatiotemporal Characteristics and Influencing Factors. Environ. Sci. Pollut. Res. 26 (36), 37152–37161. doi:10.1007/s11356-019-06837-w
Wang, F., Cai, W., and Elahi, E. (2021). Do Green Finance and Environmental Regulation Play a Crucial Role in the Reduction of CO2 Emissions? an Empirical Analysis of 126 Chinese Cities. Sustainability 13 (23), 13014. doi:10.3390/su132313014
Wang, J. (2013). The Economic Impact of Special Economic Zones: Evidence from Chinese Municipalities. J. Dev. Econ. 101, 133–147. doi:10.1016/j.jdeveco.2012.10.009
Wang, Q., Qu, J., Wang, B., Wang, P., and Yang, T. (2019a). Green Technology Innovation Development in China in 1990-2015. Sci. Total Environ. 696, 134008. doi:10.1016/j.scitotenv.2019.134008
Wang, Y. (2020). Changes Unseen in a century, High-Quality Development, and the Construction of a New Development Pattern. Manag. World 36 (12), 1–13. doi:10.19744/j.cnki.11-1235/f.2020.0179
Wang, Y., Peng, B., Wei, G., and Elahi, E. (2019b). Comprehensive Evaluation and Spatial Difference Analysis of Regional Ecological Carrying Capacity: A Case Study of the Yangtze River Urban Agglomeration. Ijerph 16 (18), 3499. doi:10.3390/ijerph16183499
Wei, S.-J. (1995). The Open Door Policy and China’s Rapid Growth: Evidence from City-Level Data. Growth Theories in Light of the East Asian Experience 4, 73–104. doi:10.7208/9780226386980
Wu, B., Peng, B., Wei, W., and Ehsan, E. (2021a). A Comparative Analysis on the International Discourse Power Evaluation of Global Climate Governance. Environ. Dev. Sustain. 23 (8), 12505–12526. doi:10.1007/s10668-020-01180-4
Wu, M., Liu, C., and Huang, J. (2021b). The Technological Innovation Effect of Special Economic Zones Policy —Evidence from Patent Data. China Econ. Q. 21 (05), 1817–1838. doi:10.13821/j.cnki.ceq.2021.05.15
Yuan, J., Fan, W., and Cheng, C. (2016). Tax Preference and Technical Innovation of Enterprises: An Empirical Study Based on Chinese Listed Companies. Taxation Res. doi:10.19376/j.cnki.cn11-1011/f.2016.10.007
Zhang, H., Xu, Z., Sun, C., and Elahi, E. (2018). Targeted Poverty Alleviation Using Photovoltaic Power: Review of Chinese Policies. Energy Policy 120, 550–558. doi:10.1016/j.enpol.2018.06.004
Zhang, H., Yang, J., Ren, X., Wu, Q., Zhou, D., and Elahi, E. (2020). How to Accommodate Curtailed Wind Power: A Comparative Analysis between the US, Germany, India and China. Energ. Strategy Rev. 32, 100538. doi:10.1016/j.esr.2020.100538
Zhao, X., Peng, B., Elahi, E., Zheng, C., and Wan, A. (2020). Optimization of Chinese Coal-Fired Power Plants for Cleaner Production Using Bayesian Network. J. Clean. Prod. 273, 122837. doi:10.1016/j.jclepro.2020.122837
Zhao, Y., Peng, B., Elahi, E., and Wan, A. (2021). Does the Extended Producer Responsibility System Promote the green Technological Innovation of Enterprises? an Empirical Study Based on the Difference-In-Differences Model. J. Clean. Prod. 319, 128631. doi:10.1016/j.jclepro.2021.128631
Zhong, Z., Peng, B., and Elahi, E. (2021). Spatial and Temporal Pattern Evolution and Influencing Factors of Energy-Environmental Efficiency: A Case Study of Yangtze River Urban Agglomeration in China. Energ. Environ. 32 (2), 242–261. doi:10.1177/0958305X20923114
Zhong, Z., Peng, B., Xu, L., Andrews, A., and Elahi, E. (2020). Analysis of Regional Energy Economic Efficiency and its Influencing Factors: A Case Study of Yangtze River Urban Agglomeration. Sustainable Energ. Tech. Assessments 41, 100784. doi:10.1016/j.seta.2020.100784
Zhou, J., Raza, A., and Sui, H. (2021). Infrastructure Investment and Economic Growth Quality: Empirical Analysis of China's Regional Development. Appl. Econ. 53 (23), 2615–2630. doi:10.1080/00036846.2020.1863325
Zulfiqar, M., and Hussain, K. (2020). CEO Compensation and Firm Innovation: Moderating Role of Ownership Concentration. Int. J. Innov. Mgt. 24 (06), 2050058. doi:10.1142/S1363919620500589
Zulfiqar, M., Hussain, K., Yousaf, M. U., Sohail, N., and Ghafoor, S. (2020a). Moderating Role of CEO Compensation in Lean Innovation Strategies of Chinese Listed Family Firms. Corporate Governance: Int. J. Business Soc. doi:10.1108/CG-03-2019-0092
Zulfiqar, M., Yousaf, M. U., Islam, M. R., and Ghafoor, S. (2020b). Family Firms Propensity to Lean Innovation in the Emerging Economy: a Moderating Role of Executive's Compensation. J. Fam. Business Manag. doi:10.1108/JFBM-11-2018-0057
Keywords: special economic zones, green technology innovation, agglomeration effect, preferential policy subsidies, green development
Citation: Liu X, Zhang J, Liu T and Zhang X (2022) Can the Special Economic Zones Promote the Green Technology Innovation of Enterprises? An Evidence From China. Front. Environ. Sci. 10:870019. doi: 10.3389/fenvs.2022.870019
Received: 05 February 2022; Accepted: 16 February 2022;
Published: 28 March 2022.
Edited by:
Ehsan Elahi, Shandong University of Technology, ChinaReviewed by:
Muhammad Zulfiqar, Dongbei University of Finance and Economics, ChinaCopyright © 2022 Liu, Zhang, Liu and Zhang. This is an open-access article distributed under the terms of the Creative Commons Attribution License (CC BY). The use, distribution or reproduction in other forums is permitted, provided the original author(s) and the copyright owner(s) are credited and that the original publication in this journal is cited, in accordance with accepted academic practice. No use, distribution or reproduction is permitted which does not comply with these terms.
*Correspondence: Tinghua Liu, aGFkZHkxMDA5QDE2My5jb20=
Disclaimer: All claims expressed in this article are solely those of the authors and do not necessarily represent those of their affiliated organizations, or those of the publisher, the editors and the reviewers. Any product that may be evaluated in this article or claim that may be made by its manufacturer is not guaranteed or endorsed by the publisher.
Research integrity at Frontiers
Learn more about the work of our research integrity team to safeguard the quality of each article we publish.