 Jonathan J. Tyler1,2*
 Jonathan C. Marshall3,4
 Cameron Schulz3Cameron Barr2,5Harald Hofmann6Joanna J. Blessing3Kelsey McCoy7Glenn B. McGregor3John Tibby2,5
- 1Department of Earth Sciences, The University of Adelaide, Adelaide, SA, Australia
- 2Sprigg Geobiology Centre, The University of Adelaide, Adelaide, SA, Australia
- 3Department of Environment and Science, Queensland Government, Brisbane, QLD, Australia
- 4Australian Rivers Institute, Griffith University, Nathan, QLD, Australia
- 5Department of Geography, Environment and Population, The University of Adelaide, Adelaide, SA, Australia
- 6School of Earth and Environmental Sciences, The University of Queensland, Brisbane, QLD, Australia
- 7Ecology and Evolutionary Biology Department, University of Colorado, Boulder, CO, United States
Over the first two decades of the 21st century, many wetlands in eastern Australia exhibited declining water levels, causing concern for communities and environmental managers and raising questions about the roles of climate change and other human activity in these water level declines. In this context we examine the causes of water level variability in four wetlands on North Stradbroke Island (Minjerribah), in the humid subtropics of south-eastern Queensland, Australia, using a combination of hydrological and water isotope monitoring and modelling. North Stradbroke Island has a high concentration of wetlands perched above the regional water table, with cultural and ecological significance, and value for palaeoclimate research. From 2015 to 2019, wetland water depths decreased markedly at all sites, coinciding with increases in oxygen isotope ratios in surface waters. The data indicate that climate, specifically a decrease in precipitation relative to evaporation, was responsible for those declining water levels, and that groundwater extraction did not play a critical role. At two of the sites—both palustrine wetlands—declining surface water levels led to intermittent connectivity with the local perched aquifers. At the other two sites, which are both shallow lakes, the surface waters were constantly fed by perched groundwater. The hydrology of the two lakes was modelled using simple mass balance. However, in order to accurately model lake level change, it was necessary to vary catchment runoff and lake outflow via groundwater through time, highlighting complexity in projecting future hydrological change in these lakes. The long term resilience of these lakes depends on a combination of rainfall regime and the balance between catchment runoff and groundwater throughflow, the future of which is highly uncertain. As a consequence, continued efforts to project future hydroclimate and to model the complex hydrology of subtropical wetlands are essential.
Introduction
Lentic waterbodies that retain permanent to semi-permanent water (hereto referred to as “wetlands”) are important but uncommon landscape features on mainland Australia, even across large tracts of the humid eastern and south-eastern part of the continent. The wetlands that do exist hold significant cultural, ecological and recreational value. For First Nations people, many wetland plant and animal species have some form of traditional use or cultural importance, such as totemic significance (WetlandInfo, 2013). More broadly, wetlands are economically and culturally important locations for tourism, fishing and watersports. As is the case in many parts of the world (Adrian et al., 2009; Lei et al., 2014; Havens and Steinman, 2015; Me et al., 2018; Remmer et al., 2020) Australia’s wetlands are threatened by climate change, with declining water levels in many locations likely to continue in response to decreases in effective moisture projected under future warming scenarios (Jones et al., 2001; Kirono et al., 2012; Yihdego et al., 2015; Yihdego et al., 2016; Grose et al., 2020). In addition, wetland sediments are important archives of past climate and hydrological change, providing context for contemporary and future climate impacts upon aquatic systems (Barr et al., 2013; Mills et al., 2013), as well as documenting the frequency and drivers of extreme climate variability, including past floods and droughts (Barr et al., 2014; Rouillard et al., 2016; Tibby et al., 2018; Barr et al., 2019). However, the effects of climatic change on wetland hydrology, as well as on the geochemical and ecological proxies of change which are recorded in the sediments, varies between sites according to a number of factors including local geology, landscape topography, wetland bathymetry and vegetation (Battarbee, 2000; Jones et al., 2001; Leng and Marshall, 2004; Kirono et al., 2012; Wigdahl et al., 2014; Tyler et al., 2015; Yihdego et al., 2015). Therefore, there is a need to understand the drivers of contemporary hydrological change in Australian wetlands to both inform current and future management and to better constrain reconstructions of past climate variability.
Changes in wetland hydrology and their underlying causes can be investigated using oxygen and hydrogen isotopes of water. The 18O/17O/16O and 2H/1H isotope ratios of water are common tracers of contemporary and past climate and hydrological change, responding to a combination of physical processes throughout the water cycle, such as evaporation, transport, mixing and condensation, amongst others (Gat, 2010). In most regions, the oxygen and hydrogen isotopic composition of precipitation varies seasonally or according to weather type (Crawford et al., 2013; Tyler et al., 2016; Hollins et al., 2018), providing a tracer for the timing of wetland and groundwater recharge and associated processes (Meredith et al., 2013; King et al., 2015). Furthermore, enrichment in the heavier 18O and 2H isotopes is a useful indicator of evaporation, which can be used to partition the pathways of water loss from wetland systems (Gibson et al., 1996; Gibson and Edwards, 2002; Meredith et al., 2015; Skrzypek et al., 2015; Remmer et al., 2020). Finally, the isotope composition of past surface water is recorded by a plethora of inorganic and organic materials preserved in sediments, including inorganic carbonate mineral precipitates, carbonate and silicate biominerals, and the molecular remains of biological tissues (Leng, 2006; Konecky et al., 2020). As a consequence, oxygen and hydrogen isotope analysis of wetland sediments is a mainstay of palaeoclimate research, particularly when underpinned by a robust understanding of contemporary hydrology (Leng and Marshall, 2004).
Investigations into the response of wetland hydrology and isotope geochemistry to climate change have been conducted worldwide (Rietti-Shati et al., 2000; Gibson and Edwards, 2002; Noon et al., 2002; Leng and Anderson, 2003; Darling et al., 2006; Russell and Johnson, 2006; Tyler et al., 2007; Henderson and Shuman, 2009; Lei et al., 2014; Havens and Steinman, 2015; Remmer et al., 2020). However, few studies have addressed wetlands in the humid subtropics, and fewer still on the types of shallow, densely vegetated lacustrine and palustrine wetlands which are typical in these regions. The climate of the humid subtropics is usually characterised by intense summer rainfall, which coincides with high seasonal temperature maxima. Consequently, a fraction of wetland and groundwater recharge in the humid subtropics often overlaps with the period of maximum evaporation. In shallow wetlands, including seasonally ephemeral systems, the absence of surface waters can be compensated by significant reserves of water in the sediments, supporting ecosystems which are dominated by emergent aquatic flora (Marshall and McGregor, 2011; Specht and Stubbs, 2011). The extent to which wetland surface hydrology is linked to the underlying perched aquifer is therefore critical, not only for understanding the resilience of such wetlands to climate change, but also for the use of isotope tracers in wetland sediments to reconstruct past climates.
The wetlands of North Stradbroke Island (Minjerribah), eastern Australia (Figure 1), are of particular interest due to their ecological and cultural significance, as well as their importance for palaeoclimate research. North Stradbroke Island (NSI) is traditionally owned and inhabited by the Quandamooka people, for whom the island’s wetlands represent important spiritual sites (Arthington et al., 2019). The wetlands host unique biodiversity with complex evolutionary histories (Page et al., 2012), including endemic algal species (Rott et al., 2006; McGregor, 2018), and the higher plant species Eleocharis difformis (Blue Lake eel grass) and Olearia hygrophila (North Stradbroke Island swamp daisy), as well as several rare and threatened plants and animals such as Phaius australis (swamp orchid), Nannoperca oxleyana (Oxleyan pygmy perch), Xeromys myoides (water mouse) and Cherax robustus (wallum swamp crayfish) (Marshall et al., 2006; Marshall et al., 2011). Importantly, the wetlands on NSI include some of Australia’s oldest extant systems, with long, sometimes continuous sedimentary records that span several tens of thousands of years (Moss et al., 2013; Tibby et al., 2017; Cadd et al., 2018; Kemp et al., 2020; Lewis et al., 2020). For example, the basal organic sediments of Fern Gully Lagoon were dated to ∼210,000 years before present (Kemp et al., 2020) and those from Welsby Lagoon were dated to ∼80,000 years before present (Lewis et al., 2020). Such long sediment archives are rare for continental Australia and their presence on NSI provides enormous potential for palaeoclimate reconstructions aimed at understanding long-term climatic variability in the region, which is intimately linked to the El Niño Southern Oscillation (Barr et al., 2019). Declines in water levels in several NSI wetlands over the last two decades have raised concerns about the future of these sites and the causes of these declines (Figure 2). This study aims to address these concerns by examining the effect of climate on wetland hydrology, and by considering the effects of direct human impact on the wetlands, specifically groundwater extraction for potable water supply on both the island and mainland as well as disturbances to the groundwater system as a consequence of intensive sand mining, and irrigation.
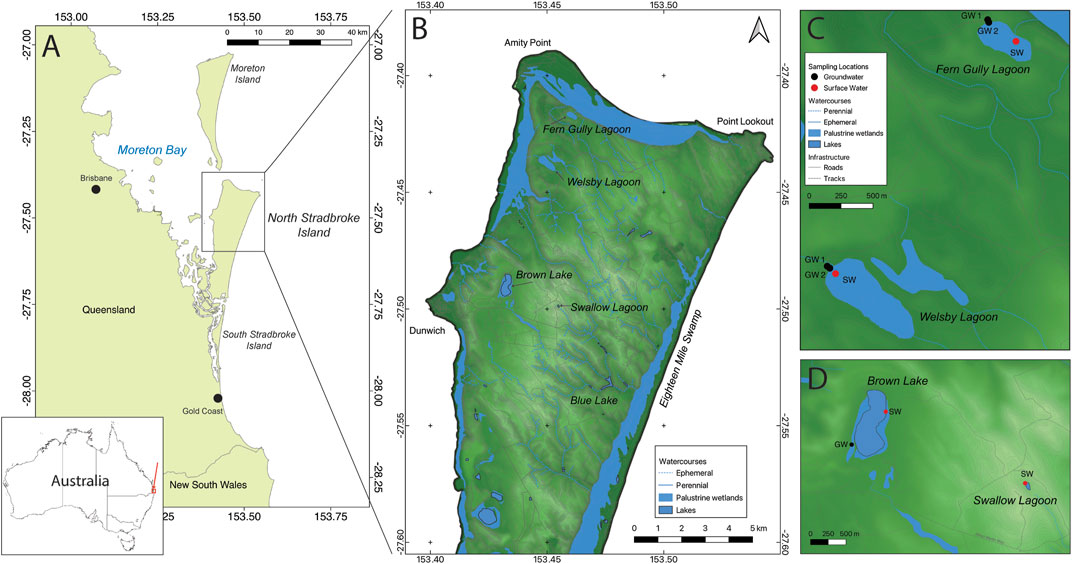
FIGURE 1. Map of (A) Australia; (B) North Stradbroke Island (Minjerribah), indicating location of studied wetlands; enlarged maps, including sampling locations at (C) Welsby Lagoon and Fern Gully Lagoon; and (D) Swallow Lagoon and Brown Lake. Red points indicate surface water monitoring and sampling locations, black points indicate groundwater monitoring and sampling locations.
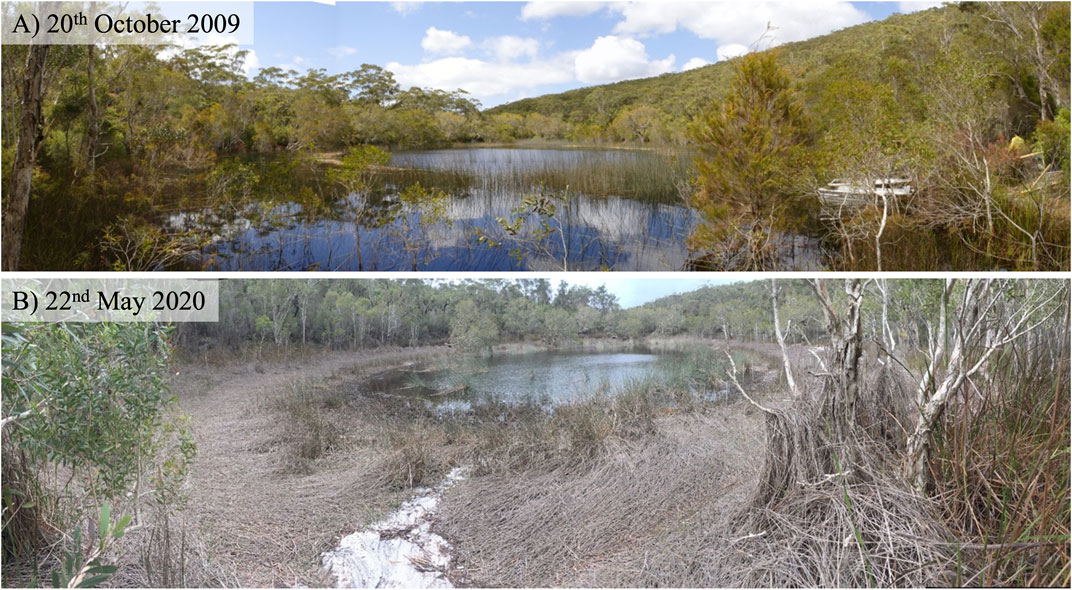
FIGURE 2. Photographs of Swallow Lagoon taken at the same location in (A) 20 October 2009 and (B) 22 May 2020 demonstrating variability in wetland water level.
North Stradbroke Island (Figure 1) is part of a wider ancient sand dune system which includes the Cooloola Sand Mass, K’gari (Fraser Island) and Moreton Island (Patton et al., 2019). The groundwater hydrology of the sand islands is characterised by a regional groundwater aquifer with a large unsaturated zone in the central parts and small isolated perched aquifer systems which sit above the regional groundwater system. Many of the wetlands in this region are in some way associated with groundwater—either through connection to the regional water table or, more commonly, local perched aquifers. It is argued that this association with groundwater sustains the wetlands during low rainfall periods, thereby providing important drought refugia (Marshall et al., 2011). The longevity of the wetlands over multiple millennia supports this hypothesis; however, contemporary and future climates have limited analogues in the past (Hansen et al., 2006; Marcott et al., 2013) and the response of these systems to future warming is uncertain. Understanding the hydrology of wetlands of the island, including their connectedness to regional and perched groundwater systems, is therefore relevant for significant wetlands across a much wider geographical region. The issue of surface and groundwater resilience to climate change directly aligns with several of the “Twenty-three unsolved questions in hydrology,” as compiled by Blöschl et al. (Blöschl et al., 2019). To this end, this paper reports the results of hydrological and stable isotope monitoring and modelling at four wetlands on NSI, including systems which have been both permanent and ephemeral over recent decades.
Study Site Description
At approximately 285 km2, North Stradbroke Island (27°27′S, 153°28′E) is the second largest sand island in the world and is located in Moreton Bay, south-eastern Queensland, Australia. The surface geology of the island primarily consists of southeast-to northwest-oriented parabolic dunes which reach an elevation of 239 m and were sequentially deposited during glacial sea-level lowstands (Ward, 2006; Brooke et al., 2015; Ellerton et al., 2020). Located in the subtropical climate zone of eastern Australia, the island experiences warm, humid summers (DJF mean maximum daily temperature 29.1°C) and mild, dry winters (JJA mean maximum daily temperature 21.7°C) (Bureau of Meteorology (BoM), 2020) with the majority (∼62%) of annual precipitation (1,435 mm) occurring during the Austral summer and autumn months of December to May (data from Point Lookout BoM station No. 40209, 1997–2022) (Bureau of Meteorology (BoM), 2020).
There are over 70 wetlands on North Stradbroke Island (Leach, 2011). These include rare groundwater window lakes (Barr et al., 2013), spring-fed palustrine “swamps” (Mettam et al., 2011; Moss et al., 2011), streams, and many perched lakes and swamps that are hydrologically isolated from the regional aquifer by indurated sand layers (Brooke et al., 2008; Leach, 2011; Marshall et al., 2011). Examples of perched wetlands include Welsby Lagoon, Fern Gully Lagoon, Swallow Lagoon and Brown Lake; the foci of this study (Table 1). It should be noted these are not “lagoons” in the true sense of the term; rather, Welsby and Fern Gully are palustrine wetlands, while Swallow Lagoon is a freshwater lake.
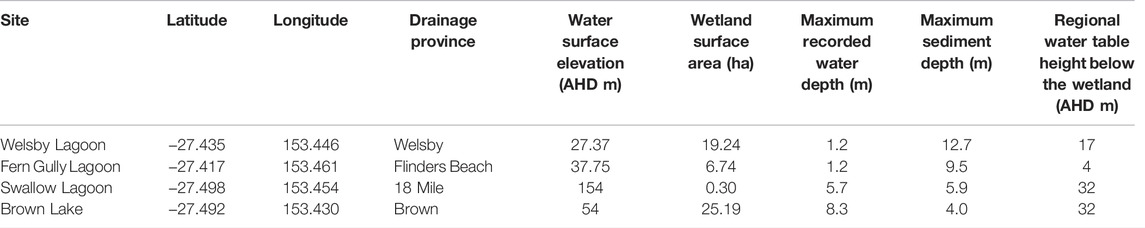
TABLE 1. Site details. The height of each wetland above the regional water table was determined by using the modelled average depth to water table at the end of an extended dry period in the modelled time series (August 1917) using the NSI regional groundwater model. This elevation was generated as a GIS layer, and overlaid on the wetlands (McGregor and Marshall, 2013).
Welsby Lagoon
Located in the northwest of the island (Figure 1), Welsby Lagoon is a shallow (∼1.2 m maximum water depth) palustrine wetland. The wetland lacks major stream inflow and outflow connections and is the surface expression of the perched freshwater aquifer of the Welsby drainage province, which drains an area of approximately 538 ha (∼2% of the island) (Leach, 2011). As is the case with many wetlands on the island, including Fern Gully Lagoon, the wetland is dominated by emergent aquatic plants including Baumea species and Lepironia articulata, along with submerged Cycnogeton procerum (Marshall and McGregor, 2011).
Fern Gully Lagoon
Fern Gully Lagoon is a shallow (1.2 m maximum depth) palustrine wetland. It lies within a shallow bowl of vegetated dunes at the north-western end of North Stradbroke Island in the Flinders Beach drainage province (Leach, 2011). The wetland has two above-ground outflows, the largest being to the eponymous Fern Gully, through which outflow has been reported by local residents only very occasionally though the period of this study.
Swallow Lagoon
Swallow Lagoon is a small, perched lake that sits high in the dunes. Swallow Lagoon has no inflow or outflow streams and, as such, is effectively the surface expression of a small aquifer contained within the surrounding sand. There is an outflow channel to the south-east of the lake but its thalweg is at least 0.7 m above maximum recorded lake elevation and was not observed flowing during the study period.
Brown Lake
The largest lake on the island, Brown Lake (or Bummiera in the Quandamooka language) is a popular tourist destination and holds significant cultural value for the Quandamooka people. Except for very high precipitation events, the lake has no active surface inflow or outflow streams. An outflow channel to the south has been inactive during the monitored period. Previous studies have noted that the depth of Brown Lake can fluctuate substantially over a relatively short period of time (Laycock, 1975; Laycock, 1978). Laycock (Laycock, 1978) found lake-level fluctuation in the range of 3.49 m over “a number of years,” while Lee-Manwar et al. (Lee-Manwar et al., 1980) reported a fall of 3.9 m between May 1974 and July 1977. This is consistent with current monitoring which recorded a water level decline of 3.5 m between June 2012 and December 2019.
Methods
This study used a combination of topographic surveys and both hydrological and isotope geochemical monitoring. These data were used to develop water mass balance models, which in turn were used to examine wetland hydrological responses to future climate change.
Bathymetric Surveys
The bathymetries of Brown Lake and Swallow Lagoon were surveyed using a gridded network of depth, position and time every 2 s recorded by a boat mounted sonar and GPS system. Each survey consisted of a longitudinal section, a near-perimeter trace and 40 cross sections. Perimeters were hand drawn to encompass the survey points, and fit available base maps. Comparisons with a whole of NSI digital elevation model (DEM) showed they were compatible. Brown Lake was surveyed on 11 March 2011, when the water surface was 57.53 m relative to Australian Height Datum (AHD) and again on 18 May 2018, when the water surface was 54.75 m (AHD). Swallow Lagoon was also surveyed twice; on 20 October 2009, when the water surface was 154.21 m (AHD) and on 11 March 2011, when the water surface was 154.96 m (AHD). The two Brown Lake surveys were merged to create a final DEM (Supplementary Figure S1). The 2018 survey data were adjusted by adding 2.6 m to account for lower water levels at this time. This was calculated by averaging the difference in survey points from the two surveys that were within 0.5 m of each other, resulting in 100 such points. As a validation check, the wetland volume from a DEM generated from the 2018 survey alone was compared with that from the merged survey DEM at the same depth, and was found to be very similar. The same process was used to combine Swallow Lagoon surveys by adding 0.75 m to the 2009 data to correspond to the 2011 data. These pooled observations were used to generate DEMs of each wetland by linearly interpolating between survey points (ArcGIS 10.4.1, ESRI). Wetland volume and surface area were calculated and tabulated at 0.01 m depth intervals from full wetland extent to empty (ArcGIS, 10.4.1, 3d analyst tools, ESRI). To date, no bathymetric surveys have been completed for Welsby Lagoon and Fern Gully Lagoon, due to the logistical challenge of traversing and depth sounding the shallow, densely vegetated wetlands.
Wetland Hydrological Monitoring
Wetland and aquifer water levels were monitored using a network of barometrically-compensated diver loggers (Van Essen, Delft) in hand-installed piezometers recording at 60-min intervals. Manual water level measurements were made every 1–3 months to validate the logger data. Regional groundwater table head heights were monitored at bore 14400099, which is located near to Brown Lake. This bore samples the regional, island overarching aquifer, and is slotted between 36.4 and 42.4 m below ground surface. Water measurements were recorded manually, on average 3–4 times each year during the period 2011–2020. Monitored water levels are reported relative to AHD to provide a common reference elevation across all locations. All surface and groundwater levels were laser-levelled from formal Queensland Government survey points to ensure that all were correct to within <5 mm.
Daily rainfall and evaporation data from the Bureau of Meteorology stations at Dunwich and Point Lookout, which are closest to the wetlands, were obtained from the SILO Patched Point Dataset, which combines observations and interpolations to provide daily data for a selected set of weather stations (DES, 2019).
Monthly rainwater samples were collected using a purpose-built rainfall sampler, consisting of a 90 mm diameter polycarbonate tube (400 mm length; total volume ∼2.54 L) with an inbuilt funnel and a tap in the bottom to collect the water sample [e.g. 40]. A non-water soluble evaporation barrier was used (silicone or paraffin oil), and replenished after each collection. Wetland surface waters were collected monthly in 50 ml high-density polyethylene (HDPE) bottles from the edge of each wetland at the locations marked in Figure 1. When the water level dropped beneath the sediment surface at Welsby Lagoon and Fern Gully Lagoon, sediment interstitial water was collected by digging a hole to 20 cm depth and collecting the water that subsequently filled the hole. This interstitial water is referred to as “peat water,” given the peaty nature of the surficial sediments at Welsby and Fern Gully Lagoons. Shallow groundwater samples were collected from piezometers installed beside Welsby Lagoon and Fern Gully Lagoon (Figure 1). Groundwater samples were collected from the piezometer pipe using a battery powered slimline centrifugal groundwater pump after initially purging three times the piezometer pipe volume to ensure the collection of fresh aquifer water. All water samples were collected in carefully sealed HDPE bottles which were completely filled to avoid any headspace. Samples were refrigerated at 4°C until analysis.
Isotope Analyses
Oxygen and hydrogen isotope analysis was performed at Flinders Analytical, Flinders University, South Australia, on a Picarro L2130-I Isotope Water Analyser. Samples were calibrated against in-house laboratory standards consisting of desalinated seawater (δ2H = 0.95‰, δ18O = 7.4‰) and bottled water (δ2H = −73.8‰, δ18O = −10.36‰). A rainwater sample (δ2H = −52.1‰, δ18O = −8.49‰) was used as an internal laboratory quality control.
Oxygen and hydrogen isotope ratios are referred to using the standard delta notation:
Where δ refers to either δ18O or δ2H in ‰, and R is the ratio 18O/16O or D/H respectively. All data are reported relative to the Vienna Standard Mean Ocean Water (V-SMOW).
Modelling Wetland Hydrology
Lake water mass balance was modelled for Swallow Lagoon and Brown Lake for December 2011 through to February 2020—the period for which lake depth monitoring data were collected. Models were developed using the EcoModeller software Waterhole Persistence Model plug-in (Lobegeiger et al., 2015). The model requires a detailed bathymetry of the wetland, relating wetland volume and surface area to depth at 0.01 m intervals, and calculates the mass balance of fluxes into (direct rainfall, runoff and groundwater) vs. out (outseepage, surface flow, evaporation) of the wetland to estimate change in wetland water depth through time. Data inputs to develop the model were daily rainfall (sourced from SILO) with evaporation estimated using Morton’s shallow lake model (Morton, 1983) (both for BoM station Dunwich 040537). A “surface flow” dummy variable was set to zero for the entire time series because of the absence of such flows during the monitored period. Parameters for runoff (catchment size) and outseepage were estimated as described below. The absence of bathymetric data prevented the modelling of Welsby Lagoon and Fern Gully Lagoon.
Water balance models were calibrated iteratively so that predicted water depth best matched the measured depth. Calibration was achieved by adjusting two key model parameters: the daily rate of seepage loss (seepage through the base and sides of the wetland in mm per day) and a catchment area multiplier to represent runoff and shallow throughflow. Seepage loss was initially assumed to be zero and increased so that water loss matched observed behaviour. Rainfall catchment area was initially set as the maximum area of the wetland from the DEM and adjusted accordingly to match observed increases in wetland depth associated with rainfall. Varying catchment area in the model is used as a proxy for variable catchment runoff (i.e., the fraction of catchment precipitation which is transported to the wetlands) which is assumed to be constant in the model. It should be stressed that we do not propose that the actual catchment area varied through time. The optimum parameter values for calibration were determined as the minimum Root Square Mean Errors (RSMEs) achieved. Calibration assumed no anthropogenic water extraction and no daily evaporation multiplier.
For both wetlands, initial calibration attempts were unable to match observed depth behaviour for the entire record and it was evident that different periods of the overall record required independent calibration. These periods were identified iteratively, based on dates where there were notable depth changes. In some cases these selections were suitable for accurate calibration, but in others they required further division. Eventually low RMSE (<0.1 m) calibrations for the entire record were achieved by dividing the Brown Lake record into five periods and the Swallow Lagoon record into eight, each with its own combination of model parameter values. The need to alter the model calibration parameters through time reflects complex changes in the efficiency of catchment runoff and wetland outseepage according to climate and the depth of the wetland. As a consequence, the model could not be validated against an independent test period and can only reliably serve to explain observations during the monitored period, rather than project into the future. The model was used to test the effect of a lengthy drought on water depths in Swallow Lagoon and Brown Lake by repeating the climate of the driest year on record (2019) for 22 years, with the seepage rate and catchment area parameters fixed as those identified to best fit the 2019 state of the wetlands. 2019 was identified as the driest year on record by calculating the annual totals of daily rainfall and evaporation from the Dunwich weather station, through the 1893 to 2019 period. Annual totals of each parameter were used to rank years from the lowest to highest rainfall and from the highest to lowest evaporation. A biplot of these ranks identified 2019 as having the least rain and most evaporation (Supplementary Figure S2). 22 year long pseudo-time series for both rainfall and evaporation were created by repeating the daily climate of 2019. Commencing from the wetland depths measured on 29 July, 2016, and again using the calibrated 2016–2020 models, the depth behaviour of Brown Lake and Swallow Lagoon was simulated under this scenario to assess if repeat occurrences of the driest year on record would result in the wetlands emptying and, if so, after how long.
Results
Climate Variability
Rainfall at Point Lookout varied markedly throughout the 4 years of monitoring (Figure 3). With the exception of 2015 (with 1,613 mm), the most recent 5 years of the monitoring period described here recorded below average rainfall with 2016 (868 mm) and 2019 (876 mm) being the two lowest annual rainfall totals since records began at Point Lookout in 1947. At Dunwich, on the west coast of NSI, the year 2019 experienced the lowest rainfall and the highest evaporation since records commenced in 1893 (BoM, 2020). Long term records on NSI indicate a dominance of summer rainfall; however, during the monitored period the month of June was consistently wet, with monthly precipitation ∼250 mm. Several years experienced annual maximum precipitation in February and March (250–350 mm), associated with late summer storms. The driest months were consistently August and September, which experienced ∼50 mm/month.
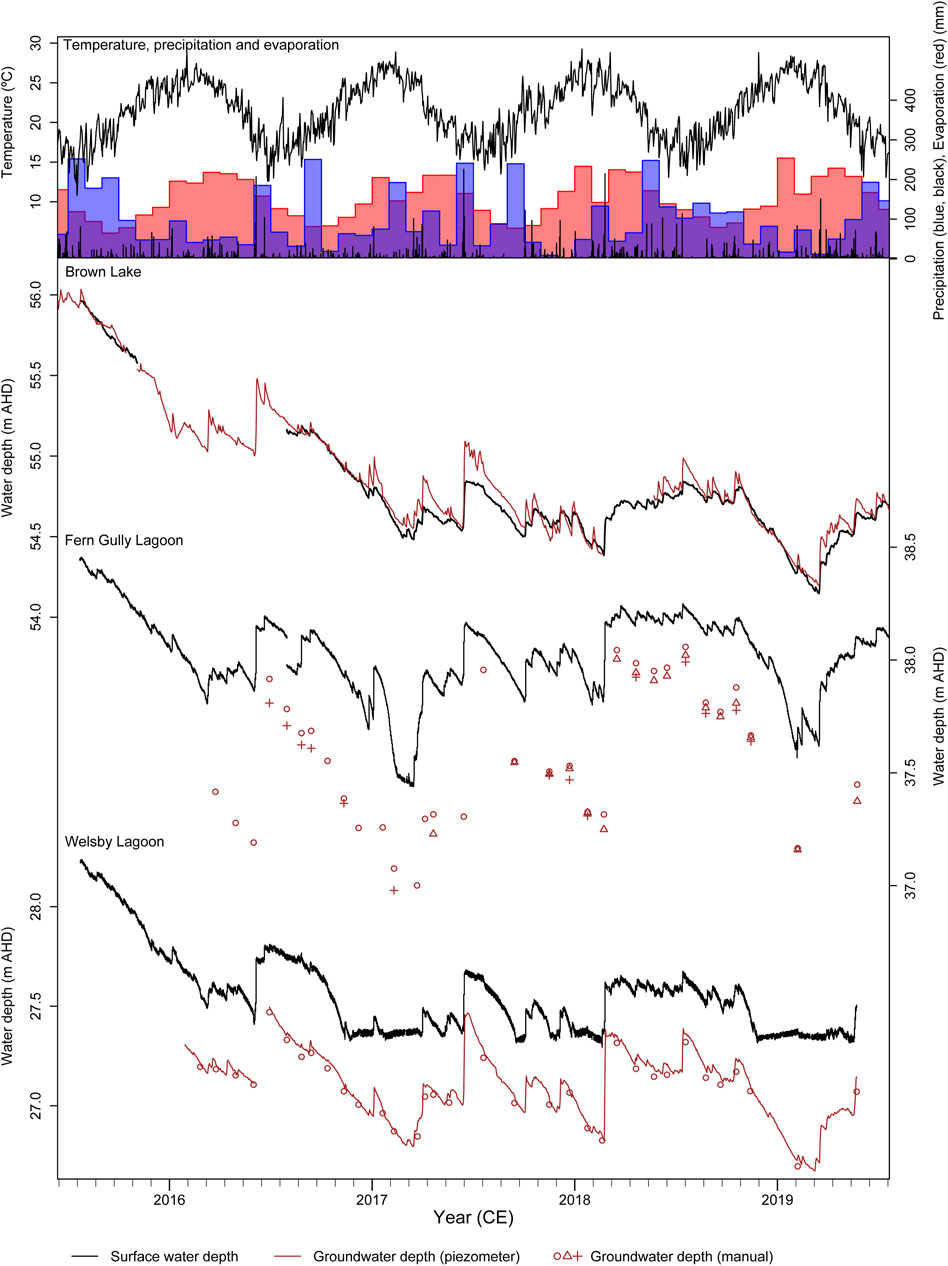
FIGURE 3. Comparison between surface and ground water levels at Brown Lake, Fern Gully Lagoon and Welsby Lagoon. In upper panel, continuous black line is daily mean air temperature, black vertical bars are daily total precipitation (multiplied by 2 to assist visibility), blue shaded area indicates monthly total precipitation and red shaded area indicates monthly total evaporation. Climate data represent the average of the four nearest grid points in the SILO database. In lower panels, black lines indicate continuously monitored surface water levels, red lines indicate continuously monitored groundwater levels and red symbols indicate manually determined groundwater levels at up to three different locations (indicated by different symbols) at each site.
During the 2015–2019 isotope monitoring period, daily temperature varied over a consistent seasonal cycle between 12 and 28°C (Figure 3). Modelled evaporation also exhibited a distinct seasonal cycle, albeit with minima and maxima (50–300 mm/month) lagged behind the measured temperature by approximately 1–2 months (Figure 3).
Variability in Surface and Groundwater Levels
Water depth logging commenced in December 2011, at Swallow Lagoon and Brown Lake and in July 2015, at Welsby Lagoon and Fern Gully Lagoon. For Swallow Lagoon, only surface water levels were monitored; however, at the other three sites both surface and groundwater depths were monitored. Wetland water depths declined from mid-2015 through to late 2019 (Figures 3, 4), although at Swallow Lagoon, for which a longer record is available, water depths had increased during the first half of 2015. The decline in water depth at Brown Lake stabilised by the beginning of 2017, fluctuating around a level of ∼54.6 m AHD except for a further short decrease in late 2018 (Figure 3). Water depth at Swallow Lagoon continued to fall throughout our study period (Figure 4). Groundwater level at Brown Lake, exhibited a similar pattern to surface water level, with both surface and groundwater levels being nearly identical during periods of low lake level, and with groundwater being higher by ∼0.2–0.3 m after periods of lake level rise (Figure 3).
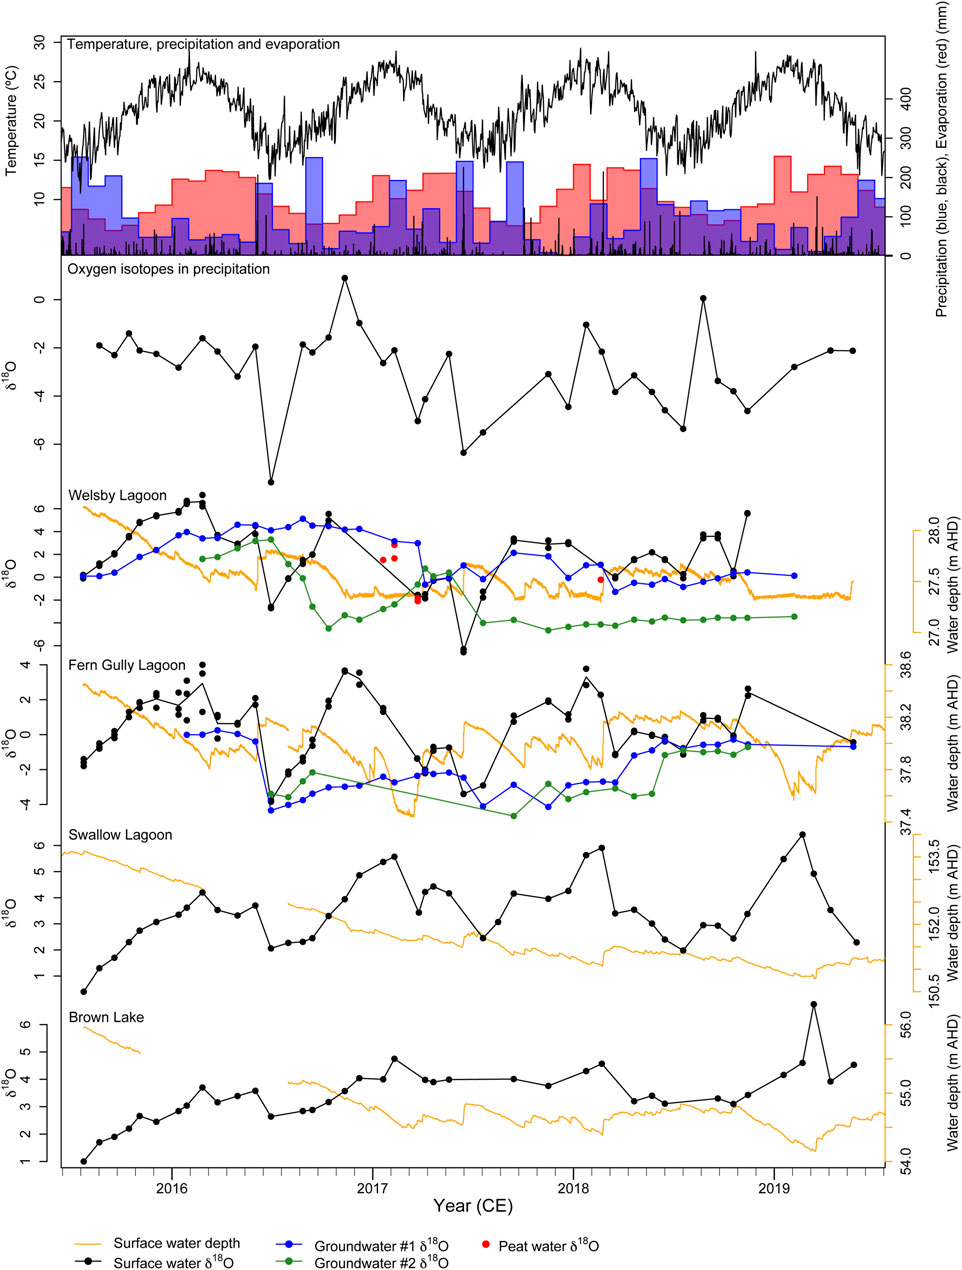
FIGURE 4. Comparison between oxygen isotope ratios of rainwater, surface waters and groundwater at Welsby Lagoon, Fern Gully Lagoon, Swallow Lagoon and Brown Lake. Climate data presented as in Figure 3. Black points and lines indicate δ18O of rainwater (collected at Welsby Lagoon) or surface water at all sites. For Weslby and Fern Gully Lagoons, blue and green points and lines indicate the δ18O of groundwater at two monitoring bores at each site. Red points indicate the δ18O of “peat water”—i.e. sediment interstitial water collected when surface water levels had dropped beneath the wetland sediment surface.
Surface water levels at Welsby and Fern Gully Lagoons persisted at or just below the sediment-water interface during most of the monitoring period, although water could still be sampled from saturated lagoonal sediments. The water depth at these two sites fell rapidly between July and December 2015, after which their hydrological regimes were characterised by brief episodes of rapid re-filling after rainfall (e.g. March 2016 and May 2017) followed by subsequent declines in water level over the course of one to five months (Figure 3). Groundwater depth at both Welsby and Fern Gully Lagoons was found to be consistently lower than surface water level, ranging from ∼0.2 m beneath surface water level during periods of wetland inundation, and ∼0.5 m beneath surface water level during periods of wetland drying (Figure 3).
Stable Isotope Variability
The δ18O of precipitation (herein referred to as δ18OP), sampled at Welsby Lagoon, fluctuated seasonally around a mean of –2.9‰ with a standard deviation of 1.7‰ between August 2015 to May 2019 (Figure 4). Notable low δ18OP values were recorded in June 2016 (–7.6‰), June-July 2017 (–6.4‰ and –5.5‰) and July 2018 (–5.4‰), all of which coincided with periods of high monthly precipitation (Figure 4). High δ18OP values of +0.9‰ and +0.1‰ were recorded for November 2016 and August 2018 (Figure 4).
δ18O in wetland surface and interstitial peat waters (herein referred to as δ18OL) at Welsby Lagoon fluctuated within a range of –6‰ to +7‰, with highs and lows coinciding with those in δ18OP, albeit with a greater range (Figure 4). Two periods of markedly increasing δ18OL at Welsby Lagoon coincided with periods of declining water level, between July 2015 and February 2016, and again between June 2016 and November 2016 (Figure 4). Interstitial peat waters collected between November 2016 and January 2017 had values consistent with the trend of the surface waters (Figure 4). The δ18O of water sampled at two shallow groundwater bores (δ18OGW) at Welsby Lagoon exhibited markedly different temporal patterns, despite being located only ∼13 m apart. δ18OGW variability at bore #1, located closer to the wetland, resembled a time-averaged surface water signal, with a period of gradually increasing δ18OGW values from 0‰ in June 2015 to ∼ +3‰ in September 2016, followed by a decline to ∼ –2‰ by April 2017 and subsequent stabilisation around that value for the rest of the monitored period (Figure 4). By contrast, δ18OGW at bore #2 was consistently lower than that at bore #1, except for a period during February–March 2017. δ18OGW at bore #2 exhibited a high of ∼ +2‰ in June 2016, followed by a decline to ∼ –5‰ by September 2016. A subsequent increase to ∼0‰ in March 2018 was followed by an immediate decline and stabilisation at ∼ –4‰ for the rest of the record (Figure 4).
Variability in δ18OL at Fern Gully Lagoon exhibited similar patterns to that at Welsby Lagoon, however within a narrower range, from –4‰ to +4‰ (Figure 4). The two groundwater bores sampled had water with similar, but not identical δ18OGW to each other, except for May 2018. A marked decline in δ18OGW occurred in May 2016, declining from –0.5‰ to –4‰, followed by a gradual increase in δ18OGW through to late 2019. This variability in δ18OGW at Fern Gully was generally 0–2‰ lower than surface waters throughout the record; however, during two notable periods, January to April 2016 and September 2016 to March 2017, marked 6‰ increases in δ18OL were not mirrored by δ18OGW, which remained relatively invariant (Figure 4).
No groundwaters were sampled at Swallow Lagoon or Brown Lake; however, δ18OL exhibited similar patterns throughout the monitored period with a range of 0 to +6‰ at Swallow Lagoon and +1 to +5‰ at Brown Lake (Figure 4). δ18OL in both lakes exhibited an increasing trend from July 2015 to February, 2017, punctuated by a period of lower δ18OL from June 2016 to December 2016 (Figure 4). Subsequently, δ18OL gradually decreased to ∼ +3‰ at both lakes, with a larger range of short term variability at Swallow Lagoon compared to Brown Lake, coinciding with overall lower and more stable water levels (Figure 4).
At all of the monitored wetlands, δ18O of surface waters correlated with equivalent δ2H with R2 exceeding 0.94 in all cases (Figure 5). Deviation from the δ18O-δ2H relationship defined by rainfall at Welsby Lagoon (a.k.a the Meteoric Water Line; MWL) is indicative of a local evaporation line (LEL), and the slopes of the LELs were consistent between Swallow Lagoon and Brown Lake, and similar between Welsby Lagoon and Fern Gully Lagoon (Figure 5). Where peat waters and groundwaters were sampled at Welsby Lagoon and Fern Gully Lagoon, the δ18O and δ2H of those waters fell close to the LELs defined by surface waters. At Swallow Lagoon and Brown Lake, the LEL intersects the MWL near to the mean of all rainfall samples; however, at Welsby Lagoon and Fern Gully Lagoon, the MWL-LEL intersects fall closer to the minimum δ18O and δ2H values associated with winter rainfall (Figure 5). As a consequence of the clearly defined LELs, δ18OL consistently correlates with the deuterium excess of wetland water at all locations, with R2 values ranging between 0.85–0.95 depending on site.
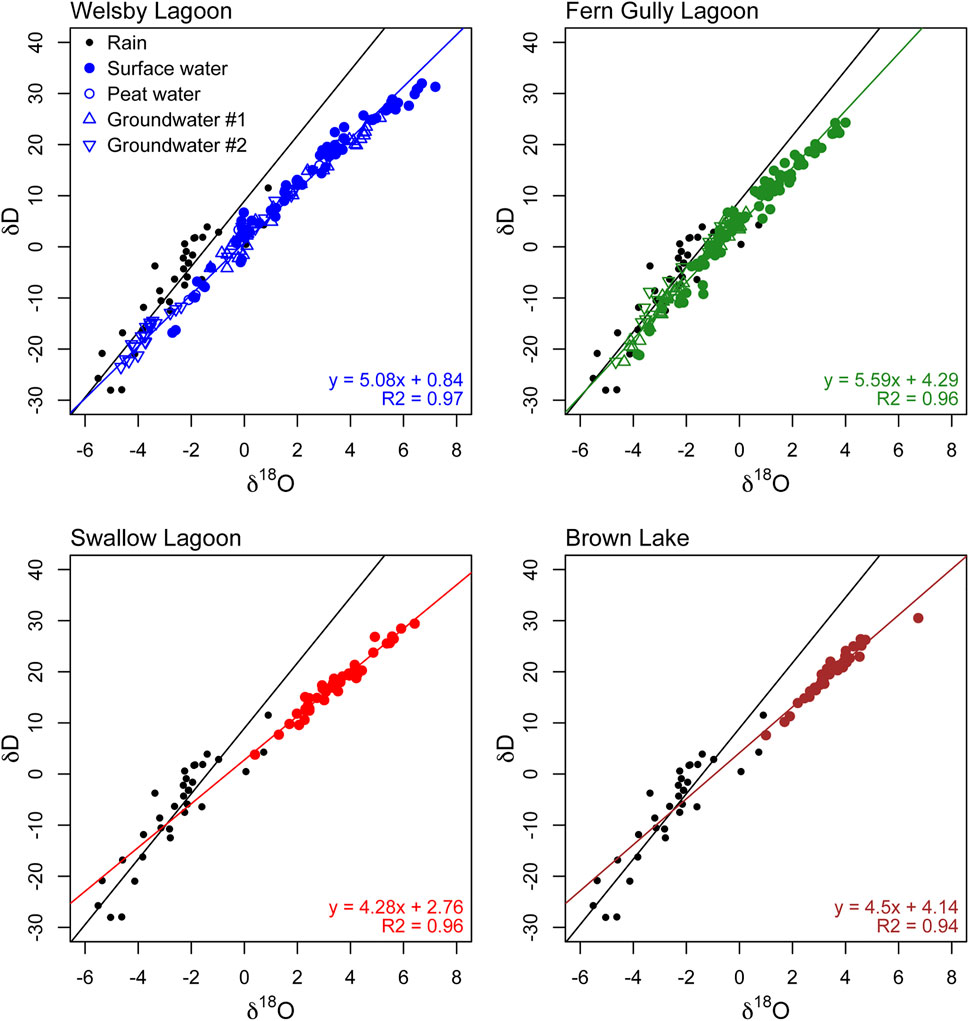
FIGURE 5. Scatterplots of δ18O vs. δ2H for precipitation (black points) and wetland waters (coloured points) for all sites. For Welsby Lagoon and Fern Gully Lagoon, different symbols indicate different water sample types, namely peat water and the groundwater from one of two bores.
Monthly change in lake depth and equivalent change in δ18OL was calculated to assess the relationship between hydrological and stable isotope change, whilst excluding the effect of changes which occurred either prior to the monitoring period, or during gaps in the record. Monthly change in lake depth at Swallow Lagoon and Brown Lake exhibited significant correlations with the equivalent monthly change in δ18OL at both sites, with an R2 of 0.63 and slope of –5.76 for Swallow Lagoon and an R2 of 0.83 and a slope of –4.37 for Brown Lake (Figures 6A,B) reflecting the greater range of variability at Swallow Lagoon. At Welsby Lagoon and Fern Gully Lagoon change in depth and change in δ18OL exhibit weaker, yet statistically significant (p < 0.05) relationships (Figures 6C,D), albeit subject to several possible outliers which appear to have resulted in lower regression slopes than the majority of data imply. No clear reason for outlier rejection was identified, but it is possible that these values reflect short term (i.e., sub-monthly) rainfall events with distinctly different δ18O which, in turn, compensate for changes in δ18OL associated with lake filling or evaporation.
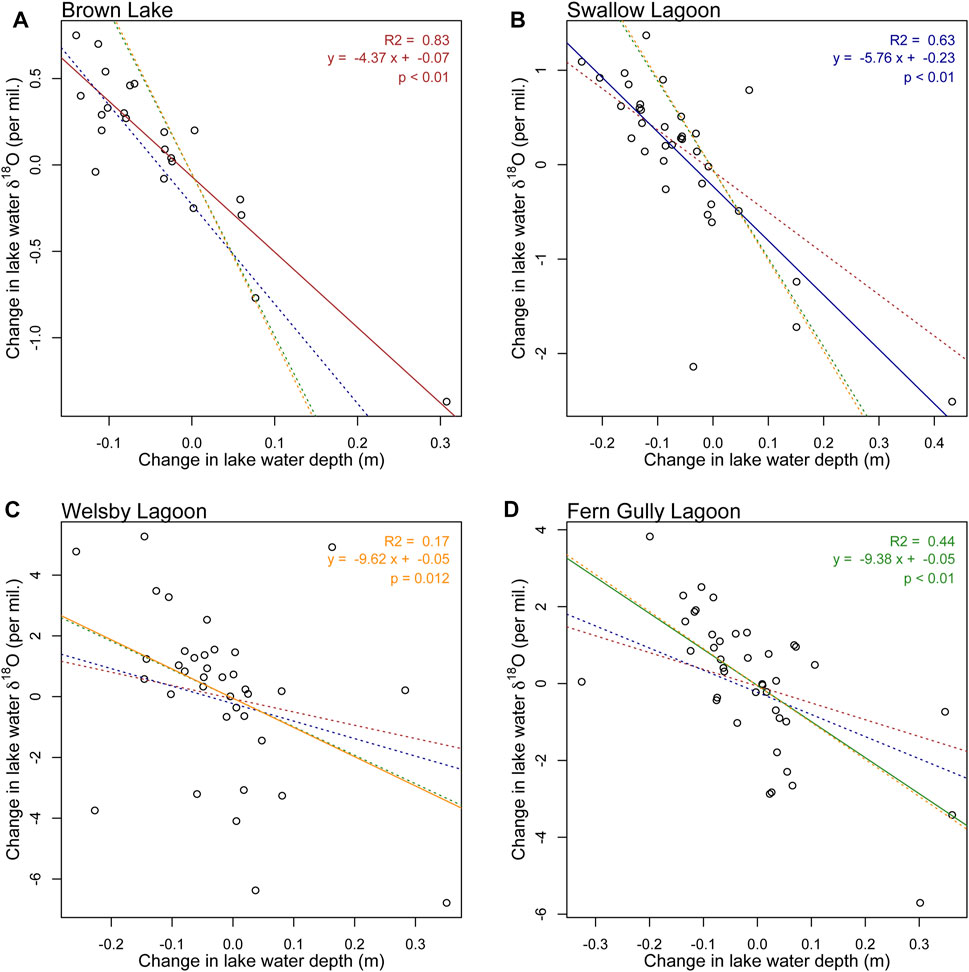
FIGURE 6. Sample-by-sample change in δ18O of wetland surface water plotted against change in surface water depth for the equivalent period between sampling intervals. Solid lines and associated text refer to the linear regression model for each site. Dotted lines reflect linear models derived for the other sites, with line and text colour referring to site [(A) Brown Lake = brown, (B) Swallow Lagoon = blue, (C) Welsby Lagoon = orange and (D) Fern Gully Lagoon = green].
Wetland Hydrological Modelling
Water level variability at Brown Lake and Swallow Lagoon was modelled for December 2011 to February 2020 (Figure 7). To check for the possible influence of regional groundwater influence, regional groundwater head height was compared to lake surface and lake floor levels, and throughout both records lake levels were perched well above groundwater, despite groundwater levels exhibiting a similar, albeit lagged pattern of variability (Figure 7). In order to simulate observed water depth variability through this period, it was necessary to vary two key model parameters: rainfall catchment area and daily outseepage loss rate. For Brown Lake, the catchment area was set at 2x lake area from December 2011 to February 2013, which was a period of high precipitation, and at 1.5x from February 2013 to January 2014. Catchment area was made constant at 1x for the rest of the model run (Figure 7A). Outseepage at Brown Lake was set at 4.20 mm/day from December 2011 to January 2014, and 2.75 mm/day from January 2014 to October 2014. For a brief window of time in 2015, outseepage at Brown Lake was set at 2.0 mm/day, whereas for August 2016 to February 2020, outseepage was set at 0.2 mm/day (Figure 7A). The RMSE of observed vs. modelled lake water depth at Brown Lake varied between the five calibration periods within a range of 0.025–0.085 m.
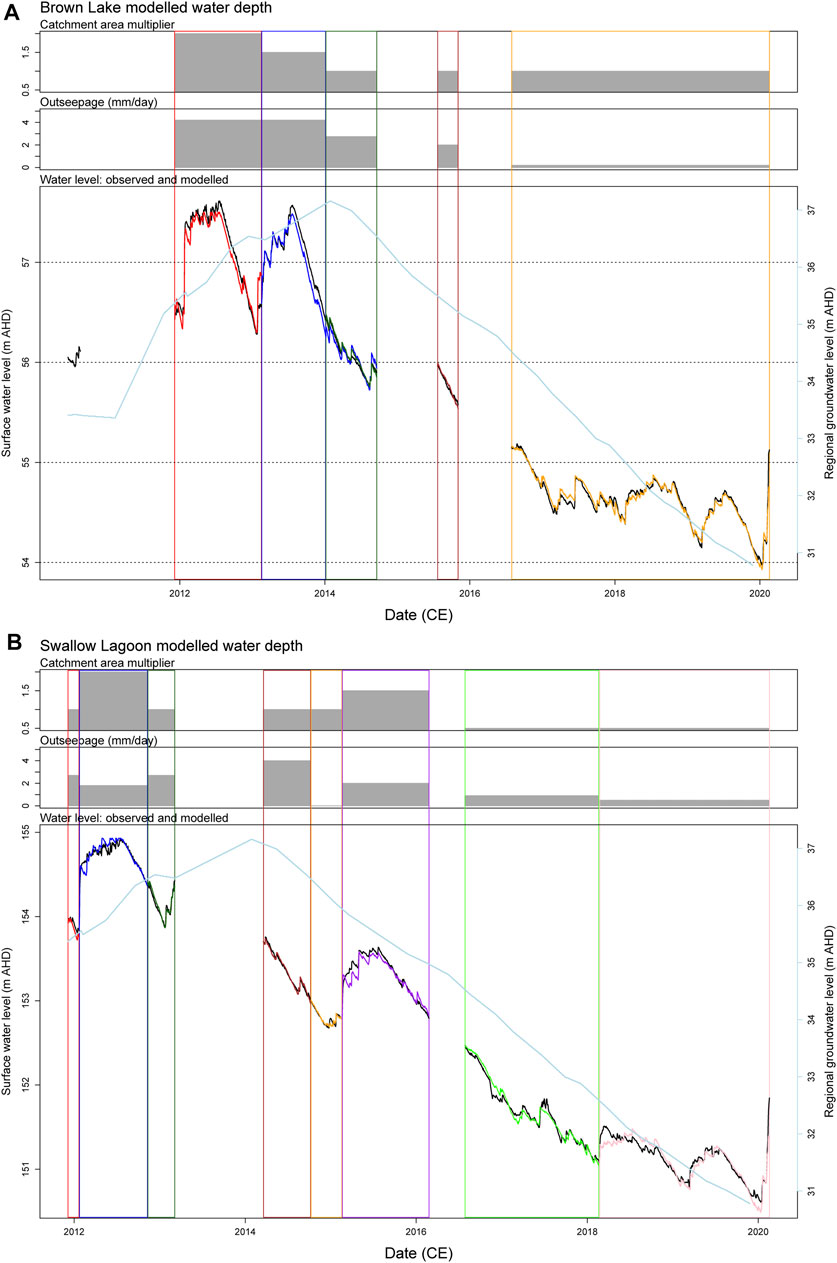
FIGURE 7. Comparison of modelled (coloured lines) vs. observed (black lines) wetland water depth for (A) Brown Lake and (B) Swallow Lagoon. In both figures, the two upper panels illustrate the calibration parameters rainfall catchment area multiplier (where the initial area is the maximum surface area of the lake) and outseepage rate which were iteratively adjusted to best fit the model with observed change. The coloured boxes indicate the different calibration periods. The elevation of the regional water table is shown in light blue.
For Swallow Lagoon, it was necessary to vary the calibration parameters more frequently in order to accurately simulate wetland water depths. Between December 2011 and February 2013, catchment area was set initially at 1x lake area until January 2012, then at 2x between January 2012 to November 2012, before returning to 1x from November 2012 to March 2013, and again for April 2014 to February 2015 (Figure 7B). Between February 2015 to March 2016, catchment area for Swallow Lagoon was set to 1.5x. From August 2016 to February 2012 catchment area was set to 0.5x lake area (Figure 7B). Outseepage rate at Swallow Lagoon was varied between 0.5 and 4 mm/day, with the highest rate of outseepage required to simulate water depth between April and October 2014, and the lowest outseepage rate applied between February 2018 to February 2020. The RMSE of observed vs. modelled lake water depth at Swallow Lagoon varied between the eight calibration periods within a range of 0.028–0.086.
Overall, it is apparent that during periods of higher wetland water depth, which are also periods of higher effective precipitation, it is necessary to set parameters for higher runoff efficiency (catchment size) and higher wetland outseepage. This need to vary the model parameters meant that it is impossible to independently validate the model. Furthermore, model projections outside of the calibration period are likely to be highly uncertain. The model does provide utility, however, for understanding the key fluxes into, and out, of the wetlands during the monitoring period, and also to examine how hypothetical drought conditions might affect the wetlands over a number of years. In this respect, under the scenario where the driest year on record is repeated for 22 years, neither Brown Lake nor Swallow Lagoon was simulated to dry completely (Figure 8). Both wetlands lost water on an annual cycle, yet approached depth minima after 4 years of this climate regime for Swallow Lagoon and after 8 years for Brown Lake. This pattern of declining water level reached asymptote at around 1 m deep for Swallow Lagoon and 3.75 m deep for Brown Lake, with very minor additional annual losses.
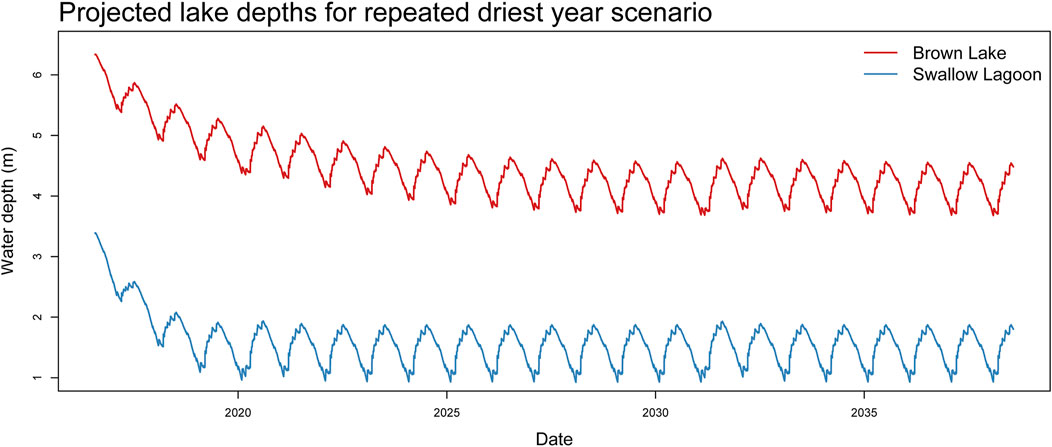
FIGURE 8. Projected lake water depths until July 2038 for a scenario whereby the climate of 2019, the driest on record, is repeated.
Discussion
Declining water level, due to drought and climate change, is a significant and poorly constrained threat to wetland ecosystems in Australia, as it is in many parts of the world. On North Stradbroke Island, each of the four wetlands monitored in this study has exhibited significant decreases in water depth over the first two decades of the century, for which decreasing precipitation relative to evaporation is the best explanation. It has been speculated that local groundwater extraction or modification may also have been a cause of decreased water levels on the island (Homann et al., 2020). However, our study does not support that hypothesis. Instead, several lines of evidence indicate that climate is the primary driver; namely 1) the similar patterns of water depth variability between sites (Figure 3); 2) δ18OL values consistently higher than δ18OP at each site, indicating evaporative enrichment (Figure 4); 3) the distinct local evaporation lines expressed between δ18OL and δ2H at each site (Figure 5); and 4) the correlation between water depth variability and δ18OL at Swallow Lagoon and Brown Lake (Figure 6). Furthermore, our mass balance modelling adequately captured lake water depth variability at Swallow Lagoon and Brown Lake as a function of variable climate and realistic changes in catchment runoff and wetland outseepage (Figure 7).
The similar patterns of both water depth variability and δ18OL between wetlands, alongside the highly responsive nature of those changes, strongly implies a common climatic control over hydrological change during the last decade. An alternative hypothesis for such common patterns of change would be if the wetlands were all connected to a common regional water table, however this is clearly not the case. All the studied wetlands sit above the regional water table (Hofmann, 2020; Hofmann et al., 2020) and, in the case of Brown Lake and Swallow Lagoon, there is no evidence to suggest that the perched aquifers which sit beneath the lakes are hydrologically connected (Hofmann, 2020). In support of this interpretation, Hofmann H (Hofmann, 2020) used groundwater 3H dating and geochemistry to conclude that groundwater extraction for irrigation of the local golf course probably has no effect on the perched aquifers at either lake.
Despite common patterns in water depth and δ18OL variability between wetlands, particularly between the two perennial lakes (Brown Lake and Swallow Lagoon) and between the two palustrine wetlands (Welsby Lagoon and Fern Gully Lagoon), the range of variability in both attributes differed between sites. This is because wetland hydrological and geochemical responses to climate change are also strongly dependent on the morphology of wetland basins, their associated aquifer systems and surrounding catchment, as well as the type and density of catchment vegetation. For example, total evaporation rates are proportional to surface area, meaning that a wetland with a large surface area to volume ratio will be more susceptible to evaporation and enrichment in the heavy oxygen and hydrogen isotopes. Lake water evaporation rate is also affected by factors such as water depth, colour, turbidity and emergent aquatic vegetation, via their effect on the absorbance and attenuation of solar radiation. Importantly, these effects are not static through time, but change according to wetland volume, water quality and ecology, all of which vary according to climate and the long term sedimentary infilling of the basin. Additional factors in wetland catchments include differing runoff vs. infiltration rates and exposure to wind stress, linked to topography, soil types and vegetation. The direct role of terrestrial vegetation can also not be discounted. To date, we do not have any direct measurements of water uptake and loss via vegetation, however it is likely that evapotranspiration not only effects the local aquifer recharge, but that emergent vegetation may also accentuate water loss by evapotranspiration (Boyd, 1987). With this in mind, bushfires can also potentially affect hydrological change, via their effect on vegetation and also by altering the runoff and infiltration properties within the catchment. Despite several remaining uncertainties, our observations of differing scales of hydrological response at different wetlands provide some insight into the potential mechanisms of wetland variability over timescales outside of the observation period, both into the future or through the past, or for lakes with similar morphology in different locations (e.g. the numerous perched lakes of K’gari (Fraser Island)).
Hydrological and Stable Isotope Variability in Palustrine Wetlands
Water depths and δ18O at Fern Gully Lagoon and Welsby Lagoon exhibited markedly different patterns to the two deeper study sites, due to them both drying completely over the study period (Figures 3, 4). Both palustrine wetlands exhibited very similar patterns in depth and δ18O, and these differences in the range of variability are likely explained by differences in wetland and catchment surface area. During the years 2015–2016 inclusive, water depths fluctuated markedly at both sites, with a general trend of decline punctuated by a period of increase between May and August 2016. These decreases and increases in water depth coincided with corresponding increase and decrease in δ18OL (Figure 4). Water levels dropped to that of the sediment-water interface after 2016, whereupon the hydrology of both palustrine wetlands became characterised by flashy periods of filling and subsequent evaporation. Isotope data coverage through this period is more sparse, but in general, those events were characterised by declines in δ18OL during filling, followed by subsequent isotopic enrichment. The full range of isotopic enrichment could not be quantified due to the short timespan of the events—which would have required daily scale monitoring. Interestingly, although wetland water depths increased marginally from early 2018 onwards, the δ18O of surface waters also increased at both Fern Gully and Welsby Lagoon. In the absence of a comparable change in δ18OP, this pattern can be explained by the general persistence of water in both lagoons which, after filling during high rainfall in early 2018, underwent progressive evaporation throughout the year. Transpiration by emergent or littoral vegetation is not a viable explanation for the observed variability in δ18OGW since plants are non-discriminatory with respect to the δ18O of water they take up (Allison et al., 1984; Ehleringer and Dawson, 1992).
Comparison between surface and groundwater levels at Welsby Lagoon and Fern Gully Lagoon suggest a complex hydrological interplay in these shallow palustrine wetlands. At both sites, groundwater levels exhibited patterns which closely resembled those of surface water depths, suggesting that the processes which drive recharge and loss are tied (Figure 3). At both sites, periods of surface water level increase were matched by immediate rises in local groundwater levels, suggesting that the recharge of these subsurface aquifers occurred rapidly, alongside rises in surface water level (Figure 3). This, in turn, implies that the subsurface aquifers are relatively small in volume, and also laterally highly permeable—consistent with their sandy substrate. The monitored groundwater levels at both sites were consistently lower than those of the surface water by between 0.2 and 0.5 m (Figure 3), supporting previous observations that the monitored bores are located down-stream of groundwater flow through the wetland (Draper, 2017).
The groundwater δ18O data for Welsby and Fern Gully Lagoons highlight further complexity and heterogeneity within these systems. Overall, δ18OGW values at both lagoons fell within a similar range to δ18OL (Figure 4). During periods of higher surface water level, δ18OGW values adhered to local evaporation lines and were enriched relative to rainfall, further indicating that the monitored groundwaters were fed in part by outseepage from evaporated lagoon water (Figures 4, 5). However, during periods of low or absent surface water, the δ18OGW at both lagoons exhibited relatively constant values within the range of the δ18O of precipitation (Figures 4, 5) and the regional groundwater and perched aquifer δ18O values (Hofmann et al., 2020). At Welsby Lagoon, two neighbouring groundwater bores exhibited contrasting patterns of change. δ18O values from bore #1 (∼13 m closer to the wetland) were consistently higher by 2–4‰ than equivalent δ18OP, suggesting evaporation prior to infiltration. In addition, the bore #1 δ18OGW values exhibit a pattern similar to a lagged δ18OL as might be expected for wetland outflow (Figure 4). By contrast, the δ18OGW in bore #2 was consistently 1–3‰ lower than at bore #1, except for a brief period in early 2017 (Figure 4). Although lower than in bore #1, the δ18OGW at bore #2 were still high, relative to rainfall, suggesting that the groundwater at this location received a smaller fraction of wetland outseepage, despite its proximity to the lagoon. Following a large amount of low δ18OP precipitation in June 2016 and April 2017, δ18OGW at bore #2 decreased to ∼ –6‰, indicative of direct recharge by rainfall. Subsequently, relatively constant δ18OGW at bore #2 at ∼ –6‰ from late 2017 to early 2018 implies that this aquifer became disconnected from wetland outseepage from there on (Figure 4). Throughout this period the water levels at bore #2 continued to fluctuate in tandem with both bore #1 groundwater and surface water (Figure 3), indicating that between mid-2017 and early 2019 the aquifer underwent recharge from rainfall and loss by outseepage without mixing with surface water and without any notable effects of evaporative loss. A further point of interest is that the groundwater head heights at Welsby bore #2 were virtually identical to those at bore #1, which did exhibit δ18OGW patterns that suggest continued connectivity with the surface hydrology. This implies lateral heterogeneity in the shallow aquifers beneath Welsby Lagoon, as well as lateral variability in the extent to which those aquifers are connected to the surface water.
Similar groundwater patterns emerged at Fern Gully Lagoon. When the lagoon had standing water during late 2015 and early 2016, δ18OGW values from bore #1 (closer to the wetland) were similar to those of surface δ18OL (Figure 4). Following the large amount of low δ18OP rainfall in mid-2016, shallow groundwater at both bores at Fern Gully Lagoon dropped to ∼ –5‰. Subsequently, despite a marked increase in the δ18OL of surface waters over the following year, only a gradual pattern of increase was observed in δ18OGW, suggesting only a small fraction of recharge from wetland outseepage, presumably due to the low volume of water in the wetland. Nevertheless, as at Welsby Lagoon, the groundwater levels at Fern Gully Lagoon exhibited abrupt periods of rise and fall in concert with surface water levels, indicating that through this period their recharge was dominated by direct infiltration by rainwater.
From these observations, it is reasonable to conclude that the shallow groundwater systems at these lagoons are only intermittently connected with the surface waters at their respective wetlands. During the monitored period, these groundwaters received a combination of direct infiltration and outseepage from the wetlands, seemingly subject to wetland surface water depth and volume. It appears that during periods of low water level, the groundwater aquifers received very little outseepage from the wetland, yet still received recharge by direct infiltration of rainfall.
Hydrological and Stable Isotope Variability in Lakes
Despite the relatively high rainfall and short water residence times of wetlands on North Stradbroke Island, the lake water balance and δ18OL of both Swallow Lagoon and Brown Lake was strongly influenced by evaporation. Both lakes underwent a marked decline in lake level between mid-2015 and early 2017, by ∼2 m at Swallow Lagoon and ∼1.5 m at Brown Lake (Figures 3, 4). Groundwater levels were only monitored at Brown Lake, and there—unlike at the palustrine wetlands—groundwater levels were consistently level with or higher than surface water levels, indicating that local groundwater probably drained into the lake throughout the monitoring period. Over the same period, the δ18OL of both lakes increased, from ∼0 to +6‰ at Swallow Lagoon and from ∼+1 to +5‰ at Brown Lake (Figure 4). The δ18OL data, as well as the similarity between lakes, again illustrates the dominant role of evaporation in lake level decline, rather than loss of water via subsurface drainage, which should have no effect on δ18OL. Transpiration by littoral or emergent aquatic plants is another possible pathway for water loss, however in this case the uptake of water by plant roots should not discriminate oxygen isotopes (Allison et al., 1984; Ehleringer and Dawson, 1992), therefore not explaining the observed patterns in δ18OL. Changes in vegetation may, however, affect evaporation rates via shading and sheltering, both in the catchment and on the lake water surface. Changes in δ18OL cannot be explained by changes in δ18OP, despite the similar pattern exhibited by δ18OP and δ18OL. During the major period of lake level decline and δ18OL increase, δ18OP remained relatively constant at ∼–2‰, except for 2 months with high δ18OP > +1‰ (January 2016 and November 2016), both of which were characterised by low precipitation (<100 mm), as well as a month with high precipitation amount (>200 mm) and markedly low δ18OP value of –7‰ in May 2016 (Figure 4). Whilst the month of high precipitation clearly led to a decline in δ18OL at both sites, overall δ18OP and δ18OL do not correlate and in particular the trend of increasing δ18OL is not matched by a concurrent increase in δ18OP.
From January 2017 through to December 2019, δ18OL at Swallow Lagoon and Brown Lake declined by 2‰ and 1‰, respectively, exhibiting a narrower range of variability through the year 2018 than observed during previous years (Figure 4). This decline in δ18O occurred during a period of continued lake level decline at Swallow Lagoon, and a period of low, yet stable, lake levels at Brown Lake. Thus, at first glance these patterns appear contrary to the expected negative relationship between δ18O and lake level, where lake water evaporation drives an increase in δ18O. One explanation for this pattern could be a decline in the δ18O of mean precipitation, however the continued adherence to the LEL (Figure 5) does not support this hypothesis. The mean annual δ18O of rainfall (un-weighted) declined by ∼1‰ during this period, however throughout the record, the effect of high amount, low δ18OP events on the total δ18O of the two lakes was relatively minor and short lived—for example the high monthly rainfall event in June 2017 (248 mm, of which 110 mm fell on 14/6/2016) was associated with a decrease in δ18OP by ∼ –4‰, yet only a ∼–2‰ decrease in δ18OL at Swallow Lagoon which persisted for just 2 months (Figure 4). Rather than a significant change in the source or δ18O of moisture reaching the lagoons between 2017 and 2019, it is more likely that the decline in δ18O in both lakes over this period reflects the decrease in wetland surface area resulting from lake shallowing, which in turn caused a decrease in total evaporation. It would also be expected that the residence time of water in both lakes would also have decreased due to the decreased volume. At Brown Lake, which has a larger lake surface and catchment area (Table 1), a period of greater hydrological stability appears to have developed between 2017 and 2019 suggesting that for this period at least, water inputs vs. evaporation were near equilibrium. This balance was interrupted by a period of high evaporation and low precipitation in early 2019 which resulted in further lake level decrease and an increase in δ18OL at Brown Lake (Figure 4). By contrast, the continual decline in water depth at Swallow Lagoon suggests that, with a much smaller lake surface and catchment area, the flux of evaporative losses continued to exceed those from inflowing rainfall during the same period. This difference in hydrological stability between the lagoons also explains the larger seasonal range in δ18O at Swallow Lagoon, compared to Brown Lake (Figure 4).
Modelling Hydrological Change at Swallow Lagoon and Brown Lake
To make informed assessment of the future risks to wetland hydrology and ecology it is necessary to be able to adequately model historical variability in these systems. In this study, it was possible to model 10 years of hydrological change at Swallow Lagoon and Brown Lake using a reasonably simple hydrological mass balance model (Lobegeiger et al., 2015). However, it was only possible to accurately simulate lake depth change at these wetlands by varying two key parameters through time: catchment runoff and throughflow (termed catchment area in the model; basically short term transfer of rainfall into the lake) and wetland outseepage rate (Figure 7). The need to vary the calibration parameters through time further highlights the significant complexity regarding the response of these wetlands and their surrounding catchments to climate variability. For the lacustrine wetlands, higher runoff (catchment area) parameterisation was required for periods of higher effective moisture and higher lake level, between 2012 and 2013 at both lakes, and also for 2015 at Swallow Lagoon. This requirement to parameterise larger runoff for these periods suggests that changes occurred in the seasonality or intensity of precipitation, or in catchment permeability (Potter et al., 2005). Lower permeability during times of higher effective moisture may be a consequence of saturated moisture content in the soils, or a higher organic concentration, particularly of leaf litter, due to higher terrestrial productivity. Therefore, major uncertainties remain regarding the way that water flows into these lakes during periods of higher precipitation—namely, the fraction of water that enters via runoff versus that which flows into the lakes via shallow groundwater. Improving our understanding of these processes is crucial in order to better manage landscapes to aid lake water recharge under future climate scenarios.
In addition to altering catchment run off behaviour, it was also necessary to vary the outseepage rate through time. For Brown Lake, it was clear that a higher outseepage rate was necessary at times of higher water depth (Figure 7). For Swallow Lagoon, a similar pattern emerged, albeit more complex. In general, however, it is apparent that periods of higher lake water depth are associated with a higher discharge of non-evaporative water losses, of which outseepage to groundwater is the most likely pathway. An increase in groundwater discharge during periods of higher lake level could be explained by either higher water pressures during deeper lake phases, or by the overtopping of impermeable layers at higher lake depths. An additional factor may be the uptake of water by catchment vegetation during periods of higher precipitation, which would also not result in changes to δ18OL. In general, it is apparent that understanding the role of soil and lake sediment permeability, infiltration, outseepage and vegetation is crucial to understanding the trajectory of wetlands on North Stradbroke Island, and in similar environments, in response to future climate change.
Given the complexities related to lake hydrological responses to climate, and the consequent need to adjust model parameterisation through time, model projections of lake depth under future scenarios are currently uncertain. Nevertheless, it is feasible to use the model—as calibrated for the 2016–2019 shallow lake phase—to explore the potential resilience of the lake hydrology to an ongoing period of drought. A systematic analysis of total annual rainfall and total annual evaporation since 1890 at Dunwich Post Office (BoM 2020) indicated that the year 2019 was the driest year since records began (SI Figure 2). To explore the effect of simply continuing with the climate of 2019 over the coming decades, the calibrated model was run for both Swallow Lagoon and Brown Lake, based on a hypothetical repetition of 2019 climate until 2038 (Figure 8). Interestingly, neither lake dried up completely under this scenario: seasonal water depths at Swallow Lagoon remained consistent with the seasonal cycle of 2019–2020, whereas Brown Lake levels continued to decline but reached asymptote after 2024 (Figure 8). Given that the models assume no groundwater input and relatively minor catchment runoff, this stabilization of lake depths supports the interpretation that reducing water surface area during lake level decline causes a decrease in evaporative water loss, thus establishing an equilibrium with inputs derived from direct precipitation and runoff. This natural process of self-regulation is linked to the bathymetry of the lakes. Swallow Lagoon has a roughly conical bathymetry while Brown Lake has a number of deeper sub-basins which would retain water even with marked water level declines (Supplementary Figure S1). In addition, the model experiments suggest that a long-term decline in water depth in these lakes requires a long-term decrease in the precipitation to evaporation ratio, whereas a low but fixed precipitation to evaporation ratio might not dry the lakes beyond a certain level. Consequently, if precipitation were to decline over several years at or beyond 2019 levels, then it is feasible that Swallow Lagoon, in particular, might dry out entirely. Similarly, further reduction in the runoff and throughflow efficiency, as we have inferred for the last decade (Figure 7), could also accelerate the demise of these lakes. In order to make more reliable projections of future hydrological change, however, it is necessary to develop, calibrate and validate more sophisticated hydrological models which combine responsive lake water thermodynamics, surface-groundwater interaction and stable isotope geochemistry [e.g. (Hostetler and Bartlein, 1990; Jones and Imbers, 2010; Steinman et al., 2010; Ankor and Tyler, 2019). Such modelling exercises should be a priority in order to better understand the resilience of these important wetlands under future climate scenarios. Given that changes in water level of the magnitude observed in our study are likely to result in fundamental alterations to water quality (for example the extent of lake bottom anoxia), a greater understanding of the water quality and biological response to these alterations is also needed.
Implications for Palaeoclimatology
The wetlands of North Stradbroke Island offer significant value as palaeoclimate archives, being some of the oldest extant water bodies in Australia, and providing some of the most complete sedimentary records spanning the last ∼100,000 years (Tibby et al., 2017; Cadd et al., 2018; Kemp et al., 2020; Lewis et al., 2020). Our observations of the contemporary isotope hydrology of North Stradbroke Island wetlands provides a useful basis for the interpretation of palaeoclimate records from the sediments of these wetlands, and similar inter-dunal lake systems in the humid subtropics in Australia and worldwide. Importantly, the isotope hydrology of all the monitored wetlands between 2015 and 2019 was dominated by the balance between precipitation vs. evaporation, despite the relatively high rainfall in south-eastern Queensland and the porous geology, which promotes rapid recharge and short water residence times. The effects of evaporation on water isotopes were largely consistent between wetlands, irrespective of the surface area or depth of the water body, suggesting that similar processes can be used to explain isotope hydrological change throughout the Quaternary history of the wetlands. This is particularly relevant for Welsby and Fern Gully Lagoons, which are two of Australia’s oldest extant wetlands with sediments that have accumulated over tens to hundreds of thousands of years (Tibby et al., 2017). At Welsby Lagoon, due to progressive basin infilling by sediment, the wetland evolved from a deeper lake prior to 40,000 years ago, into a shallow palustrine wetland similar to the contemporary system (Cadd et al., 2018). The hydrology of ancient Welsby Lagoon is more likely to have been analogous to the contemporary Brown Lake, however our results indicate that the mode of interpretation of δ18OL from the sediments of Welsby Lagoon can be reasonably consistent throughout.
Although the evaporation related patterns of change were similar between the four monitored wetlands, the magnitude of variability in δ18OL varied significantly between sites due to differences in the surface area and volume of the wetland. Of the two lacustrine wetlands, Swallow Lagoon exhibited a larger range in δ18OL, which can be explained by the smaller lake volume, lake surface and catchment area, compared to Brown Lake, meaning that the total influx of water was less and thus the effects of evaporation on δ18O were proportionately greater. The isotope hydrology of the two palustrine wetlands, Welsby Lagoon and Fern Gully Lagoon, was characterised by periods of recharge followed by subsequent evaporation and isotopic enrichment. In these cases, differences in the magnitude of δ18OL change can be explained by differences in surface area, and thus the total evaporation rate.
In δ18O vs. δD space, each of the four wetlands exhibit local evaporation lines with similar slopes (Figure 5). The intersect of the LEL with the regional meteoric water line (which is defined by the δ18O and δD of precipitation), can be used to estimate the weighted isotopic composition of water recharging the wetlands. Interestingly, for Swallow Lagoon and Brown Lake, these recharge estimates fall close to the mean δ18OP and δDP for the monitored period, whereas at Welsby Lagoon and Fern Gully Lagoon, the estimated isotopic composition of recharge waters are closer to the lower, winter δ18OP and δDP values (Figure 5). One explanation for this is that Welsby and Fern Gully Lagoons have smaller water volumes and water residence times, thus their δ18OL values are weighted towards recent precipitation events, which predominantly occurred in winter over the monitored period. By contrast, with longer water residence times in both the lakes and surrounding groundwater, Brown Lake and Swallow Lagoon receive input waters with an annually integrated δ18O. That these waters include a higher proportion of summer rainfall might imply that the catchment groundwaters are preferentially recharged by intense, summer rainfall. Alternatively, it is possible that the lake and ground water δ18O at the two lakes retain a signal from higher δ18OP rainfall events which occurred prior to the commencement of monitoring. Irrespective of the causes, interpretation of ancient δ18O variability from wetland sediments must consider the possibility of variable seasonal bias depending on the prevailing annual distribution of rainfall, and depth and hydrology of the wetland at the time, whereby shallow palustrine wetlands and their sediments may record a more seasonally-biased signal of lake water isotopes compared to deeper lakes.
Similarly, the monitoring data provide some insights into the way that plant and animal tissue might accrue oxygen and isotope hydrological signatures, which are then preserved in the sediments. All of the wetlands host emergent aquatic plants, with roots that accumulate water from the top 1–2 m depth beneath the sediment surface, and this is particularly the case in the palustrine wetlands. The δ18O of plant remains in these wetlands, which are the major contributor of organic matter to the lake sediments, can be recorded in the sediments within cellulose, lipid biomarkers or the isotope composition of grazing invertebrates. It is therefore possible that such higher plant derived organic matter has a δ18O signal derived in part from sediment interstitial water or groundwater, contrasting with algal or bacterial organic matter, which should more faithfully record the signal of evaporated surface water. The δ18O of shallow groundwaters is fed by a combination of recharge direct from precipitation as well as outseepage from wetland surface water. Therefore, plant tissue δ18O may likely reflect a composite signal from these sources. Ongoing monitoring of plant matter in these environments aims to provide further insights into this relationship.
Differences in the sensitivity of wetland isotope hydrology to seasonal and inter-annual climate variability (Figure 6) raises the enticing potential to combine palaeo- δ18O data from multiple sites within close proximity to solve for regional hydrological fluxes, namely precipitation amount vs. evaporation. This potential is particularly promising for perennial lake systems such as Swallow Lagoon and Brown Lake. However, such an approach also comes with significant caveats, most notably that basin morphology also varies as a function of lake water depth, which in turn affects lake recharge, evaporation rate and outseepage. In addition, as indicated by our modelling (Figure 7), changes in wetland outseepage and catchment runoff can also vary as a function of climate change. Therefore, to use between-lake differences in δ18O to quantify past hydrological change requires the development and application of more detailed isotope-hydrological models which incorporate variable lake bathymetry, informed by geophysical profiles of the basin’s sedimentary fill, as well as accurate estimates of sediment accumulation through time. The development of such data and models for inter-dunal wetlands represents an important objective for future research.
Conclusion
Declining wetland water levels are a concern for communities and environmental managers worldwide, particularly so in Australia where wetlands are comparatively rare. In a bid to better understand the controls over wetland hydrology in Australia’s humid subtropics, surface and groundwater levels, and oxygen and hydrogen isotopes were monitored at four sites on North Stradbroke Island, over 6 years between 2015 and 2020. The hydrology of these wetlands might be expected to be relatively simple, since they are perched by impermeable layers in a matrix of highly permeable sand. However, this study reveals unexpected complexities and individual wetland idiosyncrasies, which introduces challenges when predicting the future of these wetlands under climate change scenarios. All wetlands exhibited marked declines in water level over the monitored period, and the two palustrine wetlands—Fern Gully Lagoon and Welsby Lagoon—experienced seasonal absence of surface water from late 2016 onwards. These patterns can be attributed to climate—specifically a reduction in precipitation relative to evaporation—and no evidence was found to indicate that anthropogenic disturbance of groundwater may explain the declining wetland water levels. At the palustrine wetlands, groundwater levels fluctuated in concert with surface waters, yet the connectivity between surface and groundwaters at these wetlands varied according to the volume of surface water, whereby direct infiltration by precipitation to groundwater dominated during periods of low water level. This finding highlights a previously unrecognized complexity in the local wetland aquifer systems. By contrast, groundwater head heights were predominantly higher than surface water at Brown Lake, indicating that the perched aquifer does contribute to surface water levels at this site. Simple hydrological models were able to accurately explain water depth variability at the perennial lakes (Brown Lake and Swallow Lagoon) albeit with varying parameters for catchment size (equivalent to runoff efficiency) and groundwater outseepage, whereby runoff decreased during periods of lower precipitation and outseepage decreased as a consequence of lower lake levels. This need to vary the model parameters highlights a demand for models which capture the hydrological complexity of these wetlands in order to rigorously assess their resilience under past and future climate scenarios.
Overall, our data provide new insights into the trajectory of these ecologically and culturally significant wetlands in the face of future climatic change, particularly highlighting the need to study individual wetlands due to the complexity in both surface and subsurface hydrology. In addition, this study provides a basis for more rigorous interpretation of palaeoclimate records from the sediments of wetlands in the humid subtropics of eastern Australia, and for similar systems worldwide. Changing hydrological balance is one of several potential impacts of climate change upon wetlands, combining with rising temperature, changing bushfire activity, catchment erosion and vegetation change, all of which effect wetland water quality and ecosystem functioning (Adrian et al., 2009; Havens and Steinman, 2015; Me et al., 2018). Further research is therefore vital to better forecast and manage the fate of global wetlands, and the values and services they provide, in the face of changing climates.
Data Availability Statement
The raw data supporting the conclusion of this article will be made available by the authors, without undue reservation.
Author Contributions
JT, JM, CB, HH, GM and JT designed the field monitoring program; CS undertook the majority of field sampling, assisted by all authors; JT, JM, CS, CB, HH, JB and KM undertook data analysis and modelling; all authors contributed to writing the manuscript.
Funding
Financial support for the project, including the cost of open access publication, was provided by Australian Research Council Discovery Projects DP150103875 and DP190102782.
Conflict of Interest
The authors declare that the research was conducted in the absence of any commercial or financial relationships that could be construed as a potential conflict of interest.
Publisher’s Note
All claims expressed in this article are solely those of the authors and do not necessarily represent those of their affiliated organizations, or those of the publisher, the editors and the reviewers. Any product that may be evaluated in this article, or claim that may be made by its manufacturer, is not guaranteed or endorsed by the publisher.
Acknowledgments
We acknowledge Minjerribah (North Stradbroke Island) and the surrounding waters as Quandamooka Country and thank the Quandamooka Yoolooburrabee Aboriginal Corporation for permission to undertake the work.
Supplementary Material
The Supplementary Material for this article can be found online at: https://www.frontiersin.org/articles/10.3389/fenvs.2022.868114/full#supplementary-material
References
Adrian, R., O'Reilly, C. M., Zagarese, H., Baines, S. B., Hessen, D. O., Keller, W., et al. (2009). Lakes as Sentinels of Climate Change. Limnol. Oceanogr. 54 (62), 2283–2297. doi:10.4319/lo.2009.54.6_part_2.2283
Allison, G. B., Barnes, C. L., Hughes, M. W., and Leaney, F. W. J. (1984). “Effect of Climate and Vegetation on Oxygen-18 and Deuterium Profiles in Soils,” in Isotope Hydrology (Vienna: IAEA), 105
Ankor, M. J., and Tyler, J. J. (2019). Development of a Spreadsheet-Based Model for Transient Groundwater Modelling. Hydrogeol. J. 27 (5), 1865–1878. doi:10.1007/s10040-019-01996-z
Arthington, A. H., Mackay, S. J., Ronan, M., James, C. S., and Kennard, M. J. (2019). “Freshwater Wetlands of Moreton Bay Quandamooka and Catchments: Biodiversity, Ecology, Threats and Management,” in Moreton Bay Quandamooka & Catchment: Past, Present, and Future. Editors I. R. Tibbetts, P. C. Rothlisberg, D. T. Neil, T. A. Homburg, D. T. Brewer, and A. H. Arthington (Brisbane: The Moreton Bay Foundation).
Barr, C., Tibby, J., Gell, P., Tyler, J., Zawadzki, A., and Jacobsen, G. E. (2014). Climate Variability in South-Eastern Australia over the Last 1500 Years Inferred from the High-Resolution Diatom Records of Two Crater Lakes. Quat. Sci. Rev. 95, 115–131. doi:10.1016/j.quascirev.2014.05.001
Barr, C., Tibby, J., Leng, M. J., Tyler, J. J., Henderson, A. C. G., Overpeck, J. T., et al. (2019). Holocene El Niño-Southern Oscillation Variability Reflected in Subtropical Australian Precipitation. Sci. Rep. 9 (1), 1627. doi:10.1038/s41598-019-38626-3
Barr, C., Tibby, J., Marshall, J. C., McGregor, G. B., Moss, P. T., Halverson, G. P., et al. (2013). Combining Monitoring, Models and Palaeolimnology to Assess Ecosystem Response to Environmental Change at Monthly to Millennial Timescales: the Stability of B Lue L Ake, N Orth S Tradbroke I Sland, A Ustralia. Freshw. Biol. 58 (8), 1614–1630. doi:10.1111/fwb.12154
Battarbee, R. W. (2000). Palaeolimnological Approaches to Climate Change, with Special Regard to the Biological Record. Quat. Sci. Rev. 19 (1-5), 107–124. doi:10.1016/s0277-3791(99)00057-8
Blöschl, G., Bierkens, M. F., Chambel, A., Cudennec, C., Destouni, G., Fiori, A., et al. (2019). Twenty-three Unsolved Problems in Hydrology (UPH)–a Community Perspective. Hydrological Sci. J. 64 (10), 1141. doi:10.1080/02626667.2019.1620507
Boyd, C. E. (1987). Evapotranspiration/evaporation (E/Eo) Ratios for Aquatic Plants. J. Aquatic Plant Manag. 25, 1
Brooke, B., Lee, R., Cox, M., Olley, J., and Pietsch, T. (2008). Rates of Shoreline Progradation during the Last 1700 Years at Beachmere, Southeastern Queensland, Australia, Based on Optically Stimulated Luminescence Dating of Beach Ridges. J. Coast. Res. 243, 640–648. doi:10.2112/04-0375.1
Brooke, B. P., Pietsch, T. J., Olley, J. M., Sloss, C. R., and Cox, M. E. (2015). A Preliminary OSL Chronology for Coastal Dunes on Moreton Island, Queensland, Australia - Marginal Deposits of A Large-Scale Quaternary Shelf Sediment System. Cont. Shelf Res. 105, 79–94. doi:10.1016/j.csr.2015.06.002
Bureau of Meteorology (BoM), (2020). Climate Data Online. Available at: http://www.bom.gov.au/climate/data/.
Cadd, H. R., Tibby, J., Barr, C., Tyler, J., Unger, L., Leng, M. J., et al. (2018). Development of a Southern Hemisphere Subtropical Wetland (Welsby Lagoon, South-East Queensland, Australia) through the Last Glacial Cycle. Quat. Sci. Rev. 202, 53–65. doi:10.1016/j.quascirev.2018.09.010
Crawford, J., Hughes, C. E., and Parkes, S. D. (2013). Is the Isotopic Composition of Event Based Precipitation Driven by Moisture Source or Synoptic Scale Weather in the Sydney Basin, Australia? J. Hydrology 507, 213–226. doi:10.1016/j.jhydrol.2013.10.031
Darling, W. G., Bath, A. H., Gibson, J. J., Rozanski, K., and Leng, M. J. (2006). “Isotopes in Water,” in Isotopes in Palaeoenvironmental Research (Dordrecht: Springer), 1
Draper, T. (2017). Water Balance Model to Assess Coastal Perched Wetland and Groundwater Interaction: North Stradbroke Island, Australia. Honours Thesis, University of Queensland.
Ehleringer, J. R., and Dawson, T. E. (1992). Water Uptake by Plants: Perspectives from Stable Isotope Composition. Plant Cell. Environ. 15 (9), 1073–1082. doi:10.1111/j.1365-3040.1992.tb01657.x
Ellerton, D., Rittenour, T., Shulmeister, J., Gontz, A., Welsh, K., and Patton, N. (2020). An 800 Kyr Record of Dune Emplacement in Relationship to High Sea Level Forcing. Geomorphology 106999. doi:10.1016/j.geomorph.2019.106999Get
Gibson, J. J., and Edwards, T. (2002). Regional Water Balance Trends and Evaporation‐transpiration Partitioning from a Stable Isotope Survey of Lakes in Northern Canada. Glob. Biogeochem. Cycles 16 (2), 1026. doi:10.1029/2001gb001839
Gibson, J. J., Edwards, T. W. D., and Prowse, T. D. (1996). Development and Validation of an Isotopic Method for Estimating Lake Evaporation. Hydrol. Process. 10 (10), 1369–1382. doi:10.1002/(sici)1099-1085(199610)10:10<1369::aid-hyp467>3.0.co;2-j
Grose, M. R., Narsey, S., Delage, F., Dowdy, A. J., Bador, M., Boschat, G., et al. (2020). Insights from CMIP6 for Australia's Future Climate. Earth's Future 8 (5), e2019EF001469. doi:10.1029/2019ef001469
Hansen, J., Sato, M., Ruedy, R., Lo, K., Lea, D. W., and Medina-Elizade, M. (2006). Global Temperature Change. Proc. Natl. Acad. Sci. U.S.A. 103 (39), 14288–14293. doi:10.1073/pnas.0606291103
Havens, K. E., and Steinman, A. D. (2015). Ecological Responses of a Large Shallow Lake (Okeechobee, Florida) to Climate Change and Potential Future Hydrologic Regimes. Environ. Manag. 55 (4), 763–775. doi:10.1007/s00267-013-0189-3
Henderson, A. K., and Shuman, B. N. (2009). Hydrogen and Oxygen Isotopic Compositions of Lake Water in the Western United States. Geol. Soc. Am. Bull. 121 (7-8), 1179–1189. doi:10.1130/b26441.1
Hofmann, H. (2020). Aquifer Source Determination for Brown Lake, Swallow Lagoon and the Golf Club Bore, Minjerribah. Australia: Final Report for the Queensland Government Department for Environment and Science, 1
Hofmann, H., Newborn, D., Cartwright, I., Cendón, D. I., and Raiber, M. (2020). Groundwater Mean Residence Times of a Subtropical Barrier Sand Island. Hydrol. Earth Syst. Sci. 24, 1293–1318. doi:10.5194/hess-24-1293-2020
Hollins, S. E., Hughes, C. E., Crawford, J., Cendón, D. I., and Meredith, K. T. (2018). Rainfall Isotope Variations over the Australian Continent - Implications for Hydrology and Isoscape Applications. Sci. Total Environ. 645, 630–645. doi:10.1016/j.scitotenv.2018.07.082
Hostetler, S. W., and Bartlein, P. J. (1990). Simulation of Lake Evaporation with Application to Modeling Lake Level Variations of Harney-Malheur Lake, Oregon. Water Resour. Res. 26 (10), 2603–2612. doi:10.1029/wr026i010p02603
Jones, M. D., and Imbers, J. (2010). Modeling Mediterranean Lake Isotope Variability. Glob. Planet. Change 71 (3-4), 193–200. doi:10.1016/j.gloplacha.2009.10.001
Jones, R., McMahon, T., and Bowler, J. (2001). Modelling Historical Lake Levels and Recent Climate Change at Three Closed Lakes, Western Victoria, Australia (C. 1840–1990). J. Hydrology 246 (1-4), 159–180. doi:10.1016/s0022-1694(01)00369-9
Kemp, C. W., Tibby, J., Arnold, L. J., Barr, C., Gadd, P. S., Marshall, J. C., et al. (2020). Climates of the Last Three Interglacials in Subtropical Eastern Australia Inferred from Wetland Sediment Geochemistry. Palaeogeogr. Palaeoclimatol. Palaeoecol. 538, 109463. doi:10.1016/j.palaeo.2019.109463
King, A. C., Raiber, M., Cendón, D. I., Cox, M. E., and Hollins, S. E. (2015). Identifying Flood Recharge and Inter-aquifer Connectivity Using Multiple Isotopes in Subtropical Australia. Hydrol. Earth Syst. Sci. 19 (5), 2315–2335. doi:10.5194/hess-19-2315-2015
Kirono, D. G. C., Kent, D. M., Jones, R. N., and Leahy, P. J. (2012). Assessing Climate Change Impacts and Risks on Three Salt Lakes in Western Victoria, Australia. Hum. Ecol. Risk Assess. Int. J. 18 (1), 152–167. doi:10.1080/10807039.2012.632291
Konecky, B. L., McKay, N. P., Churakova, O. V., Comas-Bru, L., Dassié, E. P., DeLong, K. L., et al. (2020). The Iso2k Database: A Global Compilation of Paleo-δ18O and δ2H Records to Aid Understanding of Common Era Climate. Earth Syst. Sci. Data Discuss. 2020, 1
Laycock, J. “Hydrogeology of North Stradbroke Island,” in Proceedings Of 1975 (Royal Society of Queensland), 15–19.
Leach, L. (2011). Hydrology and Physical Setting of North Stradbroke Island. Proc. R. Soc. Qld. 117, 21. doi:10.3316/ielapa.550239883459656
Lee-Manwar, G., Arthington, A., and Timms, B. (1980). Comparative Studies of Brown Lake, Tortoise Lagoon and Blue Lake, North Stradbroke Island, Queensland. I. Morphometry and Origin of the Lakes. Proc. 53
Lei, Y., Yang, K., Wang, B., Sheng, Y., Bird, B. W., Zhang, G., et al. (2014). Response of Inland Lake Dynamics over the Tibetan Plateau to Climate Change. Clim. Change 125 (2), 281–290. doi:10.1007/s10584-014-1175-3
Leng, M. J., and Marshall, J. D. (2004). Palaeoclimate Interpretation of Stable Isotope Data from Lake Sediment Archives. Quat. Sci. Rev. 23 (7-8), 811–831. doi:10.1016/j.quascirev.2003.06.012
Leng, M. J., and Anderson, N. J. (2003). Isotopic Variation in Modern Lake Waters from Western Greenland. Holocene 13 (4), 605–611. doi:10.1191/0959683603hl620rr
Lewis, R. J., Tibby, J., Arnold, L. J., Barr, C., Marshall, J., McGregor, G., et al. (2020). Insights into Subtropical Australian Aridity from Welsby Lagoon, North Stradbroke Island, over the Past 80,000 Years. Quat. Sci. Rev. 234, 106262. doi:10.1016/j.quascirev.2020.106262
Lobegeiger, J., Marshall, J., Vitkovsky, J., Holloway, D., McGregor, G., and Marsh, N. (2015). Waterhole Persistence Model Eco Modeller Plugin. [computer software]
Marcott, S. A., Shakun, J. D., Clark, P. U., and Mix, A. C. (2013). A Reconstruction of Regional and Global Temperature for the Past 11,300 Years. science 339 (6124), 1198–1201. doi:10.1126/science.1228026
Marshall, J. C., and McGregor, G. B. (2011). The Influence of Water Depth on the Distribution of the Emergent sedge'Lepironia articulata'(Cyperaceae) in Two Dune Lakes of Southern Queensland Coastal Wallum Wetlands. Proc. R. Soc. Qld. 117, 193. doi:10.3316/informit.551749154131570
Marshall, J. C., McGregor, G., and Negus, P. (2006). Assessment of North Stradbroke Island Groundwater Dependent Ecosystems: Potential Responses to Increases in Groundwater Extraction. Brisbane: Queensland Department of Natural Resources and Water.
Marshall, J. C., Negus, P. M., Steward, A. L., and McGregor, G. (2011). Distributions of the Freshwater Fish and Aquatic Macroinvertebrates of North Stradbroke Island Are Differentially Influenced by Landscape History, Marine Connectivity and Habitat Preference. Proc. R. Soc. Qld. The. 117, 239. doi:10.3316/ielapa.552233611384283
McGregor, G., and Marshall, J. (2013). Water Resource (Logan Basin) Plan 2007: Assessment of Scenario Implications for Groundwater Dependent Ecosystems of the Southern Moreton Bay Islands. Tech. Advis. Panel Report–Stage 2, 1–192.
McGregor, G. B. (2018). Freshwater Cyanobacteria of North-Eastern Australia: 3. Nostocales. Phytotaxa 359, 1–166. doi:10.11646/phytotaxa.359.1.1
Me, W., Hamilton, D. P., McBride, C. G., Abell, J. M., and Hicks, B. J. (2018). Modelling Hydrology and Water Quality in a Mixed Land Use Catchment and Eutrophic Lake: Effects of Nutrient Load Reductions and Climate Change. Environ. Model. Softw. 109, 114–133. doi:10.1016/j.envsoft.2018.08.001
Meredith, K., Hollins, S., Hughes, C., Cendón, D., and Stone, D. (2013). The Influence of Groundwater/surface Water Exchange on Stable Water Isotopic Signatures along the Darling River, NSW, Australia. Groundwater and Ecosystems. Boca Raton, FL, USA: CRC Press, 57.
Meredith, K. T., Hollins, S. E., Hughes, C. E., Cendón, D. I., Chisari, R., Griffiths, A., et al. (2015). Evaporation and Concentration Gradients Created by Episodic River Recharge in a Semi-arid Zone Aquifer: Insights from Cl−, δ18O, δ2H, and 3H. J. Hydrology 529, 1070–1078. doi:10.1016/j.jhydrol.2015.09.025
Mettam, P., Tibby, J., Barr, C., and Marshall, J. (2011). Development of Eighteen Mile Swamp, North Stradbroke Island: a Palaeolimnological Study. Proc. R. Soc. Qld. 117, 119. doi:10.3316/ielapa.551227430936341
Mills, K., Gell, P., Hesse, P. P., Jones, R., Kershaw, P., Drysdale, R., et al. (2013). Paleoclimate Studies and Natural-Resource Management in the Murray-Darling Basin I: Past, Present and Future Climates. Aust. J. Earth Sci. 60 (5), 547–560. doi:10.1080/08120099.2013.804879
Morton, F. I. (1983). Operational Estimates of Lake Evaporation. J. hydrology 66 (1-4), 77–100. doi:10.1016/0022-1694(83)90178-6
Moss, P., Petherick, L., and Neil, D. (2011). Environmental Change at Myora Springs, North Stradbroke Island over the Last Millennium. Proc. R. Soc. Qld. 117, 113. doi:10.3316/informit.551525558476472
Moss, P. T., Tibby, J., Petherick, L., McGowan, H., and Barr, C. (2013). Late Quaternary Vegetation History of North Stradbroke Island, Queensland, Eastern Australia. Quat. Sci. Rev. 74, 257–272. doi:10.1016/j.quascirev.2013.02.019
Noon, P. E., Leng, M. J., Arrowsmith, C., Edworthy, M. G., and Strachan, R. J. (2002). Seasonal Observations of Stable Isotope Variations in a Valley Catchment, Signy Island, South Orkney Islands. Antartic Sci. 14 (4), 333–342. doi:10.1017/s0954102002000159
Page, T. J., Marshall, J. C., and Hughes, J. M. (2012). The World in a Grain of Sand: Evolutionarily Relevant, Small-Scale Freshwater Bioregions on Subtropical Dune Islands. Freshw. Biol. 57 (3), 612–627. doi:10.1111/j.1365-2427.2011.02713.x
Patton, N. R., Ellerton, D., and Shulmeister, J. (2019). High-resolution Remapping of the Coastal Dune Fields of South East Queensland, Australia: a Morphometric Approach. J. Maps 15 (2), 578–589. doi:10.1080/17445647.2019.1642246
Potter, N., Zhang, L., Milly, P., McMahon, T. A., and Jakeman, A. (2005). Effects of Rainfall Seasonality and Soil Moisture Capacity on Mean Annual Water Balance for Australian Catchments. Water Resour. Res. 41 (6), 3697. doi:10.1029/2004wr003697
Remmer, C. R., Neary, L. K., Kay, M. L., Wolfe, B. B., and Hall, R. I. (2020). Multi-year Isoscapes of Lake Water Balances across a Dynamic Northern Freshwater Delta. Environ. Res. Lett. 15 (10), 104066. doi:10.1088/1748-9326/abb267
Rietti-Shati, M., Yam, R., Karlen, W., and Shemesh, A. (2000). Stable Isotope Composition of Tropical High-Altitude Fresh-Waters on Mt. Kenya, Equatorial East Africa. Chem. Geol. 166 (3-4), 341–350. doi:10.1016/s0009-2541(99)00233-8
Rott, E., Kling, H., and McGregor, G. (2006). Studies on the Diatomurosoleniaround & Crawford (Rhizosoleniophycideae) Part 1. New and Re-classified Species from Subtropical and Tropical Freshwaters. Diatom Res. 21 (1), 105–124. doi:10.1080/0269249x.2006.9705655
Rouillard, A., Skrzypek, G., Turney, C., Dogramaci, S., Hua, Q., Zawadzki, A., et al. (2016). Evidence for Extreme Floods in Arid Subtropical Northwest Australia during the Little Ice Age Chronozone (CE 1400-1850). Quat. Sci. Rev. 144, 107–122. doi:10.1016/j.quascirev.2016.05.004
Russell, J. M., and Johnson, T. C. (2006). The Water Balance and Stable Isotope Hydrology of Lake Edward, Uganda-Congo. J. Gt. Lakes. Res. 32 (1), 77–90. doi:10.3394/0380-1330(2006)32[77:twbasi]2.0.co;2
Skrzypek, G., Mydłowski, A., Dogramaci, S., Hedley, P., Gibson, J. J., and Grierson, P. F. (2015). Estimation of Evaporative Loss Based on the Stable Isotope Composition of Water Using Hydrocalculator. J. Hydrology 523, 781–789. doi:10.1016/j.jhydrol.2015.02.010
Specht, A., and Stubbs, B. (2011). Long-term Monitoring of a Coastal Sandy Freshwater Wetland: Eighteen Mile Swamp, North Stradbroke Island, Queensland. Proc. R. Soc. Qld. 117, 201. doi:10.3316/ielapa.551842318987861
Steinman, B. A., Rosenmeier, M. F., Abbott, M. B., and Bain, D. J. (2010). The Isotopic and Hydrologic Response of Small, Closed-Basin Lakes to Climate Forcing from Predictive Models: Application to Paleoclimate Studies in the Upper Columbia River Basin. Limnol. Oceanogr. 55 (6), 2231–2245. doi:10.4319/lo.2010.55.6.2231
Tibby, J., Barr, C., Marshall, J. C., M c Gregor, G. B., Moss, P. T., Arnold, L. J., et al. (2017). Persistence of Wetlands on North Stradbroke Island (South‐east Queensland, Australia) during the Last Glacial Cycle: Implications for Quaternary Science and Biogeography. J. Quat. Sci. 32 (6), 770–781. doi:10.1002/jqs.2981
Tibby, J., Tyler, J. J., and Barr, C. (2018). Post Little Ice Age Drying of Eastern Australia Conflates Understanding of Early Settlement Impacts. Quat. Sci. Rev. 202, 45–52. doi:10.1016/j.quascirev.2018.10.033
Tyler, J. J., Jones, M., Arrowsmith, C., Allott, T., and Leng, M. J. (2016). Spatial Patterns in the Oxygen Isotope Composition of Daily Rainfall in the British Isles. Clim. Dyn. 47 (5-6), 1971–1987. doi:10.1007/s00382-015-2945-y
Tyler, J. J., Leng, M. J., and Arrowsmith, C. (2007). Seasonality and the Isotope Hydrology of Lochnagar, a Scottish Mountain Lake: Implications for Palaeoclimate Research. Holocene 17, 717–727. doi:10.1177/0959683607080513
Tyler, J. J., Mills, K., Barr, C., Sniderman, J. M. K., Gell, P. A., and Karoly, D. J. (2015). Identifying Coherent Patterns of Environmental Change between Multiple, Multivariate Records: an Application to Four 1000-year Diatom Records from Victoria, Australia. Quat. Sci. Rev. 119, 94–105. doi:10.1016/j.quascirev.2015.04.010
Ward, W. T. (2006). Coastal Dunes and Strandplains in Southeast Queensland: Sequence and Chronology. Aust. J. Earth Sci. 53 (2), 363–373. doi:10.1080/08120090500507354
WetlandInfo (2013). Traditional Values of Wetlands. Queensland Government: Department of Environment and Science. https://wetlandinfo.des.qld.gov.au/wetlands/management/wetland-values/traditional-owners.html.
Wigdahl, C. R., Saros, J. E., Fritz, S. C., Stone, J. R., and Engstrom, D. R. (2014). The Influence of Basin Morphometry on the Regional Coherence of Patterns of Diatom-Inferred Salinity in Lakes of the Northern Great Plains (USA). Holocene, 0959683614523154. doi:10.1177/0959683614523154
Yihdego, Y., Webb, J. A., and Leahy, P. (2015). Modelling of Lake Level under Climate Change Conditions: Lake Purrumbete in Southeastern Australia. Environ. Earth Sci. 73 (7), 3855–3872. doi:10.1007/s12665-014-3669-8
Keywords: wetlands, lakes, subtropics, oxygen isotopes, climate change
Citation: Tyler JJ, Marshall JC, Schulz C, Barr C, Hofmann H, Blessing JJ, McCoy K, McGregor GB and Tibby J (2022) Hydrological and Isotopic Variability of Perched Wetlands on North Stradbroke Island (Minjerribah), Australia: Implications for Understanding the Effects of Past and Future Climate Change. Front. Environ. Sci. 10:868114. doi: 10.3389/fenvs.2022.868114
Received: 02 February 2022; Accepted: 07 June 2022;
Published: 01 July 2022.
Edited by:
Sandra Olga Brizga, Brizga Environmental, AustraliaReviewed by:
Thomas A. Minckley, University of Wyoming, United StatesSalli F. Dymond, University of Minnesota Duluth, United States
Copyright © 2022 Tyler, Marshall, Schulz, Barr, Hofmann, Blessing, McCoy, McGregor and Tibby. This is an open-access article distributed under the terms of the Creative Commons Attribution License (CC BY). The use, distribution or reproduction in other forums is permitted, provided the original author(s) and the copyright owner(s) are credited and that the original publication in this journal is cited, in accordance with accepted academic practice. No use, distribution or reproduction is permitted which does not comply with these terms.
*Correspondence: Jonathan J. Tyler, am9uYXRoYW4udHlsZXJAYWRlbGFpZGUuZWR1LmF1