 Camila Aida Campos
 Alan M. Tonin
 Mark J. Kennard
 José Francisco Gonçalves Júnior1
- 1Aquariparia-Limnology Lab, Department of Ecology, Institute of Biological Sciences, University of Brasília (UnB), Brasília, Brazil
- 2Regulatory Agency for Water, Energy and Sanitation of the Federal District (ADASA), Brasília, Brazil
- 3Australian Rivers Institute, Griffith University, Nathan, QLD, Australia
Freshwater environments are among the most threatened by human activities, consequently, their ecosystem structures and functions are targets of significant transformations. It makes monitoring an essential tool in the management of these environments. Ecological metrics have been proven to be effective in monitoring programs aimed at assessing freshwater ecosystem integrity. Structural and functional aspects of the ecosystem may allow for a comprehensive view of the multiple human impacts that occur at different scales. However, a gap in the effective use of such ecological tools lies in the identification of the relative importance of different mechanisms that cause impacts and the interactions between them. Using Boosted Regression Tree (BRT) models, we evaluated the relative importance of natural and human impact factors, from local to catchment scales, on metrics related to diatom and macroinvertebrate assemblages and ecosystem processes. The study was carried out in 52 stream reaches of the Brazilian savanna in central Brazil. Conductivity was the most relevant factor to explain the variation of ecological metrics. In general, macroinvertebrate metrics and algal biomass production responded to both water quality and land use factors, while metrics of diatoms and microbial biomass responded more strongly to water quality variables. The nonlinear responses allowed the detection of gradual or abrupt-changes curves, indicating potential thresholds of important drivers, like conductivity (100–200 µS cm−1), phosphate (0.5 mg L−1) and catchment-scale urbanization (10–20%). Considering the best performance models and the ability to respond rather to stress than to natural factors, the potential bioindicators identified in the study area were the macroinvertebrates abundance, the percentage of group Ephemeroptera/Plecoptera/Trichoptera abundance, the percentage of group Oligochaeta/Hirudinea abundance, the percentage of genus Eunotia abundance, the Trophic Diatom Index and the algal biomass production. The results reinforced the importance of consider in the national monitoring guidelines validated ecological thresholds. Thus, maintaining the balance of aquatic ecosystems may finally be on the way to being achieved.
1 Introduction
Freshwater ecosystems are among the most threatened by human activities (Gatti 2016). The knowledge of the various components of these ecosystems is of paramount importance to the elaboration of public policies on conservation or recovery (Bunn et al., 2010). Biomonitoring data has been increasingly used in determining the ecological conditions of aquatic environments, in addition to the traditional physical and chemical indicators of water quality (Leese et al., 2018; Pardo et al., 2018; Gieswein et al., 2019). A comprehensive ecosystem integrity assessment should consider both structural and functional characteristics (Bunn & Davies 2000). While the structure of an ecosystem comprises physical and chemical attributes related to water quality, composition of biological assemblages and habitat conditions, its functioning is related to the processes regulating energy and matter fluxes (Tilman et al., 2014).
The most commonly used metrics to assess freshwater ecosystem integrity are those related to biological assemblages, such as species richness and diversity, abundance, the proportion of tolerant and sensitive taxa, organismal traits (e.g., feeding habits, body size, mobility), and indices of sensitivity to pollution (Hering et al., 2006). Macroinvertebrates, diatoms, macrophytes and fish are often used for that purpose (Son et al., 2018; Waite et al., 2019) as they are robust to the identification of several human disturbances and present particular features that facilitate such application (e.g., life cycle, habitat, size; Merritt & Cummins 1996; Kelly et al., 2008). Much less explored in the context of biomonitoring are aquatic fungi and bacteria, which are key decomposers of organic matter in streams. The responses of some ecosystem processes to stressors are fundamental to understanding the effects of human disturbances on ecosystem services that produce direct benefits to people. But despite this, there is still a lot of reluctance among managers and little use of functional indicators (e.g., litter decomposition) in monitoring programs (Schiller et al., 2017).
Although many studies have pointed out to the applicability of several ecological metrics for assessing freshwater ecosystem integrity, the main gap lies in the relative importance of different mechanisms that cause impacts and the interactions between them (Wenger et al., 2009). According to Sutherland et al. (2013), one solution is the use of modelling as a tool for measuring and monitoring systems. In the context of environmental management, most models used in monitoring programs consider biological assemblages, especially benthic invertebrates (AUSRIVAS, Smith et al., 1999; RIVPACS, Wright et al., 1984; USEPA, 2016), as indicators. Some studies suggest the use of ecosystem processes for this purpose (Gessner & Chauvet 2002; Feio et al., 2010; Woodward et al., 2012), and rare are those that present a multi-metric approach using structural and functional aspects (but see Castela et al., 2008; Clapcott et al., 2014).
In Brazil, as in many other tropical countries, monitoring programs focus on physical and chemical variables of water, with a substantial gap in knowledge about the structure and functioning of aquatic ecosystems. The Brazilian savanna (Cerrado) is a global biodiversity hotspot (Myers et al., 2000), and its headwaters are responsible for 70% of all water supply to other Brazilian regions (Lima & Silva 2007). However, the devastation of Cerrado has been taking place at levels proportional to its ecological and social relevance (Strassburg et al., 2017). It is urgent to know the behaviour of these threatened ecosystems through two valuable management tools: 1) the identification of variables that respond strongly to anthropogenic impacts than to natural variations, and 2) the identification of ecological thresholds that are adopted as standards in monitoring programs. We define the term ‘ecological threshold’ as a point along a stressor gradient where the relationship between the stressor and an ecological indicator shows an abrupt change in the response curve that can be ecologically explained and significantly relevant for management (Wagenhoff et al., 2017).
In this context, Boosted Regression Tree (BRT) models have been used as a robust tool to identify the influence of environmental variables, natural or those related to human activities, on ecological metrics, making it possible to evaluate the shape of the responses and to make forecasts by using new data (Clapcott et al., 2012; Waite et al., 2019). This approach allows the identification of gradients, from which is possible to detect non-linear responses, interactions among predictors and potential threshold zones. However, identification of potential thresholds alone is not helpful for management if it does not accompany by an analysis of their ecological consequences relevant to management decisions. Furthermore, it is important to consider a group of non-redundant variables so that the impacts of different stressors on the structure and function of ecosystems are detected. This approach would lead to more robust in-stream objectives and provide options for adopting goals that protect the aspects of ecosystems that people value most (Wagenhoff et al., 2017). Several studies have used BRT models to identify thresholds in a diversity of ecological areas, highlighting the potential of this tool to environmental management (Davis et al., 2019; Giri et al., 2019; Wherry et al., 2021).
This study evaluated how ecological metrics respond to natural environmental gradients and human-related stressors (local and catchment) at different spatial scales. We also identified the most suitable metrics to be used as indicators of stream integrity and assessed the response and potential thresholds of ecological metrics along environmental gradients to inform the ecological management of Cerrado freshwaters.
2 Materials and methods
2.1 Study area
The study was conducted in the central Brazilian plateau (ca. 1,000 m a.s.l.) in an area of approximately 6,700 km2 dominated by Cerrado (Brazilian savanna) vegetation. Fifty-two stream reaches were selected to represent a broad range of natural environmental conditions (Figure 1). Briefly, sample sites were chosen to represent regions with different land uses and watersheds with different natural characteristics; accessibility for sampling was also taken into account for site selection. When more than one reach was sampled in the same stream, they were at least 500 m apart from each other (to reduce their spatial dependence) and comprised different natural characteristics. All streams are wadeable and perennial of up to 5th order (Strahler 1957).
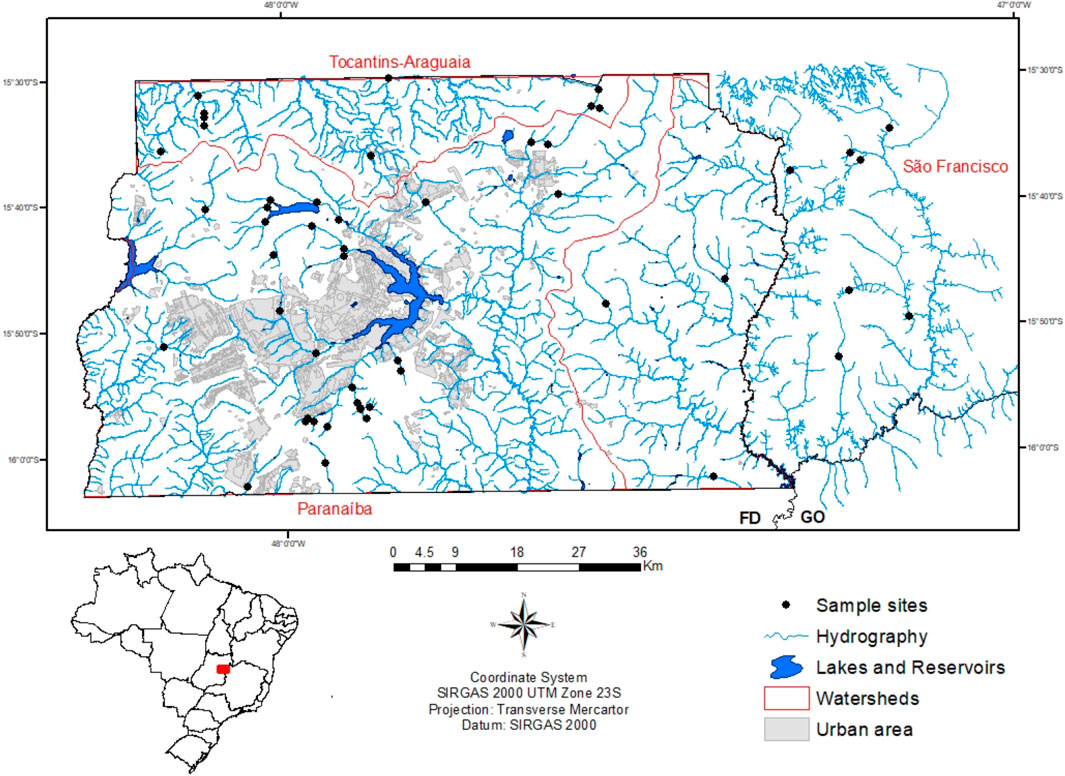
FIGURE 1. Spatial distribution of the 52 stream reaches in the regional river network. The red limits represent the portion of the national watersheds (Tocantins-Araguaia, São Francisco and Paranaíba) located in the study area (Federal District and Goiás) in central Brazil.
2.2 Sampling, analysis and metrics
Two sampling campaigns were conducted in 2018, one at the end of the wet season (April/May)—which is from November to March—and a second at the end of dry season (August/September)—which is from May to September.
2.2.1 Predictor variables
A large number of variables related to natural conditions and human stressors were previously measured at each stream reach (Campos et al., 2021). From this dataset, we retained only uncorrelated variables (absolute Pearson’s r < 0.6) which include natural characteristics (drainage area, elevation, riparian shading, and percentage of organic matter and coarse sediments in the riverbed), water quality variables commonly used in monitoring programs and considered as indirect indicators of human disturbances (dissolved oxygen, conductivity, turbidity, nitrate, and phosphate), and primary sources of human disturbances (urbanization and agriculture in the catchment area and in the riparian corridor, other uses in the catchment, presence of upstream point-source sewage release and dam) (Table 1). All of them will be considered hereinafter as predictors. The season (wet and dry) was also considered as a predictor since it may affect some of our biological response metrics.
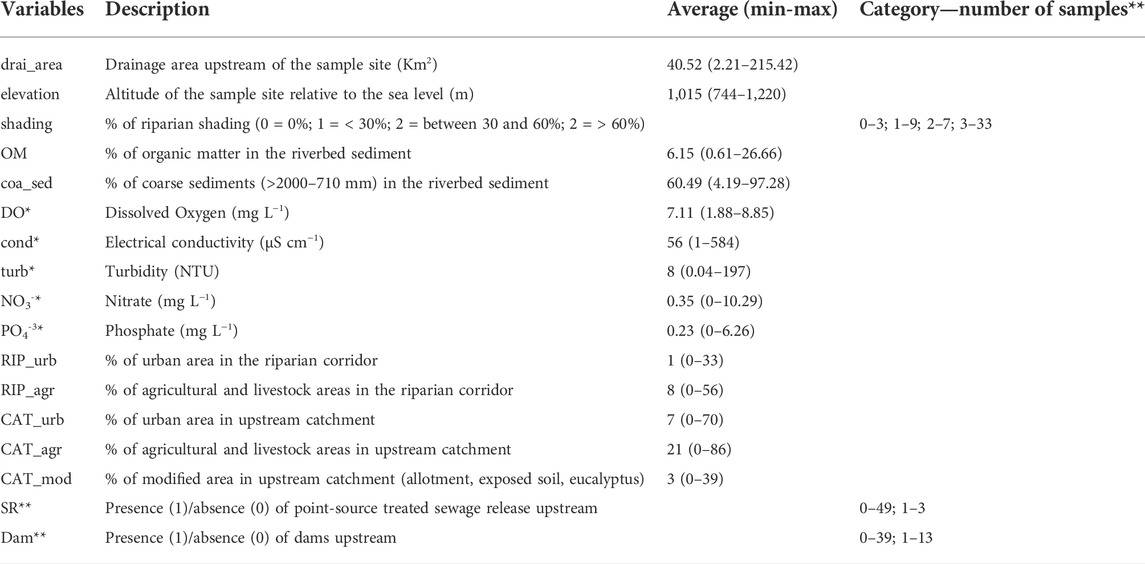
TABLE 1. Description, average and range (minimum and maximum) of natural and human disturbances variables. (*) Data collected four times, but for analysis, we consider the average between April/May and August/September. (**) For categorical variables, we indicated the number of samples in each category.
2.2.2 Response metrics
A large number of ecological metrics were considered in this study (Table 2). The structural metrics are related to the diatom and macroinvertebrate assemblages’ composition. The functional metrics include relevant ecosystem processes such as leaf litter decomposition (microbial and total), sediment respiration and algal and microbial biomass production.
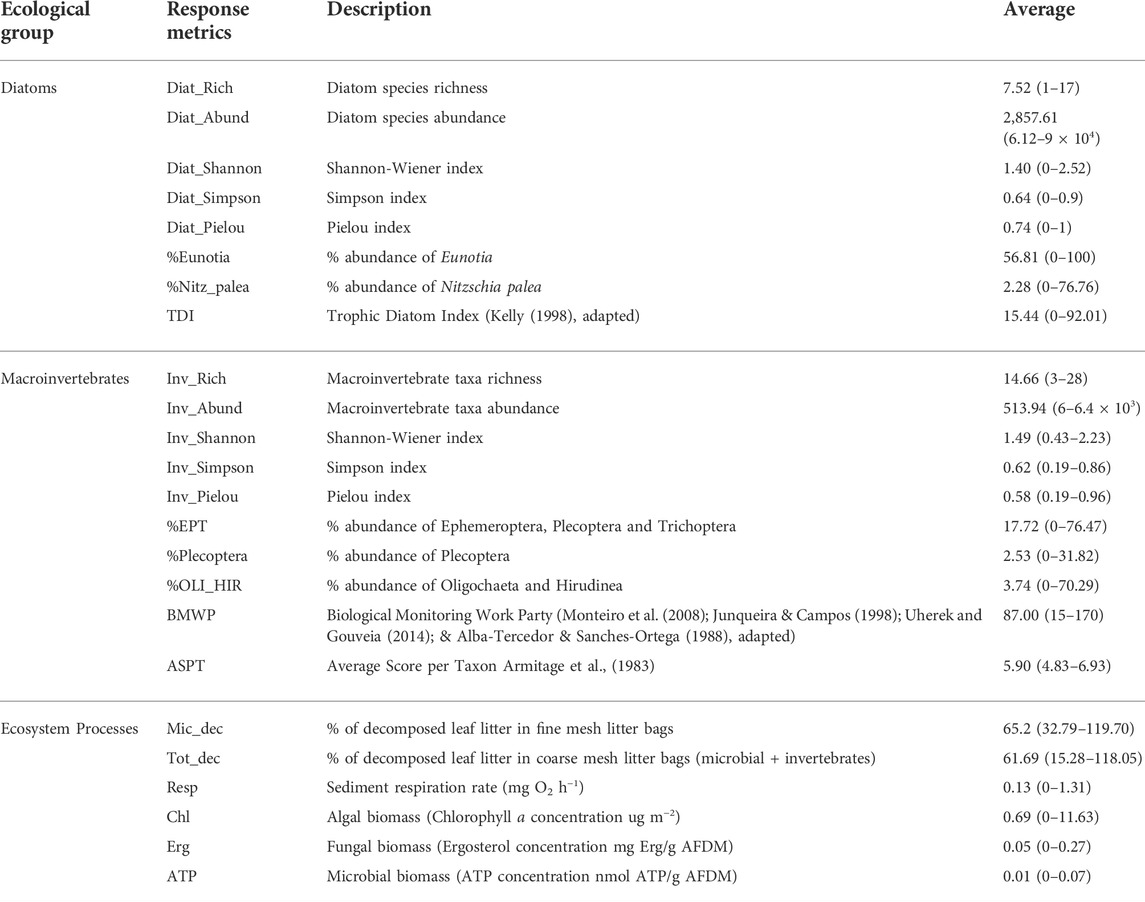
TABLE 2. Description, average and range (minimum and maximum) of ecological response metrics.
2.2.3 Biological assemblages sampling
Macroinvertebrates were sampled using a surber (0.09 m2 area and 0.25 mm mesh size) to collect five sub-samples per site covering the proportional diversity of habitats. The sub-samples were then integrated and preserved in 96% alcohol to be sorted and identified under a stereomicroscope to the lower taxonomic level possible (until family). Diatoms were sampled from five 10 × 10 cm pieces of artificial substrates (slate stones) that were incubated in the riverbed for approximately 30 days. Nearly 250 cm2 were scraped and the shaved material was preserved in vials containing 0.33% Lugol solution. The identification and quantification of the organisms were carried out under an inverted microscope (Utermöhl 1931). Identification of macroinvertebrates and diatoms was carried out mostly to family and species level, respectively, with the assistance of taxonomic specialists (see Acknowledgments).
2.2.4 Biological assemblage metrics
We considered in this study metrics related to the structure and sensitivity to pollution of diatom and macroinvertebrate assemblages. The structure was composed of richness, abundance, diversity (Shannon-Wiener, Simpson), and evenness (Pielou) indices. The percentage abundance of pollution-sensitive taxa was calculated for the diatom genus Eunotia, for diatoms, and for the macroinvertebrate orders Ephemeroptera/Plecoptera/Trichoptera (EPT) and the Plecoptera order alone. The percentage abundance of pollution-tolerant taxa was calculated for the diatom species Nitzschia palea, and for the macroinvertebrate classes Oligochaeta and Hirudinea.
Some pollution sensitivity indices were adapted for diatoms and macroinvertebrates. The TDI (Trophic Diatom Index) was adapted from Kelly (1998). Although this index has been developed in Europe, it has the most complete species list. Only 8 of the 74 species identified were not described in the TDI list, hence we attributed the lowest value 1) to them, not to have too much influence on the result. The Biological Monitoring Working Party (BMWP) was adapted from four BMWP indices developed in different regions. The main reference was Monteiro et al. (2008), followed by Junqueira & Campos (1998), Uherek & Gouveia (2014), and Alba-Tercedor & Sánchez-Ortega (1988). Taxa without published sensitivity grades were attributed with the lowest score (1). The Average Score per Taxon (ASPT) index Armitage et al. (1983) was calculated by dividing the score of each taxon by the total number of scoring taxa.
2.2.5 Ecosystem processes
The respiration rates on river sediments were measured following Feio et al. (2010), with some adaptations, as an indication of river metabolism. Three PVC chambers (30 cm long, ø 4.4 cm) were half-filled with riverbed sediment (<1 cm diameter; collected up to 15 cm depth) and then filled in with stream water and sealed with rubber stoppers. To control, one PVC chamber was filled in only with river water. Respiration rates were measured as the depletion of dissolved oxygen in the chambers after approximately 30 min. The volume of water in each chamber was measured using a beaker.
The respiration rate for each site was given by the expression (1):
where Rr (mg O2 L−1 h−1) is the respiration rate, “s” is each chamber, V is the volume (L) of water in each chamber, Of is the final O2 concentration (mg L−1), measured with a YSI probe), Oi is the initial O2 concentration (mg L−1), “t” is the incubation period (hours) and “c” is the control chamber. Respiration was measured only in September (dry season).
The microbial (fine mesh bag-FMB) and total (coarse mesh bag-CMB) leaf litter decomposition rates were calculated by the decrease in leaves weight after 30 days of incubation on riverbeds. Portions with approximately 3 ± 0.5 g of dry air leaves (Hyeronimia alchorneoides) were placed in fine- (0.25 mm mesh; 13 cm × 20 cm size) and coarse-mesh litter bags (10 mm mesh; 18 cm × 23 cm size). The use of FMB (only microbial effects) and CMB (microbial and invertebrates assemblages’ effects) allows distinguishing the contribution of microorganisms and macroinvertebrates to the loss of leaf litter mass. Moreover, CMB may also add the physical water abrasion effect (Tonin et al., 2018).
In the laboratory, six leaf discs (10 mm diameter) were cut from each sample. A set of a three-leaves disc was used to determine ergosterol content (as an indirect measure of fungal biomass on decomposing leaves; Gessner 2005) and another similar set was used to determine the total ATP content (as an indirect measure of the total microbial biomass; Abelho 2005). The results were expressed in % of decomposed biomass standardized for 30 days.
A similar piece of artificial substrate area scraped for diatoms (approx. 250 cm2) was scraped off for Chlorophyll a determination, an indirect measure of periphytic algal biomass. The material was filtered (glass fibre 0.45 mm filters) and frozen until analysis. Chlorophyll a concentration (µg m−2) was determined spectrophotometrically after acetone extraction (Wetzel & Likens 1991).
2.3 Data analysis
To quantify the relationships between selected predictors and response metrics we used Boosted Regression Tree (BRT) analysis. BRTs provide a means to fit nonlinear relationships between predictors to response metrics, including interaction effects, by using a boosting strategy to combine results from a large number (often thousands) of simple regression tree models (Friedman 2001). Three elements are fundamental in the execution of the BRT models: 1) tree complexity (tc), which controls whether the interactions are fitted; 2) the learning rate (lr), which determines the contribution of each tree to the growing model; and 3) the number of trees (nt) necessary for the optimization of the model, which is determined based on the two previous parameters (Elith et al., 2008). We adopted the tree complexity (tc) equal to 5, and the learning rate varying between 0.01 and 0.0001, guaranteeing that at least 1,000 trees were generated for each metric (see all settings in Supplementary Material). The bag fraction (bf) represents the proportion of training data to be selected, without replacement, at each interaction, thus controlling the stochasticity of randomization. We applied bf equal to 0.75. Within the BRT, the cross-validation (CV) technique provides a means for testing the model using part of the training data, while still using all data at some stage to fit the model. It is useful especially in cases of relatively low sample sizes (Elith et al., 2008), as is the case of this study.
BRT outputs included the performance of training data (% variation explained) and test data (CV correlation), the relative influence (contribution) of each predictor to explain the training data (sum adds up to 100%). Lastly, partial dependence plots indicated the shapes of relationships between predictors and the response variable (e.g., linear, curvilinear, and sigmoidal) taking into account the average effect of all other predictors (Elith et al., 2008). We also used the shapes for visual identification of thresholds (Wagenhoff et al., 2017).
In a second step, the models were reduced with the exclusion of predictor variables that contributed less than 2% to explain each response variable, since the reduction of variables is desirable considering that BRT models tend to overfit models (Elith et al., 2008; Brown et al., 2012). The results presented refer to the reduced final models. Sewage release (SR) was excluded from the reduced models in all response metrics (less than 2% of relative contribution). All statistical analyses were performed using the gbm package (Greenwel et al., 2018) from R v.4.0.3 (R Core Team 2020) and specific code for BRT provided by Elith et al. (2008).
3 Results
3.1 Performance of boosted regression tree models
For macroinvertebrate metrics, the highest percentages of variance explained were observed for % Oligochaeta/Hirudinea (91%), Macroinvertebrate abundance (84%), % Plecoptera (82%) and % EPT (70%). For diatom metrics, BRT models explained the highest percentage of variation for: %Eunotia (87%), Trophic Diatom Index (TDI, 84%) and Diatom richness (77%). Metrics of ecosystem processes were best predicted for algal biomass production (Chl, 96%), microbial decomposition (Mic_dec, 82%) and total decomposition (Tot_dec, 73%) (Figure 2). The medians of the structural and functional metrics were very similar, around 60% (Figure 2).
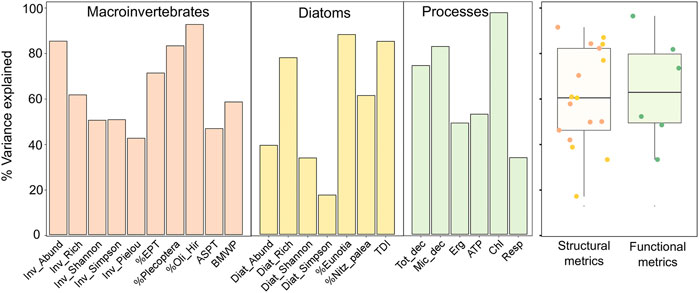
FIGURE 2. Percentage of variance explained for Macroinvertebrates, Diatoms, and Ecosystem Processes metrics models (see the metrics description in Table 2). Diat_Pielou is not shown because it was not possible to run the model. Boxplot of structural (Diatoms and Macroinvertebrates) and functional (ecosystem processes) metrics results. See all model settings and statistics in the Supplementary Material.
3.2 Relative contributions of predictor variables
Predictors related to the river size (drainage area and elevation) were important to explain some metrics, but especially %Plecoptera, for which the two predictors combined explained 29% of its variation. Habitat variables explained large portions of variation in a few metrics, most noteworthy among them was the percentage of organic matter in river sediment for macroinvertebrate metrics, ergosterol, and ATP (Figure 3).
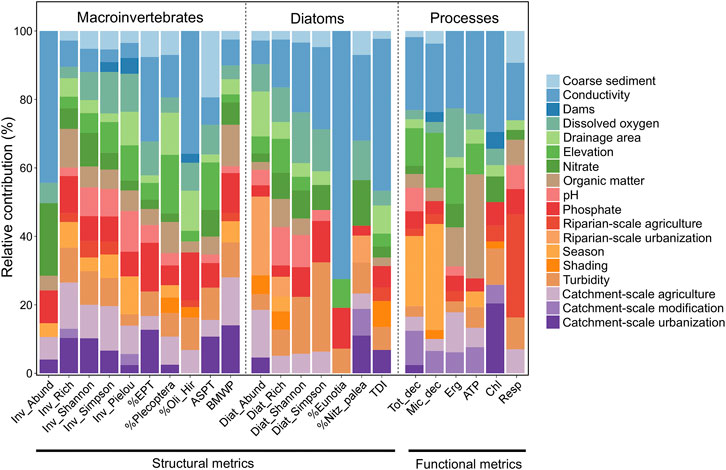
FIGURE 3. Relative contribution (0–100%) of predictor variables on the variance explained of each response ecological metrics (structural and functional; see the metrics description in Table 2). Sewage release (SR) was excluded because its contribution was 0% in all models.
Water quality variables were relevant in explaining almost all metrics. Conductivity highly contributed for most metrics (macroinvertebrates, diatoms and ecosystem processes). Turbidity, dissolved oxygen, nitrate, and phosphate were also relevant for some response metrics (Figure 3).
Among the land use predictors, agricultural and urban cover in the upstream catchment (CAT_agr and CAT_urb) explained the largest fraction of variation of the response metrics (Figure 3). Macroinvertebrates metrics were the most influenced by them, but also the abundance of diatoms and sediment respiration. For macroinvertebrates, some metrics were rather explained by urban cover in the upstream catchment (e.g., %EPT, 13%), others by agricultural (e.g., Inv_Simpson, 13%) and others by both, like the macroinvertebrates richness (CAT_agr 14%, CAT_urb 10%) and the BMWP (CAT_agr 14%, CAT_urb 13%). Generally, catchment-scale metrics explained more variation in ecological variables than riparian-scale metrics, except for the abundance of diatoms and respiration rate, which were mostly influenced by urbanization (RIP_urb) and agricultural activities in the riparian corridor (RIP_agr), respectively. The influence of the presence of dams was minimal in all models.
3.3 Ecological response relationships with environmental gradients
The relationships between predictors and response metrics presented some features in common: 1- most response shapes were non-linear; 2- some of the response metrics presented an early increase or decrease followed by the continuity of the curve in the opposite direction; 3- for some of them, it is possible to identify common values from which the curves abruptly changed, which points out to the existence of potential thresholds. For example, change points of most conductivity curves were around 100 µS cm−1. For phosphorus, change points were around 0.5 mg L−1, and CAT_urb between 10 and 20% (Figures 4–6).
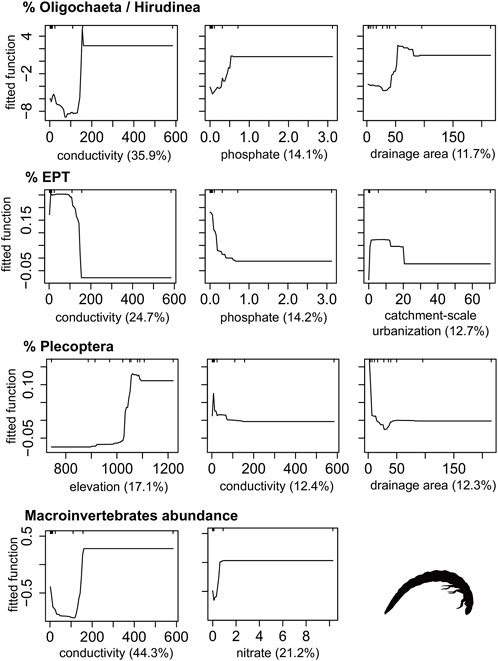
FIGURE 4. Boosted regression tree (BRT) fitted functions for the best performance models of Macroinvertebrate metrics. Plots are only shown for those predictors that explained more than 10% deviance in the metric. Rug plots show the distribution of data, in deciles, of the variable on the X-axis.
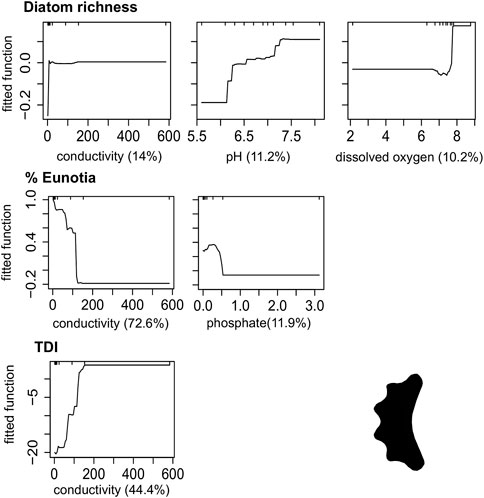
FIGURE 5. Boosted regression tree (BRT) fitted functions for the best performance models of Diatom metrics. Plots are only shown for those predictors that explained more than 10% deviance in the metric. Rug plots show the distribution of data, in deciles, of the variable on the X-axis. (TDI) Trophic Diatom Index.
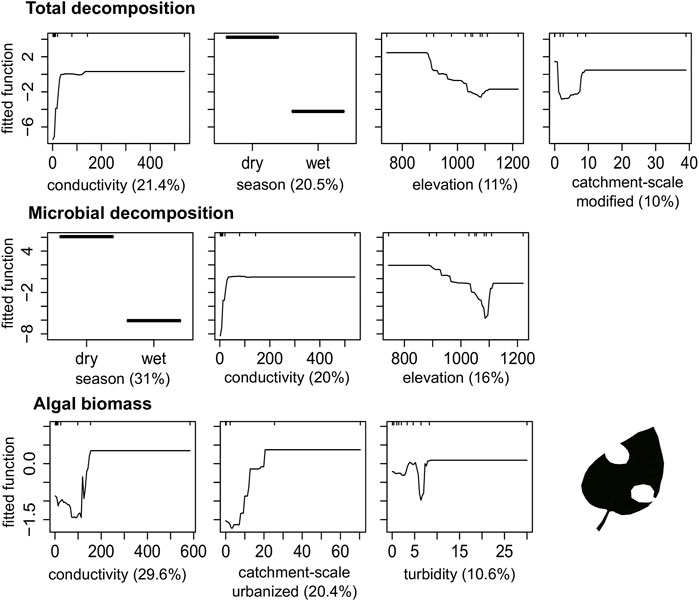
FIGURE 6. Boosted regression tree (BRT) fitted functions for the best performance models of functional metrics. Plots are only shown for those predictors that explained more than 10% deviance in the metric. Rug plots show the distribution of data, in deciles, of the variable on the X-axis.
Conductivity, phosphate, nitrate and land use in the catchment had a positive influence on Macroinvertebrates abundance, %Oligochaeta/Hirudinea, TDI, Diatom richness and algal biomass; and positive on %EPT and %Eunotia. The increase in the drainage area and the reduction in elevation were negatively related to the %Plecoptera, %Eunotia and Diatom richness, and positively related to the increase in %Oligochaeta/Hirudinea, TDI, total and microbial decomposition (Figures 4–6).
4 Discussion
The study made it possible to identify the main predictors driving each ecological metric and how metrics responded to natural and human-related predictors, allowing the detection of potential indicators of stream integrity. While the percentage of EPT group abundance and the algal biomass would be good indicators of urbanization in the upstream catchment, the percentage of Eunotia abundance would indicate changes in water quality. In contrast, other metrics were poorly explained by the predictors or mainly influenced by natural predictors, making them inappropriate indicators of environmental disturbances for management purposes (Norris & Hawkins 2000). Like the Simpson Index for Diatoms showed a low variance explained (17%), the percentage of Plecoptera, which was influenced mainly by natural characteristics (elevation and drainage area), and decomposition primarily influenced by seasonality. Most of our models presented a unidirectional response for direct (land use) and indirect (water quality) human disturbances. Overall, increasing human disturbance (e.g., conductivity and changes in land use) led to a decrease in pollution-sensitive taxa (e.g., percentage of EPT group and Eunotia) and an increase in pollution-tolerant taxa (e.g., percentage of Oligochaeta and Hirudinea, the Trophic Diatom Index and the algal biomass production).
The nonlinear responses promoted insights into the subsidy-stress theory (too much of a good thing syndrome; Odum 1983), which predicts that the increase of limited resources (e.g., nutrients, light) in an environment may have an initial positive effect on biological communities and ecosystem functions. However, this effect rises to a certain threshold; after then, it can lead to adverse effects. In this context, considering that Brazilian savanna streams are poor in nutrients (Markewitz et al., 2006), nutrient inputs possibly promote the maintenance of more species/individuals. But at the other extreme of the gradient, intense disturbances are expected to reduce the number of species that can colonize or tolerate high impact levels (Odum 1983). The shape of the EPT curve (initial low value followed by a sharp rise, lately a decrease) indicates their sensitivity to disturbed environments face to the increase in conductivity, and catchment urbanization was an example of this (Ligeiro et al., 2013; Siegloch et al., 2017). The evaluation of the response curves from BRT models was also a good starting point for discussing thresholds for the considered predictors. Notable change points could be observed, such as conductivity, phosphate, and the percentage of urbanization in the upstream catchment.
Our study showed the most important predictors to explain the ecological metrics were physical and chemical variables often used to indicate human disturbances (Heathwaite 2010; Uriarte et al., 2011; Alvarez-Cabria et al., 2016), such as phosphorus and nitrate concentrations, but especially conductivity. For instance, we reported significant changes in ecological metrics when conductivity stood between 100 and 200 µS cm−1, suggesting a potential threshold. Values above this threshold indicate loss of water quality, except when high conductivity is due to the natural background (Fravet & Cruz 2007; Fundação Nacional de Saúde, 2014; CETESB 2020). Conductivity was the main predictor for the studied metrics in terms of relative importance. Comparing water bodies of preserved and anthropogenic (especially those without vegetation protection) areas, the diffuse sources of pollution resulted in higher electrical conductivity (Gardiner et al., 2009; Rezende et al., 2014). Like in anthropogenic areas with inadequately treated effluents flowing to water bodies, increasing the nutrient concentrations of the water (Myrka et al., 2008).
Phosphorus increase is responsible for triggering the eutrophication of freshwaters (Figueredo et al., 2016; Zhang et al., 2017) coming from agricultural fields and urban effluents (Ockenden et al., 2016). Our results showed potential thresholds for phosphate around 0.5 mg L-1, and its contribution was especially relevant for metrics sensitive to pollution, such as %EPT, %Oli_Hir and %Eunotia, as shown elsewhere (Kelly. 1998; Salomoni et al., 2006; Ferreira et al., 2014; Pardo et al., 2020). Both conductivity and phosphorus were positively related to effluent discharge and deforestation. Anthropogenic areas (remarkably urbanized areas) strongly influence biological assemblages, and their effects are disproportionate to the size of the area used (Rezende et al., 2014; Campos et al., 2021).
Urban and agricultural cover in the upstream catchment was the most important land-use factor to explain the response metrics. The adverse effects of replacing native vegetation with urban or agricultural areas in the upstream catchment have been reported for the stream via complex pathways (Allan 2004) like changes in temperature, habitat diversity, hydromorphology, sunlight, and nutrient availability (Einheuser et al., 2013). These changes have translated into alterations in the structure and functioning of the stream ecosystem (Clapcott et al., 2012). We observed that values between 10 and 20% of urban cover in the upstream catchments led to a decrease in the abundance of the EPT group and an increase in algal biomass. Brito et al. (2020) reported abrupt changes in the composition of macroinvertebrates with the removal of 57–79% of native vegetation in the Amazon Forest, while Dala-Corte et al. (2020) reported threshold values between 3 and 40% of native vegetation removal across biomes in Brazil. Therefore, our results in the study region indicated more restrictive values suggesting that parts of the Brazilian savanna are more susceptible to the conversion of native areas. Additionally, the increase of algal biomass related to the urbanization process confirms a recent study that shows a 32% greater effect on stream functioning than in its structure in the tropics (Wiederkehr et al., 2020).
Changes in biological assemblages and ecosystem processes are commonly associated with alterations in the riparian plants (Encalada et al., 2010; Fierro et al., 2017), especially in headwaters that are light-limited systems and rely on plant litter inputs from surrounding vegetation (Bunn & Davies, 2000; Perona et al., 2009). However, we did not observe a robust relationship with macroinvertebrates. On the other hand, we found a consistent negative relationship among diatoms, urbanization and agriculture in the riparian zone, indicating a higher local than catchment-scale effect. This finding suggests reliable benefits of forested riparian buffers for stream biological diversity in urban environments, supported by previous studies (e.g., Mutinova et al., 2020).
The different responses to the set of predictors, including structural and functional ecosystem metrics, can lead to a comprehensive interpretation of river conditions (Feio et al., 2010). The prediction of ecological conditions is relevant from the management’s point of view since these are more complex data to be acquired but of extreme relevance for understanding the health of water bodies (Karr 2006). Knowledge about the importance of each predictor for the response metrics allows, for example, to predict some ecological conditions in places with limited availability of biological data.
Finally, the potential thresholds identified in the present study are important signs of significant changes in ecological responses. They should be employed in eventual review processes of guidelines to public policies for river health preservation and recovery (Huggett 2005). Brazilian national environmental guidelines do not consider, for example, conductivity (CONAMA n° 357, Brasil 2005), notwithstanding the importance of this variable as an ecosystem driver, as demonstrated in our study. In addition, further attention should be paid to the context of land use, especially to the urbanization processes in the upstream catchment. Currently, Brazil has increased awareness of riparian vegetation (Federal Law n° 12.651, Brasil 2012). However, for purposes of biodiversity conservation and maintenance of ecosystem processes, we also have shown it necessary to consider the entire context of the catchment in which the stream is located.
5 Conclusion
Our results demonstrated the importance of considering a set of ecological response metrics (structural and functional) and environmental factors (natural and disturbances), allowing a complete view of the freshwater ecosystem condition. The relative importance of predictors on ecological metrics pointed to metrics most affected by factors on a local scale (e.g., percentage of Eunotia abundance) and catchment scale (e.g., algal biomass). Also, the nonlinear responses permitted the detection of gradual or abrupt change curves, pointing out the existence of potential thresholds of important drivers, like the conductivity (100–200 µS cm-1), phosphate (0.5 mg L-1), and catchment-scale urbanization (10–20%). The potential bioindicators (considering the best performance models and the ability to respond more strongly to the human disturbances) were macroinvertebrates abundance, EPT abundance percentage, Oligochaeta and Hirudinea abundance percentage, percentage of Eunotia abundance, Trophic Diatom Index, and algal biomass. Although we have worked with many biotic and abiotic variables and the BRT model considered the interaction between them, models are simplified representations of a complex system, therefore presenting limitations. Nevertheless, the consistency and reasonableness of influential metrics within a given set of ecological metrics provide a weight of evidence in support of the models’ results. The BRT models approach proved to be powerful tools that can be effectively employed to enhance and give better direction to freshwater management, not only to the streams of the Brazilian savanna but also to water bodies in other regions.
Data availability statement
The raw data supporting the conclusions of this article will be made available by the authors, without undue reservation.
Author contributions
Campos, CC: Term, Conceptualization, Methodology, Formal analysis, Investigation, Writing–Original Draft, Writing–Review and Editing, Visualization. Tonin, AT: Writing–Review and Editing, Visualization. Kennard, MK: Conceptualization, Writing–Review and Editing, Supervision. JG: Conceptualization, Resources, Funding acquisition, Writing–Review and Editing, Supervision.
Funding
This work was supported by the Institutional Internationalization Program of the Coordination for the Improvement of Higher Education Personnel (CAPES-PrInt; Proc. no. 88887.364699/2019-00) that financed the 1-year PhD sandwich of Campos CC in Brisbane, Australia; the Foundation for Research Support of the Federal District (FAP-DF) for their financial support to Aquariparia Project (edital 05/2016-Águas; Proc. no. 193.000716/2016) that allowed the execution of fieldwork and laboratory analyses; the National Council for Scientific and Technological Development (CNPq) through research fellowship to José Francisco Gonçalves Júnior (Proc. no. 310641/2017-9); and the Regulatory Agency for Water, Energy and Sanitation of the Federal District (ADASA) that in addition to the financial support to Campos CC also offered logistical support of vehicles for the fieldwork.
Acknowledgments
The authors are thankful to the Laboratory of Aquatic Insects and Cytotaxonomy (National Institute of Amazonian Research - INPA) team, for their support in identifying macroinvertebrates. We also thank Maíra Campos, Ana Luiza Dornas and Cleber Figueredo, from Federal University of Minas Gerais (UFMG), for their support in identifying diatoms. Our sincere gratitude to the Australian River Institute (ARI) for hosting Campos CC for 1 year to develop the statistical and modelling analyses of the study. We greatly appreciate the collaboration of all students of the Aquariparia - Limnology Lab (University of Brasilia - UNB) in fieldwork activities an laboratory analyses. Many thanks to Erika Helena Campos, who carried out the final English review. Finally, we would like to thank all institutions (Exército Brasileiro, Marinha Brasileira, Brasília Ambiental (IBRAM), ICMBio, Jardim Botănico, IBGE and UNB) and owners of environmental protected areas (Chapada Imperial and Paraíso na Terra), which allowed the collection of samples on the lands under their administration.
Conflict of interest
The authors declare that the research was conducted in the absence of any commercial or financial relationships that could be construed as a potential conflict of interest.
Publisher’s note
All claims expressed in this article are solely those of the authors and do not necessarily represent those of their affiliated organizations, or those of the publisher, the editors and the reviewers. Any product that may be evaluated in this article, or claim that may be made by its manufacturer, is not guaranteed or endorsed by the publisher.
Supplementary material
The Supplementary Material for this article can be found online at: https://www.frontiersin.org/articles/10.3389/fenvs.2022.867905/full#supplementary-material
References
Alvarez-Cabria, M., Barquín, J., and Peñas, F. J. (2016). Modelling the spatial and seasonal variability of water quality for entire river networks: Relationships with natural and anthropogenic factors. Sci. Total Environ. 545 (546), 152–162. doi:10.1016/j.scitotenv.2015.12.109
Abelho, M. (2005). “Extraction and quantification of ATP as a measure of microbial biomass,” in Methods to study litter decomposition – a practical guide. Editors M. A. S. Graça, F. Bärlocher, and M. Gessner (Dordrecht: Springer), 223–229.
Alba-Tercedor, J., and Sánchez-Ortega, A. (1988). Un método rápido y simple para evaluar la calidad biológica de las aguas corrientes basado en el de Hellawell (1978). Limnetica 4, 51–66. (in Spanish). doi:10.23818/limn.04.06
Allan, J. D. (2004). Landscapes and riverscapes: The influence of land use on stream ecosystems. Annu. Rev. Ecol. Evol. Syst. 35, 257–284. doi:10.1146/annurev.ecolsys.35.120202.110122
Armitage, P. D., Moss, D., Wright, J. F., and Furse, M. T. (1983). The performance of a new biological water quality score system based on macroinvertebrates over a wide range of unpolluted running-water sites. Water Res. 17, 333–347. doi:10.1016/0043-1354(83)90188-4
Brasil, 2012. Federal Law n°; 12651, Available at: http://www.planalto.gov.br/ccivil_03/_ato2011-2014/2012/lei/l12651.htm. [Accessed April 05 2021] (in Portuguese).
Brasil (2005). Resolution no. 357, March 17th 2005. Brasilia: Brazilian Council for the Environment. (CONAMA). Available at: www.mma.gov.br/port/conama/res/res05/res35705.pdf [Accessed April 10, 2021] (in Brasilia).
Brito, J. G., Roque, F. O., Martins, R. T., Nessimian, J. L., Oliveira, V. C., Hughes, R. M., et al. (2020). Small forest losses degrade stream macroinvertebrate assemblages in the eastern Brazilian Amazon. Biol. Conserv. 241, 108263. doi:10.1016/j.biocon.2019.108263
Brown, L. R., May, J. T., Rehn, A. C., Ode, P. R., Waite, I. R., and Kennen, J. G. (2012). Predicting biological condition in southern California streams. Landsc. Urban Plan. 108, 17–27. doi:10.1016/j.landurbplan.2012.07.009
Bunn, S. E., Abal, E. G., Smith, M. J., Choy, S. C., Fellows, C. S., Harch, B. D., et al. (2010). Integration of science and monitoring of river ecosystem health to guide investments in catchment protection and rehabilitation. Freshw. Biol. 55, 223–240. doi:10.1111/j.1365-2427.2009.02375.x
Bunn, S. E., and Davies, P. M. (2000). Biological processes in running waters and their implications for the assessment of ecological integrity. Hydrobiologia 422/423, 61–70. doi:10.1023/a:1017075528625
Campos, C. A., Kennard, M. J., and Gonçalves Júnior, J. F. (2021). Diatom and Macroinvertebrate assemblages to inform management of Brazilian savanna’s watersheds. Ecol. Indic. 128, 107834. doi:10.1016/j.ecolind.2021.107834
Castela, J., Ferreira, V., and Graça, M. A. S. (2008). Evaluation of stream ecological integrity using litter decomposition and benthic invertebrates. Environ. Pollut. 153, 440–449. doi:10.1016/j.envpol.2007.08.005
CETESB (2020). Qualidade das águas interiores no estado de São Paulo 2019. São Paulo. Available at: https://cetesb.sp.gov.br/aguas-interiores/publicacoes-e-relatorios/[Accessed March 20 2019] (in Portuguese).
Clapcott, J. E., Collier, K. J., Death, R. G., Goodwin, E. O., Harding, J. S., Kelly, D., et al. (2012). Quantifying relationships between land-use gradients and structural and functional indicators of stream ecological integrity. Freshw. Biol. 57, 74–90. doi:10.1111/j.1365-2427.2011.02696.x
Clapcott, J. E., Goodwin, E. O., Young, R. G., and Kelly, D. J. (2014). A multimetric approach for predicting the ecological integrity of New Zealand streams. Knowl. Manag. Aquat. Ecosyst. 415, 03. doi:10.1051/kmae/2014027
Dala-Corte, R. B., Melo, A. S., Siqueira, T., Bini, L. M., Martins, R. T., Cunico, A. M., et al. (2020). Thresholds of freshwater biodiversity in response to riparian vegetation loss in the Neotropical region. J. Appl. Ecol. 57, 1391–1402. doi:10.1111/1365-2664.13657
Davis, K. T., Dobrowski, S. Z., Higuera, P. E., Holden, Z. A., Veblen, T. T., Rother, M. T., et al. (2019). Wildfires and climate change push low-elevation forests across a critical climate threshold for tree regeneration. Proc. Natl. Acad. Sci. U. S. A. 116 (13), 6193–6198. doi:10.1073/pnas.1815107116
Einheuser, M. D., Nejadhashemi, A. P., Wang, L., Sowa, S. P., and Woznicki, S. A. (2013). Linking biological integrity and watershed models to assess the impacts of historical land use and climate changes on stream health. Environ. Manage. 51, 1147–1163. doi:10.1007/s00267-013-0043-7
Elith, J., Leathwick, J. R., and Hastie, T. (2008). A working guide to boosted regression trees. J. Anim. Ecol. 77, 802–813. doi:10.1111/j.1365-2656.2008.01390.x
EncaladaCalles, A. C. J., Ferreira, V., Canhoto, C. M., Graça, M. A. S., and Graca, M. A. S. (2010). Riparian land use and the relationship between the benthos and litter decomposition in tropical montane streams. Freshw. Biol. 55, 1719–1733. doi:10.1111/j.1365-2427.2010.02406.x
Feio, M. J., Alves, T., Boavida, M., Medeiros, A., and Graça, M. A. S. (2010). Functional indicators of stream health: A river-basin approach. Freshw. Biol. 55, 1050–1065. doi:10.1111/j.1365-2427.2009.02332.x
Ferreira, W. R., Ligeiro, R., Macedo, D. R., Hughes, R. M., Kaufmann, P. R., Oliveira, L. G., et al. (2014). Importance of environmental factors for the richness and distribution of benthic macroinvertebrates in tropical headwater streams. Freshw. Sci. 33 (3), 860–871. doi:10.1086/676951
Fierro, P., Bertrán, C., Tapia, J., Hauenstein, E., Peña-Cortés, F., Vergara, C., et al. (2017). Effects of local land-use on riparian vegetation, water quality, and the functional organization of macroinvertebrate assemblages. Sci. Total Environ. 609, 724–734. doi:10.1016/j.scitotenv.2017.07.197
Figueredo, C. C., Pinto-Coelho, R. M., Lopes, A. M. M. B., Lima, P. H. O., Gücker, B., and Giani, A. (2016). From intermittent to persistent cyanobacterial blooms: Identifying the main drivers in an urban tropical reservoir. J. Limnol. 75 (3), 445–454. doi:10.4081/jlimnol.2016.1330
Fravet, A. M. M. F., and Cruz, R. L. (2007). Qualidade da água utilizada para irrigação de hortaliças na região de Botucatu-SP. R_I. 12 (2), 144–155. doi:10.15809/irriga.2007v12n2p144-155
Friedman, J. H. (2001). Greedy function approximation: A gradient boosting machine. Ann. Stat. 29, 1189–1232. doi:10.1214/aos/1013203451
Fundação Nacional de Saúde (FUNASA) (2014). Ministério da Saúde, Brasil. Manual de controle da qualidade da água para técnicos que trabalham em ETAS/Ministério da Saúde. Brasília. Funasa: Fundação Nacional de Saúde, 112. p. (in Portuguese).
Gatti, R. C. (2016). Freshwater biodiversity: A review of local and global threats. Int. J. Environ. Stud. 73, 887–904. doi:10.1080/00207233.2016.1204133
Gessner, M. O., and Chauvet, E. (2002). A case for using litter breakdown to assess functional stream integrity. Ecol. Appl. 12, 498–510. doi:10.1890/1051-0761(2002)012[0498:acfulb]2.0.co;2
Gessner, M. O. (2005). “Ergosterol as a measure of fungal biomass,” in Methods to study litter decomposition. Editors M. A. Graça, F. Bärlocher, and M. O. Gessner (Dordrecht: Springer).
Gieswein, A., Hering, D., and Lorenz, A. W. (2019). Development and validation of a macroinvertebrate-based biomonitoring tool to assess fine sediment impact in small mountain streams. Sci. Total Environ. 652, 1290–1301. doi:10.1016/j.scitotenv.2018.10.180
Giri, S., Zhang, Z., Krasnuk, D., and Lathrop, R. G. (2019). Evaluating the impact of land uses on stream integrity using machine learning algorithms. Sci. Total Environ. 696, 133858. doi:10.1016/j.scitotenv.2019.133858
Greenwell, B., Boehmke, B., Cunningham, J., and Developers, G. B. M. (2018). gbm: Generalized boosted regression models. R package version 2.1.4. Retrieved from https://CRAN.R-project.org/package=gbm.
Heathwaite, A. L. (2010). Multiple stressors on water availability at global to catchment scales: Understanding human impact on nutrient cycles to protect water quality and water availability in the long term. Freshw. Biol. 55, 241–257. doi:10.1111/j.1365-2427.2009.02368.x
Hering, D., Johnson, R. K., Kramm, S., Schmutz, S., Szoszkiewicz, K., and Verdonschot, P. F. M. (2006). Assessment of European streams with diatoms, macrophytes, macroinvertebrates and fish: A comparative metric-based analysis of organism response to stress. Freshw. Biol. 51, 1757–1785. doi:10.1111/j.1365-2427.2006.01610.x
Huggett, A. J. (2005). The concept and utility of “ecological thresholds” in biodiversity conservation. Biol. Conserv. 124, 301–310. doi:10.1016/j.biocon.2005.01.037
Junqueira, V. M., and Campos, S. C. M. (1998). Adaptation of the “BMWP” method for water quality evaluation to Rio das Velhas watershed (Minas Gerais, Brazil). Acta Limnol. Bras. 10, 125–135.
Karr, J. R. (2006). Seven foundations of biological monitoring and assessment. Biol. Ambient. 20, 7–18.
Kelly, M. G. (1998). Use of the trophic diatom index to moitor eutrophication in rivers. Water Res. 32, 236–242. doi:10.1016/S0043-1354(97)00157-7
Kelly, M., Juggins, S., Guthrie, R., Pritchard, S., Jamieson, J., Rippey, B., et al. (2008). Assessment of ecological status in U.K. rivers using diatoms. Freshw. Biol. 53, 403–422. doi:10.1111/j.1365-2427.2007.01903.x
Leese, F., Bouchez, A., Abarenkov, K., Altermatt, F., Borja, A., Bruce, K., et al. (2018). Why we need sustainable networks bridging countries, disciplines, cultures and generations for aquatic biomonitoring 2.0: A perspective derived from the DNAqua-net cost action. Adv. Ecol. Res. 58, 63–99. doi:10.1016/bs.aecr.2018.01.001
Ligeiro, R., Hughes, R. M., Kaufmann, P. R., MacEdo, D. R., Firmiano, K. R., Ferreira, W. R., et al. (2013). Defining quantitative stream disturbance gradients and the additive role of habitat variation to explain macroinvertebrate taxa richness. Ecol. Indic. 25, 45–57. doi:10.1016/j.ecolind.2012.09.004
Lima, J. E. F. W., and Silva, E. M. (2007). “Estimativa da contribuição hídrica superficial do Cerrado para as grandes regiões hidrográficas brasileiras,” in Anais do XVII simpósio Brasileiro de Recursos hídricos, 2007 (São Paulo: ABRH). (In Portuguse).
Markewitz, D., Resende, J. C. F., Parron, L., Bustamante, M., Klink, C. A., Figueiredo, R. D. O., et al. (2006). Dissolved rainfall inputs and streamwater outputs in an undisturbed watershed on highly weathered soils in the Brazilian cerrado. Hydrol. Process. 20, 2615–2639. doi:10.1002/hyp.6219
Merritt, R. W., and Cummins, K. (1996). An introduction to the aquatic insects of North America. 3 edition. Dubuque: Kendall/Hunt, 862p.
Monteiro, T. R., Oliveira, L. G., and Godoy, B. S. (2008). Biomonitoramento da qualidade de água utilizando macroinvertebrados bentônicos: Adaptaçao do índice biótico BMWP à bacia do rio meia ponte - GO. Oecol. Austr. 12, 553–563. (in Portuguese). doi:10.4257/oeco.2008.1203.13
Mutinova, P. T., Kahlert, M., Kupilas, B., McKie, B. G., Friberg, N., and Burdon, F. J. (2020). Benthic diatom communities in urban streams and the role of riparian buffers, 12. doi:10.3390/w12102799WaterSwitzerl.
Myers, N., Mittermeier, R., Mittermeier, C., da Fonseca, G. A. B., and Kent, J. (2000). Biodiversity hotspots for conservation priorities. Nature 403, 853–858. doi:10.1038/35002501
Norris, R. H., and Hawkins, C. P. (2000). Monitoring river health. Hydrobiologia 435, 5–17. doi:10.1023/A:1004176507184
Ockenden, M. C., Deasy, C. E., Benskin, C. McW. H., Beven, K. J., Burke, S., Collins, A. L., et al. (2016). Changing climate and nutrient transfers: Evidence from high temporal resolution concentration-flow dynamics in headwater catchments. Sci. Total Environ. 548-549, 325–339. doi:10.1016/j.scitotenv.2015.12.086
Pardo, I., Costas, N., Méndez-Fernández, L., Martínez-Madrid, M., and Rodríguez, P. (2020). Changes in invertebrate community composition allow for consistent interpretation of biodiversity loss in ecological status assessment. Sci. Total Environ. 715, 136995. doi:10.1016/j.scitotenv.2020.136995
Pardo, I., Delgado, C., Abraín, R., Gómez-Rodríguez, C., García-Roselló, E., García, L., et al. (2018). A predictive diatom-based model to assess the ecological status of streams and rivers of Northern Spain. Ecol. Indic. 90, 519–528. doi:10.1016/j.ecolind.2018.03.042
Perona, P., Camporeale, C., Perucca, E., Savina, M., Molnar, P., Burlando, P., et al. (2009). Modelling river and riparian vegetation interactions and related importance for sustainable ecosystem management. Aquat. Sci. 71, 266–278. doi:10.1007/s00027-009-9215-1
R Core Team (2020). R: A language and environment for statistical computing. Vienna, Austria: R Foundation for Statistical Computing. Available at: https://www.R-project.org/.
Salomoni, S. E., Rocha, O., Callegaro, V. L., and Lobo, E. A. (2006). Epilithic diatoms as indicators of water quality in the Gravataí river, Rio Grande do Sul, Brazil. Hydrobiologia 559 (1), 233–246. doi:10.1007/s10750-005-9012-3
Schiller, D. Von, Acuña, V., Aristi, I., Arroita, M., Basaguren, A., Bellin, A., et al. (2017). River ecosystem processes : A synthesis of approaches , criteria of use and sensitivity to environmental stressors. Sci. Total Environ. 597, 465–480. doi:10.1016/j.scitotenv.2017.04.081
Siegloch, A. E., Schmitt, R., Spies, M., Petrucio, M., and Hernández, M. I. M. (2017). Effects of small changes in riparian forest complexity on aquatic insect bioindicators in Brazilian subtropical streams. Mar. Freshw. Res. 68, 519–527. doi:10.1071/MF15162
Smith, M. J., Kay, W. R., Edward, D. H. D., Papas, P. J., Richardson, K. S. J., Simpson, J. C., et al. (1999). AusRivAS: Using macroinvertebrates to assess ecological condition of rivers in Western Australia. Freshw. Biol. 41, 269–282. doi:10.1046/j.1365-2427.1999.00430.x
Son, D., Cho, H., and Lee, E. J. (2018). Determining factors for the occurrence and richness of submerged macrophytes in major Korean rivers. Aquat. Bot. 150, 82–88. doi:10.1016/j.aquabot.2018.07.003
Strahler, A. N. (1957)., 38. American Geophysical Union, 913–920.Quantitative analysis of watershed geomorphologyNew Halen Trans.,
Strassburg, B., Brooks, T., Feltran-Barbieri, R., Iribarrem, A., Crouzeilles, R., Loyola, R., et al. (2017). Moment of truth for the Cerrado hotspot. Nat. Ecol. Evol. 1, 0099. doi:10.1038/s41559-017-0099
Sutherland, W. J., Freckleton, R. P., Godfray, H. C. J., Beissinger, S. R., Benton, T., Cameron, D. D., et al. (2013). Identification of 100 fundamental ecological questions. J. Ecol. 101, 58–67. doi:10.1111/1365-2745.12025
Tilman, D., Isbell, F., and Cowles, J. M. (2014). Biodiversity and ecosystem functioning. Annu. Rev. Ecol. Evol. Syst. 45, 471–493. doi:10.1146/annurev-ecolsys-120213-091917
Tonin, A. M., Hepp, L. U., and Gonçalves, J. F. (2018). Spatial variability of plant litter decomposition in stream networks: From litter bags to watersheds. Ecosystems 21, 567–581. doi:10.1007/s10021-017-0169-1
Uherek, C. B., and Gouveia, F. B. P. (2014). Biological monitoring using macroinvertebrates as bioindicators of water quality of Maroaga stream in the Maroaga cave system, Presidente Figueiredo, Amazon, Brazil. Int. J. Ecol., 1–7. doi:10.1155/2014/308149
Uriarte, M., Yackulic, C. B., Lim, Y., and Arce-Nazario, J. A. (2011). Influence of land use on water quality in a tropical landscape: A multi-scale analysis. Landsc. Ecol. 26, 1151–1164. doi:10.1007/s10980-011-9642-y
USEPA. U.S. Environmental Protection Agency (2016). National rivers and streams assessment 2008-2009: A collaborative survey. Washington, DC: Office of Water and Office of Research and Development. Available at: https://www.epa.gov/sites/production/files/201603/documents/nrsa_0809_march_2_final.pdf.
Utermöhl, von H. (1931). Neue Wege in der quantitativen Erfassung des Planktons. (Mit besondere Beriicksichtigung des Ultraplanktons). SIL Proc. 1922-2010 5, 567–596. doi:10.1080/03680770.1931.11898492
Wagenhoff, A., Liess, A., Pastor, A., Clapcott, J. E., Goodwin, E. O., and Young, R. G. (2017). Thresholds in ecosystem structural and functional responses to agricultural stressors can inform limit setting in streams. Freshw. Sci. 36 (1), 178–194. doi:10.1086/690233
Waite, I. R., Munn, M. D., Moran, P. W., Konrad, C. P., Nowell, L. H., Meador, M. R., et al. (2019). Effects of urban multi-stressors on three stream biotic assemblages. Sci. Total Environ. 660, 1472–1485. doi:10.1016/j.scitotenv.2018.12.240
Wenger, S. J., Roy, A. H., Jackson, C. R., Bernhardt, E. S., Carter, T. L., Filoso, S., et al. (2009). Twenty-six key research questions in urban stream ecology: An assessment of the state of the science. J. North Am. Benthol. Soc. 28, 1080–1098. doi:10.1899/08-186.1
Wherry, S. A., Tesoriero, A. J., and Terziotti, S. (2021). Factors affecting nitrate concentrations in stream base flow. Environ. Sci. Technol. 55 (2), 902–911. doi:10.1021/acs.est.0c02495
Wiederkehr, F., Wilkinson, C. L., Zeng, Y., Yeo, D. C. J., Ewers, R. M., and O’Gorman, E. J. (2020). Urbanisation affects ecosystem functioning more than structure in tropical streams. Biol. Conserv. 249, 108634. doi:10.1016/j.biocon.2020.108634
Woodward, G., Gessner, M. O., Giller, P. S., Gulis, V., Hladyz, S., Lecerf, A., et al. (2012). Continental-scale effects of nutrient pollution on stream ecosystem functioning. Science 336, 1438–1440. doi:10.1126/science.1219534
Wright, J. F., Moss, D., Armitage, P. D., and Furse, M. T. (1984). A preliminary classification of running‐water sites in Great Britain based on macro‐invertebrate species and the prediction of community type using environmental data. Freshw. Biol. 14, 221–256. doi:10.1111/j.1365-2427.1984.tb00039.x
Keywords: ecosystem integrity, boosted regression tree, ecological metrics, freshwater management, monitoring programs
Citation: Campos CA, Tonin AM, Kennard MJ and Gonçalves Júnior JF (2022) Setting thresholds of ecosystem structure and function to protect streams of the Brazilian savanna. Front. Environ. Sci. 10:867905. doi: 10.3389/fenvs.2022.867905
Received: 01 February 2022; Accepted: 03 August 2022;
Published: 31 August 2022.
Edited by:
Eugenia López-López, Instituto Politécnico Nacional de México (IPN), MexicoReviewed by:
Francis O. Arimoro, Federal University of Technology Minna, NigeriaJukka Aroviita, Finnish Environment Institute, Finland
Copyright © 2022 Campos, Tonin, Kennard and Gonçalves Júnior. This is an open-access article distributed under the terms of the Creative Commons Attribution License (CC BY). The use, distribution or reproduction in other forums is permitted, provided the original author(s) and the copyright owner(s) are credited and that the original publication in this journal is cited, in accordance with accepted academic practice. No use, distribution or reproduction is permitted which does not comply with these terms.
*Correspondence: Camila Aida Campos, Y2FtaWxhLmFpZGFAZ21haWwuY29t