 Nicole A. Loeb
 Alex Crawford
 Julienne C. Stroeve1,2,3,4
- 1Centre for Earth Observation Science, Clayton H. Riddell Faculty of Environment, Earth, and Resources, University of Manitoba, Winnipeg, MB, Canada
- 2Department of Environment and Geography, Clayton H. Riddell Faculty of Environment, Earth, and Resources, University of Manitoba, Winnipeg, MB, Canada
- 3Department of Earth Sciences, University College London, London, United Kingdom
- 4National Snow and Ice Data Center, Cooperative Institute for Research in Environmental Sciences, University of Colorado Boulder, Boulder, CO, United States
Extreme precipitation events are becoming more common in the Arctic as the climate warms, but characterizing these events is notoriously challenging. Atmospheric reanalyses have become popular tools for climate studies in data-sparse regions such as the Arctic. While modern reanalyses have been shown to perform reasonably well at reproducing Arctic climate, their ability to represent extreme precipitation events has not been investigated in depth. In this study, three of the most recent reanalyses, ERA-5, MERRA-2, and CFSR, are compared to surface precipitation observations in the Eastern Canadian Arctic and Greenland from 1980 to 2016 to assess how well they represent the most intense observed events. Overall, the reanalyses struggled to match observed accumulations from individual events (−0.11 ≤ r ≤ 0.47) but matched the observed seasonality of precipitation extremes. The region with the strongest match between observations and reanalyses was Southwest Greenland. Performance varies by event, and the best match between reanalyses and station observations may have a spatial/temporal offset (up to one grid cell or 1 day). The three products saw similar performance in general; however, ERA-5 tends to see slightly higher correlations and lower biases than MERRA-2 or CFSR. Considering the limitations of in situ observations, these results suggest that the reanalyses are capable of representing aggregate extreme precipitation (e.g., seasonal or annual time scales), but struggle to consistently match the timing and location of specific observed events.
1 Introduction
In situ precipitation measurements are notoriously difficult to obtain in the Arctic. Factors that increase their uncertainty include systematic errors due to instrument design and specifications (e.g., Collier 2000; Jain and Singh 2003), gauge undercatch (e.g., Goodison, Louie, and Yang 1998; Wagner et al., 2021), and wetting loss (e.g., Groisman and Legates 1994; Collier 2000), along with a relatively sparse observational network (Serreze and Barry 2011). Satellite-based precipitation retrieval methods have been developed since the 1990s (Levizzani, Laviola, and Cattani 2011), providing a broader spatial estimate of precipitation patterns, yet uncertainty remains due in part to microphysical assumptions and lack of ground truth (e.g., Liu and Curry 1997; Levizzani, Laviola, and Cattani 2011). In addition to uncertainties associated with measurement methods, precipitation has low spatial autocorrelation (Jones 2013). These issues combined with a generally sparse surface observational network (Xie and Arkin 1997; Mekis and Vincent 2011) make it challenging to obtain spatially and temporally continuous datasets that are representative of the Arctic region via interpolation. Because of this, atmospheric retrospective analyses, or reanalyses, have become a very popular tool for climate studies in the Arctic where observations are lacking.
Atmospheric reanalyses are produced by numerical models run over a specified historical time-period that assimilate observations at regular intervals to ensure that the model remains close to observed conditions (Riddaway 2014). These products are designed to provide a more spatially and temporally homogeneous record of atmospheric variables (Riddaway 2014). The use of a model means that many observations can be used, sometimes numbering in the millions, and ensures that observations will be incorporated and interpreted consistently (Parker 2016). Spatial and temporal gaps are filled on a physical and dynamical basis rather than interpolation alone, which can help maintain realistic patterns (Parker 2016).
Given the general paucity of observational networks, reanalyses are commonly used to assess precipitation patterns and amounts in the Arctic and Antarctic (Bengtsson et al., 2011; Rapaić et al., 2015; Boisvert et al., 2018; Koyama and Stroeve 2019). Several studies have evaluated the veracity of various reanalysis data products (e.g., Boisvert et al., 2018; Barrett, Stroeve, and Serreze 2020). In terms of precipitation, there is generally more spread between reanalyses in total precipitation and snowfall amounts than other variables, such as air temperature, because of limited observations for data assimilation and thus more dependence on model setup (Rapaić et al., 2015) in addition to the high variability seen in precipitation patterns. Several studies have found that most reanalyses exhibit a warm and wet bias in the Arctic, producing rain rather than snow and more precipitation overall (e.g., Lindsay et al., 2014; Rapaić et al., 2015; Boisvert et al., 2018; Barrett, Stroeve, and Serreze 2020). While reanalyses can help to fill in observational gaps, they produce accumulations representing the average over an area, meaning they are not expected to match point observations and may lose representation of sub-grid resolution extremes.
While previous studies have assessed the general performance of reanalyses in the Arctic, how well these products reproduce observed extreme precipitation events remains unknown. It is vital to understand how well current products represent extreme precipitation events because slight changes in mean precipitation conditions can cause a more significant shift in the intensity and frequency of extreme events an area receives (e.g., Pendergrass 2018). Reanalyses are commonly used as forcing datasets for regional climate models, so their performance can directly impact the quality of climate projections. With shrinking Arctic sea ice cover, the potential for extreme precipitation in the Arctic may increase substantially (Landrum and Holland 2020; McCrystall et al., 2021). However, climate models currently produce less realistic extreme precipitation in the Arctic than the mid-latitudes (Abdelmoaty et al., 2021). This amplifies the need to better understand and represent extreme precipitation in atmospheric reanalyses.
The eastern Canadian Arctic and Greenland region is particularly vulnerable to changes in extreme events because of the risk they pose to the Indigenous communities of the region and the substantial amount of land ice nearby. Changes to these events could have substantial impacts on the physical climate system and severe implications for local communities through increased flooding and degradation of permafrost (Rinke et al., 2012), which can threaten infrastructure (Ford, Bell, and St-Hilaire-Gravel 2010) and access to both traditional and western food sources (Ford 2009). Additionally, these events can cause abrupt increases or decreases in the surface mass balance (SMB) of the region’s land ice. Doyle et al. (2015) suggested that the late-summer timing of an extreme precipitation event in Western Greenland led to widespread ice flow acceleration and a more substantial mass loss from the Greenland Ice Sheet. On the other hand, Oerlemans et al., 2004 illustrated how a heavy summer snowfall event dramatically reduced melt due to the increased albedo of the fresh snow cover on a glacier in Switzerland. As such, the difference in the timing, intensity, or frequency of extreme events can substantially impact the SMB of glaciers and ice caps. Given the Greenland Ice Sheet and glaciers and ice caps of the eastern Canadian Arctic account for approximately 11% of global land ice mass (Bamber et al., 2018), understanding SMB changes in response to a warming Arctic is essential. Recent projections estimate that Greenland Ice Sheet melt will contribute 10.2 ± 4.8 cm (Hofer et al., 2020) over the 21st century under a moderate warming scenario, with the Canadian Arctic contributing an additional 0.35 ± 0.24 mm yr−1 (Lenaerts et al., 2013).
In this paper, the most recent reanalyses from the European Centre for Medium-Range Weather Forecasts (ECMWF), the National Aeronautics and Space Administration (NASA), and the National Centers for Environmental Prediction (NCEP) are compared to station precipitation observations in the Eastern Canadian Arctic Archipelago and Greenland for 1980–2016 to assess agreement in extreme precipitation events. Similarities and differences between reanalyses regarding seasonal and spatial variability of extreme precipitation are investigated. Finally, a case study details performance of these reanalyses during the event highlighted in Doyle et al. (2015).
2 Materials and Methods
2.1 Reanalyses
2.1.1 ERA-5
ERA-5 is the fifth-generation reanalysis product from the ECMWF (Hersbach et al., 2020). Hourly data is available from 1979 to 2021 on a 0.25°
2.1.2 MERRA-2
MERRA-2 is the second-generation version of NASA’s Modern-Era Retrospective analysis for Research and Applications (Gelaro et al., 2017). Data is provided on a 0.5°
2.1.3 CFSR
The NCEP Climate Forecast System Reanalysis (CFSR) was developed to improve upon the first version of the Climate Forecast System (Saha et al., 2010). CFSR covers the period of 1979–2009 with a 0.5°
2.2 Observations
Canadian observations were retrieved from the Second Generation Adjusted Daily Precipitation Dataset, detailed in Mekis and Vincent (2011). Data is available from station installation until 2016. This dataset includes daily rainfall gauge and snowfall ruler observations for 464 stations that have been adjusted manually to account for common issues. Most of the selected stations are protected, meaning that they cannot be closed in the near future. Rainfall observations were corrected for wind undercatch, evaporation, and retention with unique corrections applied to each type of rain gauge used (copper MSC, plastic MSC, and Type B gauges). Snow-water equivalent (SWE) was calculated using spatially-varied fresh snow density values determined based on concurrent Nipher gauge and snow ruler observations from 175 climatological stations with over 20 years of data (Mekis and Brown 2010). Stations were selected to be included in the dataset based on the availability of manual snowfall and rainfall measurements and the length of observational records. No observations from automated gauges were included in the dataset.
Synoptic station precipitation observations for Greenland were retrieved from the Danish Meteorological Institute (Cappelen et al., 2014). This dataset provides observations from 88 surface stations across Greenland for 1958–2013. The temporal resolution varies between stations from hourly to daily. Most included stations are automated. The Danish Meteorological Institute performed manual quality controls to ensure the removal of erroneous data from issues such as frozen instrumentation or calibration errors (Boas and Wang 2011). Raw 24 h accumulations were corrected for wind-induced undercatch following the Yang et al. (1999) method, which factors precipitation phase and windspeed into the calculation of bias. Precipitation phase is not explicitly included in the observations so a simple temperature-based threshold is used to determine phase, as in Koyama and Stroeve (2019). If all the day’s observations are above (below) 0°C, it is designated as rain (snow); otherwise, it is mixed precipitation.
In this study, 18 stations are used from the Canadian dataset and 21 stations from Greenland. Details of each station included in the analysis are shown in Supplementary Table S1. It must be noted that because the corrections applied to the two datasets differ, it is not possible to make direct comparison of reanalysis biases between Canada and Greenland. However, relative comparisons of performance can still be made. Also important to note is that none of the selected reanalysis products assimilate surface precipitation observations.
2.3 Methodology
The study region was split into subregions to help illustrate spatial differences in performance (Figure 1). Baffin and Ellesmere Islands were selected as subregions of interest in the Canadian Arctic Archipelago. Greenland was divided into subregions following glacier regimes and surface mass balance characteristics (Rignot et al., 2011; Rignot and Mouginot 2012). These basins were introduced in the European Space Agency’s 2016 Ice sheet Mass Balance Intercomparison Exercise. Since the observational network is relatively sparse, some regions have little data available. The northern (NO) Greenland subregion has no stations and was not included in the analysis. All other subregions were included; however, several subregions have few stations available (particularly, NW and SE Greenland), meaning that the analysis performed may be less robust.
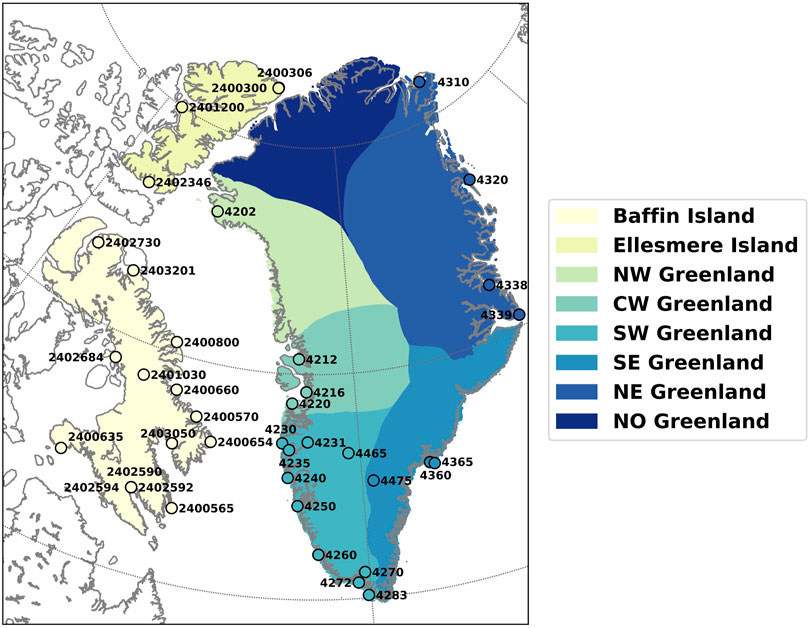
FIGURE 1. Map of the study region. Coloured circles show station locations and identification numbers within each subregion.
In this study, an extreme event is defined as the top 5% of daily precipitation totals where at least 1 mm of accumulation occurred, which is one of the definitions outlined in Pendergrass (2018). Extreme event occurrence is compared between products and subregions using a normalized event frequency (fe);
where Ne and No represent the total number of extreme events and daily observations, respectively, in a subregion. The extreme event threshold for each station (
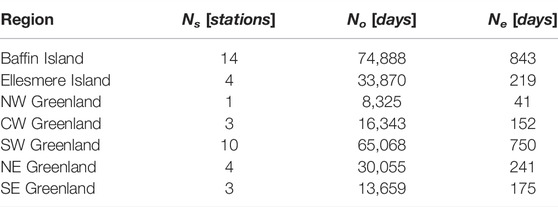
TABLE 1. Number of stations (Ns), observations (No), and extreme events (Ne) within each subregion.
Extreme events are, by definition, rare, and fewer than 20% of all stations in this region have timeseries exceeding 30 years. To obtain sufficient data, stations were combined within subregions for statistical comparisons. However, observations from nearby stations are not entirely independent, so any statistical error is likely an underestimate. Taylor diagrams are created that show the Pearson correlation coefficient, root-mean-square error (RMSE) between each reanalysis and the observations, and the standard deviation of each product (Taylor 2001). These statistical comparisons for a given station are performed using only those days for which the station observations are within the top 5% of daily precipitation totals.
To assess potential spatial offsetting, a three-by-three cell group centered on each station is analyzed. Similarly, 3-day running accumulations are examined to account for single-day offsets in the timing of events. Details of these tests can be found in the Supplementary Figures S1–3. The extreme threshold of each product is also compared to the observations to illustrate differences in the distributions. The Heidke skill score (HSS) is used to compare the occurrence of extreme days between the reanalyses and observations (Doswell, Davies-Jones, and Keller 1990). The HSS is a skill score for categorical forecasts with correct results that occur due to chance taken into account. It is calculated based on a 2 × 2 contingency table (Table 2) and the following equation;
where the variables are those of the contingency table (Hyvärinen 2014). For rare events, the contingency table is dominated by correct non-occurrences (D), causing the HSS to be artificially lowered. In this case, an approximation of the HSS can be used
which removes the bias due to the event’s rarity (Doswell, Davies-Jones, and Keller 1990). This approximation is used for assessing reanalysis performance for extreme events since correct non-extreme detections comprise the vast majority of the dataset.

TABLE 2. 2 × 2 contingency table.
Spatial comparisons are also performed to compare the performance of the reanalyses to each other and determine the relative importance of extreme events to overall precipitation across the domain. These comparisons are based on the extreme threshold of each product since observations are not available across much of the domain, so only relative comparisons can be made. Additionally, perfect matches with station observations are not expected due to the spatial averaging inherent to the reanalyses.
3 Results
3.1 Climatological Comparisons
Table 3 summarizes daily accumulations constituting an extreme event and fe in each region. Threshold values in Table 3 represent the weighted mean of extreme accumulations at each station (thresholds for each station provided in Supplementary Table S2). Overall, the reanalyses reproduced extreme event thresholds similar to the observational data, generally within 5 mm. The normalized event frequency saw higher variability, particularly in SE Greenland, where the reanalyses produced higher frequencies. Here, two of the three stations see many more days with at least 1 mm of accumulation than observed, causing large differences in the calculated event frequency (Supplementary Table S2). While these frequencies provide an estimate of how often extreme events occur, it must be noted that the low sample size in some subregions adds uncertainty.
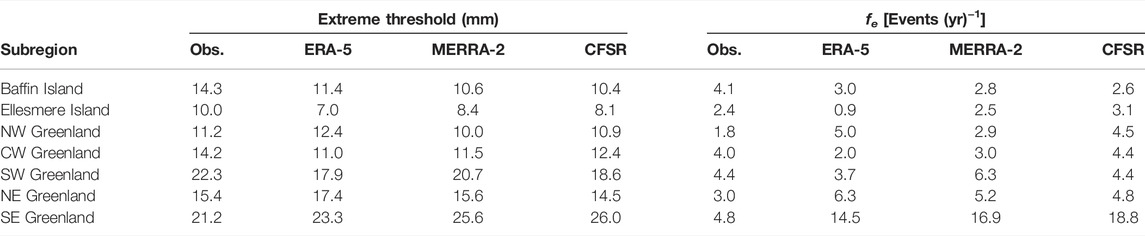
TABLE 3. Extreme daily accumulation thresholds and the event frequency for each subregion relative to the observational threshold. Extreme thresholds are the mean of the individual thresholds from each station in the region weighted by the station’s number of observations.
The relationship between reanalysis and station-measured accumulation for each subregion is summarized in Figure 2. In CW and SW Greenland, CFSR has a higher standard deviation and RMSE than the other reanalyses. On the other hand, ERA-5 tends to have a lower RMSE than the other reanalyses and similar standard deviations to observations, particularly in SW and SE Greenland. While some regions have considerable performance differences, NE Greenland saw an almost equivalent performance from all three reanalyses.
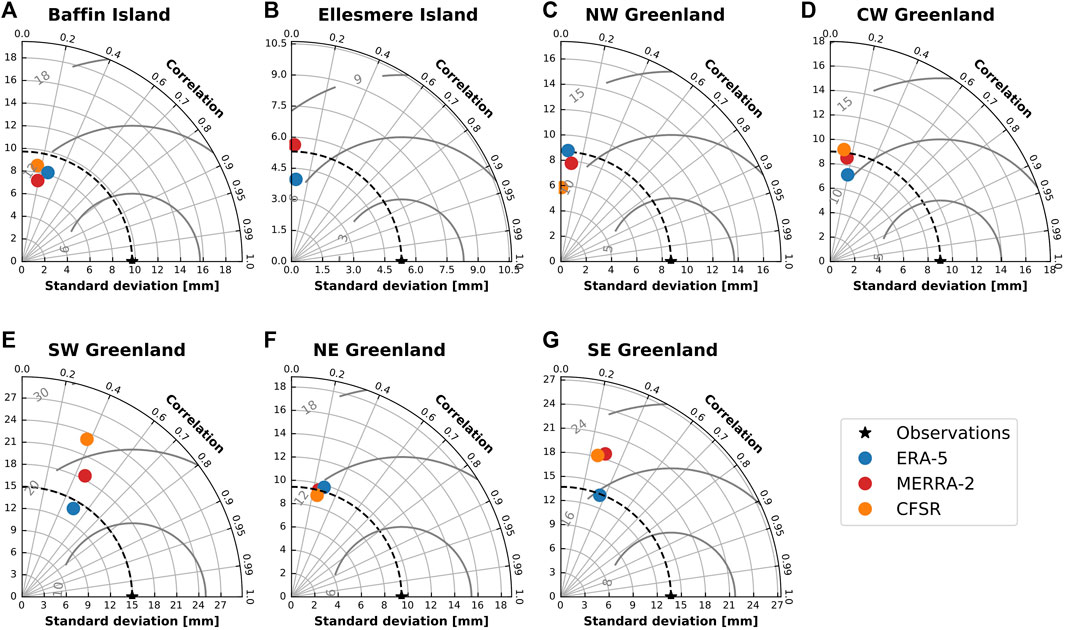
FIGURE 2. Taylor diagrams comparing accumulations for extreme events between products in each subregion (A–G). CFSR is not visible in (B) due to the correlation falling below 0 and MERRA-2 is overlain by ERA-5 in (F).
Correlations between reanalyses and the observations for extreme precipitation days were poor to moderate in each subregion (Table 4). The 95% confidence interval (CI) for each subregion is provided in Supplementary Table S3. However, recall that because of how data are processed, these confidence intervals are likely underestimates. The highest correlations are seen in SW Greenland, with all products showing correlations between 0.34 and 0.47. While the correlations are relatively low, Table 4 shows that the correlations for all daily precipitation are typically 0.10–0.30 higher than that of extremes, with the smallest differences seen in SW Greenland. One notable exception is the substantial drop in correlation that each product exhibits for extremes over Ellesmere Island and NW Greenland; the correlation is moderate for all daily observations but becomes approximately zero when only extreme events are considered.
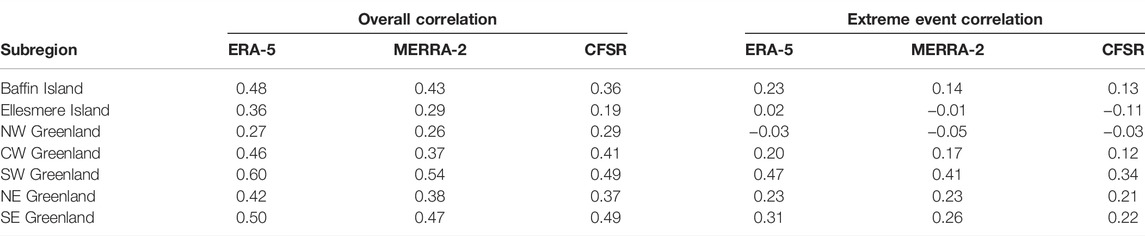
TABLE 4. Correlation coefficient between the reanalyses and observations for precipitation amounts in each subregion. Values in the overall column represent the correlations between the reanalyses and observations for all precipitation days with at least 1 mm of accumulation, while the extreme events column only includes days at or above the observed extreme threshold.
Correlations are useful for comparing variability in the magnitude of events, but non-linearities in the data may bias results. Therefore, we also constructed contingency tables (Figure 2) that compare how often extremes recorded in observations align with extremes for the atmospheric reanalyses. These tables were then summarized using HSS analysis (Table 5). The HSS values for extreme events range from 0.15 to 0.58. While these results are generally higher than the correlations for extreme events, the agreement with observations generally remains poor. This indicates that the reanalyses struggle in reproducing events on the same days as observed. However, SW and SE Greenland produce relatively high HSS (>0.50), which is notably higher than any of the other subregions (HSS ≤ 0.32). Here, the HSS of extreme events is almost equal to that of all precipitation events. It can also be noted that the HSS of extreme events in the other subregions was roughly half that of the broader precipitation days shown in Table 5, suggesting that the reanalyses particularly struggle with matching dates of extreme events, rather than all precipitation.
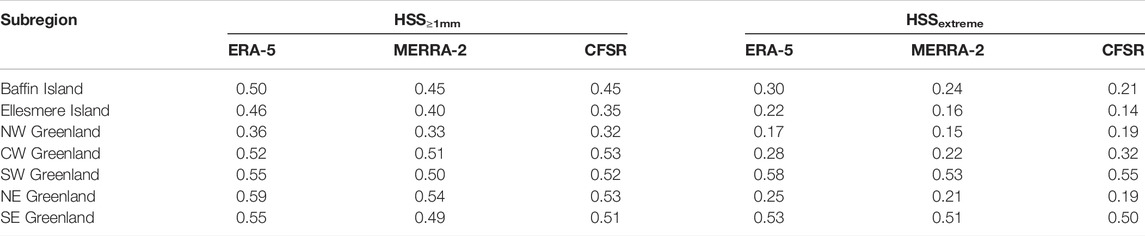
TABLE 5. HSS for the reanalyses in each subregion. HSS ≥ 1mm refers to that of all precipitation days with at least 1 mm of accumulation (Eq. 2), and HSSextreme refers to extreme events using (Eq. 3).
Figure 3 demonstrates the seasonality of extremes by subregion seen in each product normalized by the number of events. While the HSS showed that the reanalyses failed to match event days accurately, the seasonality of events matches quite well between the products and observations. Some subregions have almost perfect agreement, such as SW Greenland. The most notable differences are a negative bias in SE Greenland during the winter that becomes positive in spring, and a positive bias in Baffin and Ellesmere Islands during the summer and early autumn months. Correlations for seasonal extreme accumulations are provided in Supplementary Table S4, showing generally higher correlations than for daily events.
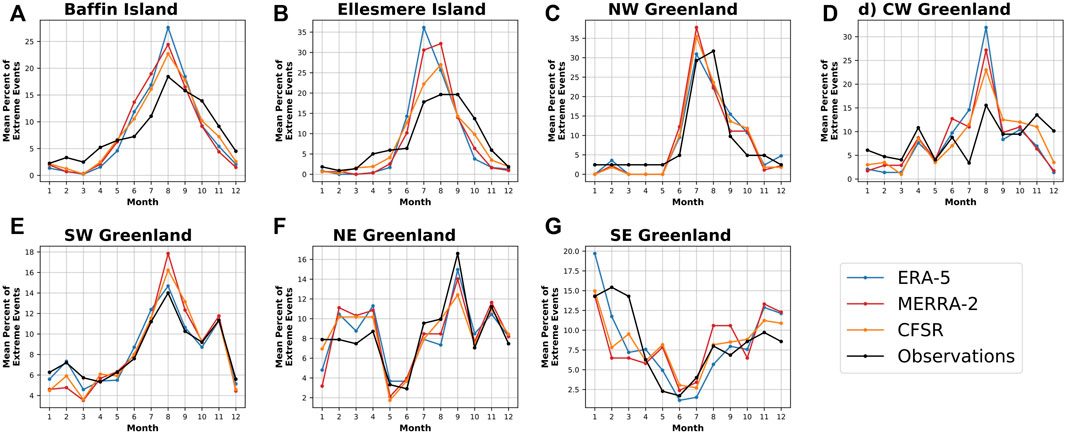
FIGURE 3. Percent of all extreme events in each product occurring in each month for all subregions (A–G).
The distribution of the mean percentage of annual precipitation attributed to extreme events across the domain is shown in Figure 4. Here, values are relative to the extreme threshold for each grid cell rather than that of station observations. It also should be noted that the observational record at each station is generally shorter than the length of the reanalyses, so the fraction attributed to extreme events is not expected to match perfectly. Overall, the patterns seen from each product are very similar, with coastal regions generally seeing higher dependence on extreme events than further inland. Generally, the southern coastal regions have the highest dependence on extremes, with lower dependence inland and at higher altitudes.
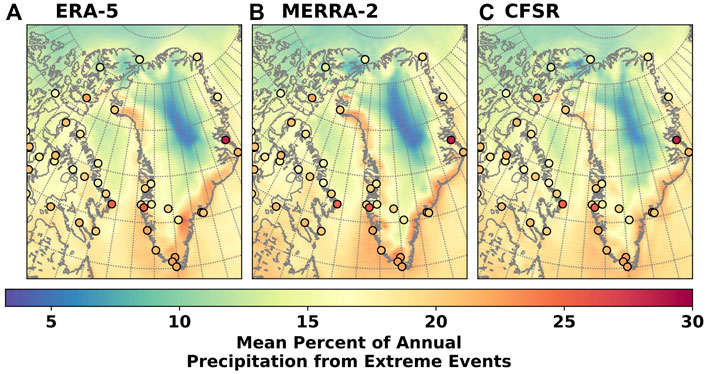
FIGURE 4. Mean percent of annual precipitation attributed to extreme events based on (A) ERA-5, (B) MERRA-2, and (C) CFSR. Circles show the relative contribution of extremes to annual precipitation for each station with at least 4 years of data.
3.2 Case Study
In the late summer of 2011, a low-pressure system brought extended heavy precipitation across much of southern Greenland. Doyle et al. (2015) illustrated how this event caused enhanced melt and increased ice flow along the lower ablation zone of the Kangerlussuaq sector of the Greenland Ice Sheet. A meteorological overview of the event was produced using data from the National Centers for Environmental Prediction/National Centre for Atmospheric Research reanalysis. The low-pressure system moved across Baffin Bay with a minimum surface pressure of 992 hPa, bringing warm and moist southwesterly winds to the west coast of Greenland. As the warm air moves inland, substantial orographic lift occurs and can cause a dramatic increase in precipitation (Schuenemann, Cassano, and Finnis 2009). During this event, some regions along the central west coast saw over 100 mm of precipitation in less than 1 week. While Doyle et al. (2015) presented some analysis from a single reanalysis, it was mainly used as context for the melt event rather than focusing on the product’s performance. Here, the performance of the three reanalyses is investigated for the period of 26–28 August 2011, which were the days of heaviest precipitation during this event.
Figure 5 shows daily accumulations from each reanalysis and any stations that recorded precipitation that day. The reanalyses showed similar patterns overall, but with some notable differences. Firstly, ERA-5 produced a broader area of maximum precipitation near Nuuk on 26 August. There are no surface stations close to the precipitation maximum, making it difficult to speculate on whether ERA-5 overproduced precipitation or if the other reanalyses underproduced precipitation. The maximum produced by CFSR on 27 August was much larger than the other products near the Qaqortoq station at the southern tip of Greenland. While 77 mm was observed at the station, making it an extreme event, CFSR exceeded 100 mm. Additionally, MERRA-2 saw broader light precipitation; the light precipitation region reached further inland on all 3 days. This aligns with the drizzle bias previously observed in MERRA-2 and its predecessor in the Arctic (e.g., Lindsay et al., 2014; Rapaić et al., 2015; Boisvert et al., 2018).
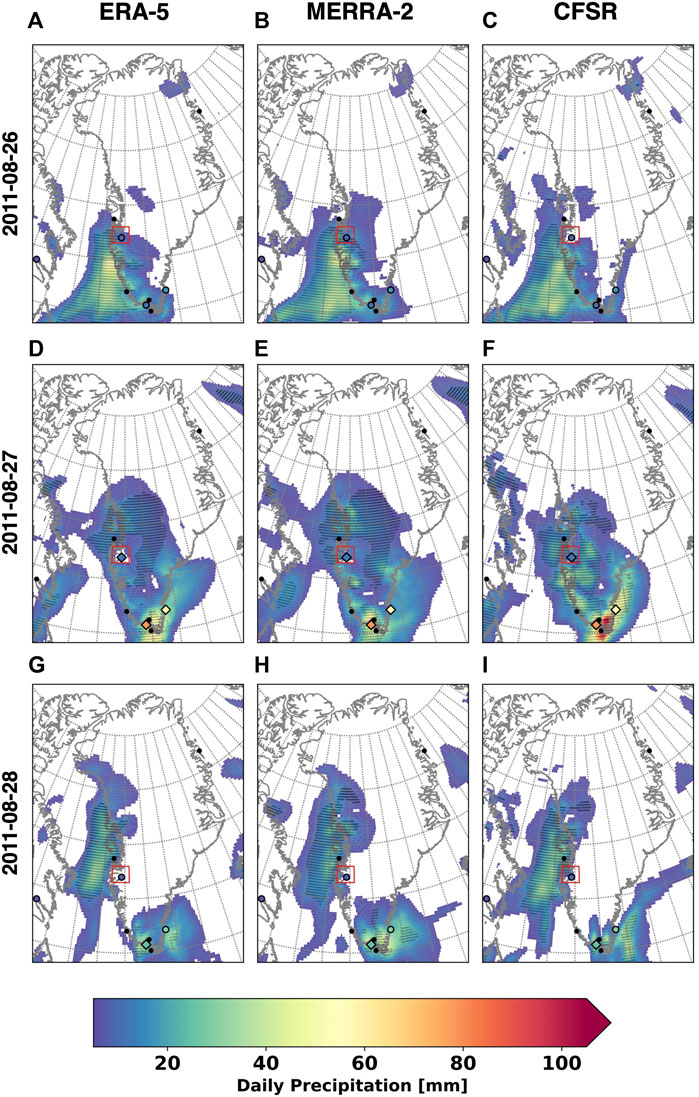
FIGURE 5. Daily precipitation (≥5 mm) for 26–28 August 2011 from ERA-5 (A,D,G), MERRA-2 (B,E,H), and CFSR (C,F,I). The columns show data for 26 (A–C), 27 (D–F), and 28 (G–I) August 2011. Stippling indicates grid cells with daily accumulations above the extreme threshold. Stations are shown with black dots, filled circles, and filled diamonds if no precipitation, non-extreme precipitation, or extreme precipitation were observed, respectively. The color of filled station markers indicates the daily precipitation accumulation. The red square highlights the Kangerlussuaq region.
4 Discussion and Conclusion
Most previous work assessing Arctic precipitation in reanalyses has focused on averages rather than extremes, but the presented results support some previous conclusions. Previous studies investigating daily and annual precipitation in the Arctic have demonstrated that many reanalyses are biased low for short-term, intense precipitation (e.g., Boisvert et al., 2018; Koyama and Stroeve 2019). Over the Arctic Ocean, MERRA-2 and CFSR were shown to produce monthly/annual accumulations that were notably higher than other reanalyses (Boisvert et al., 2018; Barrett, Stroeve, and Serreze 2020). Here, MERRA-2 and CFSR have higher biases than ERA-5 across most of the domain, but the difference in performance is reduced compared to that seen in previous studies. The little work that has been done assessing Arctic precipitation fields of ERA-5 (the newest product) shows that ERA-5 slightly outperforms other reanalyses over the Arctic Ocean (Barrett, Stroeve, and Serreze 2020) and adequately matches the timing of observed events during the MOSAiC Expedition (Wagner et al., 2021). Our results suggest that ERA-5 is the most successful in representing observed precipitation extremes over Greenland, Baffin and Ellesmere Islands, but the timing of events often differs from observations.
While the presented analysis showed that the reanalyses struggled to reproduce observed extreme events across the domain, several factors contribute to the disagreement. Firstly, many of the surface stations in the domain are near complex topography, and there is likely a high degree of variability in local precipitation (Gascon, Stewart, and Henson 2010; Ohmura and Reeh 1991). The spatial resolution of the analyzed products is too low to adequately represent much of the local topographic effects that may lead to extreme precipitation. The highest precipitation values are effectively smoothed out. Additionally, surface precipitation observations suffer from a variety of biases, as discussed in Section 1, that may not be accounted for in quality control measures (e.g., Adam and Lettenmaier 2003; Yang et al., 2005; Mekis and Vincent 2011; Ye et al., 2021). This suggests that the observations may be quite different than the average of a larger area.
Conversely, the reanalyses performed well in a relative sense. With the low HSS, it is evident that the event days are not always the same, but the reanalyses accurately reproduce the seasonality of observed extremes (Figure 3). This presents problems for analyzing specific events but optimism for climatological studies. Previous studies have shown much higher correlations, particularly for ERA-5 and MERRA-2, when looking at monthly or annual accumulations (e.g., Barrett, Stroeve, and Serreze 2020; Boisvert et al., 2018). Based on Supplementary Table S4, seasonal accumulations from extremes generate notably higher correlations with observations for ERA-5 and MERRA-2, but yielded mixed results in CFSR. CFSR was also noted to perform more poorly than other reanalyses in the Arctic (Barrett, Stroeve, and Serreze 2020). Since extreme precipitation accounts for up to ∼25% of annual totals across parts of the domain (Figure 4) and Table 3 shows that most regions see higher event frequencies than the observations, it can be inferred that the extreme precipitation events are accounted for at seasonal, annual, and longer timescales.
Spatial lag analysis shows that most stations produce higher correlations with one of the surrounding cells rather than the cell containing the station (Supplementary Figures S1, S2). Most subregions see slight correlation increases (increase in r ≤ 0.10) when the surrounding cells are considered. Baffin Island improved the most with spatial lag, with the correlation improving by 0.18. Ellesmere Island and NW Greenland, which have virtually no correlation with the observations, do not improve substantially with spatial offsetting but Ellesmere Island does see improvements in temporal lag tests (Supplementary Figures S3), suggesting that single-day offsets are a major contribution to the low correlations in the region.
In general, the products better agreed with observations in the regions with the best data availability. The best agreement was found in SW Greenland, which had six stations with observational records exceeding 20 years long (Supplementary Table S1) and the second-most observations overall (Table 1). The regions with the best data availability also tend to be those with higher average precipitation and extreme occurrence, which may also play into the higher agreement. Contrarily, the fewest observations were available for Ellesmere Island and the Northern Greenland subregions, both of which saw poorer agreement with observations.
Based on the presented analysis, ERA-5 slightly outperforms MERRA-2 and CFSR in representing extremes in our domain of interest. Seasonally, ERA-5 and MERRA-2 perform very similarly, but ERA-5 seems to be the most consistent, with standard deviations lower than or close to observations and with higher correlations for daily event accumulations in most regions. It is hypothesized that a major factor in the differences between products is spatial resolution. The higher resolution of ERA-5 allows for better representation of regional topography, as well as the pivotal topographic effects influencing precipitation (e.g., Gascon, Stewart, and Henson 2010; Ohmura and Reeh 1991). This may be seen in Figure 4, where ERA-5 yields higher dependence on extremes along the coast of SE Greenland, where there is dramatic topography. This agrees with previous studies that have found that increased spatial resolution improves agreement with precipitation observations, particularly in regions of complex topography (e.g., van Kampenhout et al., 2019; Bacmeister et al., 2014). Notably, ERA-5 produces a lower event frequency than the other reanalyses in the region (Table 3). This may be explained by the other reanalyses producing more light precipitation, which has been documented for MERRA-2 in the Arctic (e.g., Boisvert et al., 2018; Barrett, Stroeve, and Serreze 2020). While the presented results are not particularly positive, the newer products (particularly ERA-5) show promise in representing extreme precipitation and may be further improved using dynamical downscaling.
Data Availability Statement
Publicly available datasets were analyzed in this study. This data can be found here: ERA-5 (Doi: 10.5065/BH6N-5N20), CFSR (Doi: 10.5065/D6513W89), and CFSv2 (Doi: 10.5065/D61C1TXF) data analyzed for this study can be found in the NCAR Computational and Information Systems Laboratory Research Data Archive (https://rda.ucar.edu/). MERRA-2 data (Doi: 10.5067/9SC1VNTWGWV3) is available on NASA’s Goddard Earth Sciences Data and Information Services Center (https://disc.gsfc.nasa.gov/datasets/M2SDNXSLV_5.12.4/summary). Surface observations for Canada and Greenland were retrieved from the Government of Canada’s Open Data portal (https://open.canada.ca/data/en/dataset/d8616c52-a812-44ad-8754-7bcc0d8de305) and the Danish Meteorological Institute’s Polar Portal (http://polarportal.dk/en/news/news/historical-weather-and-climatedata-for-greenland/).
Author Contributions
Conceptualization and methodology: NL, AC, JS, and JH. Data processing and analysis: NL. Writing: NL. Editing/reviewing: AC, JS, and JH. Supervision: JS and JH. All authors contributed to the article and approved the submitted version.
Funding
This research was undertaken, in part, thanks to funding from the Canada 150 Research Chairs Program.
Conflict of Interest
The authors declare that the research was conducted in the absence of any commercial or financial relationships that could be construed as a potential conflict of interest.
Publisher’s Note
All claims expressed in this article are solely those of the authors and do not necessarily represent those of their affiliated organizations, or those of the publisher, the editors and the reviewers. Any product that may be evaluated in this article, or claim that may be made by its manufacturer, is not guaranteed or endorsed by the publisher.
Acknowledgments
The authors thank Yannick Copin and Zhiya Zuo for the python scripts to produce the Taylor diagrams (10.5281/zenodo.5548061) and CI calculation (https://zhiyzuo.github.io/Pearson-Correlation-CI-in-Python/), respectively. We also acknowledge the Ice sheet Mass Balance Inter-comparison Exercise (IMBIE) for providing shapefiles for Greenland drainage basins (http://imbie.org/imbie-2016/drainage-basins/). In addition, we thank Andrew Barrett for feedback which helped guide offset analysis.
Supplementary Material
The Supplementary Material for this article can be found online at: https://www.frontiersin.org/articles/10.3389/fenvs.2022.866929/full#supplementary-material
References
Abdelmoaty, H. M., Papalexiou, S. M., Rajulapati, C. R., and Kouchak, A. (2021). Biases beyond the Mean in CMIP6 Extreme Precipitation: A Global Investigation. Earth's Future 9 (10), e2021EF002196. doi:10.1029/2021EF002196
Adam, J. C., and Lettenmaier, D. P. (2003). Adjustment of Global Gridded Precipitation for Systematic Bias. J. Geophys. Res. 108 (D9), a–n. doi:10.1029/2002JD002499
Bacmeister, J. T., Wehner, M. F., Neale, R. B., Gettelman, A., Neale, R. B., Gettelman, A., et al. (2014). Exploratory High-Resolution Climate Simulations Using the Community Atmosphere Model (CAM). J. Clim. 27 (9), 3073–3099. doi:10.1175/JCLI-D-13-00387.1
Bamber, J. L., Westaway, R. M., Marzeion, B., and Wouters, B. (2018). The Land Ice Contribution to Sea Level during the Satellite Era. Environ. Res. Lett. 13 (6), 063008. doi:10.1088/1748-9326/aac2f0
Barrett, A. P., Stroeve, J. C., and Serreze, M. C. (2020). Arctic Ocean Precipitation from Atmospheric Reanalyses and Comparisons with North Pole Drifting Station Records. J. Geophys. Res. Oceans 125 (1), 1–17. doi:10.1029/2019JC015415
Bengtsson, L., Hodges, K. I., Koumoutsaris, S., Zahn, M., and Keenlyside, N. (2011). The Changing Atmospheric Water Cycle in Polar Regions in a Warmer Climate. Tellus A Dyn. Meteorology Oceanogr. 63 (5), 907–920. doi:10.1111/j.1600-0870.2011.00534.x
Boas, L., and Wang, P. R. (2011). Quality Control of Greenlandic Weather and Climate Data Series 1958-2010. Copenhagen, Denmark: Danish Meteorological Institute. Technical Report Technical Report 11-16. Available at: https://www.dmi.dk/fileadmin/Rapporter/TR/tr11-16.pdf.
Boisvert, L. N., Webster, M. A., Petty, A. A., Markus, T., Bromwich, D. H., and Cullather, R. I. (2018). Intercomparison of Precipitation Estimates over the Arctic Ocean and its Peripheral Seas from Reanalyses. J. Clim. 31 (20), 8441–8462. doi:10.1175/JCLI-D-18-0125.1
Bosilovich, M., Akella, S., Lawrence, C., Cullather, R., Draper, C., Gelaro, R., et al. (2015). MERRA-2: Initial Evaluation of the Climate. Greenbelt, Maryland: Goddard Space Flight Center. Technical Report NASA/TM-2015-104606/Vol.43. Global Modeling and Data Assimilation Available at:https://gmao.gsfc.nasa.gov/pubs/docs/Bosilovich803.pdf.
Cappelen, J., Laursen, E. V., Kern-Hansen, C., Boas, L., Wang, P., Jørgensen, B. V., et al. (2014). Weather Observations from Greenland 1958-2013 - Observation Data with Description. Copenhagen, Denmark: Danish Meteorological Institute. Technical Report Technical Report 14-08. Available at: https://www.dmi.dk/fileadmin/user_upload/Rapporter/TR/2014/tr14-08.pdf.
Collier, C. G. (2000). Precipitation Estimation and Forecasting. Geneva, Switzerland: Secretariat of the World Meteorological Organization. 46. Operational Hydrology Report
Delhasse, A., Kittel, C., Amory, C., Hofer, S., van As, D., S. Fausto, R., et al. (2020). Brief Communication: Evaluation of the Near-Surface Climate in ERA5 over the Greenland Ice Sheet. Cryosphere 14 (3), 957–965. doi:10.5194/tc-14-957-2020
Doswell, C. A., Davies-Jones, R., and Keller, D. L. (1990). On Summary Measures of Skill in Rare Event Forecasting Based on Contingency Tables. Wea. Forecast., 5, 5762. doi:10.1175/1520-0434(1990)005<0576:osmosi>2.0.co;2
Doyle, S. H., Hubbard, A., van de Wal, R. S. W., Box, J. E., As, Dirk. van., van As, D., et al. (2015). Amplified Melt and Flow of the Greenland Ice Sheet Driven by Late-Summer Cyclonic Rainfall. Nat. Geosci. 8 (8), 647–653. doi:10.1038/ngeo2482
Ford, J. D., Bell, T., and St-Hilaire-Gravel, D. (2010). “Vulnerability of Community Infrastructure to Climate Change in Nunavut: A Case Study from Arctic Bay,” in Community Adaptation and Vulnerability in Arctic Regions. . Editor G. K. Hovelsrud, and B. Smit (Dordrecht: Springer Netherlands), 107–130. doi:10.1007/978-90-481-9174-1_5
Ford, J. D. (2009). Vulnerability of Inuit Food Systems to Food Insecurity as a Consequence of Climate Change: A Case Study from Igloolik, Nunavut. Reg. Environ. Change 9 (2), 83–100. doi:10.1007/s10113-008-0060-x
Gascon, G., Stewart, R. E., and Henson, W. (2010). Major Cold-Season Precipitation Events at Iqaluit, Nunavut. Arctic 63 (3), 327–337. doi:10.14430/arctic1496
Gelaro, R., McCarty, W., Suárez, M. J., Todling, R., Molod, A., Takacs, L., et al. (2017). The Modern-Era Retrospective Analysis for Research and Applications, Version 2 (MERRA-2). J. Clim. 30 (14), 5419–5454. doi:10.1175/JCLI-D-16-0758.1
Goodison, B. E., Louie, P. Y. T., and Yang, D. (1998). WMO Solid Precipitation Measurement Intercomparison--Final ReportInstruments and Observing Methods. World Meteorological Organization. WMO/TD-No. 872.
Groisman, P. Y., and Legates, D. R. (1994). The Accuracy of United States Precipitation Data. Bull. Amer. Meteor. Soc. 75, 2152–2227. doi:10.1175/1520-0477(1994)075<0215
Hennermann, K., and Giusti, M. (2021). What Are the Changes from ERA-Interim to ERA5 and ERA5-Land?” Copernicus Knowledge Base - ECMWF Confluence Wiki. Available at:https://confluence.ecmwf.int//pages/viewpage.action?pageId=74764925 (Accessed October 27, 2021).
Hersbach, H., Bell, B., Berrisford, P., Hirahara, S., Horányi, A., Muñoz‐Sabater, J., et al. (2020). The ERA5 Global Reanalysis. Q.J.R. Meteorol. Soc. 146 (730), 1999–2049. doi:10.1002/qj.3803
Hofer, S., Lang, C., Amory, C., Kittel, C., Delhasse, A., Tedstone, A., et al. (2020). Greater Greenland Ice Sheet Contribution to Global Sea Level Rise in CMIP6. Nat. Commun. 11 (1), 6289. doi:10.1038/s41467-020-20011-8
Hyvärinen, O. (2014). A Probabilistic Derivation of Heidke Skill Score. Weather Forecast. 29 (1), 177–181. doi:10.1175/WAF-D-13-00103.1
Jain, S. K., and Singh, V. P. (2003). “Chapter 2 - Acquisition and Processing of Water Resources Data,” in Developments in Water Science. Editors S. K. Jain, and V. P. Singh (Amsterdam, Netherlands: Elsevier). 51, 47–121. Water Resources Systems Planning and Management. doi:10.1016/S0167-5648(03)80056-4
Jones, P. D. 2013. “Greenhouse Effect and Climate Data☆,” in Reference Module in Earth Systems and Environmental Sciences. San Diego, CA: Elsevier. doi:10.1016/B978-0-12-409548-9.05365-3
Koyama, T., and Stroeve, J. (2019). Greenland Monthly Precipitation Analysis from the Arctic System Reanalysis (ASR): 2000-2012. Polar Sci. 19 (March), 1–12. doi:10.1016/j.polar.2018.09.001
Landrum, L., and Holland, M. M. (2020). Extremes Become Routine in an Emerging New Arctic. Nat. Clim. Chang. 10 (12), 1108–1115. doi:10.1038/s41558-020-0892-z
Lenaerts, J. T. M., van Angelen, J. H., van den Broeke, M. R., Gardner, A. S., Wouters, B., van Meijgaard, E., et al. (2013). Irreversible Mass Loss of Canadian Arctic Archipelago Glaciers. Geophys. Res. Lett. 40 (5), 870–874. doi:10.1002/grl.50214
Levizzani, V., Laviola, S., and Cattani, E. (2011). Detection and Measurement of Snowfall from Space. Remote Sens. 3 (1), 145–166. doi:10.3390/rs3010145
Lindsay, R., Wensnahan, M., Schweiger, A., and Zhang, J. (2014). Evaluation of Seven Different Atmospheric Reanalysis Products in the Arctic*. J. Clim. 27 (7), 2588–2606. doi:10.1175/JCLI-D-13-00014.1
Liu, G., and Curry, J. A. (1997). Precipitation Characteristics in Greenland-Iceland-Norwegian Seas Determined by Using Satellite Microwave Data. J. Geophys. Res. 102 (D12), 13987–13997. doi:10.1029/96JD03090
McCrystall, M. R., Stroeve, J., Serreze, M., Forbes, B. C., and Screen, J. A. (2021). New Climate Models Reveal Faster and Larger Increases in Arctic Precipitation Than Previously Projected. Nat. Commun. 12 (1), 6765. doi:10.1038/s41467-021-27031-y
Mekis, É., and Brown, R. (2010). Derivation of an Adjustment Factor Map for the Estimation of the Water Equivalent of Snowfall from Ruler Measurements in Canada. Atmosphere-Ocean 48 (4), 284–293. doi:10.3137/AO1104.2010
Mekis, É., and Vincent, L. A. (2011). An Overview of the Second Generation Adjusted Daily Precipitation Dataset for Trend Analysis in Canada. Atmosphere-Ocean 49 (2), 163–177. doi:10.1080/07055900.2011.583910
Oerlemans, J., Klok, E. J., and Klok, E. J. L. (2004). Effect of Summer Snowfall on Glacier Mass Balance. Ann. Glaciol. 38, 97–100. doi:10.3189/172756404781815158
Ohmura, A., and Reeh, N. (1991). New Precipitation and Accumulation Maps for Greenland. J. Glaciol. 37 (125), 140–148. doi:10.3189/S002214300004289110.1017/s0022143000042891
Parker, W. S. (2016). Reanalyses and Observations: What's the Difference? Bull. Am. Meteorological Soc. 97 (9), 1565–1572. doi:10.1175/BAMS-D-14-00226.1
Pendergrass, A. G. (2018). What Precipitation Is Extreme? Science 360 (6393), 1072–1073. doi:10.1126/science.aat1871
Rapaić, M., Brown, R., Markovic, M., and Chaumont, D. (2015). An Evaluation of Temperature and Precipitation Surface-Based and Reanalysis Datasets for the Canadian Arctic, 1950-2010. Atmosphere-Ocean 53 (3), 283–303. doi:10.1080/07055900.2015.1045825
Riddaway, B. (2014). Climate Reanalysis. Reading, England: European Centre for Medium-Range Weather Forecasts. Available at: https://doi.org/10.21957/QNREH9T5.
Rignot, E., and Mouginot, J. (2012). Ice Flow in Greenland for the International Polar Year 2008-2009. Geophys. Res. Lett. 39 (11), a–n. doi:10.1029/2012GL051634
Rignot, E., Velicogna, I., van den Broeke, M. R., Monaghan, A., and Lenaerts, J. T. M. (2011). Acceleration of the Contribution of the Greenland and Antarctic Ice Sheets to Sea Level Rise. Geophys. Res. Lett. 38 (5), a–n. doi:10.1029/2011GL046583
Rinke, A., Matthes, H., Christensen, J. H., Kuhry, P., Romanovsky, V. E., and Dethloff, K. (2012). Arctic RCM Simulations of Temperature and Precipitation Derived Indices Relevant to Future Frozen Ground Conditions. Glob. Planet. Change 80-81 (January), 136–148. doi:10.1016/j.gloplacha.2011.10.011
Saha, S., Moorthi, S., Pan, H.-L., Wu, X., Wang, J., Nadiga, S., et al. (2010). The NCEP Climate Forecast System Reanalysis. Bull. Amer. Meteor. Soc. 91 (8), 1015–1058. doi:10.1175/2010BAMS3001.1
Saha, S., Moorthi, S., Wu, X., Wang, J., Nadiga, S., Tripp, P., et al. (2014). The NCEP Climate Forecast System Version 2. J. Clim. 27 (6), 2185–2208. doi:10.1175/JCLI-D-12-00823.1
Schuenemann, K. C., Cassano, J. J., and Finnis, J. (2009). Synoptic Forcing of Precipitation over Greenland: Climatology for 1961-99. J. Hydrometeorol. 10 (1), 60–78. doi:10.1175/2008JHM1014.1
Taylor, K. E. (2001). Summarizing Multiple Aspects of Model Performance in a Single Diagram. J. Geophys. Res. 106 (D7), 7183–7192. doi:10.1029/2000JD900719
van Kampenhout, L., Rhoades, A. M., Herrington, A. R., Zarzycki, C. M., Lenaerts, J. T. M., Sacks, W. J., et al. (2019). Regional Grid Refinement in an Earth System Model: Impacts on the Simulated Greenland Surface Mass Balance. Cryosphere 13 (6), 1547–1564. doi:10.5194/tc-13-1547-2019
Wagner, D. N., Shupe, M. D., Persson, O. G., Uttal, T., Frey, M. M., Kirchgaessner, A., et al. (2021). Snowfall and Snow Accumulation Processes during the MOSAiC Winter and Spring Season. Cryosphere Discuss. doi:10.5194/tc-2021-126
Xie, P., and Arkin, P. A. (1997). Global Precipitation: A 17-Year Monthly Analysis Based on Gauge Observations, Satellite Estimates, and Numerical Model Outputs. Bull. Amer. Meteor. Soc., 78, 25392. doi:10.1175/1520-0477(1997)078<253910.1175/1520-0477(1997)078<2539:gpayma>2.0.co;2
Yang, D., Ishida, S., Goodison, B. E., and Gunther, T. (1999). Bias Correction of Daily Precipitation Measurements for Greenland. J. Geophys. Res. 104 (D6), 6171–6181. doi:10.1029/1998JD200110
Yang, D., Kane, D., Zhang, Z., Legates, D., and Goodison, B. (2005). Bias Corrections of Long-Term (1973-2004) Daily Precipitation Data over the Northern Regions. Geophys. Res. Lett. 32 (19), a–n. doi:10.1029/2005GL024057
Ye, H., Yang, D., Ali, B., Stuefer, S. L., Pan, X., Mekis, E., et al. (2021). “Precipitation Characteristics and Changes,”in Arctic Hydrology, Permafrost and Ecosystems. Editors D Yang, and D L. Kane (Cham, Switzerland: Springer International Publishing), 25–59. Available at: https://books.google.ca/books?id=l_75DwAAQBAJ&pg=PA24&source=gbs_toc_r&cad=3#v=onepage&q&f=false. doi:10.1007/978-3-030-50930-9_2
Keywords: extreme precipitation, atmospheric reanalysis, Arctic, climate, Greenland, Canadian Arctic
Citation: Loeb NA, Crawford A, Stroeve JC and Hanesiak J (2022) Extreme Precipitation in the Eastern Canadian Arctic and Greenland: An Evaluation of Atmospheric Reanalyses. Front. Environ. Sci. 10:866929. doi: 10.3389/fenvs.2022.866929
Received: 31 January 2022; Accepted: 29 April 2022;
Published: 18 May 2022.
Edited by:
Yang Gao, Ocean University of China, ChinaReviewed by:
Eduardo Zorita, Helmholtz Centre for Materials and Coastal Research (HZG), GermanyMario Bruno Rohrer, Meteodat GmbH, Switzerland
Copyright © 2022 Loeb, Crawford, Stroeve and Hanesiak. This is an open-access article distributed under the terms of the Creative Commons Attribution License (CC BY). The use, distribution or reproduction in other forums is permitted, provided the original author(s) and the copyright owner(s) are credited and that the original publication in this journal is cited, in accordance with accepted academic practice. No use, distribution or reproduction is permitted which does not comply with these terms.
*Correspondence: Nicole A. Loeb, bG9lYm5AbXl1bWFuaXRvYmEuY2E=