 Yang Yang
 Chuanfeng Zhao
 Jiao Fu2
94% of researchers rate our articles as excellent or good
Learn more about the work of our research integrity team to safeguard the quality of each article we publish.
Find out more
ORIGINAL RESEARCH article
Front. Environ. Sci. , 24 March 2022
Sec. Atmosphere and Climate
Volume 10 - 2022 | https://doi.org/10.3389/fenvs.2022.865966
This article is part of the Research Topic Air Pollution Remote Sensing and the Subsequent Interactions with Ecology on Regional Scales View all 31 articles
On November 29, 2019, an aircraft observation during the period of cloud-seeding was carried out for a mixed-phase cloud over Xingtai, Hebei Province, China. This study investigates the response of mixed-phase cloud microphysical properties to cloud-seeding near cloud top. Before cloud seeding, the cloud droplet concentration from fast cloud droplet probe (NC_FCDP) presented a multi-peak vertical distribution structure, with a maximum concentration of 192 cm−3 at a height of 3,322 m; the maximum concentration of ice crystals from cloud imaging probe (NC_CIP) was 10 L−1, which appeared at 4,500 m in the upper part of cloud; and the peak value of liquid water content (LWC) in the cloud also appeared at 4,500 m, with a value of 0.15 g/m3. The coexistence of supercooled liquid water and ice crystals implies that they are particularly suitable for cloud seeding at the height of 4,550 m. About 7–8 min later after cloud seeding at this height, the average NC_FCDP decreased from 160.3 to 129 cm−3, and the average NC_CIP increased from 7.1 to 10 L−1. Moreover, after cloud seeding, high NC_CIP as well as larger and more ice crystals appeared almost in the same areas within the cloud, and LWC presented an obvious decreasing trend. In contrast, the concentration of small cloud droplets and LWC decreased obviously after seeding. The findings suggest that the cloud microphysical properties showed obvious responses to the artificial introduction of silver iodide, which is important for human weather modification.
Clouds play an important role on both Earth’s weather and climate (Ramanathan et al., 1989; Norris, 2005; Zhao and Garrett, 2015; Yang et al., 2016a; Yang et al., 2016b; Chuanfeng Zhao et al., 2020). Moreover, anthropogenic activities, by changing cloud properties, have contributed to increased extreme weather and climate events (Lohmann and Feichter, 2005; Andreae and Rosenfeld, 2008; Tao et al., 2012; Li et al., 2016; Yang et al., 2018; Zhao et al., 2018; Sun et al., 2019; Xin Zhao et al., 2020), and extreme weather generally has great impact on human life. The changes of latent heat release, precipitation, and radiation during cloud development, which are essential parts in Earth’s energy budget and hydrological cycle, are all affected by the microphysical processes in the cloud (Pruppacher and Klett, 2010).
The cloud microphysical properties could be further influenced by human activities. In 1946, American scientists proposed that the number of ice crystals in cold clouds could be increased by artificially introducing silver iodide (AgI) into the cloud, thus achieving the effect of rain enhancement (Schaefer, 1946; Vonnegut, 1947). Weather modification has gradually become an important application field of cloud and precipitation physics. At present, the theory of weather modification has been able to explain how the catalyst works in the cloud—that is, under appropriate meteorological conditions, seeding silver iodide into clouds containing supercooled water droplets can cause the liquid water droplets to transform into ice crystals, and then the newly formed ice crystals grow larger through the Bergeron process (Bergeron, 1935). After decades of experiments, the catalysis of winter orographic clouds on the windward slope has achieved a high success rate (Pokharel and Geerts, 2016; Pokharel et al., 2017; Tessendorf et al., 2020). Seeding in supercooled water clouds with a thickness less than 1 km can leave a very obvious cloud groove (Dong et al., 2021). These studies provide a solid foundation for the feasibility of artificial cloud seeding. While various experiments have been carried out, sufficient evidences of seeding effects are still needed under different conditions—for example, there are relatively few experiments on artificial catalysis and studies about the changes of microphysical properties in deep layered clouds. Particularly, many existing studies evaluate the performance of cloud seeding only by investigating the changes of macroscopic properties, such as the changes of reflectivity from ground-based radars or by directly using statistical verification. These methods are usually not intuitionistic and intelligible enough to reflect how AgI works within the cloud, leading to the effect of cloud seeding still in insufficient credibility.
The response of cloud microphysical properties to seeding can be observed by airborne instruments with high temporal resolution, which provides us a good opportunity with reliable basis to understand the mechanism of artificial precipitation enhancement. In this study, through a well-designed aircraft seeding experiment of a winter snowfall deep cloud system, we investigate the changes in phase and size distribution of cloud particles due to seeding. We first analyze the weather background before cloud seeding and then the structure of the cloud system. Finally, the response of the cloud microphysical properties was examined based on the changes between before and after cloud seeding.
In this experiment, a snow cloud system was selected on November 29, 2019 for research about the response of mixed-phase cloud microphysical properties to cloud seeding, and aircraft detection and cloud seeding were carried out over Xingtai, Hebei Province. The King Air-350 aircraft operated by Hebei Weather Modification Office was used for the observation of clouds with an airborne detection system on board, including cloud particle detection system, meteorological measurement system, Nevzorov hot wire liquid water content (LWC), total water content (TWC) probe, and global positioning system. The cloud particle detection system in this study consists of fast cloud droplet probe (FCDP), cloud imaging probe (CIP), and cloud particle imager (CPI). The FCDP probe can obtain the concentration of cloud droplets in the size range of 2–50 μm in radius, with uncertainty of approximately 20% (Faber et al., 2018; Lance et al., 2010). CIP can detect large cloud particles in the size range of 25–1,550 μm, and the CPI probe is able to obtain high-resolution images of cloud particles. The LWC and the TWC were obtained by the Nevzorov hot wire LWC/TWC probe, and the uncertainty was about 15% (Emery et al., 2004; Korolev et al., 2013). CPI uses a CCD camera to capture a high-resolution image of cloud particles, which can distinguish water drops from ice particles. Vertical profiles of temperature and humidity were obtained using the meteorology monitoring system called Aircraft-Integrated Meteorological Measurement System. Table 1 shows these main detection equipment used in this study, along with their detected cloud variables and measurable ranges. Cloud seeding and the detection of cloud microphysical properties were performed by the same aircraft. Also noted is that the silver iodide flames used in this study contain AgI of 1.8 g per stick.
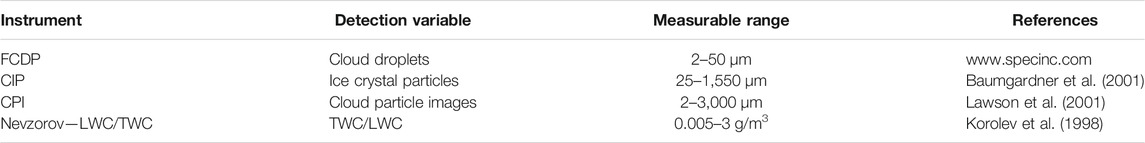
TABLE 1. The cloud microphysical detection instruments, the main parameters observed in this study, and the measureable range of each variable by the instrument, along with the reference for instrument details.
The cloud particle size spectra observed in this study were obtained by FCDP and CIP probes. Considering that most of the ice crystal particles in stratiform clouds are larger than 100 μm in diameter, we assume that cloud particles larger than 100 μm are ice crystals, which can be obtained by CIP probe of 100–1,550 μm, and that the particles smaller than 100 μm are cloud droplets, which can be obtained by FCDP (Korolev and Field, 2015). Considering the higher supersaturation condition of the ice surface than the liquid droplet surface in the mixed-phase cloud, ice crystals larger than 25 μm can grow rapidly in 1 min. Thus, our assumption in general that the FCDP observed particles are all droplets in the cloud examined here should be reasonable. In order to obtain the changes of cloud particle spectra between before and after catalysis in a more detailed manner, the sampling frequency of all instruments used in this study is 1 Hz. Before using the data, we performed quality control on the observed data based on the instrument operating status and true air speed values.
The cloud microphysical parameters used in this study, including the effective radius of cloud particles re, number concentration of cloud particles Nci, and ice water content (IWC) of clouds measured by Nevzorov-LWC/TWC IWCNevzorov are calculated as follows:
where n(r) is the droplet size distribution with number concentration of n at size r, and Nci and ri are the droplet number concentration and the particle size radius of the i-th bin of the instrument, respectively. Nevzorov hot wire LWC/TWC probe can only obtain liquid and total water content, and IWCNevzorov is calculated by subtracting LWCNevzorov from TWCNevzorov. Due to the potential uncertainty of each instrument, the first and last bins of FCDP and the first three bins of CIP were discarded and not used, which was similar to our previous studies (Yang et al., 2019; Zhao et al., 2019; Dong et al., 2020). The whole size range of cloud particles at 3–1,550 μm was obtained by combining the observations of FCDP and CIP. The time used in this study were all converted to local time (UTC + 8).
Weather background was analyzed using 1° × 1° NCEP/NCAR reanalysis data at 14:00 LT on November 29, 2019, and the flight seeding and observation areas were marked in Figure 1. There was a zonal circulation with two troughs and a ridge at 500 hPa (Figure 1A) at mid-high latitudes over Asia. There was also an obvious westerly trough near Hetao, and the detection area was dominated by a southwest airflow in front of the trough. The trough line at 700 hPa (Figure 1B) was located from the Mongolian Plateau to the Hetao area. The flight observation area was under the control of a southwest airflow in the south of the trough with obvious warm moisture advection, making the relative humidity close to saturation. The warm–humid air from the southwest and the cold air from the north converged, causing the formation of a large cloud system at the east of Hetao and the north of Shanxi. The cloud system gradually affected Hebei during its eastward movement. In this process, the atmosphere over the observation area was relatively stable, and the cloud system was dominated by stratus clouds. On the day of November 29, 2019, the relative humidity above the Xingtai site (Figure 1C) that lies within the observation area was relatively low at below 3,000 m, and the wet layer was mainly concentrated in 3,000–5,000 m, which was consistent with the detection results of the aircraft.
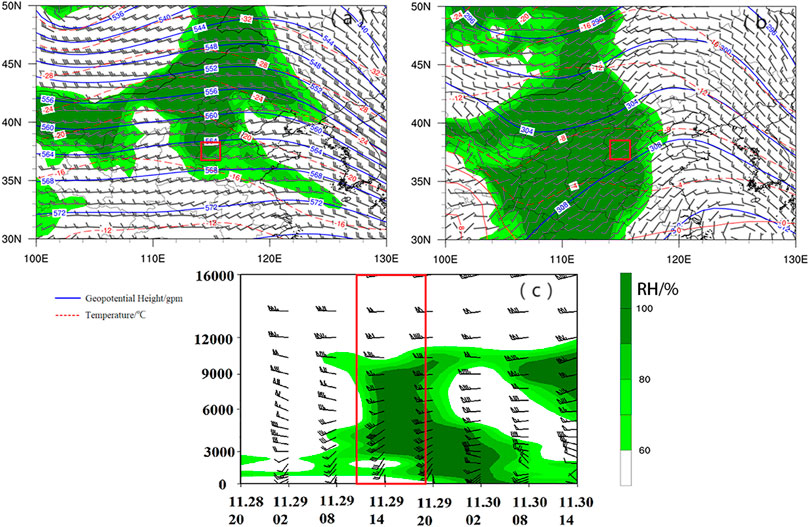
FIGURE 1. The weather pattern at 14:00 LT on November 29, 2019 at (A) 500 hPa and (B) 700 hPa. The blue line represents the geopotential height field, while the red dotted line represents the temperature field. (C) Relative humidity (filled with green-colored contours) and wind field from NCEP reanalysis data above Xingtai site over the observation area in time series. The Xingtai site area was marked by a rectangle in (A,B).
The aircraft took off from Zhengding Airport at 14:50 LT, lifted to 2,100 m, and then leveled over Xingtai, which was located in south-central Hebei Province. After arriving at the detection area, the aircraft first descended to a height of 600 m and then conducted vertical detection of the macro- and micro-properties of cloud by flying from the bottom to the top during the period 15:52–16:18 LT, with an altitude range of 600–7,000 m and a hovering radius of 10 km. After knowing the vertical structure of cloud properties, the aircraft was lowered from a height of 7,000–4,550 m from 16:19 to 16:34 LT. Then, cloud seeding was carried out over Xingtai along the same circular trajectory at 16:37 LT at an altitude of 4,550 m, where the supercooled liquid water content was relatively abundant, and a total of 14 AgI bars were lighted. After cloud seeding, the flight continued to detect the cloud macro- and micro-physical properties in order to know the effect of cloud seeding.
Figure 2 shows the vertical distribution of stratus cloud microphysical properties along with the temperature and relative humidity profiles. It can be seen from Figure 2A that good humidity conditions existed above the height of 2,500 m, which was consistent with the results at around 16:00, as shown in Figure 1C. The corresponding heights of 500 and 700 hpa are about 5,600 and 3,000 m, respectively, and the temperature values in Figure 2A are approximately the same as those in Figure 1A and Figure 1B. As shown in Figure 2A, the vertical detection area of the aircraft was all above the height of 0°C layer, and the temperature decreased with the increase of altitude. However, there were two thin temperature inversion layers near the cloud base and the cloud top, respectively. The temperature at the lower inversion layer varied from -8.2 to −5.4°C with heights from 2,100 m to 2,355 m, and the temperature at the upper inversion layer varied from -13.5 to −10.2°C with heights from 4,600 to 4,800 m. Unlike temperature, relative humidity gradually increased with height, reached saturation in the cloud region, and gradually decreased with height above the cloud top.
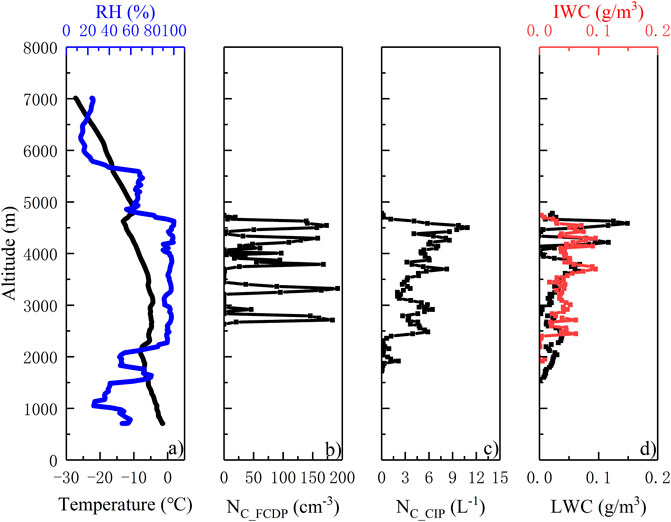
FIGURE 2. (A) Temperature and relative humidity profiles, (B) cloud droplet number concentration observed by fast cloud droplet probe, (C) ice crystal number concentration observed by cloud imaging probe, and (D) liquid water content and ice water content over Xingtai on November 29, 2019.
It was generally believed that when the number concentration obtained by FCDP (NC_FCDP) was greater than 10 cm−3 and LWC ≥ 0.01 g·m−3 at the same time, the corresponding location of the aircraft was determined to be in the cloud (Hobbs, 1991). The dramatic changes of NC_FCDP with height, as shown in Figure 2B, indicated that the vertical distribution of stratus cloud properties varied greatly. The maximum NC_FCDP appeared in lower clouds at heights of about 3,220 m, with the peak value of 192 cm−3. The number concentration of ice crystals (NC_CIP) showed a growing trend with height within clouds and reached the maximum value of 10 L−1 at the top of the cloud, as shown in Figure 2C. The maximum LWC of 0.15 g/m3 appeared near the top of the cloud (Figure 2D), which was similar to the results found by Zhao and Lei (2014). IWC was on the same order of magnitude as LWC, with peak values of up to 0.1 g/m3 at heights of around 4,000 m. Figure 2 shows that both liquid droplets and ice crystals were detected at altitudes from 3,500 to 4,700 m, indicating the mixed-phase status at this height range, which was also the optimal part for cloud seeding due to the existence of supercooled liquid droplets.
After knowing the vertical properties of the cloud system, the flight leveled at the height of 4,550 m, which was rich of supercooled liquid water, to obtain the horizontal microphysical properties of the cloud. The corresponding flight time was 16:34-16:43 LT, and two laps were flown along the same trajectory due to the wind speed in the detection area being less than 5 m/s. We believe that the cloud properties do not change much in a short time. To make sure that the LWC obtained during this experiment was reliable, Figure 3 shows a comparison of LWC in the cloud obtained by two different instruments of FCDP and Nevzorov hot wire, which were denoted as LWCFCDP and LWCNEVZOROV, respectively. LWCFCDP and LWCNEVZOROV had a good consistency on time series (Figure 3A), and the correlation coefficient between them reached 0.81 (Figure 3B), indicating that the LWC detection results had high reliability and accuracy. Note that the LWC from Nevzorov hot wire is slightly smaller than that from FCDP, which might be associated with the potential ice crystals with sizes smaller than 100 μm. LWCFCDP was used in the following sections to represent the liquid water content during the aircraft observation period.
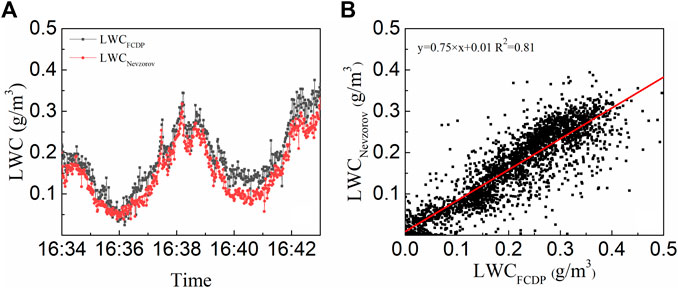
FIGURE 3. For a cloud layer at height 4,550 m: (A) temporal variation of LWCFCDP and LWCNEVZOROV, (B) scattered plots between LWCFCDP and LWCNEVZOROV.
Figure 4 presents the cloud droplet number concentration (NC_FCDP; Figure 4A), the cloud droplet effective radius (re) measured by FCDP (Figure 4B), and the liquid water content (LWCFCDP, Figure 4C) during the level flight process at a height of 4,550 m. The flight observation started in a counter-clockwise direction from point A. Figure 4 presents the observation results from 16:34 LT (the observation started from point A) to 16:39 LT (the flight returned to point A for the second time after one lap). The cloud seeding and detection were carried along the same circular trajectory. Even though the AgI flame bars were lighted at 16:37 LT, the aircraft still detected the unseeded area before the end of the lap. Differently from the general expectation that cloud microphysical properties vary weakly at a horizontal layer for stratus clouds (Wang et al., 2013), NC_FCDP, re, and LWCFCDP varied a lot horizontally. The NC_FCDP ranged from 70 to 248.4 cm−3, corresponding to which the cloud droplet re ranged from 43.71 to 10.2 μm. In addition, the large amount of small cloud droplets implied that condensation, rather than collision, was likely the main way of droplet growth. By comparing the horizontal distribution of NC_FCDP, re and LWCFCDP along the flight track, it was clear that high NC_FCDP corresponded to low re and LWCFCDP and high LWCFCDP corresponded to high re. This suggested that while small droplets had a great contribution to number concentration, LWC in clouds was mainly contributed by large droplets.
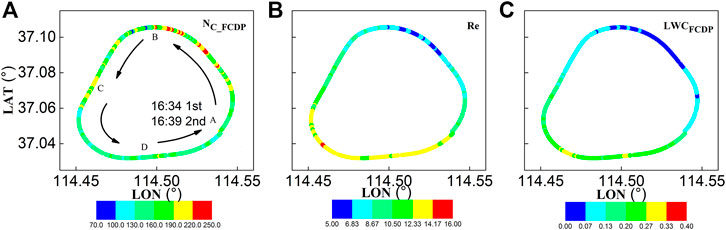
FIGURE 4. For a cloud layer at height 4,550 m: (A) concentration of cloud droplets (NC_FCDP) with unit cm−3, (B) effective radius (re) with unit μm, and (C) LWCFCDP with unit g m−3 along the first flight observation trap.
Not only cloud microphysical properties but also the cloud particle phase varied greatly along the flight track at the selected cloud layer. From 16:34 to 16:37 LT (A-B-C in Figure 4A), the concentration of cloud droplets was relatively high, while re and LWC in the cloud were relatively small. The cloud particle images obtained by CPI during this period are shown in Figure 5A. In this period, the particles are mostly spherical droplets with a small amount of ice crystals. The effective radius of the particles is relatively small, so the concentration of LWCFCDP was low, although NC_FCDP was at a high level. From 16:37-16:39 LT (C-D-A in Figure 4A), the number concentration of cloud droplets was relatively low, with an average of 152.24 cm−3. The cloud particle image (Figure 5B) showed that, at this time, cloud particles were mostly in ice phase. Large ice crystals coexist with small ice crystals in irregular shapes, which might come from the shattering of large crystals. The differences of microphysical properties in the clouds at different horizontal locations were clear, which reflect the serious heterogeneity of stratus cloud properties when they were in a mixed phase.
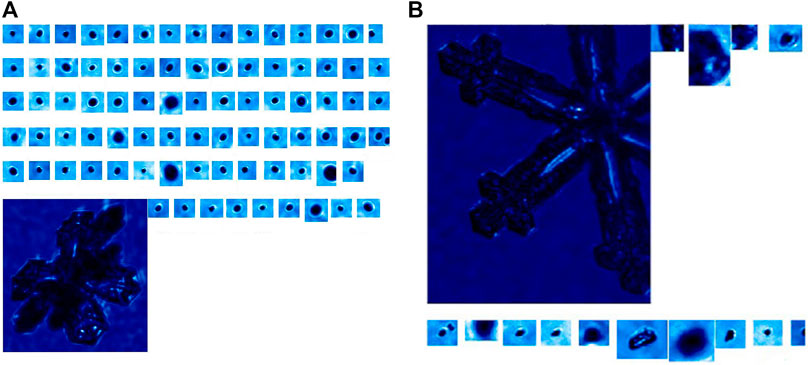
FIGURE 5. Cloud particle images at the height of 4,550 m in the cloud: (A) A-B-C and (B) C-D-A.
Figure 6 shows the temporal variation of cloud microphysical properties along with the flight height and environmental temperature. Note that the time periods shown in Figure 6 include those before and after cloud seeding. The flight made the observations of vertical profiles during the period from 15:52 to 16:18 LT at heights of 600–7,000 m. Then, the altitude of 4,550 m near cloud top, where LWC (supercooled droplets) was relatively abundant, was chosen for cloud seeding at 16:37 LT, with a total of 14 AgI bars lighted. The cloud seeding and detection were carried along the same circular trajectory. Even though the AgI flame bars were lighted at 16:37 LT, the aircraft still detected the unseeded area before the end of the lap. The aircraft returned to the position where the cloud seeding started at 16:43 LT, and the AgI flame bars got extinguished at 16:58 LT. Then, the aircraft started the observation of cloud microphysical properties after seeding along the same trajectory until 17:05 LT. The concentration of NC_CIP and NC_FCDP were 7.1 L−1 and 160.3 cm−3, on average, after two circles of detection in horizontal flight, which showed no significant difference from that in the vertical detection stage. As presented from the particle images, the cloud droplets and ice crystals coexisted before cloud seeding (Figure 5A and Figure 5B). The concentration of NC_FCDP (Figure 6B) decreased from 160.3 to 129 cm−3, on average, in about 7 to 8 min after seeding. When the plane arrived at the initial seeding position after a circle of flat flight, the concentration of NC_FCDP reduced obviously to 88.94 cm−3 in minimum, and the horizontal spatial distribution became more uniform. LWC showed obvious regional differences before seeding, and these differences were no longer evident during the seeding process. After seeding (16:58–17:05 LT), LWC presented a significant decreasing trend, which indicated that the silver iodide ice nuclei were introduced into the clouds, and the supercooled water in the cloud was consumed through the Bergeron process. It can be seen from Figure 6C that the concentration of ice crystals at 4,550 m was distributed relatively uniformly before seeding, and the concentration fluctuates after seeding. The concentration of NC_CIP increased slightly after seeding, and several peaks appeared (for example, NC_CIP reached 52.2 L−1 at 16:53:59 LT and 149.3 L−1 at 17:00:52 LT). The concentration of ice crystals increased from 7.1 to 10 L−1 on average. The maximum NC_CIP reached 785.5 L−1 especially in some specific regions. In other studies in central and southern Hebei Province, it was also found that the concentration of ice crystals in some areas increased to hundreds after seeding. Compared with the results of this study, the concentrations of ice crystals are of a similar magnitude (Dong et al., 2020; Dong et al., 2021). Moreover, Figure 6E shows that the proportion of LWC decreased significantly from 67 to 50% after seeding, indicating that part of the LWC was consumed. As a result, the temperature decreased to a certain extent, instead of increasing, due to latent heat released by condensation as we usually thought.
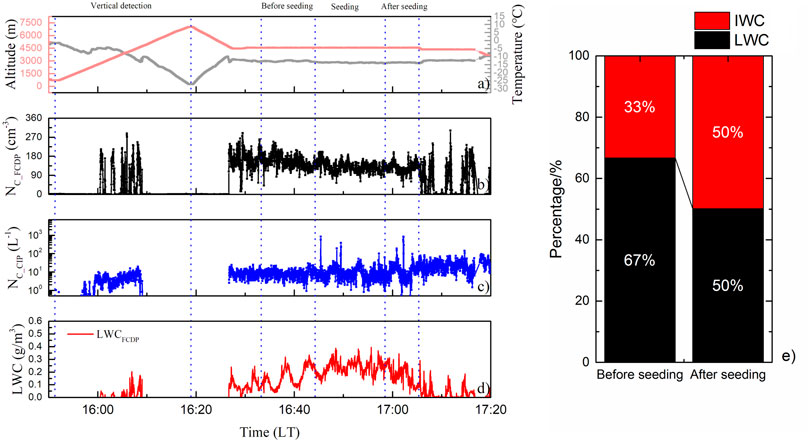
FIGURE 6. Changes of microphysical properties in the cloud during the observation and the seeding periods: (A) temperature and height, (B) NC_FCDP, (C) NC_CIP, (D) LWCFCDP, and (E) percentage of liquid water content and ice water content relative to the total water content.
Figure 7 shows the cloud particle size distribution measured by FCDP and CIP in the region with abundant LWC before (16:34–16:43 LT) and after seeding (16:58–17:05 LT). Before seeding, the cloud showed a bimodal particle size distribution. The concentration of cloud particles showed a peak value of about 44.10 cm−3 in the size range of 4.5–6 μm (droplets) and another peak value of 0.195 cm−3 in the size range of 350–375 μm (ice particles). After seeding, the cloud showed a unimodal particle size distribution. The spectrum of small cloud particles measured by FCDP shifted to the right, and the peak value appeared in the range of 12–14 μm. Compared with cloud particle size distribution before seeding, the peak concentration was slightly decreased, which was about 29.28 cm−3. The concentration of small cloud particles (1.5–4.5 μm) on the left side of the peak decreased by about 1 order of magnitude after seeding, but the concentration on the right side of the peak (6–50 μm) increased by about 1 order of magnitude. The changes of particle size distribution of the ice crystals measured by CIP were more obvious. The peak value of ice crystal number concentration at 350–375 μm disappeared after seeding, and the concentration of ice crystals at 100–675 μm increased significantly by about 1–2 orders of magnitude. Particularly, the ice crystal concentration at 100–125 μm increased from 2.73 × 10⁻⁴ to 7.08 × 10⁻² cm−3. Moreover, cloud particle images showed that flaky or columnar ice crystals appeared after seeding. From the analysis above, it can be concluded that the aircraft cloud seeding in this study presented a remarkable effect on mixed-phase cloud microphysical properties.
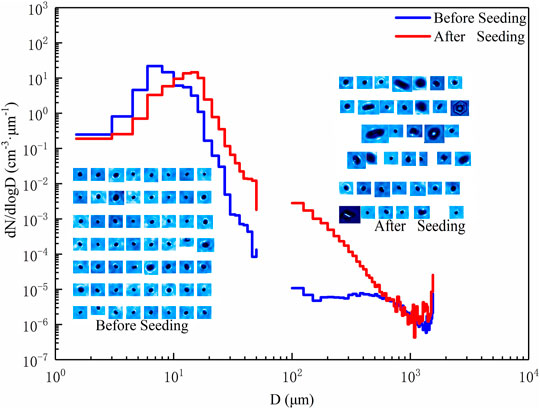
FIGURE 7. Size distribution and phase state of particles in the cloud with abundant liquid water content before and after seeding.
Based on the aircraft observations for a mixed-phase cloud over Xingtai, Hebei Province, China, on November 29, 2019, this study investigates the response of mixed-phase cloud microphysical properties to cloud seeding near cloud top. Several valuable findings have been found.
Through the weather background analysis before cloud seeding, the suitable dynamic and humidity conditions between 700 and 500 hPa led to the abundance of supercooled water in the cloud, which was consistent with the aircraft detection results, and had a certain guiding significance for the early identification about the existence of supercooled water.
The aircraft observations showed that the vertical distribution of cloud properties was not uniform. The vertical distribution of NC_FCDP presented a multi-peak structure, with the maximum value that appeared at 3,322 m. In contrast, the maximum value of NC_CIP appeared at 4,550 m in the upper part of the cloud. The height with peak LWC in the cloud was consistent with NC_CIP, which was also 4,550 m. Liquid water and ice water coexisted at the altitude range from 3,500 to 4,700 m. Therefore, the middle and upper parts of this cloud were considered as mixed phase with the coexistence of supercooled liquid water and ice crystals, illustrating the suitable cloud seeding condition at the height of 4,550 m.
Cloud microphysical properties had distinct responses to cloud seeding. After seeding, the concentration of ice crystals increased on average, and the size of ice crystals increased obviously at the same time. The horizontal variation of LWC in the cloud was no longer obvious, and LWC showed an obvious decreasing trend after seeding, which indicated that the silver iodide ice nuclei were introduced into the clouds through aircraft seeding and the supercooled water in the cloud was consumed. Similarly, the cloud particle size response to cloud seeding was also obvious with increased ice crystal sizes. In short, the phase state, size distribution, and LWC in the cloud all had an obvious response to the artificial introduction of silver iodide, indicating that cloud seeding played a significant effect in this study. The results of this study are helpful to understand the response mechanism of cloud microphysical properties to cloud seeding and provide an effective basis for the artificial precipitation enhancement effect.
The original contributions presented in the study are included in the article/Supplementary Material, further inquiries can be directed to the corresponding author.
CZ provided theoretical guidance. XD and RM carried out the flight observation mission. YC, FX, and JF helped with data analysis.
This work was supported by the National Key Research and Development Program of China (Grant 2019YFC1510301), the Hebei province Key Research and Development project (Grants 20375402D and 19275420D), the National Natural Science Foundation of China (Grant 41925022), and the Key Laboratory of Meteorology and Ecological Environment of Hebei Province Project (Grant Z202002H).
The authors declare that the research was conducted in the absence of any commercial or financial relationships that could be construed as a potential conflict of interest.
All claims expressed in this article are solely those of the authors and do not necessarily represent those of their affiliated organizations or those of the publisher, the editors, and the reviewers. Any product that may be evaluated in this article or claim that may be made by its manufacturer is not guaranteed or endorsed by the publisher.
Special appreciation is extended to the project participants for aircraft data acquisition. The NCEP/NCAR reanalysis data used for weather background analysis can be downloaded from https://psl.noaa.gov/data/gridded/data.ncep.reanalysis.pressure.html. The aircraft datasets and data description for this research can be downloaded publicly online from https://pan.bnu.edu.cn/l/KnHC01.
Andreae, M. O., and Rosenfeld, D. (2008). Aerosol-cloud-precipitation Interactions. Part 1. The Nature and Sources of Cloud-Active Aerosols. Earth Sci. Rev. 89 (1-2), 13–41. doi:10.1016/j.earscirev.2008.03.001
Baumgardner, D., Jonsson, H., Dawson, W., O'Connor, D., and Newton, R. (2001). The Cloud, Aerosol and Precipitation Spectrometer: a New Instrument for Cloud Investigations. Atmos. Res. 59-60, 251–264. doi:10.1016/S0169-8095(01)00119-3
Bergeron, T. (1935). On the physics of cloud and precipitation. Proc 5th Assembly of IUGG, Lisbon, 156–178.
Dong, X., Zhao, C., Yang, Y., Wang, Y., Sun, Y., and Fan, R. (2020). Distinct Change of Supercooled Liquid Cloud Properties by Aerosols from an Aircraft-Based Seeding experiment. Earth Space Sci. 7 (8), e2020EA001196. doi:10.1029/2020EA001196
Dong, X., Zhao, C., Huang, Z., Mai, R., Lv, F., Xue, X., et al. (2021). Increase of Precipitation by Cloud Seeding Observed from a Case Study in November 2020 over Shijiazhuang, China. Atmos. Res. 262 (5), 105766. doi:10.1016/j.atmosres.2021.105766
Emery, E., Miller, D., Plaskon, S., Strapp, W., and Lillie, L. (2004). “Ice Particle Impact on Cloud Water Content Instrumentation,” in 42nd AIAA Aerospace Sciences Meeting and Exhibit, Reno, Nevada, January 5–8, 2004. doi:10.2514/6.2004-731
Faber, S., French, J. R., and Jackson, R. (2018). Laboratory and In-Flight Evaluation of Measurement Uncertainties from a Commercial Cloud Droplet Probe (CDP). Atmos. Meas. Tech. 11 (6), 3645–3659. doi:10.5194/amt-11-3645-2018
Hobbs, P. V. (1991). Twenty Years of Airborne Research at the University of Washington. Bull. Amer. Meteorol. Soc. 72 (11), 1707–1716. doi:10.1175/1520-0477(1991)072<1707:tyoara>2.0.co;2
Korolev, A., and Field, P. R. (2015). Assessment of the Performance of the Inter-arrival Time Algorithm to Identify Ice Shattering Artifacts in Cloud Particle Probe Measurements. Atmos. Meas. Tech. 8 (2), 761–777. doi:10.5194/amt-8-761-2015
Korolev, A. V., Strapp, J. W., Isaac, G. A., and Nevzorov, A. N. (1998). The Nevzorov Airborne Hot-Wire LWC-TWC Probe: Principle of Operation and Performance Characteristics. J. Atmos. Ocean. Technol. 15 (6), 1495–1510. doi:10.1175/1520-0426(1998)015<1495:tnahwl>2.0.co;2
Korolev, A., Strapp, J. W., Isaac, G. A., and Emery, E. (2013). Improved Airborne Hot-Wire Measurements of Ice Water Content in Clouds. J. Atmos. Ocean. Techn. 30 (9), 2121–2131. doi:10.1175/JTECH-D-13-00007.1
Lance, S., Brock, C. A., Rogers, D., and Gordon, J. A. (2010). Water droplet calibration of the Cloud Droplet Probe (CDP) and in-flight performance in liquid, ice and mixed-phase clouds during ARCPAC. Atmos. Meas. Tech. 3 (6), 1683–1706. doi:10.5194/amt-3-1683-2010
Lawson, R. P., Baker, B. A., Schmitt, C. G., and Jensen, T. L. (2001). An Overview of Microphysical Properties of Arctic Clouds Observed in May and July 1998 during FIRE ACE. J. Geophys. Res. 106 (D14), 14989–15014. doi:10.1029/2000JD900789
Li, Z., Lau, W. K. M., Ramanathan, V., Wu, G., Ding, Y., Manoj, M. G., et al. (2016). Aerosol and Monsoon Climate Interactions over Asia. Rev. Geophys. 54 (4), 866–929. doi:10.1002/2015RG000500
Lohmann, U., and Feichter, J. (2005). Global Indirect Aerosol Effects: a Review. Atmos. Chem. Phys. 5 (3), 715–737. doi:10.5194/acp-5-715-2005
Norris, J. R. (2005). Multidecadal Changes in Near-Global Cloud Cover and Estimated Cloud Cover Radiative Forcing. J. Geophys. Res. Atmos. 110. doi:10.1029/2004JD005600
Pokharel, B., and Geerts, B. (2016). A Multi-Sensor Study of the Impact of Ground-Based Glaciogenic Seeding on Clouds and Precipitation over Mountains in Wyoming. Part I: Project Description. Atmos. Res. 182, 269–281. doi:10.1016/j.atmosres.2016.08.008
Pokharel, B., Geerts, B., Jing, X., Friedrich, K., Ikeda, K., and Rasmussen, R. (2017). A Multi-Sensor Study of the Impact of Ground-Based Glaciogenic Seeding on Clouds and Precipitation over Mountains in Wyoming. Part II: Seeding Impact Analysis. Atmos. Res. 183, 42–57. doi:10.1016/j.atmosres.2016.08.018
Pruppacher, H. R., and Klett, J. D. (2010). “Microstructure of Atmospheric Clouds and Precipitation,” in Microphysics of Clouds and Precipitation (Dordrecht: Springer), Vol. 18, 10–73. Atmospheric and Oceanographic Sciences Library. doi:10.1007/978-0-306-48100-0_2
Ramanathan, V., Cess, R. D., Harrison, E. F., Minnis, P., Barkstrom, B. R., Ahmad, E., et al. (1989). Cloud-radiative Forcing and Climate: Results from the Earth Radiation Budget experiment. Science 243 (4887), 57–63. doi:10.1126/science.243.4887.57
Schaefer, V. J. (1946). The Production of Ice Crystals in a Cloud of Supercooled Water Droplets. Science 104 (2707), 457–459. doi:10.1126/science.104.2707.457
Sun, Y., Zhao, C., Su, Y., Ma, Z., Li, J., Letu, H., et al. (2019). Distinct Impacts of Light and Heavy Precipitation on PM 2.5 Mass Concentration in Beijing. Earth Space Sci. 6 (10), 1915–1925. doi:10.1029/2019EA000717
Tao, W., Chen, J., Li, Z., Wang, C., and Zhang, C. (2012). Impact of Aerosols on Convective Clouds and Precipitation. Rev. Geophys. 50. doi:10.1029/2011RG000369
Tessendorf, S. A., Ikeda, K., Weeks, C., Rasmussen, R., Wolff, J., and Xue, L. (2020). An Assessment of Winter Orographic Precipitation and Cloud-Seeding Potential in Wyoming. J. Appl. Meteorol. Climatol. 59 (7), 1217–1238. doi:10.1175/JAMC-D-19-0219.1
Vonnegut, B. (1947). The Nucleation of Ice Formation by Silver Iodide. J. Appl. Phys. 18, 593–595. doi:10.1063/1.1697813
Wang, L., Yin, Y., Lunge, L. I., Wang, X., and Fugang, L. I. (2013). Analyses on Typical Autumn Multi-Layer Stratiform Clouds over the Sanjiangyuan National Nature Reserve with Airborne Observations. Chin. J. Atmos. Sci. 37 (28), 1038–1058. doi:10.1016/j.atmosenv.2009.04.022
Yang, X., Zhao, C., Guo, J., and Wang, Y. (2016a). Intensification of Aerosol Pollution Associated with its Feedback with Surface Solar Radiation and Winds in Beijing. J. Geophys. Res. Atmos. 121 (8), 4093–4099. doi:10.1002/2015JD024645
Yang, X., Zhao, C., Zhou, L., Wang, Y., and Liu, X. (2016b). Distinct Impact of Different Types of Aerosols on Surface Solar Radiation in China. J. Geophys. Res. Atmos. 121 (11), 6459–6471. doi:10.1002/2016JD024938
Yang, X., Zhou, L., Zhao, C., and Yang, J. (2018). Impact of Aerosols on Tropical Cyclone-Induced Precipitation over the mainland of China. Climatic Change 148, 173–185. doi:10.1007/s10584-018-2175-5
Yang, Y., Zhao, C., Dong, X., Fan, G., Zhou, Y., Wang, Y., et al. (2019). Toward Understanding the Process-Level Impacts of Aerosols on Microphysical Properties of Shallow Cumulus Cloud Using Aircraft Observations. Atmos. Res. 221, 27–33. doi:10.1016/j.atmosres.2019.01.027
Zhao, C., Yang, Y., Fan, H., Huang, J., Fu, Y., Zhang, X., et al. (2020). Aerosol Characteristics and Impacts on Weather and Climate over the Tibetan Plateau. Natl. Sci. Rev. 7 (3), 492–495. doi:10.1093/nsr/nwz184
Zhao, C., and Garrett, T. J. (2015). Effects of Arctic Haze on Surface Cloud Radiative Forcing. Geophys. Res. Lett. 42 (2), 557–564. doi:10.1002/2014GL062015
Zhao, X., Sun, Y., Zhao, C., and Jiang, H. (2020). Impact of Precipitation with Different Intensity on PM 2.5 over Typical Regions of China. Atmosphere 11 (9), 906. doi:10.3390/atmos11090906
Zhao, Z., and Lei, H. (2014). Aircraft Observations of Liquid and Ice in Midlatitude Mixed-phase Clouds. Adv. Atmos. Sci. 31, 604–610. doi:10.1007/s00376-013-3083-2
Zhao, C., Lin, Y., Wu, F., Wang, Y., Li, Z., Rosenfeld, D., et al. (2018). Enlarging Rainfall Area of Tropical Cyclones by Atmospheric Aerosols. Geophys. Res. Lett. 45 (16), 8604–8611. doi:10.1029/2018GL079427
Keywords: mixed-phase, cloud-seeding, microphysical properties, respond, cloud top
Citation: Yang Y, Zhao C, Fu J, Cui Y, Dong X, Mai R and Xu F (2022) Response of Mixed-Phase Cloud Microphysical Properties to Cloud-Seeding Near Cloud Top Over Hebei, China. Front. Environ. Sci. 10:865966. doi: 10.3389/fenvs.2022.865966
Received: 30 January 2022; Accepted: 14 February 2022;
Published: 24 March 2022.
Edited by:
Honglei Wang, Nanjing University of Information Science and Technology, ChinaReviewed by:
Shaofeng Hu, China Meteorological Administration, ChinaCopyright © 2022 Yang, Zhao, Fu, Cui, Dong, Mai and Xu. This is an open-access article distributed under the terms of the Creative Commons Attribution License (CC BY). The use, distribution or reproduction in other forums is permitted, provided the original author(s) and the copyright owner(s) are credited and that the original publication in this journal is cited, in accordance with accepted academic practice. No use, distribution or reproduction is permitted which does not comply with these terms.
*Correspondence: Chuanfeng Zhao, Y3poYW9AYm51LmVkdS5jbg==
Disclaimer: All claims expressed in this article are solely those of the authors and do not necessarily represent those of their affiliated organizations, or those of the publisher, the editors and the reviewers. Any product that may be evaluated in this article or claim that may be made by its manufacturer is not guaranteed or endorsed by the publisher.
Research integrity at Frontiers
Learn more about the work of our research integrity team to safeguard the quality of each article we publish.