 Jianhong Cao
 Siong Hook Law
 Desheng Wu2*†
 Xiaodong Yang
- 1School of Business and Economics, University Putra Malaysia, Selangor, Malaysia
- 2School of Economics and Management, University of Chinese Academy of Sciences, Beijing, China
- 3School of Economics and Management, Xinjiang University, Urumqi, China
- 4Center for Innovation Management, Xinjiang University, Urumqi, China
To dredge China’s green growth path, this paper analyzes the front-end and back-end factors affecting green growth and also investigates the mediation role of digital financial inclusion from different dimensions. This study employs China’s provincial panel data in 2011–2018 and uses the dynamic threshold model to study the threshold effect of technological progress (TP) on green growth (GG) and the threshold effect of green growth (GG) on floating population (FP). The empirical results show that: first, with the digital financial inclusion as the threshold variable, there is a nonlinear relationship between technological progress (TP) and green growth (GG); second, with digital financial inclusion as the threshold variable, there is a nonlinear relationship between green growth (GG) and floating population (FP); third, output biased technological progress needs more support from digital financial inclusion than input biased technological progress than can significantly promote green growth. From the dimension of “digitization+financial scale+inclusion” digital financial inclusion not only improves the positive effect of technological progress on green growth but also alleviates the negative effect of green growth on the floating population. This study makes up for the research gap in the back-end impact of green growth based on new ideas of digital financial inclusion and floating population and has important theoretical reference significance for removing the obstacles in the green development path and realizing sustainable green growth.
1 Introduction
With the intensification of the contradiction between the ecological environment and economic growth, green growth has become an important issue for the economic development of China and the entire world (Wang et al., 2021; Zhao et al., 2021a; Ren et al., 2022). Consequently, methods to effectively remove the stumbling blocks on the road to green growth has always been a difficult problem actively explored by scholars (Gu et al., 2018; Lin and Zhu, 2019; Song et al., 2019; Cao et al., 2021). In the past 40 years, the extensive development model of China’s economy has not only created an "economic miracle” but also fully verifies the left part of the turning point of the Environmental Kuznets Curve (EKC). According to the data released by China’s National Bureau of Statistics, from 1978 to 2020, China’s Gross Domestic Product (GDP) increased by about 276.2 times. According to relevant information in China’s Environmental Statistics Yearbook, China’s total energy consumption increased by about 8.5 times from 1978 to 2019.
However, according to the Environmental Kuznets Curve (EKC) theory, when the economy grows to a high level, environmental pollution decreases (Stern, 2004; Dogan and Inglesi-Lotz, 2020). The arrival of this inflection point will also mean the gradual reconciliation of the contradiction between economic growth and environmental pollution (Ren et al., 2022). The green growth model is also an important product of this transition period. Organization for Economic Cooperation and Development (OECD) pointed out that green growth refers to promoting economic growth and development while ensuring that natural assets can continue to provide various resources and environmental services for human happiness. In recent years, China has predicted that the ‘‘carbon peak” is coming in 2030 (Liu et al., 2015; Yu et al., 2018; Sun et al., 2020; Zhu et al., 2020; Yang et al., 2021a; Wu et al., 2021). From a deep perspective, the movement of this inflection point must be driven by many endogenous variables behind it such as technological progress (Baiardi, 2014; Ahmed et al., 2016), financial development, and so on (Javid and Sharif, 2016; Destek and Sarkodie, 2019). If China wants to smoothly speed up crossing this inflection point and realize sustainable economic growth, in-depth study on the endogenous variables affecting green growth is required (Hao et al., 2022). However, research from the front-end and back-end perspectives is the key to dredging the green growth path. Previous studies have more considered that the demographic dividend may include environmental costs, but few scholars have comprehensively studied the demographic dividend costs that may be included in green growth from the perspective of the environment and the economy. Digital financial inclusion is expected to become a sharp tool to dredge the path of green growth. Therefore, the objective of this paper is to investigate the threshold effect of technological progress on green growth and green growth on the floating population with digital financial inclusion as the threshold variable from 2011–2018 in China. This study is of great significance to eliminate friction in the green economic growth road so as to accelerate the green transformation of China’s economy.
This study contributes to the literature in three aspects: first, this paper not only studies the factors restricting green growth from the front-end but also studies the side effects of green growth from the back-end, which makes up for the gap in existing research and helps to dredge the path of green growth; second, this paper creatively takes floating population as the back-end constraint of green growth; third, this paper takes digital financial inclusion as an important threshold variable to test its impact on the front-end and back-end constraints of green growth. The results show that digital financial inclusion can alleviate the friction of the green growth path. This study is conducive to accelerating the green transformation of China’s economy and reducing the resistance in the green growth process, thus promoting the sustainable growth of China’s economy.
The remainder of this paper is organized as follows: Section 2 provides the theoretical mechanism; Section 3 presents the literature review; Section 4 specifies the research methodology; Section 5 reports the estimated results and analysis; Section 6 provides the conclusion and policy recommendations of the study.
2 Theoretical Mechanism
Firstly, this paper studies the front-end factors affecting green growth. Romer’s economic growth model regards technological progress as an important endogenous factor affecting economic growth (Romer, 1990). However, in the initial stage of China’s economic growth, the direction of technological progress is greatly driven by the enterprise-scale effect (Liobikienė and Butkus, 2019; Sun et al., 2019; Li and Li, 2020). During this period, most of the technology research and development (R&D) is aimed at improving the exploitation efficiency and production efficiency of natural resources, to maximize profits, while there was less R&D in energy-saving and emission reduction technologies (Hao et al., 2021; Xie et al., 2022). It has to be said that the technological progress in this period may be the accelerator of economic growth and ecological environment damage. In recent years, the positive significance of technological progress on the coordinated development of the economy and ecological environment has been widely studied (Cheng et al., 2021; Hu et al., 2021). However, in reality, the promotion of technological progress for protecting ecological and environmental quality still faces many difficulties.
Considering the impact of financial development, there are three main problems in the relationship between technological progress and green growth. 1) Digitization: the backward information screening technology in the traditional financial sector leads to stronger information asymmetry and low efficiency of financial resource allocation. Therefore, financial resources and their accompanying advanced technology flow to sectors with low productivity and technological innovation levels, which induces technological innovation inertia and hinders technological progress (Tobin, 1984; Zhu et al., 2020). For this reason, technological progress cannot obtain sustainable innovation power to support enterprises to update green production processes and improve production efficiency, thus hindering green growth. 2) Financial scale: the loans of traditional financial factors rarely involve green environmental protection projects which results in lower investment in enterprises engaged in green technology R&D. Digital financial inclusion will give more consideration to the environmental information disclosure of enterprises in the application process so as to encourage enterprises to increase technology R&D investment to improve energy efficiency and reduce pollution emissions and finally promote technology-guided green growth. 3) Inclusion: the traditional financial sector discriminates against small and risky small and medium-sized enterprises (SMEs) in the financing, which makes these enterprises in the “long tail” market lack sufficient funds for technological innovation. For SMEs, environmental protection project investment belongs to the superstructure to a large extent (Zhang et al., 2018). However, SMEs have contributed more than 70% of technological innovation in China, but according to the World Bank 2014 data, the proportion of potential financing gap of China’s small, medium and micro enterprises is as high as 43.18%. Therefore, how to remove the stumbling block of financing constraints and promote the support effect of technological progress for green growth? Digital financial inclusion may alleviate the above problems from the dimension of “digitization + financial scale + inclusion”. Figure 1 shows the growth trend of technological progress (expressed as neutral technology progress (NTP)) from 2011 to 2018. It can be seen that technological progress has great volatility.
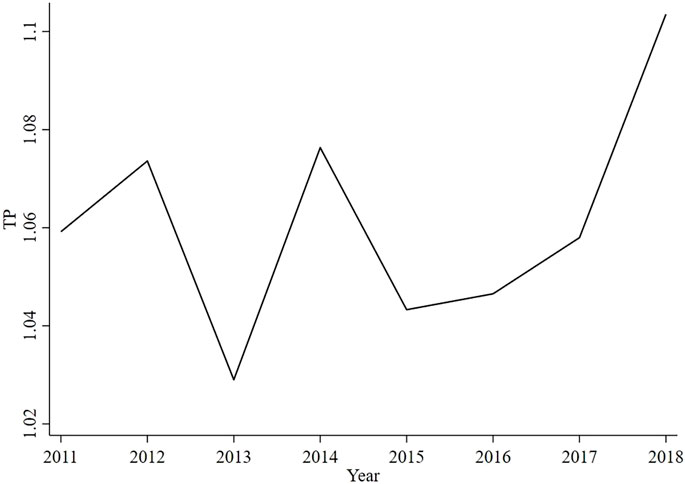
FIGURE 1. The trend of provincial average technological progress from 2011 to 2018. Source: The original data is collected from China’s Environmental Statistics Yearbook and calculated using MaxDEA.
Secondly, this paper analyzes the back-end factors affecting green growth. Although there are front-end obstacles in promoting green growth, green growth may also have back-end side effects. Green growth may increase the demographic dividend costs by affecting population flows. The process of green growth is also a process of gradual decoupling between economic growth and the destruction of the natural ecological environment (McGee, 2020; Desha et al., 2010). However, in the early stage of green growth, the peeling process of this heavy burden not only faces technical problems but also has a phased negative impact on the economy and society. In the process of decoupling economic growth from environmental pollution, it is necessary to eliminate backward brown technology and innovate production mode (Conrad and Cassar, 2014; McGee and Greiner, 2018). Therefore, several enterprises with low innovation levels and relying on traditional production technology and natural resources have to be filtered out or transformed and upgraded with the peeling off of the environmental pollution burden. However, most of these enterprises are small and medium-sized manufacturing industries with backward modes of production, shortage of funds (Zha et al., 2012), and high pollution emissions. Under the general trend of economic green transformation, they are very likely to withdraw from the market due to financing constraints (Ghisetti et al., 2017). On the one hand, the withdrawal of this part of market subjects will lead to the peeling off of some economic output. On the other hand, it will lead to the peeling off of the floating population accommodated by such enterprises, thus inhibiting market vitality. The reduction of the floating population is one of the manifestations of the negative impact of green growth in the transition period. The green transformation stage of the economy is also the area near the inflection point of the Environmental Kuznets Curve (EKC).
Considering the impact of financial development, there are three main problems in the relationship between green growth and floating population. 1) digitization: in the process of green development, China’s central and western regions have undertaken the transfer of heavily polluting enterprises in the eastern region (Rubashkina et al., 2015), so the business of the financial sector in central and western regions is biased towards such enterprises. In addition, the distribution of offline financial service outlets in the central and western regions is scattered and the efficiency of digital services is low. Moreover, the average education level of the population in the central and western regions is not high, so it is difficult to accumulate floating capital through self-education investment with the help of financial capital. Therefore, it is easy for the floating population in the central and western regions to bind with such enterprises with low technical content and reduce liquidity. 2) Financial scale: environmental regulation in the process of realizing green growth forces enterprises to increase the expenditure on purchasing environmental protection equipment and advanced technology, thus squeezing production cost, while the scale of labor-capital expenditure is also squeezed, thus reducing the pull on the floating population. 3) Inclusion: technology R&D has the characteristics of a long investment cycle, slow return, and high risk. Therefore, many scientific and technological SMEs are excluded from the traditional financial sector. However, the green development strategy and green growth model urge enterprises to carry out green technology innovation to compensate the compliance cost, so it further increases the enterprise’s risk factors and shrinks the enterprise’s financing channels again (Cao et al., 2021). Under the strength constraints of environmental indicators, some enterprises may withdraw from the market, thus reducing the pull on the existing and potential floating population. Therefore, does green growth also reduce part of the demographic dividend by reducing population mobility? Digital financial inclusion is expected to solve the above problems through the three dimensions of ‘‘digitization + financial scale + inclusion”. Figure 2 shows the trend of provincial average floating population from 2011 to 2018. It can be seen from Figure 2 that since 2012, the number of the floating population tends to fluctuate year by year. At the same time, Cao et al. (2021) and Rongwei and Xiaoying (2020) found that green growth also fluctuates year by year.
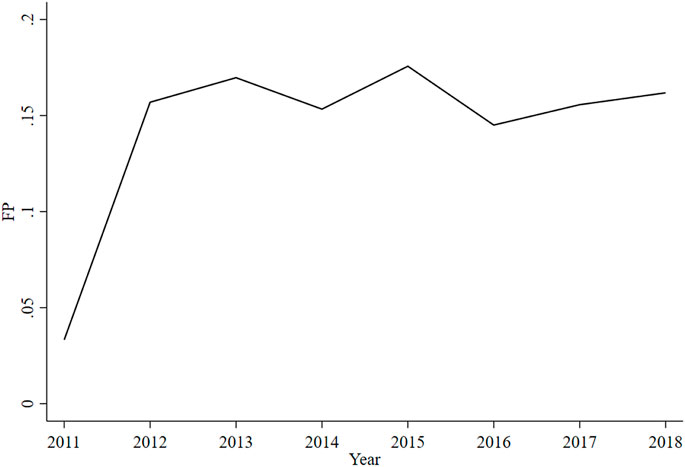
FIGURE 2. The trend of provincial average floating population from 2011 to 2018 Source: the primary data collected from China National Bureau of Statistics.
Based on the above problems, on the one hand, during China’s 13th Five Year Plan period, the central government allocated a total budget of 1.9 trillion yuan to support pollution prevention and control as well as the construction of an ecological civilization. The financial support policy of green development not only internalizes the external cost caused by environmental pollution but also compensates for the extra cost of green production. However, the accuracy and efficiency of the national green financial support policy are not high. In addition, financial subsidies are low, with narrow coverage, low amount, and small proportion. Therefore, most enterprises are still excluded. On the other hand, digital information technology is gradually integrated with finance and serves customers in the tail market to solve the ‘‘last mile problem” of finance (Hasan et al., 2020). With the help of Artificial Intelligence, Blockchain, Big Data, Cloud Computing, and other technologies, digital financial inclusion alleviates the financial friction caused by information asymmetry and establishes a perfect third-party credit investigation system to reduce the risk control cost in the process of developing the long tail market of financial business and reduce the financing constraints of small and micro enterprises (Liu et al., 2021; Zheng et al., 2020). Therefore, can digital financial inclusion remove the obstacles at the front and back of the green growth path from three dimensions of “digitization + financial scale + inclusion” to dredge the green growth path?
3 Literature Review and Research Hypothesis
3.1 The Threshold Effect of Technological Progress on the Green Growth With the Digital Financial Inclusion as the Threshold Variable
Schumpeter (1912) suggested that a well-functioning financial system can provide funds for the technological innovation of enterprises, thus driving economic growth. The basic Schumpeterian model of economic growth considers technological progress as an important factor for long-run growth (Schumpeter, 1934). Romer (1990) analyzed the reason for technological progress and holds that technological progress is an endogenous variable that causes economic growth and a product of human investment. Technological progress can be improved through human capital investment and R&D investment. Thus formed the new economic growth theory, also known as endogenous growth theory. Financial development may facilitate innovation activities by alleviating credit constraints on the flow of capital to its most productive projects and hence promote technological R&D financing and growth (Gorodnichenko and Schnitzer, 2013; Hsu et al., 2014; Levine et al., 2017). However, with the increasingly fierce contradiction between economic development and natural ecological environment, and the increasingly prominent problems existing in the traditional financial system, the traditional endogenous model of ‘‘inancial development + technological progress + economic growth” has gradually developed into the form of ‘‘digital and inclusive financial development + green technological progress + green growth”.
With the increasing attention to environmental problems, relevant researchers have made a lot of research on the effect of technological progress on green growth (Bai et al., 2018; Capasso et al., 2019; Dubey et al., 2019; Khan et al., 2020; Pham et al., 2020; Wang and Wei, 2020; Yi et al., 2020; Yang et al., 2021b; Liu et al., 2021; Nosheen et al., 2021; Huang et al., 2022). Some scholars have found that technological progress is conducive to promoting green growth (Deng et al., 2015; Jin et al., 2017; Luo et al., 2017; Dubey et al., 2018b; Chen et al., 2020). The main reasons are: on the one hand, technological progress is helpful to promoting economic growth. Technological progress can promote the equal product curve to move to the origin by increasing factor marginal output, saving production costs, and finally improving total factor productivity (Li et al., 2019). On the other hand, technological progress is conducive to energy conservation and emission reduction. Energy-saving technological progress is a benefit for improving the marginal output of energy (Yuan et al., 2009; Yang et al., 2017), especially in the stage when the change of market demand lags, it is conducive to reducing the total energy consumption. In addition, when the overall technological progress environment is at a high level, the spillover effect caused by the excessive financial scale has a weak impact on the technological innovation inertia of low productivity sectors (Tobin, 1984; Zhu et al., 2020). Dechezleprêtre et al. (2015) found that enterprises will reduce their pollutant emissions through new technologies or reduce production to meet the government’s policy requirements. Dong and Xiao. (2014) argued that the improvement of environmental quality has a ‘‘crowding out effect” on economic output. When the direction of technological progress is changed and the intensity of clean technology is large enough, it can promote green economic growth.
However, there are some scholars who believe that technological progress has a negative effect on green growth (Kumar, 2014; Ali et al., 2016; Lin et al., 2017; Cheng et al., 2018). The main reasons are: firstly, the backward information screening technology makes the mismatch of financial resources caused by information asymmetry induce the inertia of technological innovation in low productivity sectors. Secondly, there is too little investment in green technology R&D. In addition, China’s SMEs, which contribute 70% of technological innovation have long faced financing discrimination resulting in insufficient investment in technology R&D. Moreover, when the overall environment of technological progress is at a low level, the spillover effect caused by excessive financial scale has a strong impact on the technological innovation inertia of low productivity sectors (Tobin, 1984; Zhu et al., 2020). Furthermore, there are also scholars who support the view that the impact of technological progress on green growth is affected by financial development (Linares and Perez-Arriaga, 2009; Zhou et al., 2019). A perfect financial system can allocate resources to technologically advanced production factors through resource allocation function to improve resource utilization (Shahbaz et al., 2013). Financial support is the basis for enterprises to carry out energy-saving and emission reduction technology R&D, which has the characteristics of high investment, high risk, long cycle and difficult supervision. Therefore, advanced information screening technology, flexible and convenient financing methods, and broad financing channels will help enterprises invest in clean energy, low-carbon technology, energy conservation, and emission reduction projects. Through empirical analysis of the relationship between green growth, technological progress, and the financial sector in Italy, Paroussos et al. (2020) found that the loan interest rate will affect enterprises’ investment in technological innovation. When families and enterprises can continuously obtain low-cost financing, it can effectively and quickly promote technological innovation and further benefit Italy’s economy from low-carbon transformation, and it can increase the GDP growth rate of 1.3% every year. However, some scholars believe that the relationship between technological progress and green growth is not significant. For example, Yi et al. (2020) employed the provincial data in China and conducted an empirical study using the system GMM method and found that due to the energy rebound effect, energy-saving technological progress can not effectively reduce haze pollution.
Based on the above literature, it seems that digital financial inclusion can affect the relationship between technological progress and green growth from three dimensions. First, digitization: efficient information screening technology reduces investment risk by reducing information asymmetry. Second, financial scale: stronger environmental information disclosure ability and audit standards guide enterprises to invest more capital in green technology R&D so as to promote green growth guided by technological progress. Third, inclusion: digital financial inclusion not only improves the efficiency of users’ access to financial services from the time and space level but also reduces the financing threshold, thus alleviating the financing constraints of users in the long tail” market. In 2016, the People’s Bank of China issued the G20 Advanced Principles of Digital Financial Inclusion, and the concept of digital financial inclusion was officially put forward. Digital financial inclusion is the combination of Digitization + Finance + Inclusion. On the one hand, the emergence of modern information technologies has gradually made market information open and transparent, reduced transaction costs and information search costs of financial factors and enterprises, thus alleviating the financial friction caused by the information asymmetry and reducing the non-performing loan ratio. On the other hand, the application of digital technology simplifies the loan approval process of financial institutions, and the business process is simplified into one-stop and all-round services (World Bank 2014; Demertzis et al., 2018), breaking the time and space constraints and improving the efficiency of financial services (Laeven et al., 2015). Therefore, digital financial inclusion may be the tool to break through the ”2:8 law” of traditional finance and provide high-quality services for long-tail customers, and thus becomes a strong supplement to traditional finance. Digital financial inclusion will include more SMEs in the financing basket, reduce the credit threshold, and provide assistance for their equipment and technology upgrading to lead to technological progress (Cheng, 2014; Xu et al., 2018).
Yang et al. (2021) analyzed the impact of digital financial inclusion on the technological innovation of small and micro-enterprises. The results show that digital financial inclusion significantly promotes the technological innovation of small and micro enterprises, especially in small-scale enterprises and enterprises not in the park. Based on the panel data of 280 prefecture-level cities and above in China from 2011 to 2018, Xu et al. (2021) used the digital financial inclusion index of Peking University to build an econometric regression model found that the promotion effect of digital financial inclusion on high-quality economic development is mainly reflected in the improvement of technology progress index, especially the significant improvement of green technology progress. Therefore, digital financial inclusion improves overall technological progress by alleviating the financing constraints of SMEs, thus promoting green growth. Considering the above points, this paper proposes hypothesis 1: with digital financial inclusion as the threshold variable, there is a U-shaped nonlinear relationship between technological progress and green growth.
3.2 The Threshold Effect of Green Growth on the Floating Population With the Threshold of Digital Financial Inclusion
According to the definition of Organisation for Economic Co-operation and Development (OECD), green growth refers to promoting economic growth and development while ensuring that natural assets can continue to provide various resources and environmental services for human happiness. The population is the basic composition of a city and the main body of urban construction and economic development. In China, the floating population once provided a huge ‘demographic dividend” for urban technological progress and wealth creation (Abowd and Freeman, 2007; Zhao et al., 2021b). The floating population usually has a high level of education and strong bargaining power (Xu et al., 2019; Gu et al., 2020). The ‘push-pull” hypothesis is one of the famous theories to explain the migration mechanism of population mobility (Hao et al., 2020). The push-pull migration model emphasizes that on the premise of freedom of movement, the population can improve its quality of life through migration (Lee, 1966). According to the theory, factors such as socio-economic, environmental, political, and public service level among floating population areas are important variables for a population to determine migration (Mayda, 2010). The pulling force is the factor that mainly comes from the increase of settlement intention in the destination city, and the driving force is the factor that mainly comes from the decrease of settlement intention in the source city (Zhao et al., 2021b). In this turbulent green transition period, a part of economic output peels off with the decoupling of environmental pollution and economic growth. Therefore, does the floating population associated with this part of economic output also decrease?
Some Chinese scholars have studied the impact of floating population on the economy and the ecological environment. For example, Zhang and Zhang (2009) put forward the concept of ‘green demographic dividend” by studying whether demographic dividends will cause environmental problems. In order to reduce the environmental cost contained in the demographic dividend, they designed a model that can adjust the ‘demographic dividend” to ‘green demographic dividend” by using the Hartwick Solow model framework and the production function of the neoclassical optimal growth model. In addition, based on the panel data of Shanghai from 2000 to 2014, Huang. (2019) studied the relationship between annual population mobility, industrial structure change and green GDP by using structural vector autoregressive (SVAR) model. The results show that in the short term, population mobility may inhibit the growth of green GDP but this impact will gradually disappear with the passage of time because population mobility causes change to industrial structure. However, although these scholars consider that the demographic dividend may include environmental costs, they do not consider that green growth may also include the cost of demographic dividend. Some scholars have studied the impact of environmental quality on floating population. For example, Zhao et al., (2021b) based on the CMDS 2017 in China used a logical model to study the relationship between the settlement intention of floating population and PM2.5 concentration, and the results show that the willingness of floating population to settle down decreased with the increase of PM2.5 concentration. However, few scholars comprehensively study the impact of economic growth and environmental quality on the floating population. With the improvement of green growth level, the demographic dividend gradually decreases. Whether there is a connection between the two is uncertain.
In order to achieve green economic growth, the state has promulgated a series of environmental regulation policies to promote the sustainable development of ‘people-centered” to the ‘natural-centered” sustainable development (Zhang et al., 2018). This is to thoroughly implement the idea of ‘Lucid waters and lush mountains are invaluable assets”, which has been proposed by President Xi Jinping. However, in this process, in order to minimize compliance costs and maximize benefits, some enterprises choose industrial ‘cross-border transfer” (Cai et al., 2020) and transfer industries to areas with more national preferences and lower environmental regulation costs (Ye et al., 2021). Some scholars have found that China’s heavy polluting enterprises tend to transfer to central and Western China (Du et al., 2021). However, the population in the central and western regions is large, the level of education is low, and those regions are the main outflow areas of population, mainly flowing to the economically developed areas in the east. Therefore, the movement of heavily polluting industries to the inland of the central and western regions may curb the flow of some populations with low education levels and bind each other, but high-quality talents will still flow out. In addition, green growth may also affect the floating population by affecting the employment environment. According to the annual operating income, SMEs are divided into medium-sized enterprises (with an annual operating income of more than 5 million), small enterprises (with an annual operating income of 1.2 million to 5 million), and micro-enterprises (with an annual operating income of less than 1.2 million) contributing more than 80% of urban jobs in China (Huang, 2019).
According to the survey data of China Family Finance Survey and Research Center of Southwest University of Finance and economics in 2020, the number of these three types of enterprises accounts for 11%, 17%, and 72% respectively. The proportion of employed persons absorbed by these three types of enterprises was 37%, 22%, and 41% respectively. Micro enterprises mainly affect employment through enterprise exit and entry. Among microenterprises, enterprises that plan to stop operation or have stopped operation account for 25%. Among medium-sized enterprises, 23% plan to lay off staff or have laid off staff. It can be seen from the above data that micro-enterprises absorb more employees, but they are greatly impacted by the changes of market demand, environmental regulation and financing constraints. Especially for micro-enterprises, the financing is more difficult, the enterprise is younger, and the education level of employees is low. Therefore, environmental regulation will squeeze the production cost of enterprises, prolong the growth cycle of enterprises, reduce employment positions, and the employees with low education levels have poor mobility in a short period in the environment of narrow financing channels. However, the “inclusive” and “preferential” characteristics of digital finance make SMEs in the financial long-tail market improve their advantages in obtaining credit (Banerjee et al., 2015) and digital financial inclusion is positively correlated to corporate innovation and job creation (Ayyagari et al., 2008). Boustanifar (2014) used United States credit reform from 1970 to 1990 as a quasi-experiment, arguing that financial restrictions had a huge impact on employment in labor-intensive industries.
To sum up, green growth mainly affects population mobility through natural environment quality, industrial transfer and the employment environment. Todaro established the theory of population mobility applicable to developing countries. He explained the migration between rural and urban areas, unemployment and environmental damage and he believes that the fundamental reason affecting population mobility is economic factors. The floating population will weigh the pros and cons to make decisions and look forward to optimizing Pareto efficiency in the spatial economy (Epple et al., 1978; Banzhaf and Walsh, 2008). The push of the outflow area and the pull of the inflow area jointly induce the flow behavior of the population. However, digital financial inclusion may affect the relationship between green growth and floating population through three dimensions. First, digitization: digital financial inclusion improves the self-education investment of the low-level population in the central and western regions through the convenience of the internet, so as to enhance their own floating capital. In addition, it also provides financial support for the innovation and reform of heavily polluting enterprises in the central and western regions. Secondly, financial scale: digital financial inclusion provides financial resources for SMEs in green transformation and led the funds to labor capital, avoiding the shrinkage of the labor market under the pressure of environmental regulation. Finally, inclusive: digital financial inclusion provides more flexible and broad financing channels for SMEs, reduces the risk of SMEs in the process of green transformation, and thus avoids the impact of enterprise exit from the market on the pull of floating population. Based on one belt, one road (B&R) data from 40 countries from 2010 to 2018, Geng and He (2021) adopted instrumental variable method to explore the impact of digital finance on sustainable employment in B&R countries. The results show that digital financial inclusion promotes private enterprises and individuals to have more funds to manage their business and recruit more employees by scale effect. On the other hand, digital financial inclusion provides such marginalized groups with financing channels, improves financing convenience and reduces financing threshold, so as to provide support for their education investment, enable these groups to return to the market after upgrading, increase market vitality and realize the transformation and upgrading of labor force. Based on the above study, this paper provides hypothesis 2 under the influence of digital financial inclusion, there is a U-shaped nonlinear relationship between green growth and floating population.
Based on the above literature, the research gaps highlighted in this paper are as follows: firstly, many scholars have measured technological progress and found that it has positive significance for environment production and economic growth. However, few scholars have studied how to make the technological progress effectively promote green growth from the perspective of digital financial inclusion; secondly, although many scholars have studied the influencing factors of green growth and found that green growth has a crowding-out effect on economic output, few scholars make sure if green growth also inhibits the floating population in the short special transition period which may cause the loss of demographic dividends. This helps to explain the relationship between green development and the temporary decline of growth, as well as the crowding-out effect of demographic dividends caused by floating population in the period of green economic transformation. Thirdly, at present, few scholars put technological progress, green growth and floating population in the same framework and investigate the intermediary effect of digital financial inclusion. Figure 3 provides the framework of this study.
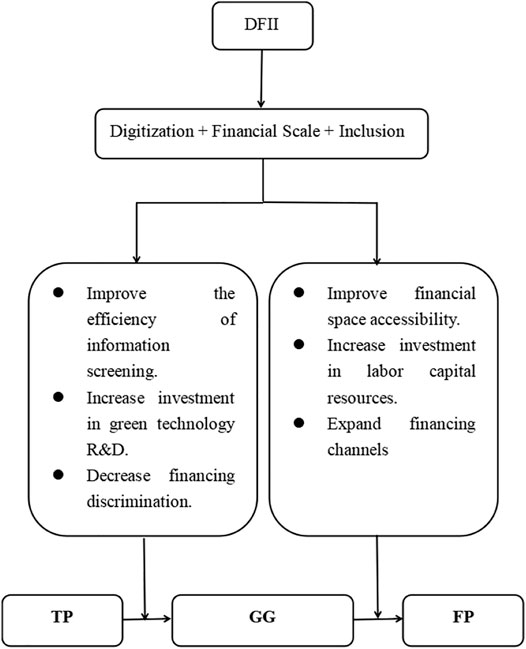
FIGURE 3. The research framework. DFII=Digital Financial Inclusion Index; TP=Technological Progress; GG=Green Growth; FP=Floating Population.
4 Methodology
4.1 Model Specification
In order to investigate the threshold effect of technological progress (TP) on green growth (GG) and the threshold effect of green growth (GG) on floating population (FP), this study constructs the following dynamic threshold regression models according to Seo et al. (2019) and the research of Bolarinwa et al. (2021).
In Eq. 1, to investigate the nonlinear relationship between technological progress (TP) and green growth (GG) under the influence of digital financial inclusion (DFII), this research constructs a dynamic threshold panel regression model.
In Eq. 2, for further study, the nonlinear relationship between green growth (GG) and floating population (FP) under the influence of digital financial inclusion (DFII), based on the above model, this paper replaces the explained variable with (FPit) and the core explanatory variable with (GGit), and constructs a dynamic threshold panel regression model. Control variables Xit includes ER (Environmental Regulation), MAR (Market processes), IND (Industrialization), URB (Urbanization), FDI (Foreign Direct Investment).
4.2 Model Estimation Method
This study takes digital financial inclusion as a threshold variable to study its intermediary effect on technological progress and green growth, green growth, and floating population. Due to the endogeneity between digital financial inclusion and explanatory variables being fully considered, the traditional static model is not suitable for this study. However, the model of Hansen 1999) requires the covariates to be strongly exogenous to keep the estimator to be consistent so it is not appropriate to be used in our research. Thus, it is necessary to extend our research to the dynamic panel model with an endogenous threshold variable. The dynamic model allows lagged dependent variables and endogenous covariates. This study adopts the dynamic panel threshold model of Seo et al. (2019), which is based on the dynamic threshold model of Seo and Shin (2016). Seo et al. (2019) developed commands for the first-differenced generalized method of moments (GMM) estimators and the associated asymptotic variance estimator that are proposed by Seo and Shin (2016), as well as linearity testing for the presence of a threshold effect.
Compared to command xthreg, this command xthenreg produces consistent and asymptotically normal estimates. Seo et al. (2019) proposed a bootstrap algorithm to do the linearity test, which is faster than the nonparametric independent and identically distributed bootstrap that was originally proposed by Seo and Shin (2016). The linearity test is able to demonstrate the validity of the nonlinear relationships. Furthermore, Seo et al. (2019) used a constrained GMM estimator to reflect the kink restriction. Although the general threshold model is able to represent the discontinuity of the regression function, this may be a kink phenomenon rather than a real jump. However, after adding the kink option, although the empirical results can report the threshold value and the total regression results, they cannot report the value of the coefficients of the explanatory variables before and after the threshold value. Therefore, removing the kink regression can obtain the coefficient changes of the all explanatory variables around the threshold value. In addition, the end of the command xthenreg can distinguish between static or dynamic models by adding or removing the static option. In conclusion, this command can not only test the effect of nonlinear relationships but also avoid the kink phenomenon and is simpler than other regression models.
4.3 Variable Specification
Technological progress is difficult to be measured directly. Some scholars measure technological progress through the number of patents, total factor productivity and R&D investment (Keller, 2010; Yang et al., 2021), but the marginal substitution rate between factors cannot distinguish between input and output, which is biased towards technological progress. Technological progress can affect total factor productivity by increasing factor marginal productivity and changing factor marginal substitution rate, so as to move the equal product curve to the origin. Therefore, in order to obtain the technological progress index, we can first measure the total factor productivity. According to the DEA - Malmquist index method proposed by Färe et al. (1994), this paper calculates the total factor productivity (TFP) and further decomposes it into technical efficiency change (EFFCH) and technical change (TECH). However, this decomposition does not distinguish between neutral technological progress and biased technological progress. Based on another decomposition method of Malmquist index, Färe et al. (1997) decomposes technology change index (TECH) into technology scale change (NTP), output biased technological change (OBTP) and input biased technological change (IBTP). Among them, the NTP represents the translation of the production frontier, namely, neutral technological progress. OBTP denotes the enhanced effect of technological progress on different proportions of output in the case of multiple output. IBTP measures the change of marginal substitution rate of different input factors by technological progress, indicating that the biased technological progress of input factors has further improved TFP on the basis of equal proportion saving of factors. However, OBTP and IBTP do not give the bias of technological progress between different factors. Therefore, it can only measure the biased technological progress of input or output, and cannot represent the factor biased technological progress. Therefore, this paper only uses OBTP and IBTP to represent technological progress and conduct impact analysis. This paper uses MaxDEA software to calculate the index.
First, the input-oriented distance function is defined according to the Shephard (2012), and the reciprocal is the ratio of the minimum input elements to the actual input elements required for a given output, which is a measure of technical efficiency. For a set of non-negative input factors and non-negative output factors during the t period is supposed as follows:
Then the Input requirement set in the t period represents the feasible portfolio of input required for output during this period, expressed as:
The equal product curve represented by the input demand set are defined as follows
The Shephard input distance function in the t period can be defined as:
Under the input orientation, according to Färe et al. (1994), Malmquist total factor productivity index (MI) is defined on the basis of constant return to scale (Lovell, 2003)
The MI index is then further decomposed into the technical efficiency index and the technical change index as:
According to Färe et al. (1997), further decompose the technological change into Neutral technological progress (NTP), output biased technological progress (OBTP) and input biased technological progress (IBTP).
Table 1 Provides the composition of total factors (TP). This study not only introduces economic indicators into input-output factors, but also considers environmental indicators, so as to measure technological progress more comprehensively.
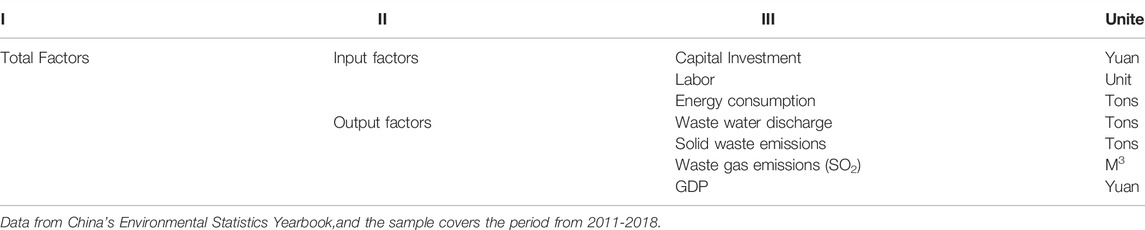
TABLE 1. The composition of total factors (TP).
Green growth
According to the OECD, green growth means promoting economic growth and development while ensuring that natural assets can continue to provide various resources and environmental services for human happiness. This paper uses the comprehensive index calculated by Cao et al. (2021) based on entropy weight method (EWM). Table 2 presents the composition of Green growth (GG).
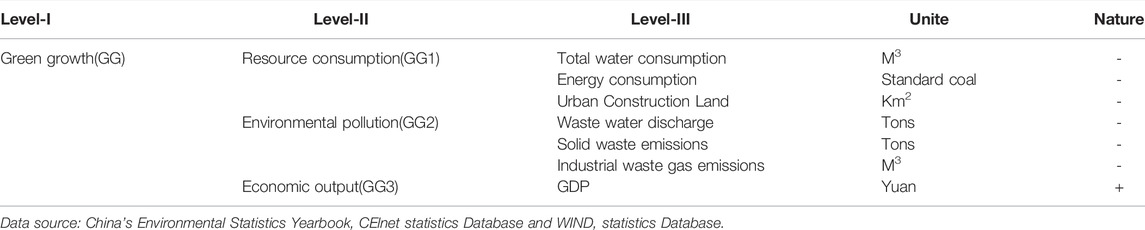
TABLE 2. The composition of Green growth (GG).
Floating Population
China’s unique registered residence system has three indicators for measuring the absolute size of the population: registered residence, permanent residents and floating population. Among them, the floating population is the difference between the resident population and the household registration population.
Core Explanatory Variables
Digital Financial Inclusion Index
This paper uses the digital financial inclusion index of 30 provinces in China from 2011 to 2018 released by the Internet Financial Development Research Center of Peking University as the sample data. This indicator includes three indicator dimensions: breadth index (Account coverage rate), depth index (Payment, Money Funds, Credit (Individual User, Small and Micro Business), Insurance, Investment, Credit Investigation), digitization index (Mobility, Affordability, Credit, Convenience) (Guo et al., 2020; Xu et al., 2021).
Control Variables
HC (Human capital) is an important factor to promote technological progress and green economic transformation, as well as the basic driving force to promote population mobility, and it is measured by the years of education per capita (Law and Singh, 2014). The improvement of MAR (Market process) is conducive to the transformation of economic development model, promote technological progress, promote the upgrading of industrial structure, and thus affect green growth. In addition, the acceleration of MAR will also enhance the competition in the labor demand market, so as to improve the labor mobility rate in the market. MAR uses the proportion of private sector employees in the total number of employees to measure (Lin and Zhu, 2019). ER (Environmental regulation) is calculated by the ratio of total investment in industrial pollution control to industrial added value (Xie and Liu 2019). ER can restrict the environmental pollution behavior of economic subjects through national policies and regulations, promote the development of green economy, and affect the flow of population by improving the ecological environment quality of residents’ life. URB (urbanization) is expressed as the ratio of urban population to total population (Charfeddine and Khediri, 2016). Urbanization promotes the agglomeration of capital, advanced technology and talents to central cities. High technology improves the convenience of cities, but the high density of population leads to the decline of urban air quality, and the economic development of rural areas is affected by the lack of production factors. IND (Industrialization) is the share of industrial sector added value in GDP (Yue et al., 2018). For a long time, traditional industrial production models have intensified energy consumption and caused ecological environment deterioration. FDI (foreign direct investment) is conducive to expanding the financial scale and providing more financing channels for market subjects, especially for high productivity economic subjects, thus affecting technological progress, green growth and floating population. FDI is measured by Capital directly invested by foreign investors. Table 3 presents the descriptive statistics of the research.
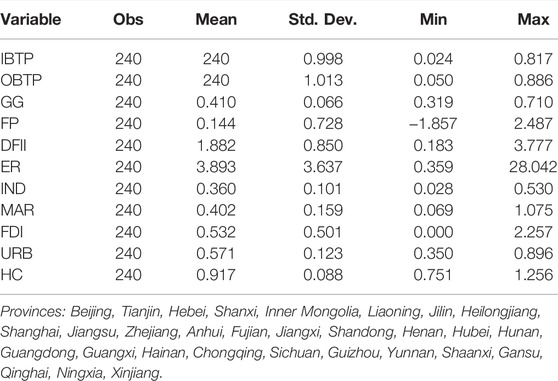
TABLE 3. Descriptive statistics of variables.
4.4 Data Source
This paper collected data from 30 provinces in China from 2011 to 2018 sourced mainly from the National Bureau of Statistics, China Statistical Yearbook, China Economic and Social Development Statistics Database, CElnet statistics Database and WIND Database. All regressions employed stata16.0 software.
Table 4 specifically describes the data used in this paper, not only summarizing the calculation method but also labeling the data sources.
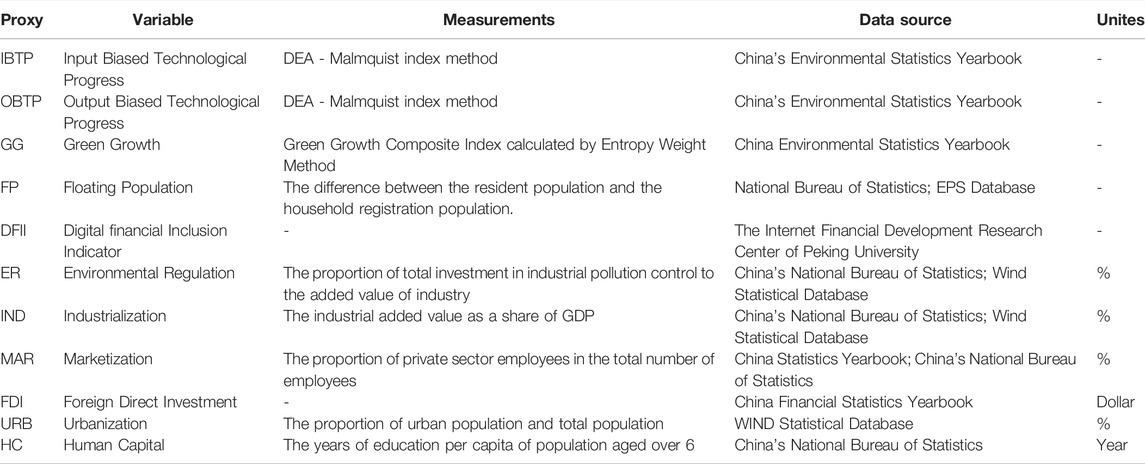
TABLE 4. Variable specification.
5 Result Analysis
Table 5 shows the results of the correlation test. The findings show that digital financial inclusion (DFII) is positively correlated with input biased technological progress (IBTP), output biased technological progress (OBTP), green growth (GG) and floating population (FP). Table 6 reports the result of Eq. 1. Based on the dynamic threshold regression model, this paper studies the nonlinear relationship between technological progress (TP) and green growth (GG) with the digital financial inclusion (DFII) as the threshold variable. The results show that there is a U-shaped nonlinear relationship between input biased technological progress (IBTP) and green growth (GG). This result supports. hypothesis 1: with the digital financial inclusion as the threshold variable, there is a U-shaped nonlinear relationship between technological progress and green growth.
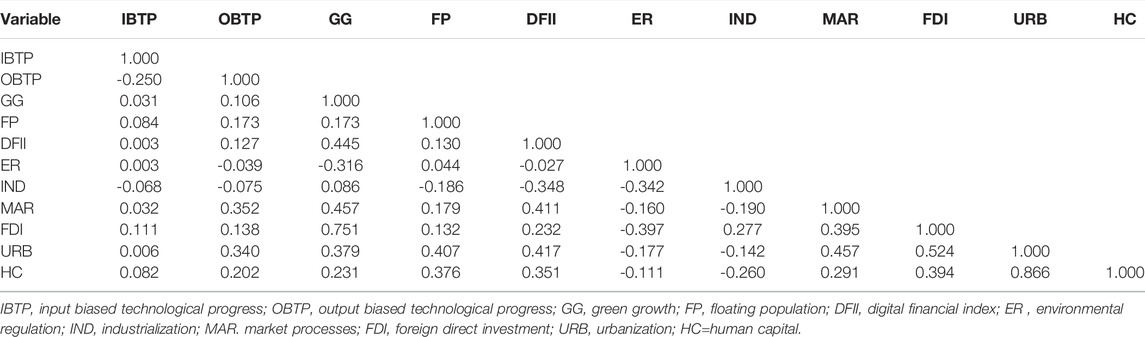
TABLE 5. Results of correlation test.
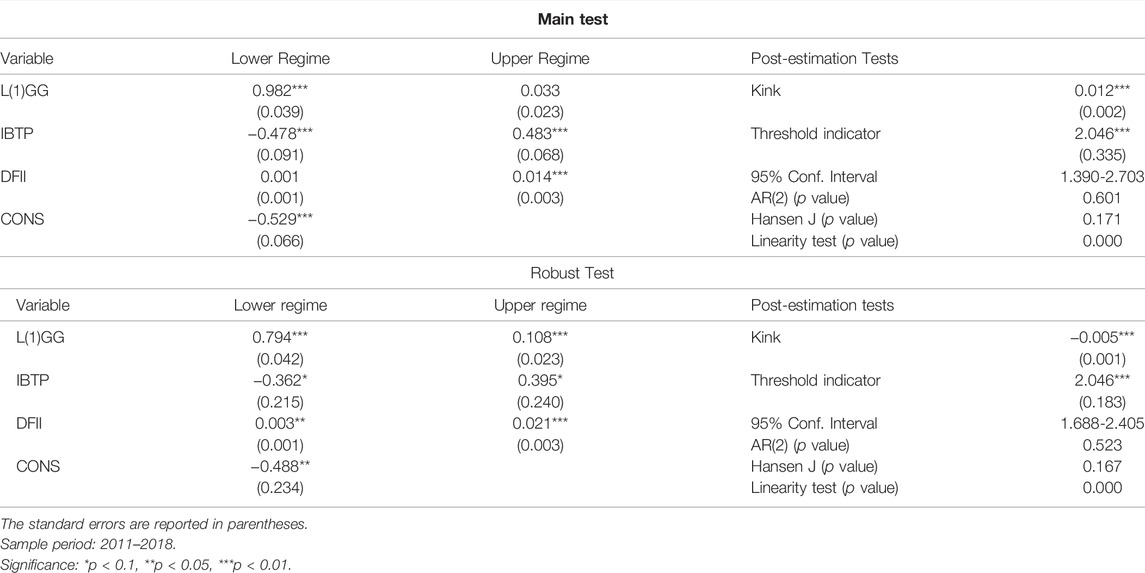
TABLE 6. Results for the threshold effect of input biased technological progress (IBTP) on green growth (GG).
The lower threshold semi-elasticity coefficient of IBTP is (−0.478∗∗∗) and the upper threshold semi-elasticity coefficient is (0.483∗∗∗). The threshold value is 2.046∗∗∗, significant at the 1% level. This means that when the development level of digital financial inclusion (DFII) is lower than 2.046, input biased technological progress (IBTP) will significantly inhibit green growth, and when it is higher than 2.046, it will significantly promote green growth. Meanwhile, the kink value is 0.012∗∗∗, which is also significant at the 1% level, indicating that there is no kink in the nonlinear relationship. The p-value of AR(2) rejected the null hypothesis that there is no autocorrelation between the lag phase of the dependent variable and the random error term, which justified the use of a dynamic model in this study. Furthermore, the p-value of Hansen test verified that the model had no instrumental variable over-recognition. The p-value of linearity test is significant at the level of 1%, indicating that the nonlinear relationship is effective. In addition, the robustness of the model is tested by adding control variables (ER).
China’s traditional financial system has long been imperfect, underdeveloped, unbalanced in terms of supply and demand, as well as riddled with other structural problems. Constrained by the scarcity of financial resources, the financing environment of the real industry is squeezed so that the real innovative market sector lingers on the edge of the market under the financing constraints (Yang et al., 2021c). In the stage of low development level of digital financial inclusion, problems such as small users, more network security problems and narrow basket of financial products have limited the full play of the “digital” and “inclusive” functions of digital financial inclusion. At the same time, the traditional financial sector has a low financing threshold for SOEs, and most of these enterprises are resource-based enterprises, with low innovation capacity, high energy consumption and high pollution emissions (Lin and Zhu, 2019; Cao et al., 2021). However, SMEs mainly with equity financing account for a high proportion of the total number of enterprises in the market and have strong innovation ability, but the financing environment has been squeezed from the primary market to the secondary market. At the same time, green innovation activities have the characteristics of higher investment, higher risk, longer cycle and greater uncertainty, so the technological progress of enterprises is mainly towards labor and capital and the technological progress of energy also aims to reduce the production cost of enterprises, improve the marginal output of factors, so as to improve the income through the scale effect (Wang and Song, 2017). Therefore, in the low level of digital financial inclusion, technological progress will inhibit green growth. With the acceleration of China’s marketization process, there are more and more industries entering the market. China’s traditional financial institutions, as one of the main bodies of maintaining stability of economy, cannot effectively reduce risk control costs to compete for “niche” market share with internet enterprises. This is also the best time for internet enterprises to seize the tail market. However, the state will still properly control internet enterprises for the sake of maintaining stability. Digital finance is a new generation of financial services that combines internet, big data, cloud computing, blockchain and information technology means with traditional financial service formats (Lee and Shin, 2018), which is undoubtedly a mutually beneficial operation for financial institutions and internet enterprises (Banerjee et al., 2015). As an important supplement to the traditional financial system, digital financial inclusion has many advantages such as “wide coverage, low cost and high efficiency”. To a certain extent, it can promote the development of the financial industry, help to alleviate the financing constraints of green innovation, and is of great significance to promote the progress of technology to led green growth. Therefore, with the popularization of the internet, the improvement of network security technology, and the gradual improvement of big data, cloud and blockchain technology, the inclusive level of digital finance has gradually increased, so that it can make up for the deficiency of the traditional financial system from the three dimensions of “digitization + financial scale + inclusion” (Guo et al., 2020). The improvement of digital technology alleviates financial friction and reduces the cost of risk control. In addition, digital financial inclusion guides enterprises to increase green development oriented technology R&D investment by obtaining more public environmental information from enterprises (Xu et al., 2021). In addition, digital financial inclusion has a wider range of inclusive service objects, diversified products, more flexible service forms, more convenient services, breaking the limitations of time and space. Therefore, in the stage of high level of digital financial inclusion, technological progress will promote green growth.
Table 7 also reports the result of Eq. 1. The results show that there is a significant U-shaped nonlinear relationship between output biased technological progress (OBTP) and green growth (GG). The lower threshold semi-elasticity coefficient of OBTP is (-0.139***) and the upper threshold semi-elasticity coefficient is (0.171***). Therefore hypothesis one is confirmed: with the threshold variable of digital financial inclusion, there is a U-shaped nonlinear relationship between technological progress and green growth. The threshold value is 2.080***, and is significant at the 1% level. This means that when the development level of digital financial inclusion (DFII) is lower than 2.080, output biased technological progress (OBTP) will significantly inhibit green growth, and when it is higher than 2.080, it will significantly promote green growth. Meanwhile, the kink value is 0.020***, which is also significant at the level of 1%, indicating that there is no kink in the nonlinear relationship. The p-value of AR 2) supports the null hypothesis that there is no second-order sequence correlation in the equation. Therefore, it is reasonable to use the dynamic model in this study. In addition, the p-value of Hansen test verifies that there is no over-recognition of instrumental variables in the model. The p-value of Linearity test is significant at 1%, indicating that this nonlinear relationship is valid. This paper tests the model for robustness by increasing the control variables (ER).
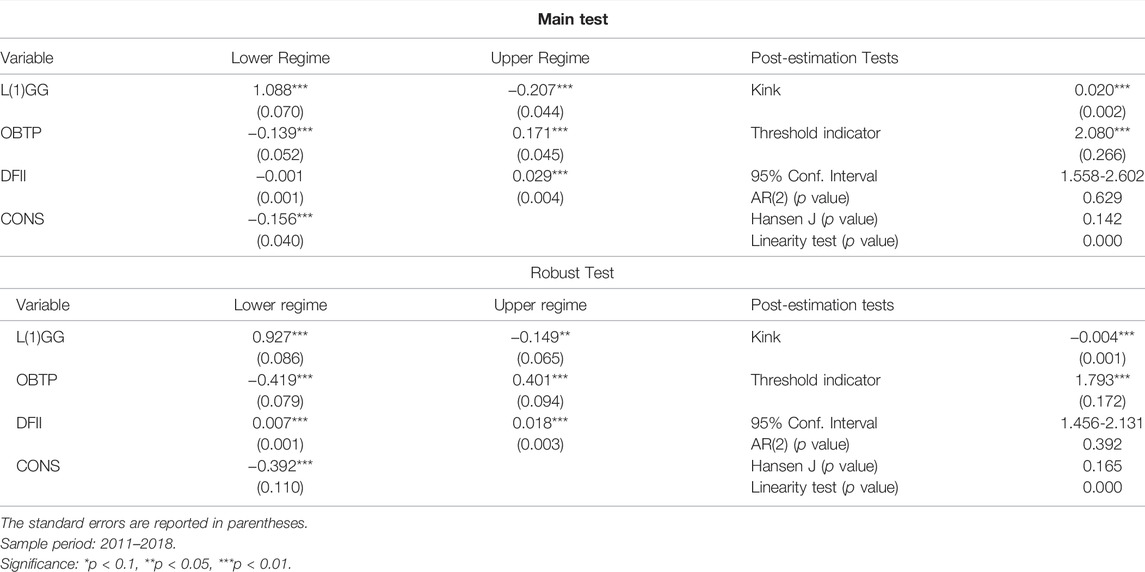
TABLE 7. Results for the threshold effect of output biased technological progress (OBTP) on green growth (GG).
By comparing the semi-elastic coefficients of IBTP and OBTP in Table 6 and Table 7, this paper found that OBTP has less effects on GG than IBTP on GG. In addition, in Table 6, the threshold value of DFII is 2.046, while in Table 7, the threshold value of DFII is 2.080, which means that the output biased technological progress needs more support from digital financial inclusion, and then the technological progress can significantly promote green growth. The main reason is that the composition of input factors and output factors is different. The input factors are mainly composed of capital input, labor input and energy consumption, while the output factors are mainly composed of GDP, wastewater discharge, solid waste discharge and waste gas discharge (Yang et al., 2021b). Input biased technological progress promotes green growth by continuously adjusting the proportion of capital investment, labor investment and energy consumption, that is, while GDP increases, energy consumption and pollution emissions decrease. Output biased technological progress promotes green growth by increasing GDP and reducing pollution emissions. However, for enterprises, compared with input biased technological progress, output biased technological progress requires a lot of R&D funds to reduce pollution emissions, so the investment is higher, the risk is greater and the investment cycle is longer (Yang and Zhang, 2020). The technological progress of capital investment, labor investment and energy investment can more directly reduce the production cost and improve the production efficiency. Therefore, in promoting green growth, the leverage of digital financial inclusion on input biased technological progress is slightly stronger than output biased technological progress, so more financial support is needed to promote the positive effect of output biased technological progress on green growth. In addition, Zeraibi et al. (2020) also shows that technological innovation has a positive effect on economic growth. Therefore, the financial sector’s financial support for technology R&D will amplify the positive effect of technological innovation on the green economic growth guided by technological progress.
Table 8 provides the regression results of Eq. 2. This section studies the nonlinear relationship between green growth (GG) and floating population (FP) under the influence of digital financial inclusion (DFII). The findings show that there is a U-shaped nonlinear relationship between green growth (GG) and floating population (FP). The lower threshold semi-elasticity coefficient of GG is (−7.015∗∗∗) and the upper threshold semi-elasticity coefficient is (6.332∗∗∗). The threshold value is 1.220∗∗∗, and is significant at the 1% level. This means that when the development level of digital financial inclusion (DFII) is lower than 1.220∗∗∗, green growth (GG) will significantly inhibit the floating population (FP), and when it is higher than 1.220∗∗∗, it will significantly promote the floating population (FP). This result supports the hypothesis 2: there is a U-shaped nonlinear relationship between green growth and floating population with the digital financial inclusion as the threshold variable. Kink value is -0.127∗∗∗, which is also significant at the significance level of 1%, indicating that there is no kink in the nonlinear relationship. The p-value of AR 2) supports the null hypothesis that there is no second-order sequence correlation in the equation. Therefore, it is reasonable to use the dynamic model in this study. Furthermore, the p-value of Hansen test verified that the model had no instrumental variable over-recognition. The p-value of Linearity test t is significant at 1%, indicating that this nonlinear relationship is valid. To test the robustness of the results, we test the robustness of the model by increasing the control variables (HC).
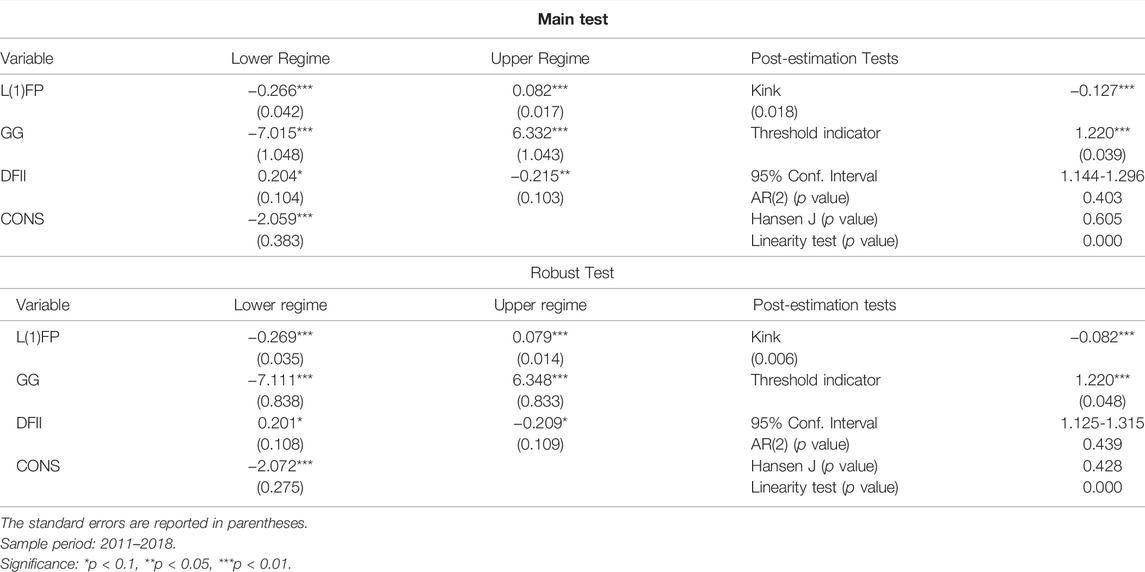
TABLE 8. Results for the threshold effect of green growth (GG) on floating population (FP).
Since 1949, the dramatic changes in the spatial distribution of China’s population with a 200 million strong floating population has created a huge demographic dividend and accelerated the process of urbanization, which is an important factor affecting China’s economic and social development. However, in recent years, the demographic dividend is gradually weakening due to the slowdown of population growth and the reduction of the total population of people of working age. In addition, in the process of realizing the green transformation of the economy, heavy polluting industries have shifted to the central and western regions, the employment carrying capacity of SMEs has decreased, and some enterprises have closed down under the pressure of environmental regulation (Zhang et al., 2018). These factors may reduce the number of floating population, which may reduce the demographic dividend. Therefore, green growth may also include the cost of demographic dividend. However, in the final analysis, the above reasons are economic factors, so the green transformation of enterprises is inseparable from financial support. On the one hand, financial support helps to increase the total number of floating population by alleviating enterprise financing constraints. On the other hand, financial support can improve the floating population’s floating capital by improving their education level, so as to promote the transformation of ‘demographic dividend” into ‘talent dividend”. The results of Ahmad et al. (2021) also show that digital financial inclusion and human capital have a positive impact on economic growth. The traditional financial sectors in the central and western regions are scattered and have a credit preference for large SOEs. In addition, the central and western regions are densely populated and have low education level. Therefore, the potential outflow population with low education level can easily be absorbed into the local heavily polluting large enterprises so as to reduce the number of the floating population. In addition, environmental regulation forces enterprises to increase compliance costs, thus squeezing production costs. Therefore, enterprises may reduce jobs, reduce employees’ labor remuneration or reduce employees’ training time so as to reduce the pull of destination on the floating population. Moreover, some micro-enterprises or enterprises with extremely serious energy consumption and pollution may fail to afford the cost of environmental regulation, thus directly reducing jobs and making them less attractive to the floating population in the outflow area (Zhang et al., 2018). In the lower level of digital financial inclusion, the floating population and SMEs are strongly constrained by the traditional financial system, which intensifies the inhibitory effect on the floating population in the process of green economy transformation (Huang, 2019). In the higher level of digital financial inclusion, the further improvement of network security technology has increased the number of users. Advanced digital technology breaks the time and geographical restrictions, making it easier for more floating population and SMEs to obtain financial resources, so as to provide financial support for their own education investment and enterprise labor capital investment. Finally, it not only improves the floating capital of population, but also improves the ability of enterprises to hold the floating population so as to improve the population mobility and create conditions for the creation of “talent dividends’’.
According to the above empirical results, digital financial inclusion is an important tool to dredge the green growth path. The development of digital technology is an important factor to accelerate China’s economic development and transformation. At the same time, the combination of Finance and digital technology can not only improve the positive effect of technological progress on green growth, but also provide a stronger driving force for population flow in the green transformation stage of the economy so as to promote the efficient development of green economy and accelerate green growth. This study’s conclusion is supported by Shehzad et al. (2021). In addition, referring to Balsalobre-Lorente et al. (2021), innovation is an important magic weapon to promote sustainable economic development, and the digitalization and inclusion of finance are one of the innovative forms in the process of transformation and upgrading of China’s traditional financial industry.
6 Conclusion and Policy Recommendations
In order to dredge the green growth path from the front-end and back-end, based on the panel data of 30 provinces in China from 2011 to 2018, this paper empirically studies the nonlinear relationship between technological progress (TP) and green growth (GG) and the nonlinear relationship between green growth (GG) and floating population (FP). This study provides new reference evidence for accelerating the transformation of China’s economy to green growth mode, which is conducive to solving the pain points in the implementation of green development strategy and dredge the path of green growth. The results show that: first, the effect of technological progress (TP) on green growth (GG) shows a U-shaped nonlinear relationship with the threshold variable of digital financial inclusion (DFII); second, green growth (GG) and floating population (FP) show a U-shaped nonlinear relationship under the influence of digital financial inclusion (DFII); third, the output biased technological progress needs more support from digital financial inclusion than input biased technological progress then can significantly promote green growth.
Combined with the above research results, this paper provides the following policy recommendations: first, the state should promote in-depth cooperation between traditional financial factors and the internet industry, and jointly develop the financial long tail market so as to improve the credibility of internet enterprises and reduce the risk index, as well as to increase the service efficiency of traditional financial factors. Moreover, traditional financial factors should make full use of digital information technology to improve the ability of information screening, so as to reduce the cost of risk control, promote the rational allocation of financial resources and guide the normalization of financing channels in the tail market. Second, China should emphasize the development of green digital financial inclusion and guide the flow of funds to the green technological R&D of enterprises. In particular, more preference and support should be given for R&D activities including technologies to reduce pollution emissions. Third, in the transition period, the potential cost of demographic dividend of green growth should be paid attention to because green development will not only produce the temporary decline of part economic output, but may also lead to the crowding out effect of floating population. Although in the green transition period of China’s economy, there may likely be social unrest accompanied by the elimination of backward industrial models which increases the friction on the road to green growth, the inclusive digital finance enhances the financial sector’s ‘bottom-up” support for the SMEs and the floating population in the transition period from the technical and inclusive levels, so it plays the role of lubricant from the front to back end of the road to green growth. In short, in the green transformation stage of China’s economy, the state should formulate relevant policies to actively promote the digitalization and inclusion of finance and make full use of the role of finance in promoting green growth. Since China’s financial digitalization reform is still in its infancy, there are bound to be some stage problems. For example, the digitalization level of large financial institutions is significantly higher than that of small and medium-sized financial institutions, so the development of digital financial inclusion still has a long way to go. The national policy support for the digital reform of small and medium-sized financial institutions and the improvement of the innovation awareness of financial institutions themselves are the important factors to promote the development of digital financial inclusion.
However, this paper still has the limitation. First, this paper only studies the Chinese sample, but does not study the international sample, so future scholars can expand the research samples to other countries based on the research framework of this paper. Second, due to the limitation of data availability, the research interval of this paper only covers 8 years, so the time series of data can be added in future research to enhance the effectiveness of the results. Third, due to China’s vast territory and significant regional heterogeneity in political, economic, culture and natural resource endowments, this study can further test regional heterogeneity by dividing data, so as to promote the regional coordination of China’s green growth.
Data Availability Statement
The original contributions presented in the study are included in the article/Supplementary Material, further inquiries can be directed to the corresponding authors.
Author Contributions
JC: Writing—original draft, Supervision, Conceptualization, Methodology. XT: Project administration. DW: Software, Resources. SL: Writing—review and editing, Funding acquisition. XY: Formal analysis, Investigation, Validation.
Funding
This work was supported in part by the Ministry of Science and Technology of China under Grant 2020AAA0108400, in part by the National Natural Science Foundation of China under Grant 71825007, in part by the Strategic Priority Research Program of CAS under Grant XDA2302020.
Conflict of Interest
The authors declare that the research was conducted in the absence of any commercial or financial relationships that could be construed as a potential conflict of interest.
Publisher’s Note
All claims expressed in this article are solely those of the authors and do not necessarily represent those of their affiliated organizations, or those of the publisher, the editors and the reviewers. Any product that may be evaluated in this article, or claim that may be made by its manufacturer, is not guaranteed or endorsed by the publisher.
References
Ahmad, M., Majeed, A., Khan, M. A., Sohaib, M., and Shehzad, K. (2021). Digital Financial Inclusion and Economic Growth: Provincial Data Analysis of China. China Econ. J. 14 (3), 291–310. doi:10.1080/17538963.2021.1882064
Ahmed, A., Uddin, G. S., and Sohag, K. (2016). Biomass Energy, Technological Progress and the Environmental Kuznets Curve: Evidence from Selected European Countries. Biomass and Bioenergy 90, 202–208. doi:10.1016/j.biombioe.2016.04.004
Ali, W., Abdullah, A., and Azam, M. (2016). The Dynamic Linkage between Technological Innovation and Carbon Dioxide Emissions in Malaysia: an Autoregressive Distributed Lagged Bound Approach. Int. J. Energ. Econ. Pol. 6 (3), 389–400.
Ayyagari, M., Demirgüç-Kunt, A., and Maksimovic, V. (2008). How Well Do Institutional Theories Explain Firms' Perceptions of Property Rights? Rev. Financ. Stud. 21 (4), 1833–1871. doi:10.1093/rfs/hhl032
Bai, Y., Deng, X., Jiang, S., Zhang, Q., and Wang, Z. (2018). Exploring the Relationship between Urbanization and Urban Eco-Efficiency: Evidence from Prefecture-Level Cities in China. J. Clean. Prod. 195, 1487–1496. doi:10.1016/j.jclepro.2017.11.115
Baiardi, D. (2014). Technological Progress and the Environmental Kuznets Curve in the Twenty Regions of Italy. BE J. Econ. Anal. Pol. 14 (4), 1501–1542. doi:10.1515/bejeap-2013-0120
Balsalobre-Lorente, D., Zeraibi, A., Shehzad, K., and Cantos-Cantos, J. M. (2021). Taxes, R&D Expenditures, and Open Innovation: Analyzing OECD Countries. JOItmC 7 (1), 36. doi:10.3390/joitmc7010036
Banerjee, A., Duflo, E., Glennerster, R., and Kinnan, C. (2015). The Miracle of Microfinance? Evidence from a Randomized Evaluation. Am. Econ. J. Appl. Econ. 7 (1), 22–53. doi:10.1257/app.20130533
Banzhaf, H. S., and Walsh, R. P. (2008). Do People Vote with Their Feet? an Empirical Test of Tiebout's Mechanism. Am. Econ. Rev. 98 (3), 843–863. doi:10.1257/aer.98.3.843
Bolarinwa, S. T., Olayeni, R. O., and Vo, X. V. (2021). Is There a Nonlinear Relationship between Nonperforming Loans and Bank Profitability? Evidence from Dynamic Panel Threshold. Manage. Decis. Econ. 42 (3), 649–661. doi:10.1002/mde.3262
Boustanifar, H. (2014). Finance and Employment: Evidence from U.S. Banking Reforms. J. Banking Finance 46 (1), 343e354. doi:10.1016/j.jbankfin.2014.06.006
Cai, X., Zhu, B., Zhang, H., Li, L., and Xie, M. (2020). Can Direct Environmental Regulation Promote green Technology Innovation in Heavily Polluting Industries? Evidence from Chinese Listed Companies. Sci. Total Environ. 746, 140810. doi:10.1016/j.scitotenv.2020.140810
Cao, J., Law, S. H., Samad, A. R. B. A., Mohamad, W. N. B. W., Wang, J., and Yang, X. (2021). Impact of Financial Development and Technological Innovation on the Volatility of green Growth—Evidence from China. Environ. Sci. Pollut. Res., 1–17.
Cao, S., Nie, L., Sun, H., Sun, W., and Taghizadeh-Hesary, F. (2021). Digital Finance, green Technological Innovation and Energy-Environmental Performance: Evidence from China's Regional Economies. J. Clean. Prod. 327, 129458. doi:10.1016/j.jclepro.2021.129458
Capasso, M., Hansen, T., Heiberg, J., Klitkou, A., and Steen, M. (2019). Green Growth - A Synthesis of Scientific Findings. Technol. Forecast. Soc. Change 146, 390–402. doi:10.1016/j.techfore.2019.06.013
Charfeddine, L., and Ben Khediri, K. (2016). Financial Development and Environmental Quality in UAE: Cointegration with Structural Breaks. Renew. Sust. Energ. Rev. 55, 1322–1335. doi:10.1016/j.rser.2015.07.059
Chen, J., Gao, M., Mangla, S. K., Song, M., and Wen, J. (2020). Effects of Technological Changes on China's Carbon Emissions. Technol. Forecast. Soc. Change 153, 119938. doi:10.1016/j.techfore.2020.119938
Cheng, S. (2014). Develop Inclusive Finance to Ease the Financing Difficulties of Small and Micro Enterprises. Macroeconomic Manag. 11 (53–54), 58. (In Chinese).
Cheng, Z., Li, L., and Liu, J. (2018). Industrial Structure, Technical Progress and Carbon Intensity in China's Provinces. Renew. Sust. Energ. Rev. 81, 2935–2946. doi:10.1016/j.rser.2017.06.103
Cheng, Z., Li, L., and Liu, J. (2021). Research on China’s Industrial green Biased Technological Progress and its Energy Conservation and Emission Reduction Effects. Energy Efficiency 14 (5), 1–20. doi:10.1007/s12053-021-09956-x
Conrad, E., and Cassar, L. (2014). Decoupling Economic Growth and Environmental Degradation: Reviewing Progress to Date in the Small Island State of Malta. Sustainability 6 (10), 6729–6750. doi:10.3390/su6106729
Dechezleprêtre, A., Neumayer, E., and Perkins, R. (2015). Environmental Regulation and the Cross-Border Diffusion of New Technology: Evidence from Automobile Patents. Res. Pol. 44 (1), 244–257. doi:10.1016/j.respol.2014.07.017
Demertzis, M., Merler, S., and Wolff, G. B. (2018). Capital Markets Union and the Fintech Opportunity. J. financial Regul. 4 (1), 157–165. doi:10.1093/jfr/fjx012
Deng, X., Yu, Y., and Liu, Y. (2015). Effect of Construction Land Expansion on Energy-Related Carbon Emissions: Empirical Analysis of China and its Provinces from 2001 to 2011. Energies 8 (6), 5516–5537. doi:10.3390/en8065516
Desha, C., Hargroves, C., and Smith, M. H. (2010). Cents and Sustainability: Securing Our Common Future by Decoupling Economic Growth from Environmental Pressures. London: Routledge. doi:10.4324/9781849776370
Destek, M. A., and Sarkodie, S. A. (2019). Investigation of Environmental Kuznets Curve for Ecological Footprint: the Role of Energy and Financial Development. Sci. Total Environ. 650, 2483–2489. doi:10.1016/j.scitotenv.2018.10.017
Dogan, E., and Inglesi-Lotz, R. (2020). The Impact of Economic Structure to the Environmental Kuznets Curve (EKC) Hypothesis: Evidence from European Countries. Environ. Sci. Pollut. Res. 27 (11), 12717–12724. doi:10.1007/s11356-020-07878-2
Dong, Z. C., and Xiao, W. L. (2014). The Direction of Technical Change, Urban Land Size and Environment Quality. Econ. Res. J. 49 (10), 111–124. (In Chinese).
Du, K., Cheng, Y., and Yao, X. (2021). Environmental Regulation, green Technology Innovation, and Industrial Structure Upgrading: The Road to the green Transformation of Chinese Cities. Energ. Econ. 98, 105247. doi:10.1016/j.eneco.2021.105247
Dubey, R., Gunasekaran, A., Childe, S. J., Luo, Z., Wamba, S. F., Roubaud, D., et al. (2018b). Examining the Role of Big Data and Predictive Analytics on Collaborative Performance in Context to Sustainable Consumption and Production Behaviour. J. Clean. Prod. 196, 1508–1521. doi:10.1016/j.jclepro.2018.06.097
Dubey, R., Gunasekaran, A., Childe, S. J., Papadopoulos, T., Luo, Z., Wamba, S. F., et al. (2019). Can Big Data and Predictive Analytics Improve Social and Environmental Sustainability? Technol. Forecast. Soc. Change 144, 534–545. doi:10.1016/j.techfore.2017.06.020
Epple, D., Zelenitz, A., and Visscher, M. (1978). A Search for Testable Implications of the Tiebout Hypothesis. J. Polit. Economy 86 (3), 405–425. doi:10.1086/260679
Färe, R., Grifell‐Tatjé, E., Grosskopf, S., and Knox Lovell, C. A. (1997). Biased Technical Change and the Malmquist Productivity index. Scand. J. Econ. 99 (1), 119–127. doi:10.1111/1467-9442.00051
Färe, R., Grosskopf, S., Norris, M., and Zhang, Z. (1994). Productivity Growth, Technical Progress, and Efficiency C Hange in Industrialized Countries. Am. Econ. Rev., 66–83.
Geng, Z., and He, G. (2021). Digital Financial Inclusion and Sustainable Employment: Evidence from Countries along the belt and Road. Borsa Istanbul Rev. doi:10.1016/j.bir.2021.04.004
Ghisetti, C., Mancinelli, S., Mazzanti, M., and Zoli, M. (2017). Financial Barriers and Environmental Innovations: Evidence from EU Manufacturing Firms. Clim. Pol. 17 (Suppl. 1), S131–S147. doi:10.1080/14693062.2016.1242057
Gorodnichenko, Y., and Schnitzer, M. (2013). Financial Constraints and Innovation: Why Poor Countries Don't Catch up. J. Eur. Econ. Assoc. 11 (5), 1115–1152. doi:10.1111/jeea.12033
Gu, H., Jie, Y., Li, Z., and Shen, T. (2020). What Drives Migrants to Settle in Chinese Cities: A Panel Data Analysis. Appl. Spat. Anal. Pol., 1–18. doi:10.1007/s12061-020-09358-z
Gu, J., Renwick, N., and Xue, L. (2018). The BRICS and Africa's Search for green Growth, Clean Energy and Sustainable Development. Energy Policy 120, 675–683. doi:10.1016/j.enpol.2018.05.028
Guo, F., Wang, J., Wang, F., Kong, T., Zhang, X., and Cheng, Z. (2020). Measuring China’s Digital Financial Inclusion: Index Compilation and Spatial Characteristics. China Econ. Q. 19 (4), 1401–1418.
Hao, Y., Ba, N., Ren, S., and Wu, H. (2021). How Does International Technology Spillover Affect China's Carbon Emissions? A New Perspective through Intellectual Property protection. Sustainable Prod. Consumption 25, 577–590. doi:10.1016/j.spc.2020.12.008
Hao, Y., Hao, X., Li, Y., Zhang, Y., and Wu, H. (2020). How Does Air Quality Affect the Willingness of Graduate Students to Stay? Evidence from Beijing City, China. J. Clean. Prod. 259, 120759. doi:10.1016/j.jclepro.2020.120759
Hao, Y., Kang, Y., Li, Y., Wu, H., and Song, J. (2022). How Does Environmental Regulation Affect Economic Growth? Evidence from Beijing-Tianjin-Hebei Urban Agglomeration in China. J. Environ. Plann. Manag., 1–28. doi:10.1080/09640568.2022.2042795
Hasan, M. M., Yajuan, L., and Khan, S. (2020). Promoting China’s Inclusive Finance through Digital Financial Services. Glob. Business Rev., 0972150919895348. doi:10.1177/0972150919895348
Hsu, P.-H., Tian, X., and Xu, Y. (2014). Financial Development and Innovation: Cross-Country Evidence. J. Financial Econ. 112 (1), 116–135. doi:10.1016/j.jfineco.2013.12.002
Hu, J., Wang, Z., and Huang, Q. (2021). Factor Allocation Structure and green-biased Technological Progress in Chinese Agriculture. Econ. Research-Ekonomska Istraživanja 34 (1), 2034–2058. doi:10.1080/1331677x.2020.1860795
Huang, B. (2019). “A Research on the Influence of Digital Inclusive Finance on Financing Constraints of SMEs,” in Proceedings of the 2019 International Conference on Economic Management and Cultural Industry (Shenzhen: ICEMCI). doi:10.2991/aebmr.k.191217.098
Huang, J., Xiang, S., Wu, P., and Chen, X. (2022). How to Control China's Energy Consumption through Technological Progress: A Spatial Heterogeneous Investigation. Energy 238, 121965. doi:10.1016/j.energy.2021.121965
Javid, M., and Sharif, F. (2016). Environmental Kuznets Curve and Financial Development in Pakistan. Renew. Sust. Energ. Rev. 54, 406–414. doi:10.1016/j.rser.2015.10.019
Jin, L., Duan, K., Shi, C., and Ju, X. (2017). The Impact of Technological Progress in the Energy Sector on Carbon Emissions: An Empirical Analysis from China. Ijerph 14 (12), 1505. doi:10.3390/ijerph14121505
J. M. Abowd, and R. B. Freeman (Editors) (2007). Immigration, Trade, and the Labor Market (University of Chicago Press).
Keller, W. (2010)., 2. North-Holland, 793–829. doi:10.1016/s0169-7218(10)02003-4International Trade, Foreign Direct Investment, and Technology SpilloversHandbook Econ. Innovation
Khan, A. N., En, X., Raza, M. Y., Khan, N. A., and Ali, A. (2020). Sectorial Study of Technological Progress and CO2 Emission: Insights from a Developing Economy. Technol. Forecast. Soc. Change 151, 119862. doi:10.1016/j.techfore.2019.119862
Kumar, H. (2014). Dynamic Networks of Grassroots Innovators in India. Afr. J. Sci. Technol. Innovation Dev. 6 (3), 193–201. doi:10.1080/20421338.2014.940170
Laeven, L., Levine, R., and Michalopoulos, S. (2015). Financial Innovation and Endogenous Growth. J. Financial Intermediation 24 (1), 1–24. doi:10.1016/j.jfi.2014.04.001
Law, S. H., and Singh, N. (2014). Does Too Much Finance Harm Economic Growth? J. Banking Finance 41, 36–44. doi:10.1016/j.jbankfin.2013.12.020
Lee, I., and Shin, Y. J. (2018). Fintech: Ecosystem, Business Models, Investment Decisions, and Challenges. Business horizons 61 (1), 35–46. doi:10.1016/j.bushor.2017.09.003
Levine, R., Lin, C., and Wei, L. (2017). Insider Trading and Innovation. J. L. Econ. 60 (4), 749–800. doi:10.1086/696384
Li, J., and Li, S. (2020). Energy Investment, Economic Growth and Carbon Emissions in China-Empirical Analysis Based on Spatial Durbin Model. Energy Policy 140, 111425. doi:10.1016/j.enpol.2020.111425
Li, J., See, K. F., and Chi, J. (2019). Water Resources and Water Pollution Emissions in China's Industrial Sector: A green-biased Technological Progress Analysis. J. Clean. Prod. 229, 1412–1426. doi:10.1016/j.jclepro.2019.03.216
Lin, B., Chen, Y., and Zhang, G. (2017). Technological Progress and Rebound Effect in China's Nonferrous Metals Industry: an Empirical Study. Energy Policy 109, 520–529. doi:10.1016/j.enpol.2017.07.031
Lin, B., and Zhu, J. (2019). Fiscal Spending and green Economic Growth: Evidence from China. Energ. Econ. 83, 264–271. doi:10.1016/j.eneco.2019.07.010
Linares, P., and Pérez -Arriaga, I. (2009). Promoting Investment in Low-Carbon Energy Technologies. Eur. Rev. Energ. Markets 3 (2), 1–23.
Liobikienė, G., and Butkus, M. (2019). Scale, Composition, and Technique Effects through Which the Economic Growth, Foreign Direct Investment, Urbanization, and Trade Affect Greenhouse Gas Emissions. Renew. Energ. 132, 1310–1322.
Liu, S., He, N., Shi, Y., and Li, G. (2021). The Roles Logistics Agglomeration and Technological Progress Play in Air Pollution -- New Evidence in Sub-regions of Chongqing, China. J. Clean. Prod. 317, 128414. doi:10.1016/j.jclepro.2021.128414
Liu, Z., Guan, D., Moore, S., Lee, H., Su, J., and Zhang, Q. (2015). Climate Policy: Steps to China's Carbon Peak. Nature 522 (7556), 279–281. doi:10.1038/522279a
Liu, Z., Zhang, X., Yang, L., and Shen, Y. (2021). Access to Digital Financial Services and Green Technology Advances: Regional Evidence from China. Sustainability 13 (9), 4927. doi:10.3390/su13094927
Luo, Z., Dubey, R., Gunasekaran, A., Childe, S. J., Papadopoulos, T., Hazen, B., et al. (2017). Sustainable Production Framework for Cement Manufacturing Firms: A Behavioural Perspective. Renew. Sust. Energ. Rev. 78, 495–502. doi:10.1016/j.rser.2017.04.069
Mayda, A. M. (2010). International Migration: A Panel Data Analysis of the Determinants of Bilateral Flows. J. Popul. Econ. 23 (4), 1249–1274. doi:10.1007/s00148-009-0251-x
McGee, J. A., and Greiner, P. T. (2018). Can Reducing Income Inequality Decouple Economic Growth from CO2 Emissions? Socius 4, 2378023118772716. doi:10.1177/2378023118772716
Nosheen, M., Iqbal, J., and Abbasi, M. A. (2021). Do technological Innovations Promote green Growth in the European Union? Environ. Sci. Pollut. Res. 28 (17), 21717–21729. doi:10.1007/s11356-020-11926-2
Paroussos, L., Fragkiadakis, K., and Fragkos, P. (2020). Macro-economic Analysis of green Growth Policies: the Role of Finance and Technical Progress in Italian green Growth. Climatic Change 160 (4), 591–608. doi:10.1007/s10584-019-02543-1
Pham, N. M., Huynh, T. L. D., and Nasir, M. A. (2020). Environmental Consequences of Population, Affluence and Technological Progress for European Countries: A Malthusian View. J. Environ. Manag. 260, 110143. doi:10.1016/j.jenvman.2020.110143
Ren, S., Hao, Y., and Wu, H. (2022). Digitalization and Environment Governance: Does Internet Development Reduce Environmental Pollution? J. Environ. Plann. Manag., 1–30. doi:10.1080/09640568.2022.2033959
Ren, S., Hao, Y., and Wu, H. (2022). How Does Green Investment Affect Environmental Pollution? Evidence from China. Environ. Resource Econ. 81 (1), 25–51. doi:10.1007/s10640-021-00615-4
Romer, P. (1990). Endogenous Technological Change. J. Polit. Econ. 98 (5), S71–S102. doi:10.1086/261725
Rongwei, X., and Xiaoying, Z. (2020). Is Financial Development Hampering or Improving the Resource Curse? New Evidence from China. Resour. Pol. 67 (January), 101676. doi:10.1016/j.resourpol.2020.101676
Rubashkina, Y., Galeotti, M., and Verdolini, E. (2015). Environmental Regulation and Competitiveness: Empirical Evidence on the Porter Hypothesis from European Manufacturing Sectors. Energy Policy 83, 288–300. doi:10.1016/j.enpol.2015.02.014
Schumpeter, J. A. (1912). Theorie der wirtschaftlichen Entwicklung. Dunker &Humblot. Leipzig. Cambridge, MA: The Theory of Economic Development translated by R. Opie. Harvard University Press.
Seo, M. H., Kim, S., and Kim, Y.-J. (2019). Estimation of Dynamic Panel Threshold Model Using Stata. Stata J. 19 (3), 685–697. doi:10.1177/1536867x19874243
Seo, M. H., and Shin, Y. (2016). Dynamic Panels with Threshold Effect and Endogeneity. J. Econom. 195 (2), 169–186. doi:10.1016/j.jeconom.2016.03.005
Shahbaz, M., Kumar Tiwari, A., and Nasir, M. (2013). The Effects of Financial Development, Economic Growth, Coal Consumption and Trade Openness on CO2 Emissions in South Africa. Energy Policy 61, 1452–1459. doi:10.1016/j.enpol.2013.07.006
Shehzad, K., Zaman, U., José, A. E., Koçak, E., and Ferreira, P. (2021). An Officious Impact of Financial Innovations and ICT on Economic Evolution in china: Revealing the Substantial Role of BRI. Sustainability 13 (16), 8962. doi:10.3390/su13168962
Song, X., Zhou, Y., and Jia, W. (2019). How Do Economic Openness and R&D Investment Affect Green Economic Growth?-Evidence from China. Resour. Conservation Recycling 146, 405–415. doi:10.1016/j.resconrec.2019.03.050
Stern, D. I. (2004).The Rise and Fall of the Environmental Kuznets Curve. World Dev. 32, 1419–1439. The Peking University Digital Inclusive Finance Index[EB /OL]. ( 2017- 07- 01)[2017- 09- 11]. Available at: http: / /www. 3mbang. com /. doi:10.1016/j.worlddev.2004.03.004
Sun, H., Edziah, B. K., Sun, C., and Kporsu, A. K. (2021). Institutional Quality and its Spatial Spillover Effects on Energy Efficiency. Amsterdam: Socio-Economic Planning Sciences, 101023. doi:10.1016/j.seps.2021.101023
Sun, H., Edziah, B. K., Sun, C., and Kporsu, A. K. (2019). Institutional Quality, green Innovation and Energy Efficiency. Energy policy 135, 111002. doi:10.1016/j.enpol.2019.111002
Sun, H., Samuel, C. A., Kofi Amissah, J. C., Taghizadeh-Hesary, F., and Mensah, I. A. (2020). Non-linear Nexus between CO2 Emissions and Economic Growth: a Comparison of OECD and B&R Countries. Energy 212, 118637. doi:10.1016/j.energy.2020.118637
Wang, H., and Wei, W. (2020). Coordinating Technological Progress and Environmental Regulation in CO2 Mitigation: The Optimal Levels for OECD Countries & Emerging Economies. Energ. Econ. 87, 104510. doi:10.1016/j.eneco.2019.104510
Wang, J., Wang, W., Ran, Q., Irfan, M., Ren, S., Yang, X., et al. (2021). Analysis of the Mechanism of the Impact of Internet Development on green Economic Growth: Evidence from 269 Prefecture Cities in China. Environ. Sci. Pollut. Res., 1–15. doi:10.1007/s11356-021-16381-1
Wang, S., and Song, M. (2017). Influences of Reverse Outsourcing on green Technological Progress from the Perspective of a Global Supply Chain. Sci. Total Environ. 595, 201–208. doi:10.1016/j.scitotenv.2017.03.243
Wu, H., Xue, Y., Hao, Y., and Ren, S. (2021). How Does Internet Development Affect Energy-Saving and Emission Reduction? Evidence from China. Energ. Econ. 103, 105577. doi:10.1016/j.eneco.2021.105577
Xie, M., Wei, X., Chen, C., and Sun, C. (2022). China's Natural Gas Production Peak and Energy Return on Investment (EROI): From the Perspective of Energy Security. Energy Policy 164, 112913. doi:10.1016/j.enpol.2022.112913
Xie, T. T., and Liu, J. H. (2019). How Does green Credit Affect China’s green Economy Growth. China Popul. Resour. Environ. 29 (9), 83–90.
Xu, D., Deng, X., Guo, S., and Liu, S. (2019). Labor Migration and farmland Abandonment in Rural China: Empirical Results and Policy Implications. J. Environ. Manag. 232, 738–750. doi:10.1016/j.jenvman.2018.11.136
Xu, M., Shen, Y., and Zhou, P. F. (2021). Research on the Influence of Digital Inclusive Finance on High-Quality Economic Development. Resource development and resource 09, 1080–1085.
Xu, M., Xu, X., and Xie, Q. (2018). The Transferring Role of Inclusive Finance in the Development of Green Ecology. Shandong Soc. Sci. 271, 176–186. (In Chinese).
Yang, J., Xiao, M. Y., and Lv, P. (2021). Has Digital Inclusive Finance Helped to Promote Technological Innovation in Small and Micro Enterprises? Empirical Study of —— Based on China Small and Micro Business Survey (CMES) Data. J. Zhongnan Univ. Econ. L. (04), 119–131+160. (In Chinese). doi:10.19639/j.cnki.issn1003-5230.2021.0047
Yang, L., and Zhang, Y. (2020). Digital Financial Inclusion and Sustainable Growth of Small and Micro Enterprises-Evidence Based on China's New Third Board Market Listed Companies. Sustainability 12 (9), 3733. doi:10.3390/su12093733
Yang, X., Su, X., Ran, Q., Ren, S., Chen, B., Wang, W., et al. (2021a). Assessing the Impact of Energy Internet and Energy Misallocation on Carbon Emissions: New Insights from China. Environ. Sci. Pollut. Res., 1–25. doi:10.1007/s11356-021-17217-8
Yang, X., Wang, J., Cao, J., Ren, S., Ran, Q., and Wu, H. (2021c). The Spatial Spillover Effect of Urban Sprawl and Fiscal Decentralization on Air Pollution: Evidence from 269 Cities in China. Empirical Econ., 1–29. doi:10.1007/s00181-021-02151-y
Yang, X., Wang, W., Wu, H., Wang, J., Ran, Q., and Ren, S. (2021b). The Impact of the New Energy Demonstration City Policy on the green Total Factor Productivity of Resource-Based Cities: Empirical Evidence from a Quasi-Natural experiment in China. J. Environ. Plann. Manag., 1–34. doi:10.1080/09640568.2021.1988529
Yang, Z., Shao, S., Fan, M., and Yang, L. (2021). Wage Distortion and green Technological Progress: A Directed Technological Progress Perspective. Ecol. Econ. 181, 106912. doi:10.1016/j.ecolecon.2020.106912
Yang, Z., Shao, S., Yang, L., and Liu, J. (2017). Differentiated Effects of Diversified Technological Sources on Energy-Saving Technological Progress: Empirical Evidence from China's Industrial Sectors. Renew. Sustain. Energ. Rev. 72, 1379–1388. doi:10.1016/j.rser.2016.11.072
Ye, F., Quan, Y., He, Y., and Lin, X. (2021). The Impact of Government Preferences and Environmental Regulations on green Development of China's marine Economy. Environ. Impact Assess. Rev. 87, 106522. doi:10.1016/j.eiar.2020.106522
Yi, M., Wang, Y., Sheng, M., Sharp, B., and Zhang, Y. (2020). Effects of Heterogeneous Technological Progress on Haze Pollution: Evidence from China. Ecol. Econ. 169, 106533. doi:10.1016/j.ecolecon.2019.106533
Yu, S., Zheng, S., Li, X., and Li, L. (2018). China Can Peak its Energy-Related Carbon Emissions before 2025: Evidence from Industry Restructuring. Energ. Econ. 73, 91–107. doi:10.1016/j.eneco.2018.05.012
Yuan, C., Liu, S., and Wu, J. (2009). Research on Energy-Saving Effect of Technological Progress Based on Cobb-Douglas Production Function. Energy Policy 37 (8), 2842–2846. doi:10.1016/j.enpol.2009.04.025
Yue, S., Lu, R., Chen, H., and Yuan, J. (2018). Does Financial Development Promote the Win-Win Balance between Environmental protection and Economic Growth? Environ. Sci. Pollut. Res. 25 (36), 36438–36448. doi:10.1007/s11356-018-3549-y
Zeraibi, A., Balsalobre-Lorente, D., and Shehzad, K. (2020). Examining the Asymmetric Nexus between Energy Consumption, Technological Innovation, and Economic Growth; Does Energy Consumption and Technology Boost Economic Development? Sustainability 12 (21), 8867. doi:10.3390/su12218867
Zhang, X. L. (2008). Theory of Sustainable Development: Concept Evolution, Dimension and Prospect. J. Chin. Acad. Sci. 33 (01), 10–19. (In Chinese).
Zhang, Y., Zhou, X., Lin, X., Li, X., and Xu, Y. (2018). Research and Innovation of Green Digital Finance Model. DEStech Trans. Soc. Sci. Edu. Hum. Sci. (In Chinese). doi:10.12783/dtssehs/ichae2018/25683
Zhang, Z. P., and Zhang, S. Q. (2009). Exploring Demographic Bonus in Economic Growth —Also on the “Green Demographic Bonus” Adjustment Model. China Popul. Resour. Environ. 19 (5), 88–92. doi:10.3969/j.issn.1002-2104.2009.05.016
Zhao, J., Shen, J., Yan, J., Yang, X., Hao, Y., and Ran, Q. (2021a). Corruption, Market Segmentation and Haze Pollution: Empirical Evidence from China. J. Environ. Plann. Manag., 1–23.
Zhao, Z., Lao, X., Gu, H., Yu, H., and Lei, P. (2021b). How Does Air Pollution Affect Urban Settlement of the Floating Population in China? New Evidence from a Push-Pull Migration Analysis. BMC Public Health 21 (1), 1696–1715. doi:10.1186/s12889-021-11711-x
Zheng, F., Liu, H., Li, T., and Qiu, P. (2021). “A Study on Inclusive Finance and Enterprise Environmental Investment Single-Variable Test Based on Bivariate Mechanism,” in E3S Web of Conferences (French: EDP Sciences), 235. doi:10.1051/e3sconf/202123501073
Zhou, Y., Fang, Z., Li, N., Wu, X., Du, Y., and Liu, Z. (2019). How Does Financial Development Affect Reductions in Carbon Emissions in High-Energy Industries?-A Perspective on Technological Progress. Ijerph 16 (17), 3018. doi:10.3390/ijerph16173018
Zhu, J., Sun, H., Zhou, D., Peng, L., and Sun, C. (2020). Carbon Emission Efficiency of thermal Power in Different Regions of China and Spatial Correlations. Mitig Adapt Strateg. Glob. Change 25 (7), 1221–1242. doi:10.1007/s11027-019-09901-5
Keywords: digital financial inclusion, technological progress, green growth, floating population, dynamic threshold
Citation: Cao J, Law SH, Wu D, Tang X and Yang X (2022) Effect of Digital Financial Inclusion on Dredging the Path of Green Growth—New Evidence From Front-End and Back-End Perspectives. Front. Environ. Sci. 10:865229. doi: 10.3389/fenvs.2022.865229
Received: 29 January 2022; Accepted: 06 April 2022;
Published: 27 April 2022.
Edited by:
Faik Bilgili, Erciyes University, TurkeyReviewed by:
Khurram Shehzad, Southeast University, ChinaLuigi Aldieri, University of Salerno, Italy
Huaping Sun, Jiangsu University, China
Cüneyt Dumrul, Erciyes University, Turkey
Copyright © 2022 Cao, Law, Wu, Tang and Yang. This is an open-access article distributed under the terms of the Creative Commons Attribution License (CC BY). The use, distribution or reproduction in other forums is permitted, provided the original author(s) and the copyright owner(s) are credited and that the original publication in this journal is cited, in accordance with accepted academic practice. No use, distribution or reproduction is permitted which does not comply with these terms.
*Correspondence: Siong Hook Law, bGF3c2hAdXBtLmVkdS5teQ==; Desheng Wu, ZHd1QHVjYXMuYWMuY24=; Xianghua Tang, Z3M1NjcwN0BzdHVkZW50LnVwbS5lZHUubXk=; Xiaodong Yang, eXhkbG92ZXp0QDEyNi5jb20=
†These authors have contributed equally to this work and share first authorship