 Yu-Hao Mao
 Shukun Yu
 Yongjie Shang1
 Hong Liao
 Nan Li
- 1Jiangsu Key Laboratory of Atmospheric Environment Monitoring and Pollution Control/Jiangsu Collaborative Innovation Center of Atmospheric Environment and Equipment Technology, School of Environmental Science and Engineering, Nanjing University of Information Science and Technology (NUIST), Nanjing, China
- 2Key Laboratory of Meteorological Disaster, Ministry of Education (KLME)/ Collaborative Innovation Center on Forecast and Evaluation of Meteorological Disasters (CIC-FEMD)/International Joint Research Laboratory on Climate and Environment Change (ILCEC), NUIST, Nanjing, China
Surface ozone concentrations in the Yangtze River Delta (YRD) region in China have shown a significant increase with the dramatic reduction of anthropogenic nitrogen oxide (NOx) emissions since 2013. As the nonlinearity between ozone and its precursors (i.e., NOx and volatile organic compounds (VOCs)) varies greatly in time and space, we quantify the monthly changes of surface ozone with the co-control of NOx and VOCs anthropogenic emissions in the YRD region from May to October 2017 by using the GEOS-Chem model. Model evaluations show that the GEOS-Chem model exhibits good performance to simulate ozone concentrations in the region. For May–September 2017, most areas in the YRD region are under a transitional regime, but the regions with high anthropogenic emissions including Shanghai and southern Jiangsu are under a VOCs-limited regime. In October, basically, the entire YRD region is under a VOCs-limited regime. Generally, reducing VOCs emissions only is the most effective method for ozone control in the YRD. Nanjing is under a VOCs-limited regime in May, June, September, and October, and under a transition regime from July to August. The VOCs/NOx emission reduction ratio of 1:1 is effective for ozone mitigation in Nanjing (Shanghai) in May, June, and September (for May–September); the corresponding ratio is 2:1 in October. Hangzhou belongs to a transitional regime from May to September and is under a VOCs-limited regime in October. Reducing NOx emissions only would control ozone in Hangzhou from May to September, while the VOCs/NOx emission reduction ratio of 1:1 is favorable to reduce ozone concentrations in October. During high pollution days on July 22–27, 2017, the three cities belong to a transitional regime and reducing NOx emissions only is generally the most effective way to control high ozone pollution. GEOS-Chem tagged ozone simulation shows that ozone problem in the region is caused by the joint effect of local generation and regional and long-distance transport. Local generation (19.0–50.7%) is generally the largest contributor to monthly mean ozone concentrations in Jiangsu and Shanghai, Zhejiang, and central eastern China; the contribution of ozone from regions outside the YRD is larger in spring and autumn (42–76.0%) than in summer (23.3–51.8%). Since the annual VOCs (NOx) anthropogenic emissions in the region have shown a decline by 8% (11%) from 2017 to 2020 and would continue to reduce by 10% (10%) by 2025 according to the Chinese government requirement, the growth of ozone would be stopped in the YRD for May–September but likely to continue in October. Our study thus would provide a scientific base for guiding the effective emission reduction strategies to control ozone pollution in the YRD region.
Highlights
• Yangtze River Delta is changing from a VOCs-limited regime to a transition regime.
• VOCs emission reduction is the key to control ozone pollution in the YRD region.
• Ozone decreases effectively with VOCs/NOx emission reduction ratio larger than 1:1.
• Regional transport is a larger contributor to ozone in spring and fall than in summer.
Introduction
Ozone is the main component of photochemical smog, mainly generated by the reaction of volatile organic compounds (VOCs) and nitrogen oxides (NOx) in the sunlight (NRC, 1991). Because of its strong oxidative capacity and the formation of OH radicals, ozone pollution enhances the oxidation of the background atmosphere (Seinfeld and Pandis, 1998). The ground-level ozone is considered as an air pollutant as it can severely harm public health and damage the ecosystem (Krupa and Manning, 1988; Bell et al., 2006).
With the rapid development of economics and the fast process of industrialization and urbanization in China, ozone pollution is becoming more and more severe in recent years. Yangtze River Delta (YRD) located on the east coast of China is one of the most economically developed and densely populated regions in China. The ozone pollution in the YRD region is thus particularly serious and ozone concentrations measured by the China National Environmental Monitoring Center have increased significantly since 2013 (e.g., Lu et al., 2018; Lu et al., 2020; Li M et al., 2021). A report on the Ministry of Ecology and Environment of China (https://www.mee.gov.cn/hjzl/sthjzk/zghjzkgb/) showed that the 90th percentile of daily maximum 8 h average (MDA8) ozone concentrations reached 152 μg m−3 in the YRD region in 2020 and that the number of days with ozone as the primary pollutant accounted for 50.7% of all the polluted days. Nanjing, Shanghai, and Hangzhou are economically developed cities in the YRD region; ozone pollution problem of these cities has attracted much public attention (e.g., An et al., 2015; Gao et al., 2017; Li K et al., 2017).
VOCs and NOx are important precursors of ozone, the emissions of which are major factors influencing ozone concentration (Ding et al., 2019; Yu et al., 2019). Anthropogenic emissions in China have shown dramatic changes in the recent 2 decades due to rapid economic growth and urbanization as well as energy structure changes and strict emission controls (Wu et al., 2016; Liu et al., 2017; Wang et al., 2019; Liang et al., 2020). In 2013, Chinese government put forward “Air Pollution Prevention and Control Action Plan” (APPCAP, http://www.gov.cn/zhengce/content/2013-09/13/content_4561.htm) and implemented strict emission control measures to reduce anthropogenic emissions for 2013–2017. NOx anthropogenic emissions have decreased by 19.1% from 2013 to 2017 and continue to decline after 2017 (Liu et al., 2017; Zheng et al., 2018; Zheng et al., 2021). Different from NOx emissions, VOCs anthropogenic emissions remain stable for 2013–2017, but begin to decline after 2017 (Ma et al., 2019; Zheng et al., 2018; Zheng et al., 2021). Previous studies (e.g., Xue et al., 2014; An et al., 2015; Gao et al., 2017) have shown that the reduction of NOx anthropogenic emissions could not effectively alleviate ozone pollution in the YRD region, largely due to the strong nonlinear relationship between ozone and its precursors (e.g., Li K et al., 2017; Lu H et al., 2019; Xu et al., 2021).
Chemical transport models (CTM) are widely used to determine ozone sensitivity to its precursors (e.g., Kanaya et al., 2009; Wang et al., 2019; Wei et al., 2019). Based on sensitivity simulations, exploring the changes on ozone concentrations under different VOCs/NOx emission reduction ratios is useful for formulating appropriate and effective ozone reduction strategies (e.g., Wang et al., 2019; Wang et al., 2020; Su et al., 2021). Previous studies have shown that the YRD region was generally under a VOCs-limited regime or a transitional regime (e.g., Wang et al., 2019; Li L et al., 2021; Yang et al., 2021). The VOCs/NOx anthropogenic emission reduction ratio larger than 2:1 was generally effective to control ozone concentrations in the YRD region (e.g., Wang et al., 2019; Wang et al., 2020). Due to the significant reduction of NOx anthropogenic emissions from 2013, the sensitivity of ozone to its precursors is changing dramatically which would significantly affect ozone control strategies.
Ozone has a lifetime of several days to weeks in the free troposphere (Lin et al., 2008). Ozone pollution is thus not only related to local source emissions of ozone precursors but also influenced by regional transport (Zheng et al., 2010; Gong et al., 2020). By using a tagged ozone simulation in GEOS-Chem, Gong et al. (2020) found that ozone transport from central eastern China contributed 36% to the enhanced daily mean ozone concentrations during the persistent ozone pollution episodes in North China in May–July of 2014–2018. Based on the ozone source apportionment technology of WRF/CMAx, Li L et al. (2019) found that regional transport was a significant source of ozone in urban regions in the YRD region and contributed 38.7–111.1 μg m−3 to daily average MDA8 ozone concentrations in May, August, and October of 2015.
To our knowledge, previous studies on ozone–NOx–VOCs sensitivity and ozone control strategies have largely focused on the whole summer season, a certain month, or high ozone pollution days (e.g., Xu et al., 2017; Li K et al., 2017; Wang et al., 2020; Zhang et al., 2020). Due to the strong nonlinearity between ozone and its precursors in time and space, it is thus necessary to systematically analyze the ozone–NOx–VOCs sensitivity and control strategies of NOx and VOCs anthropogenic emissions for different months, different cities, and high pollution days to guide the effective ozone mitigation in the YRD region. In this study, we aim to quantify the changes of surface ozone with the control of NOx and VOCs anthropogenic emissions at different reduction ratios in the YRD region (28.2°N∼34.5°N, 115.8°E∼123.4°E) using the GEOS-Chem CTM. We mainly focus on three big cities (Nanjing, Shanghai, and Hangzhou) in the region from May to October in 2017, the final year of implementation of the APPCAP action plan. To explore the reasons for the differences in monthly sensitivity of ozone–NOx–VOCs, we further quantify the ozone contributions from different regions to monthly mean surface ozone concentrations in the YRD region using the GEOS-Chem tagged ozone technique. We introduce the observation data and the sensitivity simulations of the GEOS-Chem model in Section 2. We evaluate model results with observation data from the China National Environmental Monitoring Center in Section 3. In Section 4, we evaluate the ozone–NOx–VOCs sensitivity in the YRD region and the changes in ozone concentrations with the reduction of NOx and VOCs anthropogenic emissions. In Section 5, we quantify the contributions of ozone from different regions to surface ozone concentrations in the YRD region. We conclude in Section 6.
Methods
Observations
In this study, we obtain the observations of hourly ozone concentrations for May–October 2017 from the China National Environmental Monitoring Center (http://106.37.208.233:20035/). There are 10 monitoring sites in Shanghai, 11 in Hangzhou, and 9 in Nanjing. The sampling measurements and techniques comply with the Chinese national ambient air quality monitoring technical regulations HJ/T193-2005. According to ambient air quality standard GB 3095-2012, the MDA8 ozone concentrations are calculated if at least 6 hourly averages are recorded in every 8 h and more than 14 8-hour averages are available from 8:00 to 24:00 local time.
Model Description and Simulations
The GEOS-Chem global CTM is driven by assimilated meteorological data from the Goddard Earth Observing System (GEOS) of the NASA Global Modeling and Assimilation Office (GMAO) (Bey et al., 2001). Here, we use GEOS-Chem version 11-01 (http://wiki.geos-chem.org/GEOS-Chem_v11-01) driven by MERRA-2 meteorological data with spatial horizontal resolutions of 2 × 2.5 ° globally and 0.5 × 0.625 ° nested over Southeastern Asia (11°S∼55°N, 60°E∼150°E), reduced 47 vertical levels from the surface to 0.01 h Pa, and a temporal resolution of 1 h.
We conduct full-chemistry NOx–Ox–Hydrocarbon-aerosol model simulations. We use the Linoz scheme for ozone production in the stratosphere (McLinden et al., 2000) and the nonlocal planetary boundary layer (PBL) mixing scheme for vertical mixing of air tracers in the PBL (Holtslag and Boville, 1993; Lin and McElroy, 2010). Dry deposition is calculated based on the resistance-in-series scheme (Wesely, 1989). The wet deposition for water-soluble aerosols and gas is described by Liu et al. (2001) and Amos et al. (2012).
The Harvard–NASA Emission Component (HEMCO) is used to process emissions in the GEOS-Chem model (Keller et al., 2014). Global anthropogenic emissions are from the Emissions Database for Global Atmospheric Research (EDGAR). The Global anthropogenic VOCs emissions are from the REanalysis of TROpospheric chemical composition (RETRO) inventory, but C2H6 and C3H8 are overwritten by the emission inventory developed by Xiao et al. (2008). The regional anthropogenic emissions are taken from the European Monitoring and Evaluation Project (EMEP) for Europe (Auvray and Bey, 2005), the Big Bend Regional Aerosol and Visibility Observational emission inventory (BRAVO) for Mexico (Kuhns et al., 2005), the Canadian Criteria Air Contaminant emission inventory (CAC) for Canada, the National Emission Inventory (NEI) for the United States, and the MIX emission inventory over East and South Asia (Li M et al., 2017).
Particularly, we used monthly anthropogenic emissions in China from the Multi-resolution Emission Inventory for China (MEIC) with a horizontal resolution of 0.5 ° × 0.667 ° for 2017. The annual NOx anthropogenic emissions in MEIC are 3,666 Gg in the YRD region (including Jiangsu, Shanghai, Zhejiang, and Anhui provinces) in 2017 and reduce by 19.1% from 2013 to 2017; NMVOCs emissions are 5,593 Gg and increased by 3.3% from 2013 to 2017 (http://meicmodel.org/). Figure 1 shows monthly anthropogenic NOx and VOCs emissions of the MEIC inventory in the YRD region averaged for May–October 2017. The spatial distributions of NOx and VOCs emissions in the YRD region are generally similar. The regions with high emissions are mainly concentrated in Shanghai and southern Jiangsu. Among the three cities of Nanjing, Shanghai, and Hangzhou, NOx and VOCs emissions are the highest in Shanghai (3 g m−2 month−1 and 2.4 g m−2 month−1, respectively) and the lowest in Hangzhou (0.6 g m−2 month−1 and 0.5 g m−2 month−1, respectively).
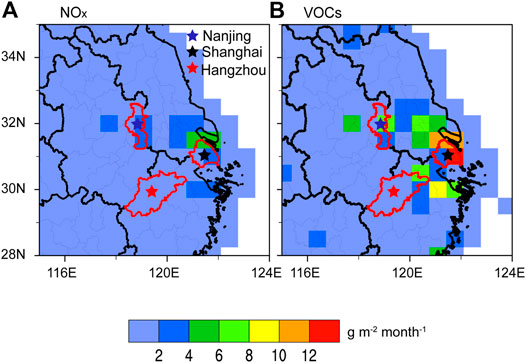
FIGURE 1. Monthly anthropogenic (A) NOx emissions and (B) VOCs emissions (g m−2 month−1) from the MEIC inventory in the Yangtze River Delta (YRD) region averaged for May–October 2017. Red enclosed areas indicate Nanjing, Shanghai, and Hangzhou, respectively.
A number of natural emissions are also implemented in the model. We used biomass burning emissions from the Global Fire Emissions Database version 4 (GEFD v4) with a horizontal resolution of 0.25 ° × 0.25 ° and a spatial resolution of 1 month (van der Werf et al., 2017). Biogenic VOCs emissions are from the MEGAN version 2.1 (MEGAN v2.1) (Guenther et al., 2012). Lightning and soil NOx emissions are also included in the model following Lu X et al. (2019).
We simulate ozone concentrations in the YRD region from February to October 2017 with the first 3 months for spin-up. Our analysis centers on 2017, the final year of implementation of the APPCAP action plan and also the latest year currently available for the MEIC emission inventory. In addition to a standard simulation with all emissions unchanged, we also conduct simulations to study the sensitivities of NOx and VOCs to ozone formation and the effective emission reduction ratio of VOCs/NOx for ozone control in the YRD region. Empirical Kinetic Modeling Approach (EKMA) isopleths of ozone concentrations under different emissions of precursors are commonly used method to reflect ozone-NOx-VOCs sensitivity (e.g., Xing et al., 2011; Guo et al., 2019). In order to obtain the EKMA isopleths, we conduct 24 sensitivity simulations with anthropogenic NOx and VOCs emissions in the YRD region reduced by 20, 40, 60, and 80%, respectively.
The ratio of formaldehyde (HCHO) to nitrogen dioxide (NO2) (HCHO/NO2, FNR) has been widely used to evaluate ozone–NOx–VOCs sensitivity (e.g., Jin and Holloway, 2015; Xu et al., 2021). To examine the ozone–NOx–VOCs sensitivity obtained from the EKAM isopleths, we calculate FNR using monthly mean HCHO and NO2 column concentrations from the GEOS-Chem simulations. FNR > 2 indicates a NOx-limited regime, FNR < 1 reflects a VOCs-limited regime, and FNR between 1 and 2 is considered as a transitional regime (Martin et al., 2004).
The offline tagged ozone technique in the GEOS-Chem CTM is used to quantify the contributions of ozone from different source regions to monthly mean ozone concentrations in the YRD region. We run tagged ozone simulation with a spatial horizontal resolution of 2 ° × 2.5 ° globally (the only resolution available) by using 3-D ozone production rates and loss frequencies archived from the full-chemistry standard simulation. We consider eight regions in China and one region representing the rest of the world (Supplementary Figure S1). We tag the generated ozone from the surface to the 38th vertical layer in the model (∼48 hPa altitude) from nine regions. Generally, the sum of these nine tagged ozone concentrations in the YRD region is equal to the simulated ozone concentration in this region.
Model Evaluations
Previous studies have shown that the GEOS-Chem model with the MEIC emission inventory reasonably captured observed ozone concentrations in China (e.g., Li K et al., 2019; Sun et al., 2019). We further compare in Figure 2, observed and GEOS-Chem simulated MDA8 ozone concentrations at stations in Nanjing, Shanghai, and Hangzhou. Observations are averaged for the measurement stations in each region, and the model results are sampled at the corresponding locations of the measurement stations. The GEOS-Chem model is generally in good performance to simulate ozone concentrations in three regions. The differences in MDA8 ozone concentrations between simulations and observations are 6.77 μg m−3 in Nanjing, –0.38 μg m−3 in Shanghai, and 9.64 μg m−3 in Hangzhou, respectively, averaged for May–October 2017.
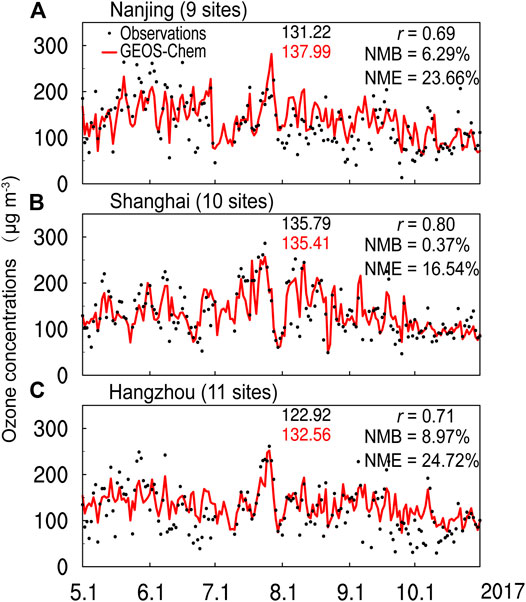
FIGURE 2. Observed (black) and simulated (red) daily maximum 8 h average (MDA8) ozone concentrations (μg m−3) averaged for stations at (A) Nanjing (9 sites), (B) Shanghai (10 sites), and (C) Hangzhou (11 sites) from May to October 2017. Also shown are observed and simulated mean ozone concentrations for the time period, correlation coefficients (r), normalized mean bias (NMB), and normalized mean errors (NME) between model results and observations. All the correlation coefficients pass the two-tailed t-test with 95% confidence interval.
We further used correlation coefficients (r), normalized mean bias (NMB), and normalized mean errors (NME) (Emery et al., 2017) between simulated and observed ozone concentrations to evaluate the model performance.
where co is the observed MDA8 ozone concentration averaged for stations in each region (μg m−3), cm is the corresponding simulated MDA8 ozone concentration (μg m−3), and N is the number of the observation days from May to October 2017.
Simulated ozone concentrations largely capture the day-to-day variations of observations with the correlation coefficients in the range of 0.69–0.80 at the stations in Nanjing, Shanghai, and Hangzhou. All the correlation coefficients pass the two-tailed t-test with 95% confidence interval. The model performance criteria for MDA8 ozone concentrations have been met when both the NMB and NME are less than or equal to approximately ±15% and +25%, respectively (Emery et al., 2017). The NMB and NME of simulated and observed MDA8 ozone concentrations are 0.37–8.97% and 16.54–24.72% at the stations in Nanjing, Shanghai, and Hangzhou, which are within the model performance criteria.
Model performance is further evaluated by the monthly correlation coefficients between observations and model results in Nanjing, Shanghai, and Hangzhou for May–October 2017 (Supplementary Figure S2). Generally, monthly correlation coefficients averaged for the three areas are highest in July (r = 0.87), May (0.75), and August (0.73), but lowest in October (0.5). For each city, model performance is best in Nanjing in May and June, in Shanghai from August to October, and in Hangzhou in July.
We also conduct the GEOS-Chem simulation at a horizontal resolution of 0.25 × 0.3125 ° with the same model configuration as those at 0.5 × 0.625 °. The differences of simulated MDA8 ozone concentrations between 0.5 × 0.625° and 0.25 × 0.3125 ° model simulations are only −0.03, 5.67%, and 0.51%, respectively, for correlation coefficients, NMB, and NME averaged for three cities during May–October 2017. Considering the problem of computing time cost, we thus conduct sensitivity simulations at 0.5 × 0.625 °.
Response of Ozone to Precursor Controls
The sensitivity of ozone to its precursors varies significantly over time and location (e.g., Tang et al., 2017; Wei et al., 2019; Yang et al., 2021). Figure 3 shows the changes in the monthly mean MDA8 ozone concentrations for May to October 2017 from sensitivity simulations with anthropogenic NOx or VOCs emissions in the YRD region reduced by 20 and 40%, compared to the ozone concentrations from the standard model simulation. The sensitivities of ozone concentrations to anthropogenic NOx emissions show large differences in space and time. From May to September, ozone concentrations decrease with the reduction of NOx emissions in northern Jiangsu and most areas of Zhejiang and Anhui. The ozone concentrations decrease by more than 6 μg m−3 in southwestern YRD region from May to September when the reduction of NOx emissions reaches 40%. In May, June, and September, ozone concentrations yet increase in the regions with high anthropogenic emissions including Shanghai and southern Jiangsu; the increases of ozone concentrations are largest in Suzhou by ∼8 μg m−3 with the reduction of NOx emissions by 40%. From July to August, reducing NOx emission is effective for most of the YRD regions, except for a small part of southeast Jiangsu and northern Shanghai. In October, most of the YRD region shows increased ozone concentrations with decreased NOx emissions, except for the southwestern YRD region including southern part of Anhui and Zhejiang.
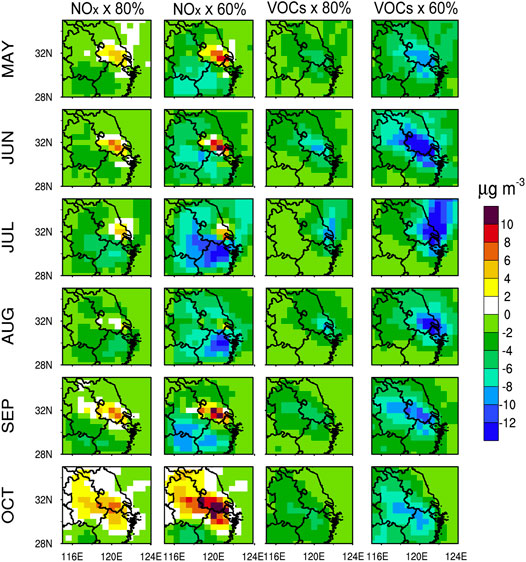
FIGURE 3. Differences in monthly mean daily maximum 8 h average (MDA8) ozone concentrations (μg m−3) between sensitivity simulations with reduced anthropogenic NOx (left two columns) or VOCs (right two columns) emissions and the standard model simulation from May to October 2017. Anthropogenic NOx or VOCs emissions in the Yangtze River Delta (YRD) region reduced by 20 and 40%.
Compared to cutting NOx emissions, the reduction of VOCs emissions is more effective to control the ozone concentrations in the entire YRD region, where the ozone concentrations decrease with the reduction of VOCs emissions from May to October. The ozone concentrations are most sensitive to VOCs emissions in Shanghai and southern Jiangsu, which decrease by more than 8 μg m−3 with the reduction of VOCs emissions by 40% from May to September.
Combined with the changes in ozone concentrations due to the reduction of NOx or VOCs emissions, most of the regions in the YRD are controlled by a transitional regime for May–September 2017 while under a VOCs-limited regime in October. The regions with high anthropogenic emissions including Shanghai and southern Jiangsu are controlled by a VOCs-limited regime in May, June, September, and October. From July to August, the VOCs-limited regions shrink to only small part of southeast Jiangsu and northern Shanghai. Previous studies have also shown that the YRD region is changing from a VOCs-limited regime to a transition regime due to the reduction of NOx anthropogenic emissions in recent years (e.g., Jin and Holloway, 2015; Wang et al., 2019).
To further investigate the ozone sensitivity to its precursors for Nanjing, Shanghai, and Hangzhou and the changes of ozone concentrations under different VOCs/NOx emission reduction ratios, Figure 4, Figure 5, and Figure 6 show the EKMA isopleths of monthly MDA8 ozone concentrations from May to October 2017 for the three cities. Figure 4, Figure 5, and Figure 6 (Supplementary Figure S3) show the differences in monthly mean MDA8 ozone concentrations between sensitivity simulations (including VOCs emissions reduction only, NOx emissions reduction only, and reduction of VOCs and NOx emissions simultaneously by 1:1, 1:2, 1:3, 2:1, and 3:1) and the standard model simulation in Nanjing, Shanghai, and Hangzhou for May–October 2017. In the three cities, reducing VOCs emissions is generally an effective approach to control ozone concentrations. When VOCs emissions are reduced by 40%, ozone concentrations from May to October would decrease by 5.3–12.3 μg m−3 (3.8–7.5%) in Nanjing, 4.0–14.5 μg m−3 (4.1–9.3%) in Shanghai, and 3.2–7.9 μg m−3 (2.5–7.2%) in Hangzhou.
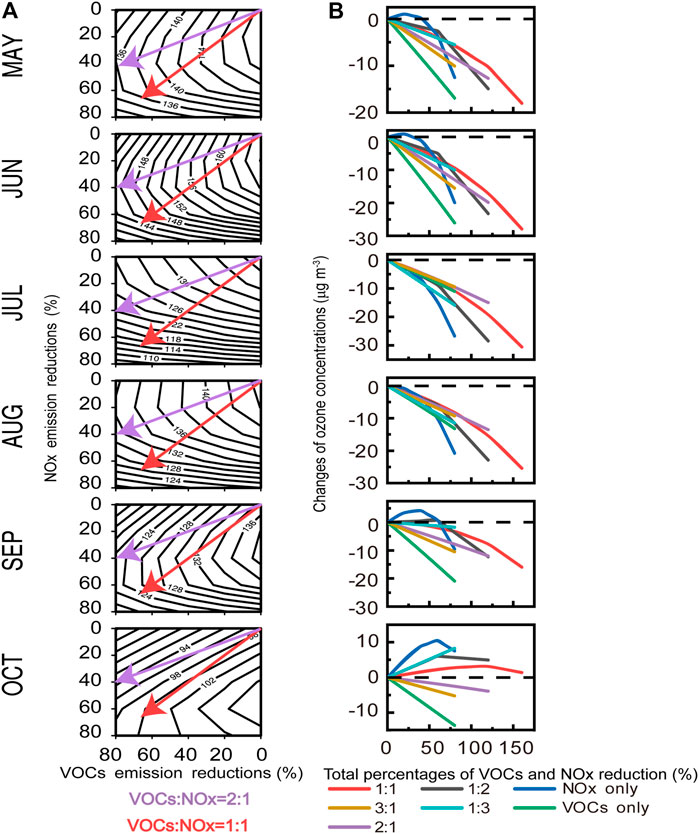
FIGURE 4. (A) Empirical kinetic modeling approach (EKMA) isopleths of monthly mean daily maximum 8 h average (MDA8) ozone concentrations (μg m−3) in Nanjing for May–October 2017. Red and purple arrows represent VOCs and NOx anthropogenic emissions simultaneously reduced by 1:1 and 2:1, respectively. (B) Differences in monthly mean MDA8 ozone concentrations between sensitivity simulations and standard model simulation in Nanjing for May–October 2017. Sensitivity simulations include VOCs anthropogenic emissions reduction only, NOx anthropogenic emissions reduction only, and reduction of VOCs and NOx anthropogenic emissions simultaneously by 1:1, 1:2, 1:3, 2:1, and 3:1.
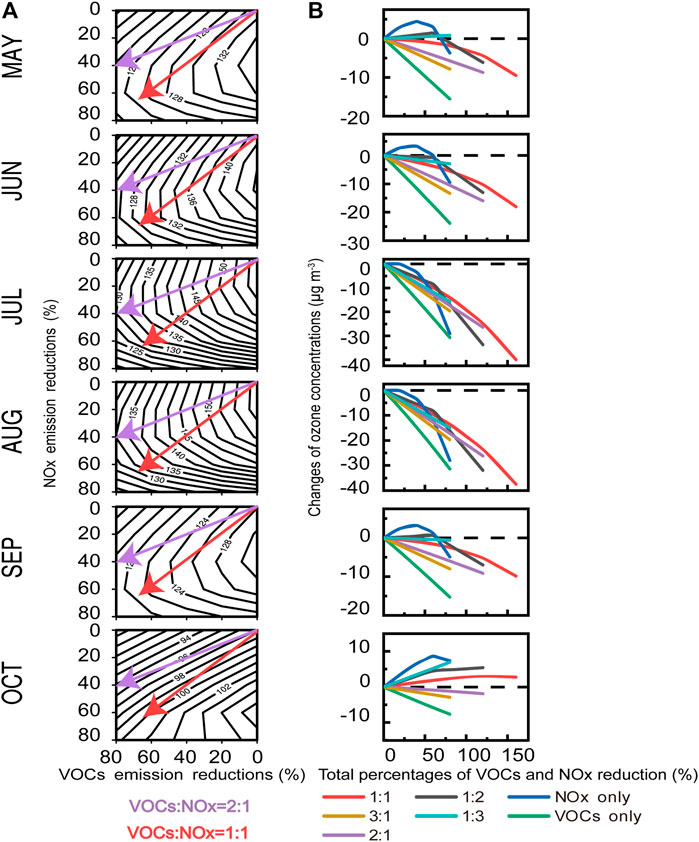
FIGURE 5. Same as Figure 4, but for Shanghai.
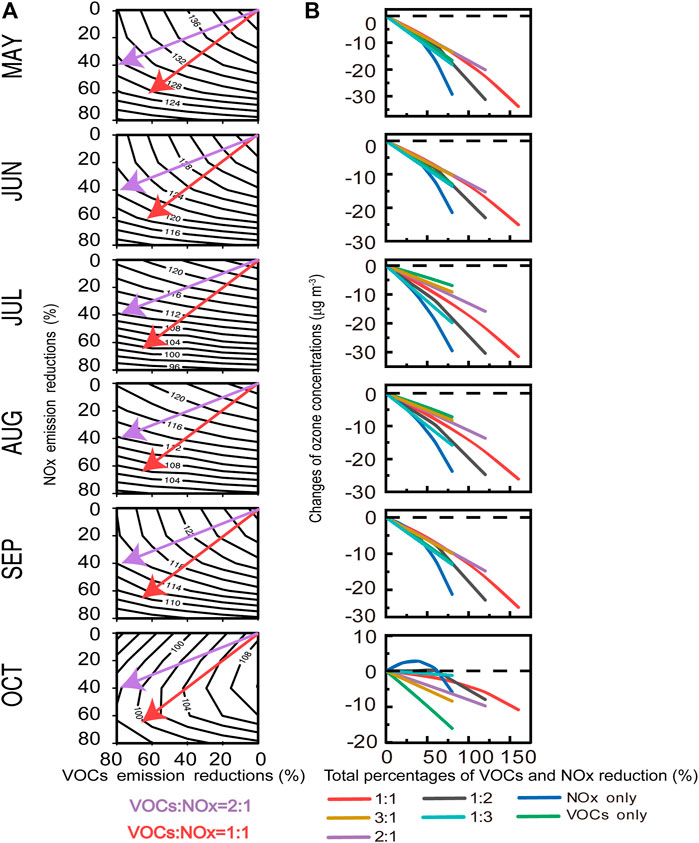
FIGURE 6. Same as Figure 4, but for Hangzhou.
In Nanjing, ozone concentrations are more sensitive to the VOCs emissions in May, June, September, and October, when ozone concentrations would decrease by 6.8–12.3 μg m−3 (5.6–7.5%) with the VOCs emissions reduced by 40%. Nanjing would turn into a transition regime when NOx emissions reduce by more than 20% for May–June, by 40% in September, and by 60% in October. The VOCs/NOx emission reduction ratio of 1:1 is effective for ozone mitigation in May, June, and September; the corresponding ratio is 2:1 in October. Nanjing belongs to a transition regime from July to August when controlling ozone would be achieved by reducing VOCs emissions only, NOx emissions only, or both NOx and VOCs emissions. For near-term ozone control in July and August, the VOCs emissions reduction only is the most effective method; while for a long-term control strategy, the NOx emissions reduction only is more effective. Ozone concentrations in July and August would decrease by 3.7–6.9 μg m−3 (2.6–5.0%) with the reduction of NOx emissions by 40%.
Shanghai is generally under a VOCs-limited regime from May to October. Ozone concentrations always decrease with the reduction in VOCs emissions; ozone concentrations would decrease by 4.0–14.5 μg m−3 (4.1–9.3%) with the VOCs emissions reduced by 40% from May to October. In July and August, Shanghai closes to a transition regime. Ozone concentrations would decrease when NOx emissions reduce by 40% in May, June, and September, by 20% in July and August, and by 60% in October. The effective VOCs/NOx emission reduction ratios for controlling ozone concentrations are larger than 1:1 for May–September and 2:1 in October, which are close to those in Nanjing.
Hangzhou belongs to a transitional regime from May to September and a VOCs-limited regime in October, when Hangzhou would become a transition regime with the NOx emission reduced by more than 60%. Ozone concentrations would decrease by 1.5–33.8 μg m−3 (1.2–25.1%) in Hangzhou from May to September under all emission reduction scenarios. In May, June, and September, the VOCs emissions reduction only below 40% is the most effective way for near-term ozone control; while the NOx emissions reduction only above 40% is more effective as a long-term control strategy. The NOx emission reduction only scenario is generally the effective way to control ozone concentrations in July and August, when ozone concentrations decrease by 8.6–11.2 μg m−3 (6.8–8.9%) with the NOx emissions reduced by 40%.
Figure 7 shows sensitivity regimes of ozone–NOx–VOCs defined by FNR in the YRD region for May–October 2017. Generally, the ozone–NOx–VOCs sensitivities in the YRD indicted by FNR are consistent with those from the model sensitivity simulations and the EKAM isopleths. From May to September, most areas of the YRD region belong to a transition regime; while southern Jiangsu, Shanghai, and northern Zhejiang are under a VOCs-limited regime. In October, basically, the whole YRD region belongs to a VOCs-limited regime. Nanjing and Shanghai are under a VOCs-limited regime in May, June, September, and October and parts of the cities are in a transition regime in July and August. Hangzhou generally belongs to a transition regime for May–September and parts of the city are under a NOx-limited regime.
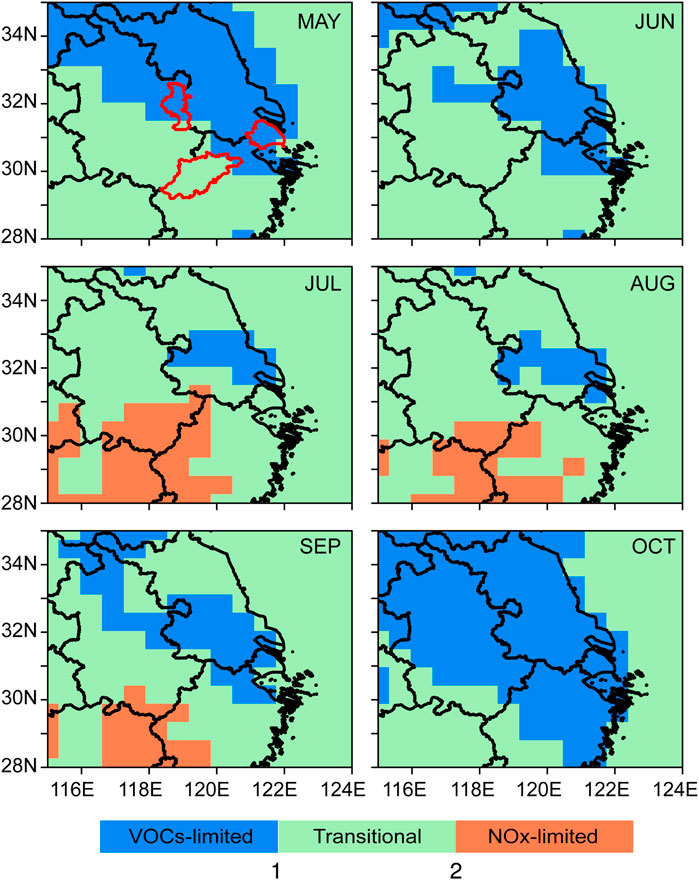
FIGURE 7. Sensitivity regimes of ozone–NOx–VOCs defined by HCHO/NO2 ratios (FNR) in the Yangtze River Delta (YRD) region from May to October 2017. Red enclosed areas indicate Nanjing, Shanghai, and Hangzhou, respectively.
We further analyze the sensitivity of ozone to its precursors and the changes of ozone under different VOCs/NOx emission reduction ratios in Nanjing, Shanghai, and Hangzhou during high pollution event (Figure 8). We choose the high ozone pollution period from July 22 to 27, 2017, when the observed daily MDA8 ozone concentrations exceed the national air quality standard of 160 μg m−3 (https://www.mee.gov.cn/ywgz/fgbz/bz/bzwb/dqhjbh/dqhjzlbz/201203/W020120410330232398521.pdf) simultaneously in Nanjing, Shanghai, and Hangzhou. The NMB and NME of simulated and observed MDA8 ozone concentrations during this period are −14.9 to 11.4% and 14.9–18.7% at the stations in three cities, which are within the model performance criteria. Ozone concentrations under all emission reduction scenarios would decrease by 3.8–59.7 μg m−3 (1.9–29.4%) in Nanjing, 6.1–68.3 μg m−3 (2.7–30.6%) in Shanghai, and 3.4–65.0 μg m−3 (1.7–32.7%) in Hangzhou. The three cities all belong to a transitional regime during high pollution days and NOx emissions reduction only is generally the most effective method to control long-term ozone concentrations. When NOx emissions reduce by 40%, the reduction of ozone concentrations in high pollution days are larger than those averaged in July by 11.8 μg m−3 in Nanjing, 12.9 μg m−3 in Shanghai, and 10.8 μg m−3 in Hangzhou. In Shanghai, the VOCs emissions reduction would be the most effective for near-term ozone control.
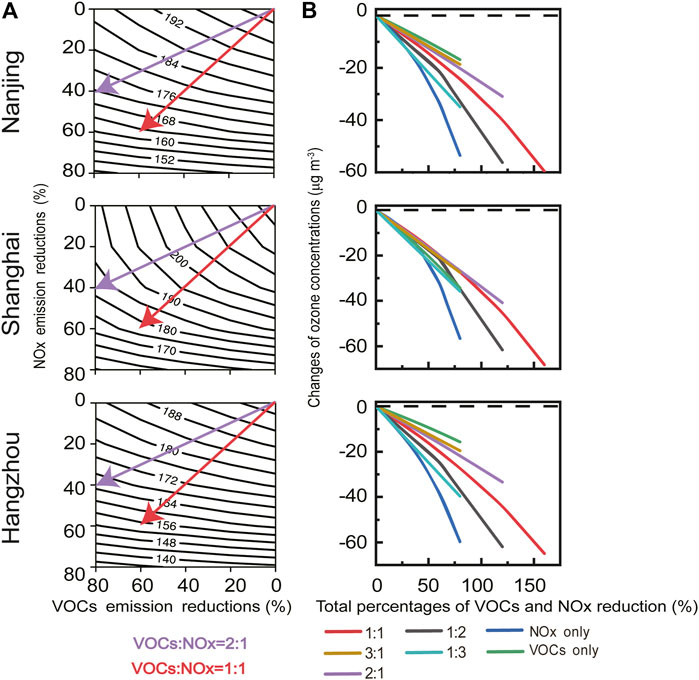
FIGURE 8. Same as Figure 4, but for high pollution events from July 22 to 27, 2017 in Nanjing, Shanghai, and Hangzhou, respectively.
Our results of ozone–NOx–VOCs sensitivity are broadly consistent with previous studies (e.g., Xu et al., 2017; Li K et al., 2017; Yang et al., 2021), but provide updated and detailed information about monthly ozone sensitivity to its precursors and the effective emission reduction ratios of VOCs/NOx to control ozone in the three cities. Generally, the three cities are under a VOCs-limited regime or a transitional regime during the summer season and changing to a transitional regime gradually. Previous observational and modeling studies have shown that ozone concentrations would decrease in the YRD region when VOCs/NOx emission reduction ratio was greater than 2:1 (e.g., Wang et al., 2019; Wang et al., 2020). With the reduction of NOx emissions from 2013, our results show that VOCs/NOx emission reduction ratio of 1:1 is in favor of effective ozone control in the region for May–September, and NOx emission reduction only is an effective way to control ozone concentrations during the high pollution event in July.
Ozone Contributions From Different Source Regions
In Figure 9, we qualify the contributions of ozone from nine defined regions to monthly mean surface ozone concentrations in the YRD region for May‒October 2017 using the GEOS-Chem tagged ozone technique. We focus on the contributions to monthly mean surface ozone concentrations in three regions, Jiangsu and Shanghai (Figure 9A), Zhejiang (Figure 9B), and central eastern China (Figure 9C), generally belonging to the YRD region. Locally generated ozone is the largest contributor to monthly mean surface ozone concentrations in the three regions for May–September 2017, ranging from 42.4 to 74.7 μg m−3 (30.0–44.1%) in Jiangsu and Shanghai, 38.5–54.2 μg m−3 (31.5–47.4%) in Zhejiang, and 53.6–68.3 μg m−3 (39.0–50.7%) in central eastern China. The control of local source emissions is thus important to control ozone concentrations in the YRD region.
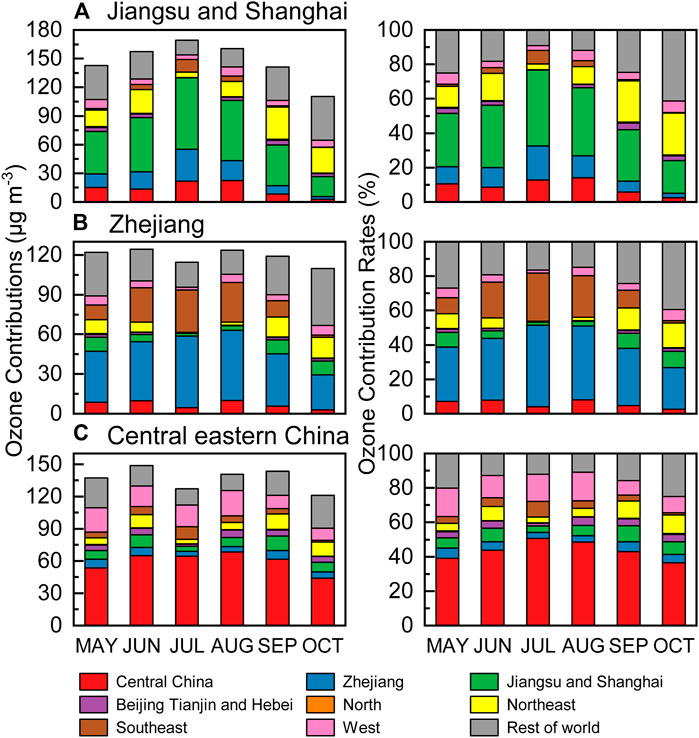
FIGURE 9. Ozone contributions from different source regions to monthly mean surface ozone concentrations in three regions: (A) Jiangsu and Shanghai, (B) Zhejiang, and (C) central eastern China from May to October 2017.
For Jiangsu and Shanghai region (Figure 9A), ozone from adjacent areas, i.e., Zhejiang and central eastern China are the second (20.6–33.7%) and third (21.6–22.4%) largest contributors in July and August. For other months, ozone from the rest of world also shows large contributions to surface ozone concentrations in Jiangsu and Shanghai in May (25.1%), June (18.1%), September (24.7%), and October (41.4%), indicating that regional and long-distance transport is also a significant contributor to surface ozone in Jiangsu and Shanghai. For Zhejiang region (Figure 9B), ozone from nearby southeast is the second largest contributor for the summer months of June to August (20.9–28.0%). Ozone from the rest of world accounts for 27.0% of surface ozone concentrations in Zhejiang in May, 24.4% in September, and 39.3% in October. For the central eastern China region (Figure 9C), ozone contributions from the rest of the world to the surface ozone in central eastern China are the second largest in spring and autumn months (20.2% in May, 15.7% in September, and 25.1% in October). For the summer months of June to August, ozone transport from the adjacent west regions contributes the second largest fraction of surface ozone (12.9–16.6%) in central eastern China.
Previous studies have shown that ozone pollution is a regional problem and regional transport has large contribution to the ozone within the YRD region (e.g., Gao et al., 2016; Li L et al., 2019). Our results also show that regional and long-range transport is also a significant contributor to surface ozone in the YRD. Ozone from regions outside the YRD accounts for 23.3–76.0% of surface ozone in Jiangsu and Shanghai, 46.3–63.8% in Zhejiang, 41.9–51.3% in central eastern China, which are larger in spring and autumn than in summer. The largest regional transport in October (51.3–76.0%) would affect the sensitivity of ozone to its locally emitted precursors, which show significant differences compared with those for May–September. The large regional transport will therefore affect the effectiveness of local precursor emission reduction on ozone control.
Discussion and Conclusion
We used the GEOS-Chem model to analyze ozone sensitivity to its precursors in the YRD region from May to October 2017. We aimed to quantify the changes of surface ozone with the control of NOx and VOCs anthropogenic emissions at different reduction ratios in three big cities in the YRD region (Nanjing, Shanghai, and Hangzhou). The GEOS-Chem model was generally in good performance to simulate ozone concentrations in the three cities with correlation coefficients, NMB, and NME values in the range of 0.69–0.80, 0.37–8.97% and 16.54–24.72%, respectively, which were all within the model performance criteria.
We conducted sensitivity simulations by reducing anthropogenic NOx and VOCs emissions by 20, 40, 60, and 80% in the YRD region, and evaluated the ozone–NOx–VOCs sensitivity in the YRD region. Most areas in the YRD region were under a transitional regime for May–September 2017 while under a VOCs-limited regime in October. The regions with high anthropogenic emissions including Shanghai and southern Jiangsu were under a VOCs-limited regime for May–October; the VOCs-limited regions for July–August shrank to only a small part of southeast Jiangsu and northern Shanghai. Generally, compared to reducing NOx emissions, VOCs emissions reduction was more effective to control ozone concentrations in the entire YRD region.
We further evaluated ozone sensitivity to its precursors and compared changes of ozone concentrations between sensitivity simulations and standard model simulation in Nanjing, Shanghai, and Hangzhou. Nanjing was under a VOCs-limited regime in May, June, September, and October and under a transition regime from July to August. The VOCs/NOx emission reduction ratio of 1:1 was effective for ozone mitigation in Nanjing in May, June, and September; the corresponding ratio was 2:1 in October. Shanghai was generally under a VOCs-limited regime for May–October and closed to a transition regime for July–August. The effective VOCs/NOx emission reduction ratios for controlling ozone concentrations in Shanghai was larger than 1:1 for May–September and 2:1 in October. Hangzhou belonged to a transitional regime from May to September and was under a VOCs-limited regime in October. Reducing NOx emission was the effective method to control ozone in Hangzhou from May to September, while the VOCs/NOx reduction ratio of 1:1 was favorable to reduce ozone concentrations in October. During high pollution days on July 22–27, 2017, the three cities belong to a transitional regime and reducing NOx emissions only is generally the most effective way to control high ozone pollution.
We used tagged ozone simulation to quantify contributions of ozone from eight regions to monthly mean ozone concentrations in Jiangsu and Shanghai, Zhejiang, and central eastern China from May to October 2017. Generally, locally generated ozone was the largest contributor to monthly mean ozone concentrations in Jiangsu and Shanghai (30.0–44.1%) and Zhejiang (31.5–47.4%) from May to September, while in central eastern China (36.4–50.7%) from May to October. Ozone transport from adjacent regions was also a major contributor for June–August. Ozone from regions outside the YRD were larger in spring and autumn than in summer, and accounted for 23.3–76.0% of surface ozone in Jiangsu and Shanghai, 46.3–63.8% in Zhejiang, and 41.9–51.3% in central eastern China. Ozone in the YRD region was therefore caused by the joint effect of local source and transport of ozone from adjacent and long-distance regions.
Due to the strict and effective emission reduction policies of the Chinese government, annual anthropogenic NOx emissions continued to reduce in the YRD from 2017, and anthropogenic VOCs emissions have begun to show a decline. Compared to the MEIC emission inventory in 2017, the annual anthropogenic VOCs (NOx) emission in 2020 reduced by 8% (11%) in the YRD region (Zheng et al., 2021). The VOCs/NOx emission reduction ratio was thus about 1:1. According to our discussions in Sect.4, the joint reduction of VOCs and NOx emissions with the VOCs/NOx reduction ratio larger than 1:1 would be conducive to ozone mitigation in the YRD region. The report on the Ministry of Ecology and Environment of China has shown that 90th percentile of MDA8 ozone concentrations in the YRD region has decreased by 10.6% from 2017 to 2020. In November 2021 (https://www.mee.gov.cn/zcwj/zyygwj/), the Chinese government has put forward specific requirements for ozone control to reduce anthropogenic VOCs and NOx emissions by 10% by 2025 compared with 2020. The ozone concentration in the YRD would further show a decline by 2025, especially from May to September. However, ozone concentrations are likely to continue to rise in October, especially when weather conditions are unfavorable and regional and long-range transport are significant.
Our study may provide a scientific base for guiding effective control strategies for ozone pollution. In the present study, we evaluated the ozone sensitivity to only anthropogenic precursor emissions in a monthly time scale, which may not meet the requirements of controlling daily maximum ozone concentrations due to the strong nonlinear relationship between ozone and its precursors. NOx emissions are mainly from vehicles, industry, and power plants, while VOCs emissions are from solvent use, industry, vehicles, and residences. Future studies include the ozone sensitivity to precursor emissions from different emission sectors and ozone sensitivity on daily or hourly bases under different weather patterns would be more valuable for emission mitigation measures.
Data Availability Statement
The original contributions presented in the study are included in the article/Supplementary Material, further inquiries can be directed to the corresponding author.
Author Contributions
Conceptualization, methodology, writing—review and editing, and supervision: Y-HM; formal analysis, writing—original draft, and visualization: SY; data curation: YS; conceptualization: HL and NL.
Funding
This work was supported by the National Key Research and Development Plan (2018YFC0213800) and the China Postdoctoral Science Foundation (2017M620218, 2018T110526).
Conflict of Interest
The authors declare that the research was conducted in the absence of any commercial or financial relationships that could be construed as a potential conflict of interest.
Publisher’s Note
All claims expressed in this article are solely those of the authors and do not necessarily represent those of their affiliated organizations, or those of the publisher, the editors, and the reviewers. Any product that may be evaluated in this article, or claim that may be made by its manufacturer, is not guaranteed or endorsed by the publisher.
Acknowledgments
The GEOS-Chem model is managed by the Atmospheric Chemistry Modeling group at Harvard University with support from the NASA ACMAP program.
Supplementary Material
The Supplementary Material for this article can be found online at: https://www.frontiersin.org/articles/10.3389/fenvs.2022.864897/full#supplementary-material
References
Amos, H. M., Jacob, D. J., Holmes, C. D., Fisher, J. A., Wang, Q., Yantosca, R. M., et al. (2012). Gas-particle Partitioning of Atmospheric Hg(II) and its Effect on Global Mercury Deposition. Atmos. Chem. Phys. 12, 591–603. doi:10.5194/acp-12-591-2012
An, J., Zou, J., Wang, J., Lin, X., and Zhu, B. (2015). Differences in Ozone Photochemical Characteristics between the Megacity Nanjing and its Suburban Surroundings, Yangtze River Delta, China. Environ. Sci. Pollut. Res. 22, 19607–19617. doi:10.1007/s11356-015-5177-0
Auvray, M., and Bey, I. (2005). Long-range Transport to Europe: Seasonal Variations and Implications for the European Ozone Budget. J. Geophys. Res. 110, D11303. doi:10.1029/2004JD005503
Bell, M. L., Peng, R. D., and Dominici, F. (2006). The Exposure-Response Curve for Ozone and Risk of Mortality and the Adequacy of Current Ozone Regulations. Environ. Health Perspect. 114, 532–536. doi:10.1289/ehp.8816
Bey, I., Jacob, D. J., Yantosca, R. M., Logan, J. A., Field, B. D., Fiore, A. M., et al. (2001). Global Modeling of Tropospheric Chemistry with Assimilated Meteorology: Model Description and Evaluation. J. Geophys. Res. 106, 23073–23095. doi:10.1029/2001jd000807
Ding, D., Xing, J., Wang, S., Chang, X., and Hao, J. (2019). Impacts of Emissions and Meteorological Changes on China's Ozone Pollution in the Warm Seasons of 2013 and 2017. Front. Environ. Sci. Eng. 13, 1–9. doi:10.1007/s11783-019-1160-1
Emery, C., Liu, Z., Russell, A. G., Odman, M. T., Yarwood, G., and Kumar, N. (2017). Recommendations on Statistics and Benchmarks to Assess Photochemical Model Performance. J. Air Waste Manage. Assoc. 67, 582–598. doi:10.1080/10962247.2016.1265027
Gao, J., Zhu, B., Xiao, H., Kang, H., Hou, X., and Shao, P. (2016). A Case Study of Surface Ozone Source Apportionment during a High Concentration Episode, under Frequent Shifting Wind Conditions over the Yangtze River Delta, China. Sci. Total Environ. 544, 853–863. doi:10.1016/j.scitotenv.2015.12.039
Gao, W., Tie, X., Xu, J., Huang, R., Mao, X., Zhou, G., et al. (2017). Long-term Trend of O3 in a Mega City (Shanghai), China: Characteristics, Causes, and Interactions with Precursors. Sci. Total Environ. 603-604, 425–433. doi:10.1016/j.scitotenv.2017.06.099
Gong, C., Liao, H., Zhang, L., Yue, X., Dang, R., and Yang, Y. (2020). Persistent Ozone Pollution Episodes in North China Exacerbated by Regional Transport. Environ. Pollut. 265, 115056. doi:10.1016/j.envpol.2020.115056
Guenther, A. B., Jiang, X., Heald, C. L., Sakulyanontvittaya, T., Duhl, T., Emmons, L. K., et al. (2012). The Model of Emissions of Gases and Aerosols from Nature Version 2.1 (MEGAN2.1): An Extended and Updated Framework for Modeling Biogenic Emissions. Geosci. Model. Dev. 5, 1471–1492. doi:10.5194/gmd-5-1471-2012
Guo, H., Chen, K., Wang, P., Hu, J., Ying, Q., Gao, A., et al. (2019). Simulation of Summer Ozone and its Sensitivity to Emission Changes in China. Atmos. Pollut. Res. 10, 1543–1552. doi:10.1016/j.apr.2019.05.003
Holtslag, A. A. M., and Boville, B. A. (1993). Local versus Nonlocal Boundary-Layer Diffusion in a Global Climate Model. J. Clim. 6, 1825–1842. doi:10.1175/1520-0442(1993)006<1825:lvnbld>2.0.co;2
Jin, X., and Holloway, T. (2015). Spatial and Temporal Variability of Ozone Sensitivity over China Observed from the Ozone Monitoring Instrument. J. Geophys. Res. Atmos. 120, 7229–7246. doi:10.1002/2015jd023250
Kanaya, Y., Pochanart, P., Liu, Y., Li, J., Tanimoto, H., Kato, S., et al. (2009). Rates and Regimes of Photochemical Ozone Production over Central East China in June 2006: A Box Model Analysis Using Comprehensive Measurements of Ozone Precursors. Atmos. Chem. Phys. 9, 7711–7723. doi:10.5194/acp-9-7711-2009
Keller, C. A., Long, M. S., Yantosca, R. M., Da Silva, A. M., Pawson, S., and Jacob, D. J. (2014). HEMCO v1.0: A Versatile, ESMF-Compliant Component for Calculating Emissions in Atmospheric Models. Geosci. Model. Dev. 7, 1409–1417. doi:10.5194/gmd-7-1409-2014
Krupa, S. V., and Manning, W. J. (1988). Atmospheric Ozone: Formation and Effects on Vegetation. Environ. Pollut. 50, 101–137. doi:10.1016/0269-7491(88)90187-X
Kuhns, H., Knipping, E. M., and Vukovich, J. M. (2005). Development of a United States-Mexico Emissions Inventory for the Big Bend Regional Aerosol and Visibility Observational (BRAVO) Study. J. Air Waste Manage. Assoc. 55, 677–692. doi:10.1080/10473289.2005.10464648
Li, K., Jacob, D. J., Liao, H., Shen, L., Zhang, Q., and Bates, K. H. (2019). Anthropogenic Drivers of 2013-2017 Trends in Summer Surface Ozone in China. Proc. Natl. Acad. Sci. U.S.A. 116, 422–427. doi:10.1073/pnas.1812168116
Li, K., Chen, L., Ying, F., White, S. J., Jang, C., Wu, X., et al. (2017). Meteorological and Chemical Impacts on Ozone Formation: A Case Study in Hangzhou, China. Atmos. Res. 196, 40–52. doi:10.1016/j.atmosres.2017.06.003
Li, L., An, J., Huang, L., Yan, R., Huang, C., and Yarwood, G. (2019). Ozone Source Apportionment over the Yangtze River Delta Region, China: Investigation of Regional Transport, Sectoral Contributions and Seasonal Differences. Atmos. Environ. 202, 269–280. doi:10.1016/j.atmosenv.2019.01.028
Li, L., Xie, F., Li, J., Gong, K., Xie, X., Qin, Y., et al. (2021). Diagnostic Analysis of Regional Ozone Pollution in Yangtze River Delta, China: A Case Study in Summer 2020. Sci. Total Environ. 812, 151511. doi:10.1016/j.scitotenv.2021.151511
Li, M., Wang, T., Shu, L., Qu, Y., Xie, M., Liu, J., et al. (2021). Rising Surface Ozone in China from 2013 to 2017: A Response to the Recent Atmospheric Warming or Pollutant Controls? Atmos. Environ. 246, 118130. doi:10.1016/j.atmosenv.2020.118130
Li, M., Zhang, Q., Kurokawa, J.-i., Woo, J.-H., He, K., Lu, Z., et al. (2017). MIX: A Mosaic Asian Anthropogenic Emission Inventory under the International Collaboration Framework of the MICS-Asia and HTAP. Atmos. Chem. Phys. 17, 935–963. doi:10.5194/acp-17-935-2017
Liang, X., Sun, X., Xu, J., and Ye, D. (2020). Improved Emissions Inventory and VOCs Speciation for Industrial OFP Estimation in China. Sci. Total Environ. 745, 140838. doi:10.1016/j.scitotenv.2020.140838
Lin, J.-T., and McElroy, M. B. (2010). Impacts of Boundary Layer Mixing on Pollutant Vertical Profiles in the Lower Troposphere: Implications to Satellite Remote Sensing. Atmos. Environ. 44, 1726–1739. doi:10.1016/j.atmosenv.2010.02.009
Lin, J.-T., Wuebbles, D. J., and Liang, X.-Z. (2008). Effects of Intercontinental Transport on Surface Ozone over the United States: Present and Future Assessment with a Global Model. Geophys. Res. Lett. 35, L02805. doi:10.1029/2007GL031415
Liu, F., Beirle, S., Zhang, Q., van der A, R. J., Zheng, B., Tong, D., et al. (2017). NOx Emission Trends over Chinese Cities Estimated from OMI Observations during 2005 to 2015. Atmos. Chem. Phys. 17, 9261–9275. doi:10.5194/acp-17-9261-2017
Liu, H., Jacob, D. J., Bey, I., and Yantosca, R. M. (2001). Constraints from210Pb and7Be on Wet Deposition and Transport in a Global Three-Dimensional Chemical Tracer Model Driven by Assimilated Meteorological fields. J. Geophys. Res. 106, 12109–12128. doi:10.1029/2000JD900839
Lu, H., Lyu, X., Cheng, H., Ling, Z., and Guo, H. (2019). Overview on the Spatial-Temporal Characteristics of the Ozone Formation Regime in China. Environ. Sci. Process. Impacts 21, 916–929. doi:10.1039/c9em00098d
Lu, X., Hong, J., Zhang, L., Cooper, O. R., Schultz, M. G., Xu, X., et al. (2018). Severe Surface Ozone Pollution in China: A Global Perspective. Environ. Sci. Technol. Lett. 5, 487–494. doi:10.1021/acs.estlett.8b00366
Lu, X., Zhang, L., Chen, Y., Zhou, M., Zheng, B., Li, K., et al. (2019). Exploring 2016-2017 Surface Ozone Pollution over China: Source Contributions and Meteorological Influences. Atmos. Chem. Phys. 19, 8339–8361. doi:10.5194/acp-19-8339-2019
Lu, X., Zhang, L., Wang, X., Gao, M., Li, K., Zhang, Y., et al. (2020). Rapid Increases in Warm-Season Surface Ozone and Resulting Health Impact in China since 2013. Environ. Sci. Technol. Lett. 7 (4), 240–247. doi:10.1021/acs.estlett.0c00171
Ma, T., Duan, F., He, K., Qin, Y., Tong, D., Geng, G., et al. (2019). Air Pollution Characteristics and Their Relationship with Emissions and Meteorology in the Yangtze River Delta Region during 2014-2016. J. Environ. Sci. 83, 8–20. doi:10.1016/j.jes.2019.02.031
Martin, R. V., Fiore, A. M., and Van Donkelaar, A. (2004). Space-based Diagnosis of Surface Ozone Sensitivity to Anthropogenic Emissions. Geophys. Res. Lett. 31, L06120. doi:10.1029/2004GL019416
McLinden, C. A., Olsen, S. C., Hannegan, B., Wild, O., Prather, M. J., and Sundet, J. (2000). Stratospheric Ozone in 3-D Models: A Simple Chemistry and the Cross-Tropopause Flux. J. Geophys. Res. 105, 14653–14665. doi:10.1029/2000JD900124
NRC (1991). Rethinking the Ozone Problem in Urban and Regional Air Pollution. Washington, DC: The National Academies Press. doi:10.1016/0021-8502(93)90076-l
Seinfeld, J. H., and Pandis, S. N. (1998). From Air Pollution to Climate Change. Atmos. Chem. Phys. 1326, 429–443. doi:10.1080/00139157.1999.10544295
Su, F., Xu, Q., Wang, K., Yin, S., Wang, S., Zhang, R., et al. (2021). On the Effectiveness of Short-Term Intensive Emission Controls on Ozone and Particulate Matter in a Heavily Polluted Megacity in central China. Atmos. Environ. 246, 118111. doi:10.1016/j.atmosenv.2020.118111
Sun, L., Xue, L., Wang, Y., Li, L., Lin, J., Ni, R., et al. (2019). Impacts of Meteorology and Emissions on Summertime Surface Ozone Increases over central Eastern China between 2003 and 2015. Atmos. Chem. Phys. 19, 1455–1469. doi:10.5194/acp-19-1455-2019
Tang, G., Zhu, X., Xin, J., Hu, B., Song, T., Sun, Y., et al. (2017). Modelling Study of Boundary-Layer Ozone over Northern China - Part I: Ozone Budget in Summer. Atmos. Res. 187, 128–137. doi:10.1016/j.atmosres.2016.10.017
van der Werf, G. R., Randerson, J. T., Giglio, L., Van Leeuwen, T. T., Chen, Y., Rogers, B. M., et al. (2017). Global Fire Emissions Estimates during 1997-2016. Earth Syst. Sci. Data 9, 697–720. doi:10.5194/essd-9-697-2017
Wang, M., Chen, W., Zhang, L., Qin, W., Zhang, Y., Zhang, X., et al. (2020). Ozone Pollution Characteristics and Sensitivity Analysis Using an Observation-Based Model in Nanjing, Yangtze River Delta Region of China. J. Environ. Sci. 93, 13–22. doi:10.1016/j.jes.2020.02.027
Wang, N., Lyu, X., Deng, X., Huang, X., Jiang, F., and Ding, A. (2019). Aggravating O3 Pollution Due to NOx Emission Control in Eastern China. Sci. Total Environ. 677, 732–744. doi:10.1016/j.scitotenv.2019.04.388
Wei, W., Li, Y., Ren, Y., Cheng, S., and Han, L. (2019). Sensitivity of Summer Ozone to Precursor Emission Change over Beijing during 2010-2015: A WRF-Chem Modeling Study. Atmos. Environ. 218, 116984. doi:10.1016/j.atmosenv.2019.116984
Wesely, M. L. (1989). Parameterization of Surface Resistances to Gaseous Dry Deposition in Regional-Scale Numerical Models. Atmos. Environ. (1967) 23, 1293–1304. doi:10.1016/0004-6981(89)90153-4
Wu, R., Bo, Y., Li, J., Li, L., Li, Y., and Xie, S. (2016). Method to Establish the Emission Inventory of Anthropogenic Volatile Organic Compounds in China and its Application in the Period 2008-2012. Atmos. Environ. 127, 244–254. doi:10.1016/j.atmosenv.2015.12.015
Xiao, Y., Logan, J. A., Jacob, D. J., Hudman, R. C., Yantosca, R., and Blake, D. R. (2008). Global Budget of Ethane and Regional Constraints on U.S. Sources. J. Geophys. Res. 113, D21306. doi:10.1029/2007jd009415
Xing, J., Wang, S. X., Jang, C., Zhu, Y., and Hao, J. M. (2011). Nonlinear Response of Ozone to Precursor Emission Changes in China: A Modeling Study Using Response Surface Methodology. Atmos. Chem. Phys. 11, 5027–5044. doi:10.5194/acp-11-5027-2011
Xu, J., Huang, X., Wang, N., Li, Y., and Ding, A. (2021). Understanding Ozone Pollution in the Yangtze River Delta of Eastern China from the Perspective of Diurnal Cycles. Sci. Total Environ. 752, 141928. doi:10.1016/j.scitotenv.2020.141928
Xu, Z., Huang, X., Nie, W., Chi, X., Xu, Z., Zheng, L., et al. (2017). Influence of Synoptic Condition and holiday Effects on VOCs and Ozone Production in the Yangtze River Delta Region, China. Atmos. Environ. 168, 112–124. doi:10.1016/j.atmosenv.2017.08.035
Xue, L. K., Wang, T., Gao, J., Ding, A. J., Zhou, X. H., Blake, D. R., et al. (2014). Ground-level Ozone in Four Chinese Cities: Precursors, Regional Transport and Heterogeneous Processes. Atmos. Chem. Phys. 14, 13175–13188. doi:10.5194/acp-14-13175-2014
Yang, L., Yuan, Z., Luo, H., Wang, Y., Xu, Y., Duan, Y., et al. (2021). Identification of Long-Term Evolution of Ozone Sensitivity to Precursors Based on Two-Dimensional Mutual Verification. Sci. Total Environ. 760, 143401. doi:10.1016/j.scitotenv.2020.143401
Yu, Y., Wang, Z., He, T., Meng, X., Xie, S., and Yu, H. (2019). Driving Factors of the Significant Increase in Surface Ozone in the Yangtze River Delta, China, during 2013-2017. Atmos. Pollut. Res. 10, 1357–1364. doi:10.1016/j.apr.2019.03.010
Zhang, K., Li, L., Huang, L., Wang, Y., Huo, J., Duan, Y., et al. (2020). The Impact of Volatile Organic Compounds on Ozone Formation in the Suburban Area of Shanghai. Atmos. Environ. 232, 117511. doi:10.1016/j.atmosenv.2020.117511
Zheng, B., Tong, D., Li, M., Liu, F., Hong, C., Geng, G., et al. (2018). Trends in China's Anthropogenic Emissions since 2010 as the Consequence of Clean Air Actions. Atmos. Chem. Phys. 18, 14095–14111. doi:10.5194/acp-18-14095-2018
Zheng, B., Zhang, Q., Geng, G., Chen, C., Shi, Q., Cui, M., et al. (2021). Changes in China's Anthropogenic Emissions and Air Quality during the COVID-19 Pandemic in 2020. Earth Syst. Sci. Data 13, 2895–2907. doi:10.5194/essd-13-2895-2021
Keywords: ozone, precursor emissions, VOCs/NOx, source contribution, Yangtze River Delta
Citation: Mao Y-H, Yu S, Shang Y, Liao H and Li N (2022) Response of Summer Ozone to Precursor Emission Controls in the Yangtze River Delta Region. Front. Environ. Sci. 10:864897. doi: 10.3389/fenvs.2022.864897
Received: 29 January 2022; Accepted: 11 March 2022;
Published: 07 April 2022.
Edited by:
Qiyuan Wang, Institute of Earth Environment, (CAS), ChinaReviewed by:
Peng Wang, The Hong Kong Polytechnic University, ChinaHaofei Yu, University of Central Florida, United States
Copyright © 2022 Mao, Yu, Shang, Liao and Li. This is an open-access article distributed under the terms of the Creative Commons Attribution License (CC BY). The use, distribution or reproduction in other forums is permitted, provided the original author(s) and the copyright owner(s) are credited and that the original publication in this journal is cited, in accordance with accepted academic practice. No use, distribution or reproduction is permitted which does not comply with these terms.
*Correspondence: Yu-Hao Mao, eWhtYW9AbnVpc3QuZWR1LmNu