 Xiaowen Dai
 Yi Chen
 Xin Wu
 Yanqiu He
 Fang Wang
- 1Sichuan Center for Rural Development Research, Sichuan Agricultural University, Ya’an, China
- 2College of Management, Sichuan Agricultural University, Sichuan, China
In recent years, with the frequent occurrence of global climate problems, China has paid great attention to sustainable development and ecological environment governance. Sichuan Province is a significant grain production and a reserve base in western China, and its sustainable development in agriculture is an important foundation for the healthy development of the regional agricultural economy and food security. In this study, we divided the agricultural production land in Sichuan into cultivated land, water area, grassland, and forest land. We used the ecological footprint method to investigate the ecological footprint and the carrying capacity of agriculture in Sichuan comprehensively. We conclude that 1) generally, the overall agricultural ecosystem in Sichuan has been in a state of ecological surplus for the past 20 y, and the environmental pressure is gradually decreasing. However, the development within the ecosystem is uneven. 2) In terms of subdivision, the cultivated land, forest land, and water area in Sichuan have always been in a state of ecological surplus, but the grassland is in an ecological deficit state. In terms of the trend, the ecological status of cultivated land has declined significantly, while the forest land has gradually improved, and the water area is relatively stable. Yet, the deficit of grassland is still severe. 3) Forest land is considered the most sustainable type and has a high resource utilization rate all the time, followed by water area, cultivated land, and grassland, when measured by ecological indicators. At the same time, in terms of the coordination between economy and ecology, all lands have been improved.
1 Introduction
Agriculture is a nation’s fundamental base and a prerequisite for people to live in peace and social stability. The sustainable development of the agricultural ecosystem determines the quality of the agricultural economy. To a certain extent, agricultural sustainability determines the sustainable development of a nation and human society. China is a traditional agricultural country, and the government has always attached importance to agricultural development. From 2004, the No.1 document from the Central Committee of the Communist Party of China (CCCPC) has worked in rural areas for 18 y, which stresses efforts to maintain a healthy and stable development of agriculture. In China’s 14th Five-Year Plan and 2035 long-Term goals, the Chinese government plans to comprehensively push forward rural revitalization and improve the quality and stability of ecosystems to achieve sustainable agricultural development.
Agricultural sustainability is closely related to environmental sustainability. The global discussion on environmental sustainability mainly focuses on how to reduce greenhouse gases and solve climate problems, such as adjusting fiscal policy (Chishti, 2021), suppressing CO2 emissions from the transport sector (Rehman et al., 2021a), developing renewable energy and adjusting the energy system (Rehman et al., 2021b; Murshed et al., 2021), and controlling international trade (Rehman et al., 2021c; Hussain and Rehman, 2021; Weimin et al., 2021). During the China’s 14th Five-Year Plan period, achieving carbon peak and carbon neutrality goals was an important goal and vision for various social and economic activities in various industries. The “double carbon” goal is a representative of China’s environmental sustainability. As the only industry that can both absorb and also emit GHG, the role of agriculture in achieving the goal of environmental sustainability cannot be underestimated. However, studies so far have shown that environmental sustainability, represented by carbon emission reduction and agricultural sustainability, has not shown a two-way positive effect. On the one hand, the accumulation of carbon dioxide in the atmosphere has surged due to various human activities such as deforestation and agriculture. Rapidly growing agriculture and agricultural mechanization have led to a substantial increase in global energy use and carbon dioxide emissions (Rehman et al., 2021d; Rogers, 2014). Crop production hinders CO2 emissions in both the long and short terms (Rehman et al., 2021e; Rehman et al., 2021f), whereas forestry production has a constructive effect on CO2 emissions (Henderson et al., 2021), the forestry carbon sink is also a key industry for the achievement of the overall carbon neutrality goal (Apb et al., 2021). On the other hand, the massive emission of GHG leads to global warming, and the generation of extreme weather, which will adversely affect agricultural production and sustainable agricultural development, such as deforestation and land degradation (Havlik et al., 2014; Rehman et al., 2021g). Agricultural GHG emission reduction is an important starting point for sustainable agricultural development. Sustainable agricultural development is an important way to achieve the goal of carbon neutrality, that is, environmental sustainability, and an important part for the construction of ecological civilization. In this context, the scientific assessment of the sustainable development potential of agriculture will provide the basis for agricultural GHG emission reduction, carbon neutrality goals, and green development.
The ecological footprint model examines the resilience of the ecological environment from the perspective of ecosystem carrying capacity (ECC). The concept of the ecological footprint (EF) was first proposed by a Canadian ecologist William Rees in 1992. With the continuous efforts of scholars, the ecological footprint model has been matured. Compared to sustainable evaluation methods such as the energy analysis method and the comprehensive evaluation method of the index system, the ecological footprint method has simple characteristics and strong operability and is one of the powerful tools for testing sustainability. It is widely recognized and applied. The scope of research using the ecological footprint method to study sustainability issues is extremely wide. Wackernagel and Rees (1997) first applied the ecological footprint model for the study of ecological sustainability in 52 countries and regions around the world (Wackernagel and Rees, 1997). Since then, the ecological footprint model has been extensively used as an essential research tool and analysis framework in sustainable development (Korkut, 2021; Ojonugwa et al., 2021; Umit, 2021; Zahid et al., 2021), socioeconomic development (Neagu, 2020; Enu and Sya, 2021), tourism development (Mehdi et al., 2012; Lin et al., 2017), and energy consumption (Sharma et al., 2021; Ullah et al., 2021). The application of the ecological footprint method in agriculture is divided into two parts: one is the impact of different agricultural production management methods on the agricultural environment, such as land use and farm management (Viglizzo et al., 2011, Hayo et al., 2007), and the second is to evaluate the sustainable utilization of agricultural resources such as water resources and arable land resources, combining the agricultural water footprint (Hoekstra et al., 2011; Wang et al., 2014), agricultural carbon footprint (Maier et al., 2017; Li et al., 2018), and crop footprint (Ferng, 2011; Budreski et al., 2016). In the ecological footprint study of China’s agriculture, researchers, respectively, measured the ecological footprint and carrying capacity per capita of cultivated land, water area, grassland, and forest land in Henan (Cao, 2020), Guangxi (Zhang, 2020), and Shandong provinces (Yang et al., 2016), and all the studies found that the provinces have different degrees of ecological deficits. As for the research on the ecological situation of Sichuan, there are differences among scholars. Some scholars believe that both the EF and ECC of Sichuan are increasing, but ECC is always lower than EF, showing an ecological deficit (Qiu and Guang, 2015), but some scholars hold the opposite view (Zhao et al., 2019).
To sum up, research show that the China’s regional agro-ecological situation is not optimistic. With the rapid development of the agricultural economy driven by agricultural modernization, the agricultural environment inevitably has been affected negatively. In the application of research methods, the application of the ecological footprint model is relatively mature and extensive, but the research on the sustainable development of agricultural land, forest land, grassland, and water area in the field of agriculture is lacking. At the same time, there are many pieces of research on the estimation of EF and ECC, but only less research related evaluation indicators.
Sichuan is a significant grain production and storage base in western China. The sustainable development of agriculture in this region plays an important role in ensuring the sustainable development of agriculture for the whole nation. However, there are only a few studies and reports on the agricultural sustainability of Sichuan, and existing studies are still inconsistent. Therefore, we choose the environmental carrying capacity perspective as a clue for this research. On one hand, we use the ecological footprint model to measure the EF and ECC of the four land types. Then, three sustainability evaluation indicators are calculated to classify the status and grade of those four types of land. Based on these studies, it is hoped that we can provide a reference for the healthy development of agriculture for Sichuan in the future and the regions that have similar conditions.
2 Methods and Data
2.1 Study Area Introduction and Data Source
2.1.1 Study Area Introduction
Sichuan is located in inland southwest China. It has a vast territory, a large population, rich natural resources, a superior geographical environment, good natural conditions, and a wide variety of crops. It is also one of the important commodity grain bases in China. Sichuan is a typical agricultural province and a province with a large population. Its agricultural production value ranks among the top five in China for many years. In 2019, the total population of Sichuan accounted for 6.7% of the national population, and the rural population of Sichuan Province accounted for 46.21% of the permanent population. At the same time, as the main water source and supply area in the upstream area of the Yangtze River, Sichuan’s ecological situation directly affects the ecological state of the Yangtze River basin, especially, the ecological environment of the downstream area of the Yangtze River. With the advancement of agricultural development, the ECC and EF of Sichuan are gradually increasing (Qiu and Guang, 2015). How to protect the ecological environment of agriculture, and improve the quality of agriculture, is of great significance for the sustainable development of agriculture across the country.
2.1.2 Data Source
All the data used in this research are from the Sichuan Provincial Statistical Yearbook1, China Statistical Yearbook2, and Sichuan Yearbook3 from 2001 to 2020. The missing data of some years are supplemented by employing imputation. The data of the world’s average production capacity of agricultural consumption projects are from the global average production capacity of different land types, which are released by the World Wildlife Fund (WWF) in 2005.
2.2 Methods Introduction
2.2.1 Calculation of Agricultural Ecological Footprint and Ecological Carrying Capacity
The calculation of EF is carried out in different types, as for agriculture, it can be divided into cultivated land, water area, forest land, and grassland (Yang et al., 2016; Cao, 2020; Zhang, 2020), and based on the classification Table 1, the ecological carrying capacity per capita (ECC) and the ecological footprint per capita (EF) can be calculated accordingly.
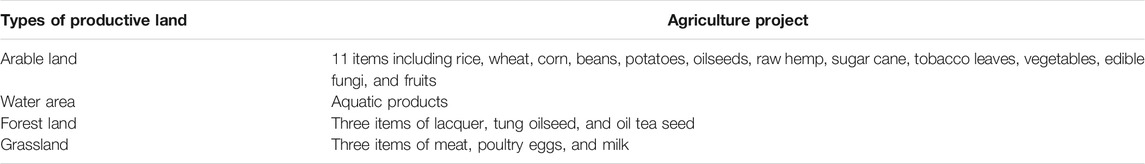
TABLE 1. Classifications of agricultural projects of four types of productive land.
ECC represents the maximum number of people that can be supported by limited resources in a region without compromising regional productivity. It can be expressed by Formula 1 as follows (Cao, 2020):
In Formula 1,
After obtaining the ECC, we further carried out the calculation of the EF. The carbon footprint expresses the amount of GHG brought by human activities, and the EF can further measure the impact of GHG on the environment. The EF also represents the size of land with biological productivity that is needed to maintain the survival of a person, a city, a country, or all human beings and can absorb emissions from human activities. It reflects the sustainable development ability of the human economy and society. The higher the EF value, the more serious is the human damage to the ecosystem. The EF (Cao YP, 2020) can be expressed by Formula 2 as follows:
In Formula 2,
When the EF is greater than the ECC, it is an ecological deficit status, and this also means that the socioeconomic development of the region is in an unsustainable state. Otherwise, it is an ecological surplus status, which means the regional production and consumption activities have not exceeded the ecosystem’s carrying capacity. The ecological surplus or deficit (Cao YP, 2020) can be expressed by the following formula:
In Formula 3,
2.2.2 Calculation of Sustainable Development Evaluation Index
2.2.2.1 Ecological Footprint Index
Ecological footprint index (EFI) (Wu, 2005) is one of the indexes to assess sustainability; it can be divided into four levels, and the specific calculation formula and classification are shown in Formula 4 and Table 2.
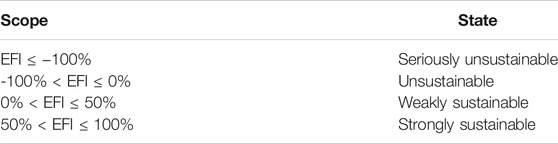
TABLE 2. Classification of EFI.
2.2.2.2 Ecological Pressure Index
Ecological pressure index (EPI) (Wang et al., 2018) represents the ecological environment pressure capacity, and it usually has six levels. The specific calculation formula and classification are shown in Formula 5 and Table 3.
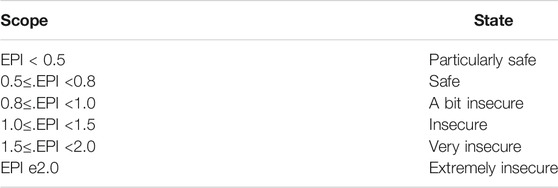
TABLE 3. Classification of EPI.
2.2.2.3 Ten Thousand Yuan GDP Ecological Footprint (WEFI)
The EF per 10,000 yuan of GDP represents the ecological footprint occupied by residents producing 10,000 yuan of GDP (Haber et al., 2004). The larger the value, the lower the efficiency of resource utilization, and vice versa. The calculation formula is as (6).
3 Analysis of the Results
3.1 Calculation and Evaluation of Agricultural Ecological Carrying Capacity
3.1.1 Overall Evaluation of Agricultural Ecosystem
Through the calculation of EF and ECC, we found that the agricultural ecosystem in Sichuan Province was in good condition from 2000 to 2019, and the ECC has increased. The increased population has not affected the EF significantly, and the agricultural ecosystem has strong sustainable development capabilities. The agricultural ecosystem of Sichuan Province was always in an ecological surplus during the study period. The lowest surplus year was 2005, which was 0.23 hm2/p, and the highest surplus year was 2000, which was 0.33 hm2/p. The total ECC showed a trend of decline first and then uprising. The total carrying capacity stabilized at 4,755.42 hm2 before 2008 and fell back to 4,641.72 hm2 from 2009 to 2013. After 2013, it remained above the level of 5,200 hm2. At the same time, the ECCC is similar to the total ECC, which dropped from 0.59 hm2/p in 2,000 to hm2/p in 2013, and then began to rise in 2014 and reached 0.62 hm2/p in 2019.
The total EF showed a volatile, rising state. The total EF of Sichuan Province was below 2,500 hm2 before 2002. In the following years, the total EF of every year has exceeded 2,500 hm2 except 2019 and reached a maximum of 2,047 hm2 in 2016; meanwhile, the EFC also waved. From the period 2000–2005 and the period 2007–2017, the EFC has increased year after year, and significantly decreased in the period 2005–2006 and the period 2018–2019, and remained at 0.25–0.32 hm2/p as a whole. After decomposing the agricultural ecosystem, we found that four types of lands’ ecological footprint remain in the same structures, but has some changes in quantity Figure 1 and Figure 2. In the structure, the grassland has the largest proportion, accounting for more than half from 2000 to 2019, and the following are arable land, water area, and forest land, and the total rise of water area and forest land was below 2%. In quantity, grassland and the arable area had a big change from 2000 to 2019 compared with the water area and forest land; the grassland’s ecological footprint accounted 65.99% in 2000, but in 2019, it declined to 57.82%; however, the arable land’s ecological footprint increased from 33.26% in 2000 to 40.34% in 2019. In other words, the damages caused by the agricultural production declined in grassland but increased in arable land.
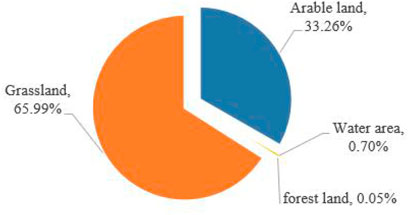
FIGURE 1. Ecological footprint of Sichuan agricultural system in 2000.
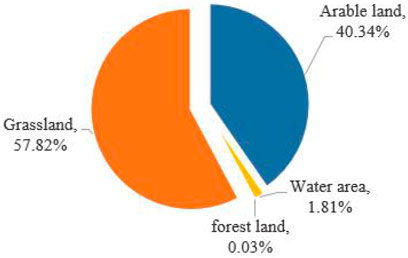
FIGURE 2. Ecological footprint of Sichuan agricultural system in 2019.
3.1.2 Evaluation of Different Land Types
During the study period, all types of agricultural bio-productive land were maintained at a high ecological surplus except the grassland. The grassland has continued to be in an ecological deficit state from 2000 to 2019, and the situation was very serious with a tendency to deteriorate. From 2000 to 2008, sorting according to the amount of ecological surplus has the following relationship: arable land > forest land >> water area. After 2009, the ecological surplus of forest land exceeds compared to arable land, the sorting changes to forest land > cultivated land >> water area.
3.1.2.1 Evaluation of Sustainability of Cultivated Land
In Figure 3 from 2000 to 2019, the overall ECC of Sichuan’s arable land showed a trend of decline first and then uprising, and the ECCC also had the same trend. The overall ECC of arable land began to drop from 2,767.04 hm2 in 2000 to 2,452.63 hm2 in 2009 and remained at a low level until 2013, then began to increase in 2014 and rise to 2,759.81 hm2 until 2019. During the study period, the ECCC of arable land was between 0.30 and 0.34 hm2/p and the EFC was between 0.08 and 0.12 hm2/p and was increasing gradually. The ESC of arable land was between 0.19 and 0.27 hm2/p. The ESC in 2019 was 17.21%, which was lower than that in 2000.
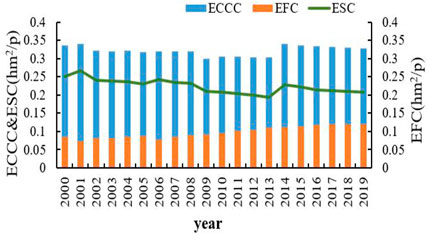
FIGURE 3. 2000–2019 ECCC, EFC, and ESC of cultivated land in Sichuan province.
According to the statistical data from the National Bureau of Statistics, the size of arable land showed a trend of decrease first and then increase from 2000 to 2019, and the size of arable land per capita faces the same trend. The total size of arable land dropped from 6.77 million hm2 in 2000 to 5.99 million hm2 in 2009 and then increased to 6.72 million hm2 in 2019, the fluctuation range of the changing trend is large. At the same time, the population increased from 82.35 million to 83.75 million between 2000 and 2019. During this period, the agricultural products output from arable land showed a significant downward trend. The consumption of crops, oils, and vegetables, which depend on arable land, showed a trend of volatility and decline during the period 2000–2019 with a decline of 28.93%. This also indirectly indicates that population growth does not cause a substantial increase in arable land agricultural products, and the decline in surplus of arable land in Sichuan has no direct relationship with the increased population.
We believe that the decline in the ecological surplus of arable land is mainly due to the arable land quality decrease caused by the increase in the use of pesticides, chemical fertilizers, and plastic membranes. From 2000 to 2019, pesticide usage in Sichuan showed a trend of increase first and then decrease. During the period, the maximum value was 0.62 Mt in 2010 and the minimum value was 0.46 Mt in 2019. Potash fertilizer and compound fertilizer are increasing year after year. The total amount of potash fertilizer used was raised from 0.1 Mt in 2000 to 0.17 Mt in 2019, and compound fertilizer increased from 0.38 Mt in 2000 to 0.60 Mt, the growth rate is 74 and 60.8%, respectively. The usage of plastic membrane increased from 0.73 Mt in 2000 to 0.13 Mt in 2016, and then slowly decreased to 0.12 Mt in 2019.
3.1.2.2 Sustainability Evaluation of Water Area
In Figure 4 the overall ECC of Sichuan’s water area showed a gradually increasing trend from 2000 to 2019, which is from 326.27 hm2 in 2000 to 389.75 hm2 in 2019. However, the ECCC kept declining from 2014 after fluctuations between 2000 and 2013. The ECCC of the water area showed an upward trend during the period 2000–2014, from 0.0396 to 0.0479 hm2/p, and it showed a downward trend during the period 2014–2019. The ECCC in 2019 was 0.0465 hm2/p. The overall EF has increased year after year, from 14.72 to 45.22 hm2, and the growth rate has more than doubled; the EFC has shown an upward trend, from 0.0018 to 0.0054 hm2/p from 2000 to 2019. Correspondingly, the ESC in the water area fluctuated from 2000 to 2013 and kept declining after a sudden increase in 2014. There are two main reasons for this status in the water area: 1) Sichuan is rich in water resources. There are nearly 1,400 large and small rivers in total in Sichuan Province. Sichuan’s water resource ranks second in the country in terms of total water resources and sixth in the country in terms of water resources per capita. By the end of 2019, the total surface water resources in Sichuan accounted for approximately 274.77 billion m3. The groundwater resources accounted for approximately 61.62 billion m3. The total water resources amounted to 274.89 billion m3, and water resource per capita is up to 3 288.9 m3. 2) On one hand, the protection of water bodies in Sichuan is very strict. On the other hand, the output and supply of aquatic products have gradually increased, but the demand for aquatic products from the people in Sichuan is relatively limited. Although the size of the water area has dropped from 1.09 to 1.04 million hm2 in the past decades, the government of Sichuan has always been vigorously protecting natural water bodies and advocating rational fishing. Through hard work, the problem of water pollution has been effectively addressed, and the output of aquatic products increased from 0.51 to 1.58 Mt from 2000 to 2019, and the growth rate is as high as 207.32%. Moreover, demand for aquatic products in Sichuan increased from 0.01 to 0.08 Mt, but the output of aquatic products is far greater than the consumption.
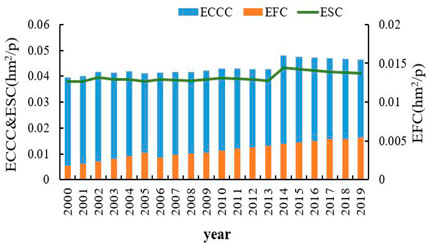
FIGURE 4. 2000–2019 ECCC, EFC, and ESC of waters areas in Sichuan province.
3.1.2.3 Evaluation of Sustainability of Forest Land
All indicators of forest land are showing an upward trend, yet, the gap between the ECCC and the EFC of forest land is the largest in four types of land. From the Figure 5 the ECCC of forest land is 1,500 to 3,600 times of the EFC, and the ESC is between 0.20 and 0.24 hm2/p. The increase of the forest land ES and the enhancement of ecological sustainability are mainly due to the effective implementation of the “Natural Forest Protection Project” and “Sloping Land Conversion Program” in Sichuan Province.
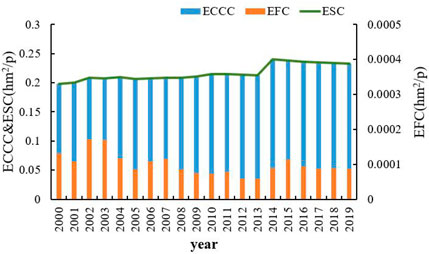
FIGURE 5. 2000–2019 ECCC, EFC, and ESC of forest land in Sichuan Province.
According to the published data (Mu, 2019), Sichuan Province started the pilot program of returning farmland to forest and grassland in 1999. In 2019, Sichuan has launched two rounds of returning farmland to forest and grassland with nearly 2.67 million acres, ranking third place in China, and the forest land distributed in 21 administrative areas includes 178 counties. With the help of the project, Sichuan’s long-term overloaded ecosystem is restored, and the area of forest and grass has expanded significantly. Statistics show that merely by returning farmland to forest, Sichuan’s forest coverage increased more than 4%. Due to the implementation of the project of returning farmland to forests and natural forest protection, the forest coverage rate reached 38.83%, which was 15.87% higher than the national average. In addition, thanks to these protection projects, Sichuan has achieved great efforts in water source protection, water and soil conservation, air quality improvement, and biodiversity restoration and maintenance. At the end of 2018, the Province’s conversion of water resources through the “Sloping Land Conversion Program” is 5.83 billion m3. Compared with 1998, the sediment content of the mainstream of the Yangtze River floating in Sichuan in 2018 has been reduced by 46%.
3.1.2.4 Evaluation of Grassland Sustainability
Grassland is the only land type in Sichuan Province that experienced an ecosystem deficit during the investigation period. From the Figure 6 the total ECC of grassland was gradually decreased, while the EF was increased year by year in the past decades. At the end of 2019, the EF of grassland was 1,445.04 hm2, yet the ECC of grassland was only 102.07 hm2. The ECCC of grassland in Sichuan fluctuated between 0.014 and 0.016 hm2/p from 2000 to 2013. Since 2014, the ECCC has begun to decrease, and the digit in 2019 was 0.12 hm2/p. Meanwhile, the EFC fluctuated between 0.17 and 0.21 hm2/p during the observing period, the maximum value of the EFC was 0.26 hm2/p in 2005. From 2000 to 2019, ecological deficit (ED) of grassland in Sichuan has been maintained above 0.15 hm2/p and reached a maximum value of 0.24 hm2/p in 2005.
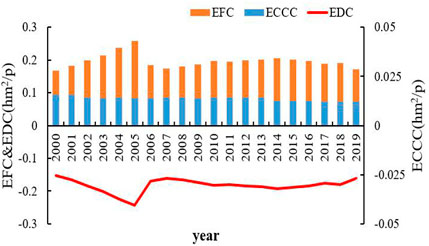
FIGURE 6. 2000–2019 ECCC, EFC, and EDC of grassland in Sichuan Province.
There are three main reasons for the serious deficit of the ECC of grassland in Sichuan: First, the size of grassland in Sichuan has been greatly reduced in the past decades. Statistically, during the period 2000–2019, the grassland area in Sichuan Province experienced a sharp decrease. The decrease rate researched was 20.34%, and the size of grassland shrunk from 15.3 million hm2 in 2000 to 12.21 million hm2 in 2019. Meanwhile, the population increased from 82.34 to 83.75 million, accordingly the grassland per capita dropped 0.19–0.15 hm2/p. Second, there is serious grassland degradation in northwestern Sichuan, which are present in diverse types and widely distributed. At the end of 2020, the total area of desertified land in Sichuan Province was 0.86 million hm2, the area of rocky desertification was 0.73 million hm2, and the area of arid and semi-arid areas was 1.34 million hm2; third is the continuous increase in demand for meat and egg products. The consumption of meat from 2000 to 2019 rose from 2.29 to 3.30 Mt, which was a 44.12% increase. The egg consumption increased from 303.86 to 754.59 Mt, which was 148.33%. The production of meat and dairy products relies on grassland, and the area of grassland is constantly declining, and the grassland degradation caused a gap between the supply and the demand of meat, dairy products, and other products rely on the grassland. These three reasons have jointly caused the continuous deficit of the grassland in Sichuan .
3.2 Calculation and Evaluation of Sustainability
From 2000 to 2019, the agriculture of Sichuan remains in a sustainable state, but according to the EFI and EPI, overall sustainability has declined. At the same time, there is an extremely unbalanced situation in the four lands. After all, the sustainable ability and environmental antipressure ability of forest land are the best, a little better than water area, but far better than arable land, and grassland is the worst. In terms of the ecological and economic coordination of the sub-industry, all lands are showing a downward trend, indicating that their resource utilization efficiency is improving, using relatively few resources, and producing relatively more economic benefits.
3.2.1 The Evaluation of Ecological Sustainability
As shown in Figures 7, 8, arable land, water area, and forest land are always strongly sustainable, and the EFI of the water area and forest land is close to 100% from 2000 to 2019, of which forest land has been very stable, and water land has a small drop. Arable land is between 63.30 and 74.80%, in keep falling. Then about grassland, it is the worst condition all the time, EFI is always below −1,000%. So, according to the rating, it is seriously unsustainable from 2000 to 2019.
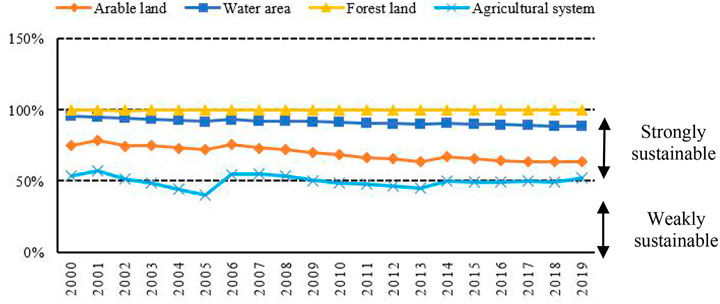
FIGURE 7. Trend chart of the EFI of arable land, water area, and forest land seriously unsustainable (EFI = −100%).
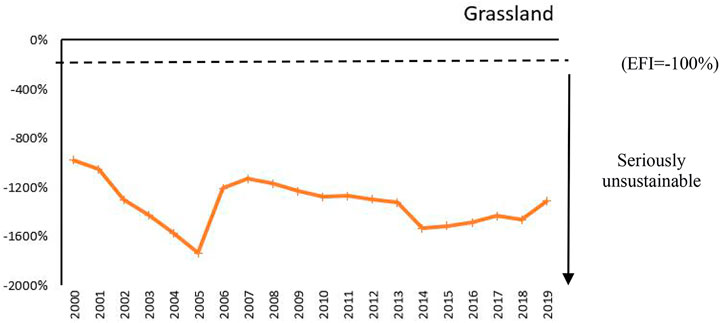
FIGURE 8. Trend map of the EFI of grassland.
Most of the time, all the systems are strongly sustainable in most years from 2000 to 2010. However, in the following 9 y, it has been in a weakly sustainable state for a long time, and the overall ecological situation has declined. In general, the overall sustainability status is fluctuating. The overall trend is to first decline, then rise, and then decline. The worst was 39.8% in 2005, and the best was 56.92% in 2001.
3.2.2 The Evaluation of Stress on the Ecological Environment
As shown in Figures 9, 10 the EPI of forest land is close to zero, meaning it almost has no danger. The EPI of the water area is a little higher than that of forest land and keeps increasing, below 0.12. Arable land has the same trend as water land, it increases to 0.367 in 2019. The first three types of land in particularly safe, yet grassland is extremely insecure in all studies, and EPI of grassland has been continuously rising from 2000 to 2005 and 2007 to 2015, and a comprehensive analysis of all land types and years shows that arable land, waters, and grassland have declined significantly from 2005 to 2006 during all the study periods.
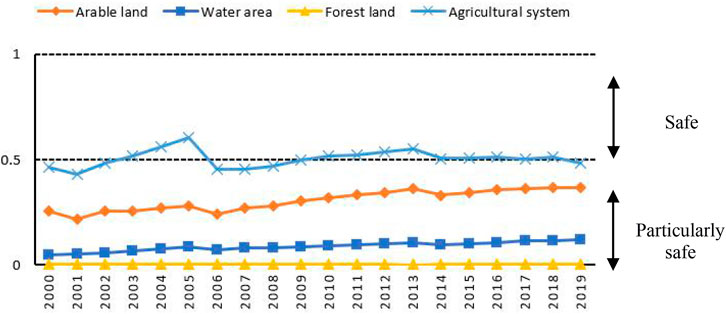
FIGURE 9. Trend map of EPI of cultivated land, water area, and forest land (EPI = 2).
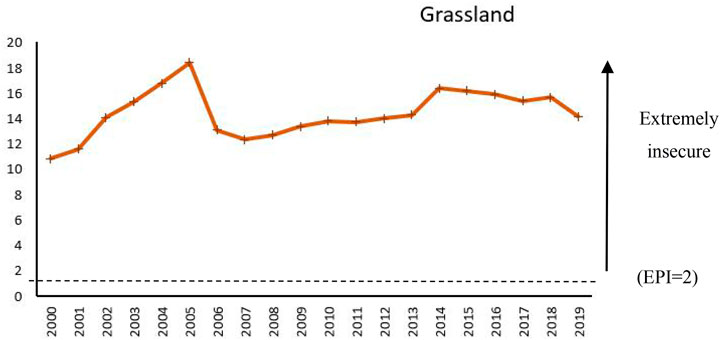
FIGURE 10. Trend map of grassland EPI extremely insecure.
Based on the analysis of the ecological resistance of the four types of land, we have also carried out corresponding calculations and analyses on the ecological carrying capacity of the overall agricultural ecosystem. The EPI from 2003 to 2005 and from 2010 to 2018 was higher than 0.5, and the situation deteriorated from 2003 to 2005 and from 2010 to 2014, the worst situation was 2005. On the whole, although Sichuan’s ecological antistress level fluctuates, the overall situation is relatively good. Among them, the situation of cultivated land and grassland needs attention, especially grassland.
3.2.3 The Evaluation of Resource Utilization
According to the Figure 11 during the study, arable land, water area, grassland, and the whole agricultural system are all in decline, forest land is not only the smallest but also the most stable one. In 2000, the WEFI of the four lands have a big difference, grassland is over 0.0002, and the other three lands are all below 0.001, from largest to smallest is arable land, water land, and forest land. Then in 2019, the order has not changed, but the gap has narrowed a lot. From the data, we can have a basic conclusion: the coordination of the ecological conditions and economic development of the four types of land is gradually improving, it also means that the utilization efficiency of agricultural resources in Sichuan Province has been continuously improved, and the production model has shifted from extensive to intensive.
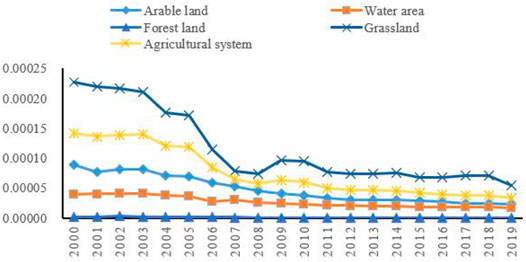
FIGURE 11. WEF of lands in Sichuan from 2000 to 2019.
4 Discussion
4.1 Comparison With Other Research
Different from previous studies, our research divides the agricultural system into four types: cultivated land, water area, forest land, and grassland. We conduct a detailed and in-depth study on the sustainability of those four types of productive land. The calculation of EF and ECC helped to analyze the ecological status of the four types of land. With the EFI, EPI, and WEFI, sustainability, the ability to withstand the ecological stress, and coordination with the economic development of the four types of land are investigated. These may provide a reference for other scholars’ research.
Due to the great differences in geographical location, resource conditions, and subsequent ecological protection measures, the ecological conditions of agricultural systems are different all over China. Among the traditional agricultural provinces, both Shandong and Henan are in a state of deteriorating ecological deficit, and Shandong is more severe than that of Henan Province (Zhang CJ, 2020, Yang J et al., 2016). After subdividing the land types, it is found that the deficit of cultivated land and grassland in Henan Province has increased, and the fluctuation of forest land and the water area is not obvious; the EF of cultivated land in Shandong Province accounts for the largest proportion, as high as 75%, and the quality of the overall agricultural system is determined by a large proportion of cultivated land quality. However, the EF of cultivated land, forest land, and water area in Sichuan Province is smaller than that of Henan and Shandong provinces, but the EF of grassland is larger than that of Henan. In the case of ECC, the situation is reversed. There is also research about Guangxi Province (Cao, 2020), also a western province in China. Comparing Sichuan with Guangxi, it is found that the cultivated land and forest land in Guangxi and Sichuan are both in ecological surplus, and the grasslands in both provinces are also in ecological deficit. The difference is that the water area in Guangxi is in deficit while Sichuan is in surplus. The ecological situation of cultivated land in Sichuan is not as good as that in Guangxi. The ecological surplus of forest land in Sichuan is similar to that in Guangxi, and the deficit of grassland in Guangxi is more serious than that in Sichuan.
In conclusion, the situation of sub-types of agro-ecosystems differs due to the different basic conditions in different regions, but the available studies show that the ecological deterioration of grasslands is a common problem. The study for Sichuan provides some patches for this type of study and enriches the research in this area.
4.2 Research Outlook
Based on the existing research, we propose the following three research perspectives. First, the average level of domestic agricultural consumption items need to be determined and unified, and then the agricultural consumable items in each land type need to be further refined and adjusted. Second, the scope of the agricultural sustainable evaluation can be expanded. Agricultural sustainability is not only to examine the sustainability of agricultural ecosystems but also should take the sustainability of agricultural economic development into account. Therefore, future studies can include social indicators such as agricultural economic level, rural governance level for a wider range of research, and this will make a more profound evaluation for the sustainable development of agriculture in a broad sense.
5 Conclusion and Suggestion
5.1 Conclusion
We analyzed the time series changes of the ecological footprint and the ecological carrying capacity of arable land, forest land, grassland, and waters in Sichuan Province and explored its possible influencing factors in combination with realistic trends. We selected 18 agricultural consumption items based on the actual situation in Sichuan. Our research conclusions are as follows:
1) The agricultural ecosystem in Sichuan Province is in a sustainable developing status. The ECC of forest land is the strongest, showing an upward trend, followed by the ECC of water areas. The ECC of cultivated land has a downward trend, and the grassland is facing a severe problem of sustainable development. However, in general, the agro-ecosystem of Sichuan is in a sustainable development status during the past decades.
2) Arable land degradation and scale fluctuation have led to a decline in the ES of arable land. However, the ES of the water area has increased, since the abundant water resources and the aquatic products supply exceeded the demand. The “Natural Forest Protection Project” and “Sloping Land Conversion Program” have also helped to increase the forest land coverage, thereby increasing the ES of the forest land. Due to the desertification and increased demand for meat and eggs, the grassland has been in an ecological deficit status, and the situation has not been improved.
3) In the calculation of sustainability, four lands’ states are unchanged. Forest land is the most sustainable land out of the four and has the highest resource utilization all the time, and the sustainable state from the best to the worst is water land, arable land, and grassland. When deep into the numerical, we can find the EFI of arable land and water land is declining year by year, and the EPI of them are increasing all the time, which means these two kinds of ecosystems are in a process of transition from a strongly sustainable state to a weakly sustainable state. However, fortunately, in the coordination of ecology and economy, the WEFI of all kinds of ecosystems are in a good condition, which implies their utilization efficiency has improved.
Although this article makes a detailed analysis of the sustainable capacity of cultivated land, forest land, water area, and grassland in Sichuan Province, there are still some inevitable limitations in practice. The first is the lack of authoritative data on the average production capacity of China’s agricultural consumption projects. Therefore, our study draws on some data from both existing studies and investigations domestically and internationally. The advantage of this research is that it is conducive to international or inter-regional comparison in the future. Second, due to the limitation of data acquisition, we can only make calculations based on data from various statistical yearbooks as much as possible. Therefore, there are deviations in the final calculation results of the EF and the ECC.
5.2 Policy Recommendations
As we described earlier, the agricultural ecosystem in Sichuan Province is in a state of sustainable development, and the ecosystem has a strong carrying capacity and supporting capacity. Yet there are still many aspects to be improved. Based on the research, we propose corresponding solutions and policy recommendations as follows:
First, the government should pay more attention to the Sichuan grassland ecosystem. Increasing demand for animal protein inevitably affected the bearing capacity of grass. Although the central and local governments have stepped up protection and restoration efforts in recent years, the situation of grassland is still severe since the chronic overloading and overgrazing in the past decades. In the future, the government should speed up the establishment of a sub-system of grassland monitoring and evaluation, grassland restoration and management, grassland protection, grassland law enforcement supervision, grassland industry, and grassland culture to lay a firm foundation for stabilizing a comprehensive and effective grassland system.
Second, protect and exploit the rich forest resources in Sichuan Province. Forest land protection projects of Sichuan have achieved remarkable results, the development trend of forestry is good. Sichuan has the world’s first CCB (Climate, Community, and Biodiversity Standard) Gold-Certified CDM (Clean Development Mechanism) afforestation and reforestation project: The Northwest Sichuan Degraded Land Afforestation and Reforestation Project, and then, forestry projects can well balance ecological and economic benefits. Forest carbon sinks will become an important environmental asset in the future. We believe that forests will be the key to driving the overall ecological transformation of Sichuan in the future. Forestry projects about carbon sink or ecological protection should be supported intensively.
Third, plan and utilize the ecological resources and agricultural materials scientifically. As a veritable “Land of Abundance,” Sichuan has abundant water resources, land resources, forestry resources, etc., and has favorable conditions for agricultural development. Yet, the current resource utilization efficiency is low. Meanwhile, the use of agricultural materials, such as chemical fertilizers, pesticides, and agricultural mulch, has significantly increased in the past decades. Therefore, the agro-ecological environment is facing huge pressure. The governments should formulate a reasonable mechanism, making agricultural production neither burden the ecosystem nor waste the ecological environment resources and finally improve the quality of agriculture.
Data Availability Statement
Publicly available datasets were analyzed in this study. These data can be found here: http://tjj.sc.gov.cn/scstjj/c105855/nj.shtml.
Author Contributions
Conceptualization: XD; formal analysis: XD, YC, and XW; funding acquisition: XD and FW; methodology: YC and YH; supervision: FW; visualization: YC and XW; writing—original draft: XD, YC, and XW; writing—review and editing: XD, YH, and FW.
Funding
This research is financially supported by the Sichuan Social Science Planning Project “Research on Sichuan Agricultural Green Development Mechanism and Implementation Path under the Carbon Neutrality Target” (SCEZD031).
Conflict of Interest
The authors declare that the research was conducted in the absence of any commercial or financial relationships that could be construed as a potential conflict of interest.
Publisher’s Note
All claims expressed in this article are solely those of the authors and do not necessarily represent those of their affiliated organizations, or those of the publisher, the editors, and the reviewers. Any product that may be evaluated in this article, or claim that may be made by its manufacturer, is not guaranteed or endorsed by the publisher.
Abbreviations
ECC, ecological carrying capacity; ECCC, ecological carrying capacity per capita; EF, ecological footprint; EFC, ecological footprint per capita; ES, ecological surplus; ESC, ecological surplus per capita; ED, ecological deficit; EDC, ecological deficit per capita; EFI, ecological footprint index; EPI, ecological pressure index; WEFI, 10 thousand yuan GDP ecological footprint.
Footnotes
1http://tjj.sc.gov.cn/scstjj/c105855/nj.shtml.
2http://www.stats.gov.cn/tjsj/ndsj/.
3https://scdfz.sc.gov.cn/szfz/scnj1.
References
Barnes, A. P., McMillan, J., Sutherland, L.-A., Hopkins, J., and Thomson, S. G. (2022). Farmer Intentional Pathways for Net Zero Carbon: Exploring the Lock-In Effects of Forestry and Renewables. Land Use Policy 112, 105861. doi:10.1016/j.landusepol.2021.105861
Budreski, K., Winchell, M., Padilla, L., Bang, J., and Brain, R. A. (2016). A Probabilistic Approach for Estimating the Spatial Extent of Pesticide Agricultural Use Sites and Potential Co-occurrence with Listed Species for Use in Ecological Risk Assessments. Integr. Environ. Assess. Manag. 12 (2), 315–327. doi:10.1002/ieam.1677
Bulut, U. (2021). Environmental Sustainability in Turkey: an Environmental Kuznets Curve Estimation for Ecological Footprint. Int. J. Sust. Dev. World Ecol. 28 (3), 227–237. doi:10.1080/13504509.2020.1793425
Cao, Y. P. (2020). Evaluation of Guangxi Agricultural Sustainable Development Based on Ecological Footprint Model. China Agric. Resour. Regionalization 41 (05), 35–42. Available at: https://kns.cnki.net/kcms/detail/detail.aspx?FileName=ZGNZ202005007&DbName=CJFQ2020.
Chishti, M. Z., Ahmad, M., Rehman, A., and Khan, M. K. (2021). Mitigations Pathways towards Sustainable Development: Assessing the Influence of Fiscal and Monetary Policies on Carbon Emissions in BRICS Economies. J. Clean. Prod. 292 (12), 126035. doi:10.1016/j.jclepro.2021.12603510.1016/j.jclepro.2021.126035
Enu, A., and Sya, B. (2021). The Interacting Force of Foreign Direct Invest (FDI), Natural Resource and Economic Growth in Determining Environmental Performance: A Nonlinear Autoregressive Distributed Lag (NARDL) Approach. Resour. Pol. 73 (1), 102168. doi:10.3390/su12219031
Ferng, J.-J. (2011). Measuring and Locating Footprints: A Case Study of Taiwan's rice and Wheat Consumption Footprint. Ecol. Econ. 71, 191–201. doi:10.1016/j.ecolecon.2011.09.001
Haberl, H., Wackernagel, M., Krausmann, F., Erb, K.-H., and Monfreda, C. (2004). Ecological Footprints and Human Appropriation of Net Primary Production: A Comparison. Land Use Policy 21 (3), 279–288. doi:10.1016/j.landusepol.2003.10.008
Havlík, P., Valin, H., Herrero, M., Obersteiner, M., Schmid, E., Rufino, M. C., et al. (2014). Climate Change Mitigation through Livestock System Transitions. Proc. Natl. Acad. Sci. U.S.A. 111 (10), 3709–3714. doi:10.1073/pnas.1308044111
Henderson, B., Frank, S., Havlik, P., and Valin, H. (2021). Policy Strategies and Challenges for Climate Change Mitigation in the Agriculture, Forestry, and Other Land Use (ALFOLU) Sector. OECD Food Agric. Fish. Pap. 149. doi:10.1787/47b3493b-en
Hoekstra, A. Y., Chapagain, A. K., Aldaya, M. M., and Hoekstra, M. (2011). The Water Footprint Assessment Manual: Setting the Global Standard. Washington, DC: Earthscan.
Hussain, I., and Rehman, A. (2021). Exploring the Dynamic Interaction of CO2 Emission on Population Growth, Foreign Investment, and Renewable Energy by Employing ARDL Bounds Testing Approach. Environ. Sci. Pollut. Res. 28 (29), 39387–39397. doi:10.1007/s11356-021-13502-8
Korkut, P. U. (2021). Linking Renewable Energy, Globalization, Agriculture, CO2 Emissions and Ecological Footprint in the BRIC Countries: A Sustainability Perspective. Renew. Energ. 173, 197–208. doi:10.1016/j.renene.2021.03.125
Li, J., Yang, W., Wang, Y., Li, Q., Liu, L., and Zhang, Z. (2018). Carbon Footprint and Driving Forces of saline Agriculture in Coastally Reclaimed Areas of Eastern China: A Survey of Four Staple Crops. Sustainability 10 (4), 928. doi:10.3390/su10040928
Lin, W., Ying, L., Li, X., and Dan, X. (2017). The Dynamic Analysis and Evaluation on Tourist Ecological Footprint of the City: Take Shanghai as an Instance. Sust. Cities Soc. 37, 541–549. doi:10.1016/j.scs.2017.12.003
Maier, S., Szerencsits, M., Narodoslawsky, M., Ismail, I. M. I., and Shahzad, K. (2017). Current Potential of More Sustainable Biomass Production Using Eco-Efficient Farming Practices in Austria. J. Clean. Prod. 155, 23–27. doi:10.1016/j.jclepro.2016.09.037
Marzouki, M., Froger, G., and Ballet, J. (2012). Ecotourism versus Mass Tourism. A Comparison of Environmental Impacts Based on Ecological Footprint Analysis. Sustainability 4 (1), 123–140. doi:10.3390/su4010123
Mu, D. (2019). Sichuan Daily. Available at: https://epaper.scdaily.cn/shtml/scrb/20190930/224079.shtmll (accessed September 30, 2019).
Murshed, M., Rashid, S., Ulucak, R., Dagar, V., Rehman, A., Alvarado, R., et al. (2021). Mitigating Energy Production-Based Carbon Dioxide Emissions in Argentina: the Roles of Renewable Energy and Economic Globalization. Environ. Sci. Pollut. Res. 29, 16939–16958. online ahead of print. doi:10.1007/S11356-021-16867-Y
Neagu, O. (2020). Economic Complexity and Ecological Footprint: Evidence from the Most Complex Economies in the World. Sustainability 12 (21), 9031. doi:10.3390/su1221903110.3390/su12219031
Ojionugwa, U., Abdulrashid, R. A., and Asumadu, S. S. (2021). Conflicts and Ecological Footprint in MENA Countries: Implications for the Sustainable Terrestrial Ecosystem. Environ. Sci. Pollut. Res. Int. 28 (42), 59988–59999. doi:10.1007/s11356-021-14931-1
Qiu, G. H., and Guang, J. (2015). Dynamic Evaluation and Trend Prediction of Regional Ecological Security-Taking Sichuan Province as an Example. Ecol. Economy 31 (4), 129–132. CNKI:SUN:STJJ.0.2015-04-030.
Rehman, A., Ma, H., Ahmad, M., Ozturk, I., and Chishti, M. Z. (2021g). How Do Climatic Change, Cereal Crops and Livestock Production Interact with Carbon Emissions? Updated Evidence from China. Environ. Sci. Pollut. Res. Int. 28 (24), 30702–30713. doi:10.1007/s11356-021-12948-010.1007/s11356-021-12948-0
Rehman, A., Ma, H., Ahmad, M., Irfan, M., and Chandio, A. A. (2021f). Towards Environmental Sustainability: Devolving the Influence of Carbon Dioxide Emission to Population Growth, Climate Change, Forestry, Livestock, and Crop Production in Pakistan. Ecol. Indicators 125, 1–11. doi:10.1016/j.ecolind.2021.107460
Rehman, A., Ma, H., Ahmad, M., Ozturk, I., and Işık, C. (2021c). An Asymmetrical Analysis to Explore the Dynamic Impacts of CO2 Emission to Renewable Energy, Expenditures, Foreign Direct Investment, and Trade in Pakistan. Environ. Sci. Pollut. Res. 28 (38), 53520–53532. doi:10.1007/s11356-021-14537-7
Rehman, A., Ma, H., Ozturk, I., Murshed, M., and Dagar, V. (2021a). The Dynamic Impacts of CO2 Emissions from Different Sources on Pakistan's Economic Progress: a Roadmap to Sustainable Development. Environ. Dev. Sustain. 23 (12), 17857–17880. doi:10.1007/s10668-021-01418-910.1007/s10668-021-01418-9
Rehman, A., Ma, H., Ozturk, I., and Ulucak, R. (2021e). Sustainable Development and Pollution: the Effects of CO2 Emission on Population Growth, Food Production, Economic Development, and Energy Consumption in Pakistan. Environ. Sci. Pollut. Res. 29, 17319–17330. online ahead of print. doi:10.1007/s11356-021-16998-2
Rehman, A., Ma, H., Radulescu, M., Sinisi, C. I., Paunescu, L. M., Alam, M. S., et al. (2021b). The Energy Mix Dilemma and Environmental Sustainability: Interaction Among Greenhouse Gas Emissions, Nuclear Energy, Urban Agglomeration, and Economic Growth. Energies 14 (22), 7703. doi:10.3390/EN14227703
Rehman, A., Ulucak, R., Murshed, M., Ma, H., and Işık, C. (2021d). Carbonization and Atmospheric Pollution in China: The Asymmetric Impacts of Forests, Livestock Production, and Economic Progress on CO2 Emissions. J. Environ. Manage. 294, 113059. doi:10.1016/j.jenvman.2021.11305910.1016/j.jenvman.2021.113059
Rogers, C. W. (2014). Managing Agricultural Greenhouse Gases: Coordinated Agricultural Research through GRACEnet to Address Our Changing Climate. J. Environ. Qual. 43 (5), 1820. doi:10.2134/jeq2014.05.0221br10.2134/jeq2014.05.0221br
Sharma, R., Shahbaz, M., Kautish, P., and Vo, X. V. (2021). Analyzing the Impact of export Diversification and Technological Innovation on Renewable Energy Consumption: Evidences from BRICS Nations. Renew. Energ. 178, 1034–1045. doi:10.1016/j.renene.2021.06.12510.1016/j.renene.2021.06.125
Ullah, A., Ahmed, M., Raza, S. A., and Ali, S. (2021). A Threshold Approach to Sustainable Development: Nonlinear Relationship between Renewable Energy Consumption, Natural Resource Rent, and Ecological Footprint. J. Environ. Manage. 295 (5), 113073. doi:10.1016/j.jenvman.2021.11307310.1016/j.jenvman.2021.113073
van der Werf, H. M. G., Tzilivakis, J., Lewis, K., Basset-Mens, C., and Claudine, B. M. (2007). Environmental Impacts of Farm Scenarios According to Five Assessment Methods. Agric. Ecosyst. Environ. 118 (1-4), 327–338. doi:10.1016/j.agee.2006.06.005
Viglizzo, E. F., Frank, F. C., Carreño, L. V., Jobbágy, E. G., Pereyra, H., Clatt, J., et al. (2011). Ecological and Environmental Footprint of 50 Years of Agricultural Expansion in Argentina. Glob. Change Biol. 17 (2), 959–973. doi:10.1111/j.1365-2486.2010.02293.x
Wackernagel, M., and Rees, W. E. (1997). Perceptual and Structural Barriers to Investing in Natural Capital: Economics from an Ecological Footprint Perspective. Ecol. Econ. 20 (1), 3–24. doi:10.1016/s0921-8009(96)00077-8
Wang, Y. B., Wu, P. T., Engel, B. A., and Sun, S. K. (2014). Application of Water Footprint Combined with a Unified Virtual Crop Pattern to Evaluate Crop Water Productivity in Grain Production in China. Sci. Total Environ. 497-498 (nov.1), 497–498. 1–9. doi:10.1016/j.scitotenv.2014.07.089
Wang, Z., Yang, L., Yin, J., and Zhang, B. (2018). Assessment and Prediction of Environmental Sustainability in China Based on a Modified Ecological Footprint Model. Resour. Conservation Recycling 132, 301–313. doi:10.1016/j.resconrec.2017.05.003
Weimin, Z., Chishti, M. Z., Rehman, A., and Ahmad, M. (2021). A Pathway toward Future Sustainability: Assessing the Influence of Innovation Shocks on CO2 Emissions in Developing Economies. Environ. Dev. Sustain., 1–24. doi:10.1007/s10668-021-01634-3
Wu, L. J. (2005). 10, 94–99. CNKI: SUN: NYDX.Dynamic Evaluation of China Sustainable Development Based on the Ecological Footprint IndexChina Agric. Univ.6.
Yang, J., Li, Z. D., Yang, P., Ji, M. C., and Li, M. H. (2016). Analysis of the Sustainable Development of Agricultural Resources in Shandong Province Based on the Ecological Footprint Model. China Agric. Resour. Regionalization 37 (11), 56–64. doi:10.7621/cjarrp.1005-9121.20161109
Zahid, R. M., Majeed, N. A., Wanjun, X., Majid, I., Muhammad, S. H., and Umer, S. (2021). Does Economic Complexity Matter for Environmental Sustainability? Using Ecological Footprint as an Indicator, 1–18. Online ahead of print. doi:10.1007/s10668-021-01625-4Environ. Dev. sustainability
Zhang, C. J. (2020). Dynamic Evaluation of Agricultural Ecological Carrying Capacity in Henan Province Based on Ecological Footprint Model. China Agric. Resour. Regionalization 41 (02), 246–251. doi:10.7621/cjarrp.1005-9121.20200230
Keywords: Sichuan Province, ecological footprint, ecological carrying capacity, index evaluation, sustainable development
Citation: Dai X, Chen Y, Wu X, He Y and Wang F (2022) Are the Agro-Ecosystems Sustainable? Measurement and Evaluation: A Case Study of Sichuan Province, China. Front. Environ. Sci. 10:862740. doi: 10.3389/fenvs.2022.862740
Received: 26 January 2022; Accepted: 28 February 2022;
Published: 25 March 2022.
Edited by:
Shaoquan Liu, Institute of Mountain Hazards and Environment (CAS), ChinaReviewed by:
Shili Guo, Southwestern University of Finance and Economics, ChinaAbdul Rehman, Henan Agricultural University, China
Tian Yun, Zhongnan University of Economics and Law, China
Copyright © 2022 Dai, Chen, Wu, He and Wang. This is an open-access article distributed under the terms of the Creative Commons Attribution License (CC BY). The use, distribution or reproduction in other forums is permitted, provided the original author(s) and the copyright owner(s) are credited and that the original publication in this journal is cited, in accordance with accepted academic practice. No use, distribution or reproduction is permitted which does not comply with these terms.
*Correspondence: Xiaowen Dai, ZGFpeGlhb3dlbkBzaWNhdS5lZHUuY24=