- Institute of Rural Development, Zhejiang Academy of Agricultural Sciences, Hangzhou, China
Improving resource use efficiency is an effective way to accelerate the realization of “carbon emission peak” and “carbon neutrality.” To perform a thorough analysis of the temporal and spatial variations in Zhejiang’s agricultural sustainable development, the present study adopted the entropy weight TOPSIS method and built a RUE-based evaluation index system for sustainable agriculture. The system covered six evaluation aspects: agricultural resource endowment, the agricultural production and agricultural science and technology levels, and ecological, economic, and social benefits. Based hereon, the present study evaluated the agricultural sustainable development of Zhejiang province from 2013 to 2019, and that of its 11 prefecture-level cities and 25 national agricultural sustainable development pilot demonstration zones in 2019. The results showed that chronologically, Zhejiang made steady progress in its agricultural sustainable development from 2013 to 2019, despite slight fluctuations, and spatially, evident regional disparities were found across its 11 prefecture-level cities and 25 pilot demonstration zones. Moreover, resource use efficiency had a significant impact on agricultural sustainable development. Zhejiang’s practices in the efficient use of cultivated land, water resources, forest resources, agricultural labor force, agricultural material goods, and agricultural science and technology offer valuable references for sustainable agriculture worldwide.
1 Introduction
Climate change has become a major challenge for mankind, and China, as a champion of the idea of “community with a shared future for mankind,” has taken the initiative to reduce carbon emissions and contribute its share to climate change mitigation and sustainable development. In September 2020, the Chinese government announced that it would peak carbon dioxide (CO2) emissions by 2030 and strive to achieve carbon neutrality by 2060. Agricultural production is where natural and economic reproduction interweave. It satisfies global food demand, but also inevitably releases large quantities of greenhouse gases due to its low resource use efficiency (RUE), characterized by a reliance on fertilizer use and large carbon emissions. The human-land conflict has only been exacerbated by the acceleration of urbanization and industrialization. The over-exploitation of agricultural resources, heavy pollution of the agricultural environment, and unchecked deterioration of agricultural ecosystems exert considerable pressure on China’s agricultural carbon reduction, and threaten its food security and agricultural sustainable development (ASD). However, the above-mentioned conflicts cannot be resolved by a mere increase in resource input or scale. Improving RUE in agriculture has become the “hard core” of climate change adaptation, food security, and agricultural modernization, especially under the “dual circulation” development pattern, guided by the overall view, of the sustainable development and global visions of China’s new food security strategy. This is where technological advances can help in the utilization of limited agricultural resources, improvement of RUE, and promotion of quality ASD. Improving the utilization efficiency of agricultural resources is an important way to achieve sustainable agricultural development; it is also the inevitable path to achieving the “dual carbon” strategy, as well as a technical guarantee for the precise implementation of the government’s “emission reduction” policy. This is necessary for China to attain the “carbon emission peak” on schedule, an important lever to ensure food security in the new era, an intrinsic nature of the quality development of modern agriculture, and an effective measure for rural revitalization and agricultural and rural modernization.
The idea of ASD originated in the early 1980s, and attracted more academic attention after the publication of the Brundtland Report by the World Commission on Environment and Development in 1987 (Millennium Ecosystem Assessment, 2005; Harwood, 2020). However, as sustainable agriculture is a vague and ambiguous concept, its use and implementation are extremely difficult. Velten et al. (2015) conducted a structured literature review of sustainable agriculture, and divided its goals into the categories of “ecological soundness,” “social responsibility,” and “economic viability.” Zhao et al. (2018) further emphasized that the essence of ASD was to develop agriculture without compromising the ecosystem, social development, resources, or environment. Regarding the evaluation of sustainable agriculture, Sands and Podmore (2000) proposed an environmental sustainability index (ESI) of 15 sub-indices to measure the sustainability of agricultural systems. Reytar et al. (2014), representing the World Resources Institute (WRI), identified, analyzed, and profiled the landscape of existing indicators, indices, and datasets related to the environmental sustainability of agriculture. Ngo et al. (2021) combined the systemic indicators provided by the IDEA framework (Zahm et al., 2018) and the analytic hierarchy process (AHP) technique and found that the economic dimension was a more important factor than the socio-territorial or agroecological dimension, contributing 54% toward sustainable agriculture. Sarkar et al. (2021) pointed out that the indicator of sustainable agriculture might vary by region, and utilized partial least squares structural equation modeling (PLS-SEM) tactics to build an evaluation system for sustainable agriculture in Bangladesh. Zinck et al. (2004) combined case studies in which different methodological approaches and techniques mobilizing single or composite indicators were applied to assess agricultural sustainability at different hierarchical levels. There have also been studies that have explored agricultural sustainability from the perspectives of conservation agriculture, biomass for energy use, agroecological practices, and agricultural mechanization (Hobbs et al., 2008; Luo et al., 2016; Muller, 2009; Wezel et al., 2014), casting attention to farmers’ perception of sustainable agriculture (Füsun Tatlıdil et al., 2009) and whether it is a viable strategy to improve farm income (Kilian et al., 2006).
Overall, the studies mentioned above focused on sustainable agriculture from different perspectives and provided valuable references for the present study. The contribution of this study is twofold. First, as the largest developing country in the world, research on the evaluation of China’s ASD needs to be strengthened. Therefore, the present study can be further improved by proposing an overall evaluation framework that is concise, factors in all the requirements necessary for sustainable agriculture, and is suitable for China’s conditions and the underlying trend of the times.
Second, it is believed that improving RUE is an effective way to accelerate the realization of “carbon emission peak” and “carbon neutrality;” thus, Zhejiang province was selected as the research subject for the following considerations: 1) Zhejiang’s ASD experience has strong domestic practical value. Zhejiang is the cradle of the concept of “lucid waters and lush mountains are invaluable assets,” and is China’s first and only provincial-level pilot demonstration zone for national ASD. Moreover, as one of the first national agricultural green development pilot zones, Zhejiang has taken the lead in the national reform of the “real-name system and quota system for chemical fertilizer and pesticides,” and achieved zero growth in the use of both 7 years in advance. In addition, Zhejiang has made substantial progress in the fields of comprehensive waste management, land consolidation and soil pollution control, clean energy, water source protection and water pollution control, and conservation of natural resources, establishing a series of innovative practice-based models of regional sustainable development. 2) Improving the utilization efficiency of agricultural resources is a realistic demand for the development of modern agriculture in Zhejiang. As Zhejiang Province is one of the smallest provinces in China, its cultivated land per capita and grain self-sufficiency rate are much lower than the national averages, and the province faces challenges such as labor shortages, insufficient adoption of agricultural technologies, and inadequate agricultural product reserves, all of which pose a threat to its agricultural modernization. 3) Zhejiang’s experience in ASD has strong international significance. The project of “One Thousand Demonstration Villages and Rectification of Ten Thousand Villages” carried out in Zhejiang Province won the “Champions of the Earth” award in the category of “Inspiration and Action,” which is the UN’s highest environmental honor. Sustainable agricultural practices in Zhejiang Province also provide valuable references for agriculture nationwide. Therefore, an analysis of sustainable agriculture in Zhejiang Province could offer deeper insights into the status quo of and the problems facing China’s agriculture, and provide important references for ASD worldwide. Given this, the present study considered Zhejiang’s resource endowment and agricultural development stage and selected 11 prefecture-level cities and 25 national ASD pilot demonstration zones as research subjects. Focusing on the intensive, recycled, and sustainable use of agricultural resources and low-carbon, efficient, safe, and sustainable development of agriculture, this study built an RUE-based hierarchical evaluation index system for sustainable agriculture and analyzed agricultural sustainability in Zhejiang Province by adopting the entropy weight TOPSIS method.
2 Construction of an RUE-Based Hierarchical Evaluation Index System for Sustainable Agriculture
2.1 Construction of the Index System
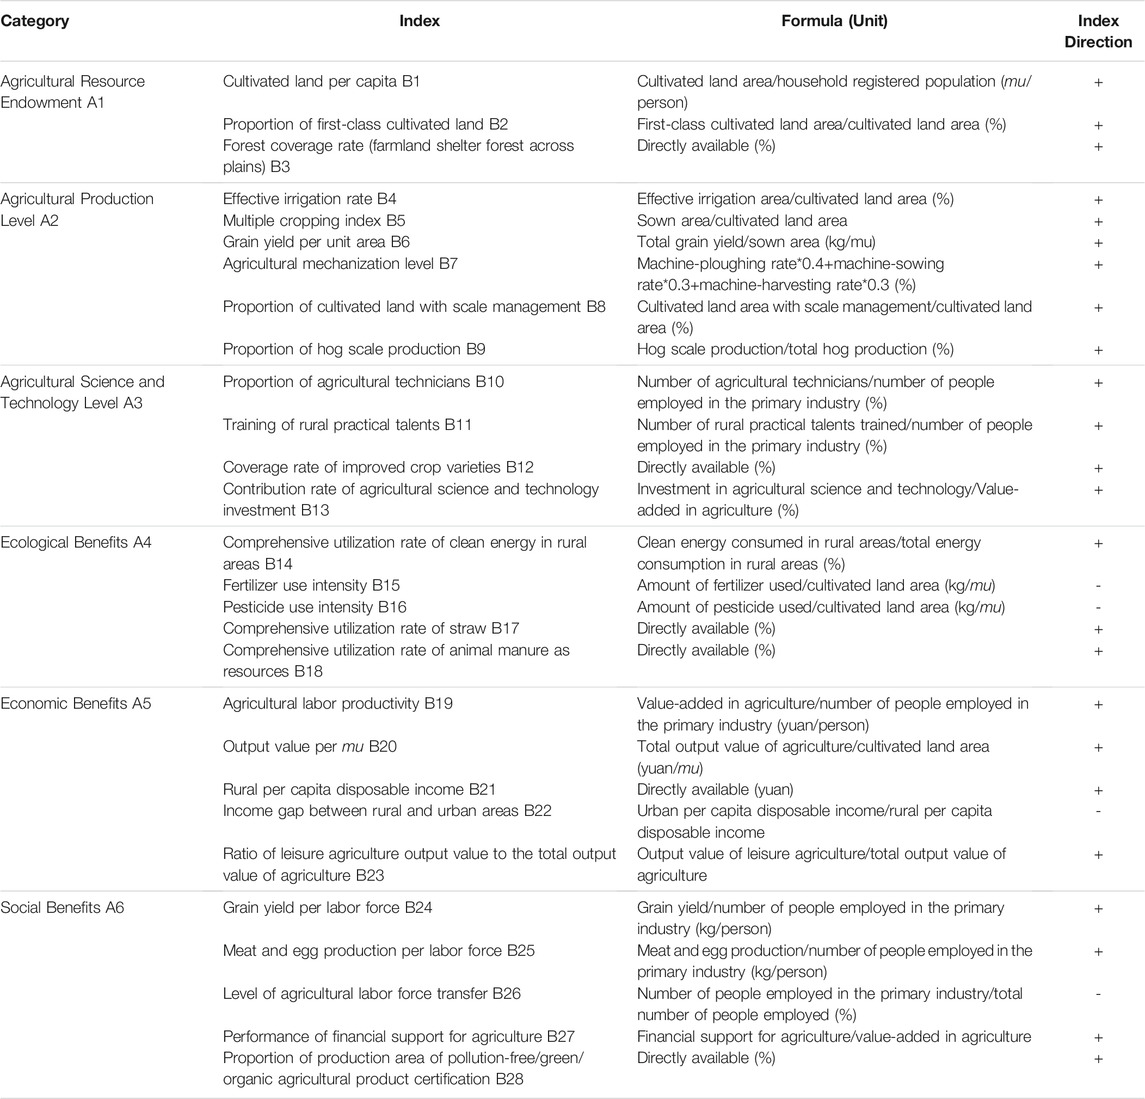
The construction of the index system was based on three aspects: First, key indices of RUE, i.e., indices of the comprehensive utilization of natural and social resources such as land, water resources, labor, technology, and material goods. Second, key indices of quality development of low-carbon agriculture, i.e., indices of the ecological environment, production efficiency, and agricultural carbon emission reduction, concerning the economic, social, and ecological dimensions of low-carbon agriculture, and the differences in resource endowment and production methods. Third, key indices of sustainable agriculture, which, on the one hand, measure sustainable agricultural and rural development from the perspectives of ecological, economic, and social benefits, and on the other, combine the Den Bosch Declaration reached during the FAO/Netherlands Conference on Agriculture and the Environment in April 1991. Based hereon, the present study defines three strategic development goals for sustainable agriculture: 1) to guarantee food security, 2) to develop an integrated economic model for rural areas, and 3) to promote the scientific use and recycling of rural resources.
The construction of the evaluation index system for sustainable agriculture is based on the following principles: being scientific and pragmatic, combing wholeness with hierarchy, being measurable and comparable, and being dynamic and stable.
2.2 Construction of Indices
Based on the above-mentioned principles, this study constructed an evaluation index system for sustainable agriculture covering six aspects: agricultural resource endowment, agricultural production level, agricultural science and technology level, ecological, economic, and social benefits. The first three aspects are used to measure a region’s potential for ASD, while the remaining three aspects are used to assess its efficiency.
Agricultural resource endowment reflects the number of natural resources that can be utilized for agricultural development in a region, with a higher score representing more abundant agricultural resources. It comprises three indices that reflect a region’s land resource endowment, cultivated land quality, and ecological and environmental protection. Agricultural production level reveals the utilization intensity of agricultural resources, with a higher score representing higher utilization efficiency, which benefits ASD. It comprises six indices that reflect a region’s water resource utilization efficiency, land resource utilization rate, grain productivity, agricultural mechanization level, scale management of farmland, and production of animal husbandry. Agricultural science and technology level reflects a region’s human resource quality and the importance of the role of science and technology in its agricultural development, with a higher score representing more advanced technologies and better human resource quality, and thus more potential for sustainable agriculture. It comprises four indices that focus on a region’s human resource advantage, training of the agricultural labor force, supply of improved crop varieties, and the contribution of agricultural science and technology to agricultural production. Ecological benefits are an integral part of sustainable agriculture, with a higher score representing a safer and better ecological environment. It comprises six indices, which are important indices of agricultural resource utilization. A higher score of economic benefits represents a more solid economic foundation for sustainable agriculture, with ecological values better converted into economic ones. The five indices are used to measure the economic benefits of a region’s agriculture in terms of aspects such as productivity efficiency, common prosperity, industrial integration, etc. Regarding social benefits, the higher the score, the greater the social contribution, representing a better social foundation for ASD. The five indices measure social benefits in terms of aspects such as a guaranteed supply of essential agricultural products, labor force structure, and the quality and safety of agricultural products.
Based on the above discussion, the present study constructed an RUE-based evaluation index system for sustainable agriculture in Zhejiang Province, as listed in Table 1:
3 Data and Evaluation Methods
3.1 Data Sources
The sources of the data used in the present study include Zhejiang Statistical Yearbook (2014–2020), Zhejiang Agriculture Statistical Report (2013–2019), Zhejiang Agricultural Economy Statistical Report (Brief Edition, 2013–2019), “Evaluation of Agricultural Modernization in Zhejiang from 2013 to 2019,” and the Statistical Yearbook (2020) of 11 prefecture-level cities.
3.2 Data Analysis Methods
3.2.1 Normalization of Indices
The present study evaluates the temporal variation in Zhejiang’s ASD from 2013 to 2019, and the spatial variation in sustainable agriculture across Zhejiang’s 11 prefecture-level cities and 25 national ASD pilot demonstration zones in 2019.
First, we assume that there are m objects to be evaluated, and each one has n evaluation indices, and construct a judgment matrix:
(i = 1, 2, …, m; j = 1, 2, …, n).
As the original indices have different units of measurement and optimization directions, they must be normalized to ensure the accuracy of the evaluation results; the normalization process is described as follows:
Normalization of Positive Indices:
Normalization of Negative Indices:
Where
3.2.2 Entropy Weight TOPSIS Method
The entropy weight TOPSIS method is essentially an upgrade of the traditional TOPSIS evaluation method, as it determines the weight of each index by the entropy weight method, and constructs the ranking of objects by the TOPSIS approach. The entropy weight method determines the weight of each index based on the information contained in observations, which not only faithfully reflects the importance of an index in an evaluation system, but also reveals the temporal variations in the weights of indices, thus rendering the method suitable for the evaluation of county economic development. TOPSIS is a method that identifies the geometrical distance of each alternative (object) from the positive ideal solution (PIS) and the negative ideal solution (NIS), and ranks the alternatives based on their relative closeness to the ideal solution.
The entropy weight TOPSIS method is described in the following steps:
① Determine the weight of each index.
The determination of the index weight is important in the evaluation by TOPSIS, while the entropy weight method can effectively avoid the interference of subjective factors in the evaluation indices.
Calculate the information entropy:
(Where
Define the weight of the jth index as:
(Where
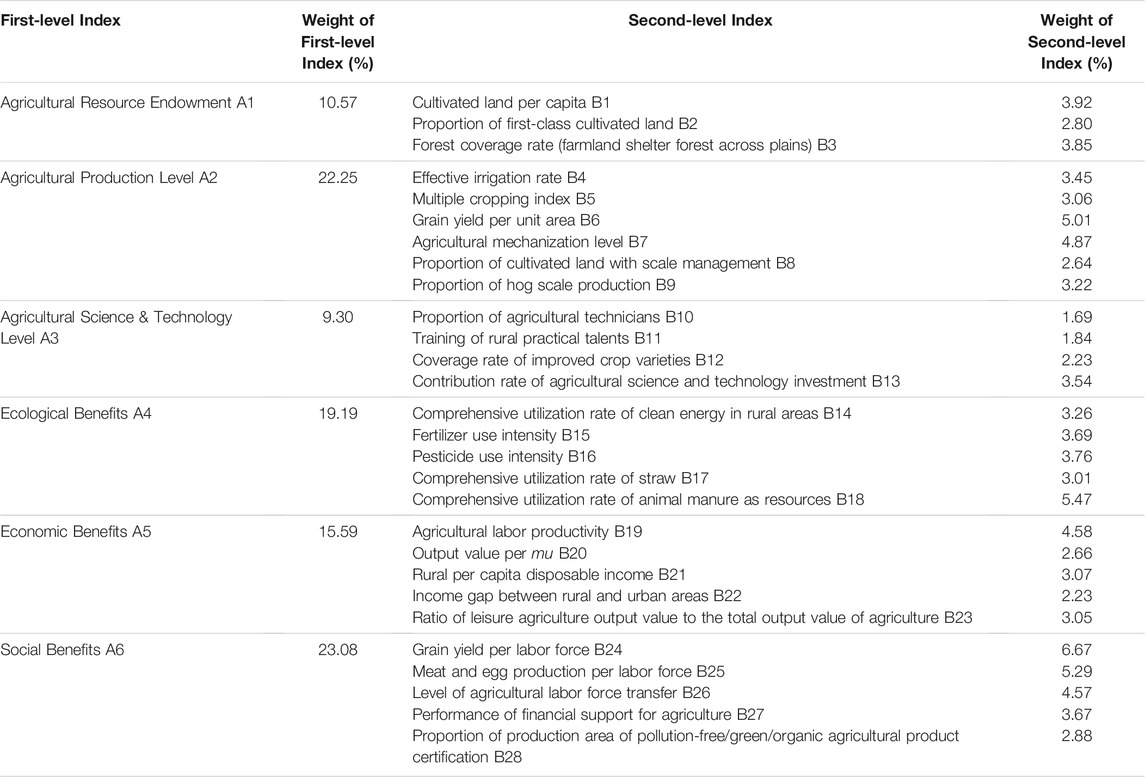
Calculate the weights of the indices based on the data from Zhejiang Province (see Table 2):
② Rank the alternatives by their distance from the ideal solution using the entropy weight TOPSIS method.
First, calculate the weighted matrix:
with the PIS and NIS being
Next, calculate the Euclidean distance D of each alternative from the PIS and NIS:
Euclidean Distance from PIS
Euclidean Distance from NIS
D+ and D−, respectively, refer to the distances of an alternative from the PIS and NIS, with higher values of D+ and D− representing longer distances from the PIS and NIS, respectively. The best alternative has the shortest distance from the PIS (smallest D+) and the longest distance from the NIS (largest D−).
Finally, calculate the relative closeness of each alternative C:
Because the higher the value of D−, the longer the distance from the NIS, a higher value of C represents a better alternative. However, it is worth noting that C is a relative rather than an absolute value; thus, the PIS and NIS of evaluation indices at the provincial, city, and county levels are different, making comprehensive evaluation results incomparable across levels.
4 Empirical Evaluation Results
4.1 Provincial Level Temporal Variations (2013–2019)
4.1.1 Steady Progress in Zhejiang’s ASD
Based on the evaluation index system for sustainable agriculture, this study presents the evaluation results of ASD in Zhejiang from 2013 to 2019 using the entropy weight TOPSIS method. Table 3 shows how the ASD index (relative closeness C) for Zhejiang fluctuated between 2013 and 2019, indicating that Zhejiang made steady progress in sustainable agriculture during the period.
4.1.2 Fluctuating Progress in the Six Evaluation Aspects of Zhejiang’s ASD
Zhejiang made progress in sustainable agriculture regarding the first-level evaluation indices, i.e., agricultural resource endowment, agricultural production level, agricultural science and technology, and ecological, economic, and social benefits. However, despite the overall steady progress in sustainable agriculture at the provincial level, there were wide fluctuations across the years in terms of specific indices (see Table 4).
Regarding the agricultural resource endowment index, there was significant fluctuation in 2016 (see Table 4). Due to a decrease in the cultivated land per capita, the index dropped in 2016 and gradually rebounded in the following years, due to an increase in the proportion of first-class cultivated land. Overall, Zhejiang was still confronted by a shortage of cultivated land per capita, as the index decreased from 0.61 mu in 2013 to 0.59 mu in 2019. During the same period, the proportion of first-class cultivated land and the forest coverage rate increased, particularly the former, as the two indices increased from 18.17 to 60.82% in 2013 to 26.97 and 61.15% in 2019, respectively.
Zhejiang’s agricultural production level index grew steadily year by year, except for a drop in 2019 compared with 2018, which resulted from the slight decreases in the four indices in 2019 (see Table 4): effective irrigation rate, grain yield per unit area, proportion of cultivated land with scale management, and proportion of hog-scale production. In recent years, Zhejiang has been vigorously promoting agricultural mechanization and the “separation of rural land ownership, contractual rights, and management rights,” leading to its continuous progress in agricultural mechanization and scale management. Specifically, its agricultural mechanization level index increased from 70.35% in 2013 to 81.10% in 2019, while its proportion of cultivated land with scale management increased from 25.08% in 2013 to 29.29% in 2019. However, its multiple cropping index, grain yield per unit area, and proportion of hog-scale production evidently fluctuated during this period.
In terms of the agricultural science and technology level, the index declined slightly in 2016 and 2018 but gained momentum overall, jumping from 0.297 in 2013 to 0.960 in 2019, which was close to the ideal solution (see Table 4). The progress was largely attributable to three factors: First, there was stronger government support for both the training of farmers and rural practical talent and rural entrepreneurship by returning migrants. Consequently, Zhejiang experienced growth in both the proportion of agricultural technicians and the training of rural practical talents, with the two indices increasing from 0.18 to 3.51% in 2013 to 0.26 and 4.25% in 2019, respectively. Second, seed production improved. The seed industry is the “chip” of agriculture, and the coverage rate of improved crop varieties in Zhejiang increased from 68.59% in 2013 to 86.37% in 2019. Third, there was more fiscal investment in agricultural science and technology, with the contribution rate of agricultural science and technology investment increasing from 0.12% in 2013 to 0.28% in 2019.
Regarding ecological benefits, there were wide fluctuations across the years (see Table 4). The index declined in 2015 and 2017 due to more intense use of agricultural plastic film and a lower comprehensive utilization rate of animal manure as resources. With advances in agricultural supply-side structural reform, Zhejiang has made substantial progress in the comprehensive, recycled, and intensive use of agricultural resources. More specifically, the comprehensive utilization rate for clean energy in rural areas increased from 74.52% in 2013 to 86.60% in 2019, while the comprehensive utilization rate for straw and animal manure, both of which are recycled agricultural waste, reached 95.69 and 97.23%, respectively. Meanwhile, Zhejiang has pressed ahead with the “real-name system and quota system for chemical fertilizer and pesticides.” Consequently, the use of chemical fertilizer and pesticides decreased for eight consecutive years in Zhejiang, with the two indices declining from 31.13 kg/mu and 2.10 kg/mu in 2013 to 24.48 kg/mu and 1.30 kg/mu in 2019, respectively.
Zhejiang achieved continuous growth in the economic benefits of ASD, with the index jumping from 0 in 2013 to 1 in 2019; this was because all the five indices reached a low in 2013 and a record high in 2019 (see Table 4). Over the years, agricultural labor productivity, output value per mu, rural per capita disposable income, and the ratio of the leisure agriculture output value to the total output value of agriculture all increased continuously, while the income gap between the rural and urban areas narrowed year by year. More specifically, over the 6 years from 2013 to 2019, Zhejiang’s agricultural labor productivity grew by 17230.11 yuan per capita, the output value per mu by 880.49 yuan per mu, the rural per capita disposable income by 12382 yuan, and the ratio of the leisure agriculture output value to the total output value of agriculture by 0.08 to 0.13. Simultaneously, the income gap between the rural and urban areas narrowed steadily across the years from 2.12 in 2013 to 2.01 in 2019.
Regarding social benefits, the index maintained relatively rapid growth over the years, except for a slight decline in 2014 compared to the value in the previous year (see Table 4). The grain yield per labor force increased continuously from 1,185.86 kg per capita in 2013 to 1,455.52 kg per capita in 2019. In addition to the output growth, Zhejiang has made substantial progress in the quality of agricultural products. The proportion of the production area for “pollution-free, green, and organic agricultural product” certification increased from 48.60% in 2016 to 55.60% in 2019. Moreover, Zhejiang made great progress in the transfer of the agricultural labor force, as the proportion of people working in the primary industry decreased from 13.67% in 2013 to 10.50% in 2019.
4.2 City-Level Spatial Variations (2019)
4.2.1 Overall Situation
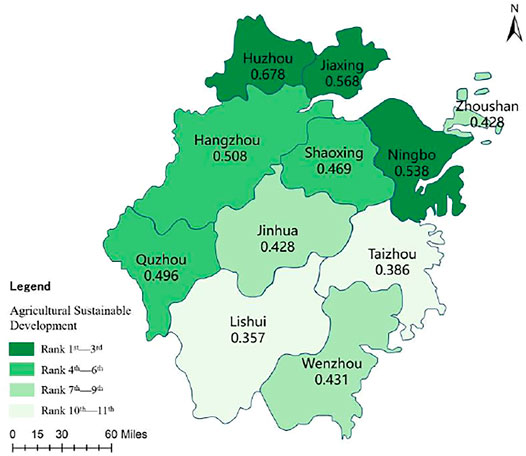
Overall, great disparities were found in ASD across Zhejiang’s prefecture-level cities, with its northern regions more developed than the southern ones (see Figure 1); their relative closeness, C, varied between 0.357 and 0.626 (see Table 5). More specifically, the three cities of Huzhou, Ningbo, and Jiaxing were ranked among the first-tier cities of sustainable agriculture, followed by Quzhou, Hangzhou, and Shaoxing in the second tier, Wenzhou, Zhoushan, and Jinhua in the third tier, and Taizhou and Lishui in the fourth tier.

TABLE 5. Evaluation Results of Agricultural Sustainable Development in Zhejiang’s 11 Prefecture-level Cities (2019).
4.2.2 Regional Disparities in the Six Evaluation Aspects
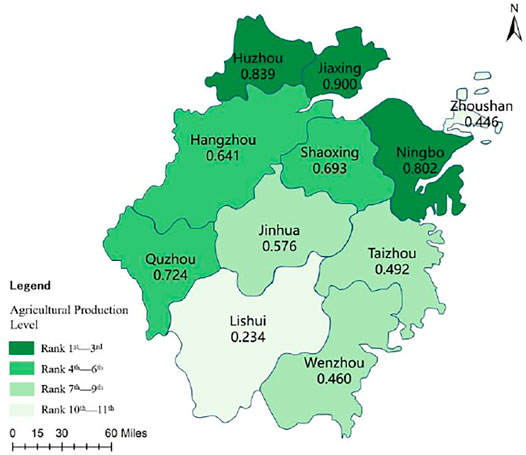
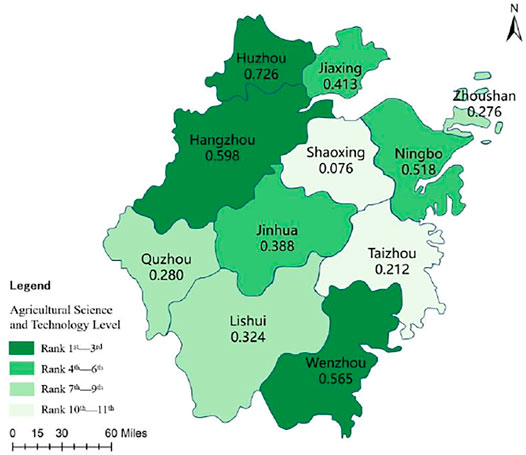
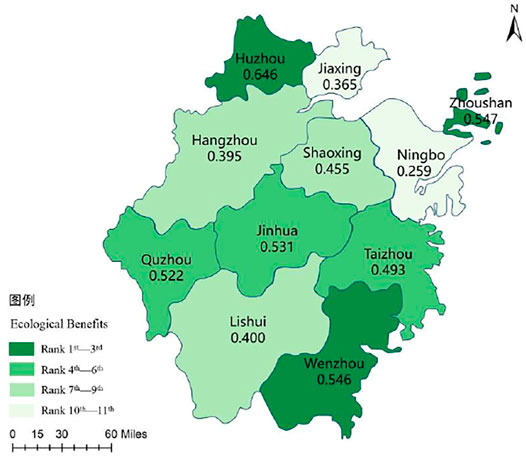
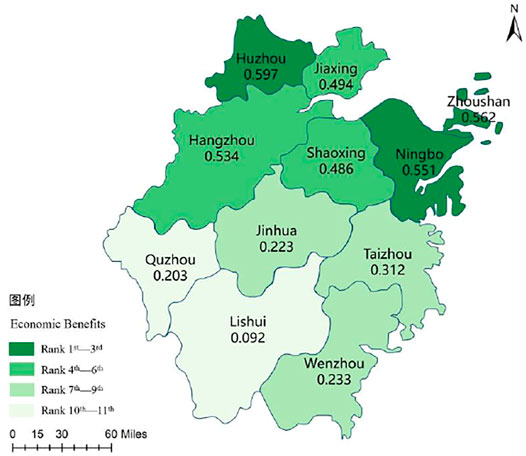
As shown in Table 6, the 11 prefecture-level cities clearly varied in terms of the six evaluation aspects, with the regional disparities the most significant in terms of agricultural production level. In terms of this aspect, Jiaxing’s relative closeness, C, was as high as 0.900, while Lishui’s only stood at 0.234, revealing a wide gap of 0.666 among the cities. Agricultural science and technology level exhibited the second-largest regional disparity, as there was a gap of 0.650 in C between Ningbo, which ranked first, and Shaoxing, which ranked last. The third-largest regional disparity lay in economic and social benefits. The difference in C in terms of economic benefits between Ningbo, which ranked first, and Lishui, which ranked last, was 0.505, while that in terms of social benefits between Ningbo and Zhoushan was 0.483. Ecological benefits and agricultural resource endowment exhibited relatively small regional disparities: the difference in C in terms of ecological benefits between Huzhou, which ranked first, and Ningbo, which ranked last, was 0.387, while the difference in terms of agricultural resource endowment between Huzhou and Zhoushan was 0.347.

TABLE 6. Relative Closeness, C, and the Ranking of Zhejiang’s 11 Prefecture-level Cities in terms of the Six Evaluation Aspects (2019).
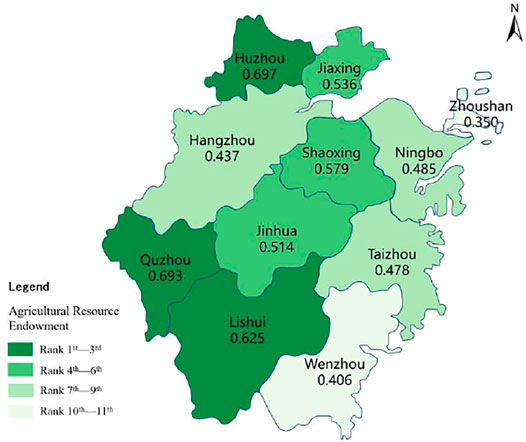
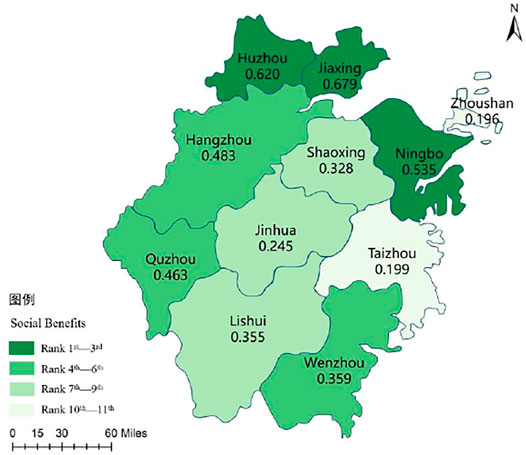
Regions were compared in terms of the six evaluation aspects. As shown in Figure 2, when land and forest resources are considered, Zhejiang’s northern and southwestern regions were better than its eastern and southeastern ones in terms of agricultural resource endowment. In other words, plains and mountainous areas were endowed with more agricultural resources than coastal (island) areas. Figure 3 shows that in terms of agricultural production level, Zhejiang’s northern areas were superior to its southern ones, revealing the advantage of plains in agricultural mechanization and scale management. Regarding the aspect of agricultural science and technology level, as seen in Figure 4, factors such as the training of agricultural technicians, promotion of improved crop varieties, and investment in agricultural technologies were all subject to government policies. Regarding ecological benefits, the regions varied quite significantly in terms of comprehensive, intensive, and recycled use of agricultural resources, as shown in Figure 5. The top 3 cities were Huzhou, the northernmost prefecture-level city in Zhejiang, Wenzhou, the southernmost, and Zhoushan, the easternmost; in the last two places were Jiaxing and Ningbo, both of which are in the northeastern part of Zhejiang. Regarding economic benefits, regional disparities were most evident in agricultural labor productivity and output value, as shown in Figure 6, with a decreasing trend from Zhejiang’s northeast to its southwest. Concerning social benefits, as shown in Figure 7, the regions differed in terms of guaranteed supply of essential agricultural products, labor force structure, financial support for agriculture, and the building of their agricultural product brands. Overall, Zhejiang’s northern part delivered more social benefits than its southern part, while its western part performed better than its eastern part.
4.3 County-Level Spatial Variations (2019)
To fully implement the spirit of the 19th CPC National Congress and apply the new development philosophy, China approved the first batch of 40 national ASD pilot demonstration zones (hereinafter referred to as “pilot demonstration zones”) in accordance with two regulations: the “Notice of Eight Departments Including the Ministry of Agriculture and Rural Affairs on Issuing the Scheme for Building National Agricultural Sustainable Development Pilot Demonstration Zones” and the “Notice of the General Office of the Ministry of Agriculture and Rural Affairs on Carrying Out the Selection of First-Batch National Agricultural Sustainable Development Pilot Demonstration Zones.” To better quantify the achievements of the pilot program, the Ministry of Agriculture and Rural Affairs selected a sample of 25 counties (cities and districts) for data monitoring; therefore, they were selected in the present study for the evaluation of ASD at the county level.
4.3.1 Overall Situation
As shown in Table 7, the ASD indices (relative closeness, C) for the 25 pilot demonstration zones in 2019 varied between 0.366 and 0.615. Among them, Yuyao City ranked first, followed by Deqing County and Jiashan County, while Suichang County ranked last, following the Wucheng and Liandu districts. Overall, there were no significant disparities in sustainable agriculture across most zones.
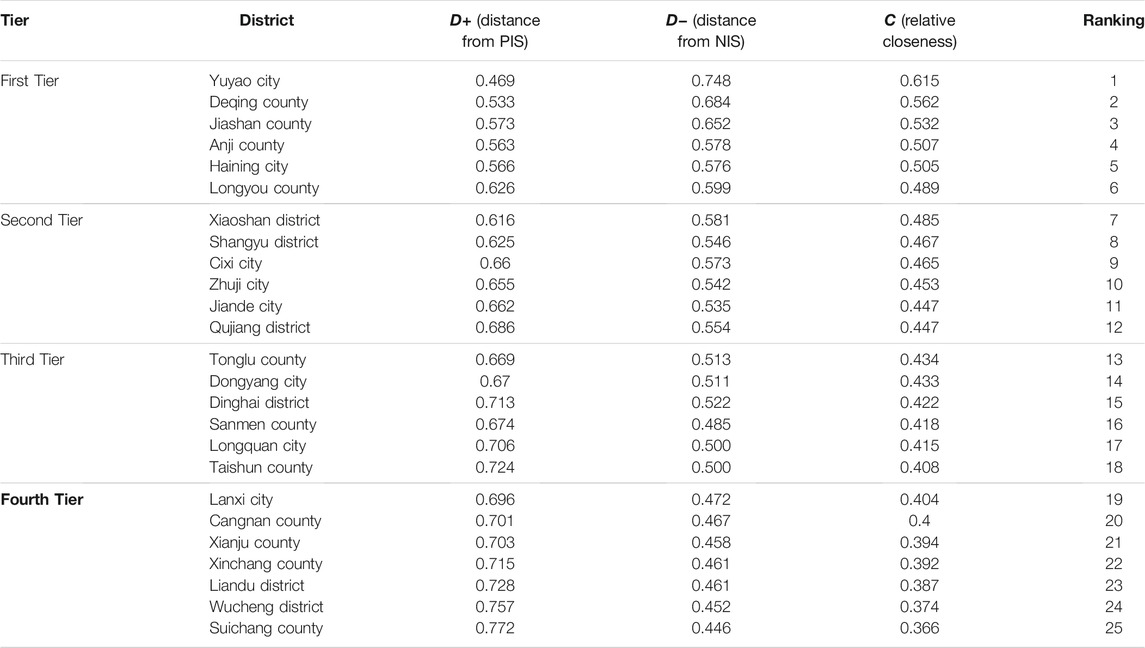
TABLE 7. Evaluation Results for Agricultural Sustainable Development in 25 Pilot Demonstration Zones.
4.3.2 Between-County Disparities in the Six Evaluation Aspects
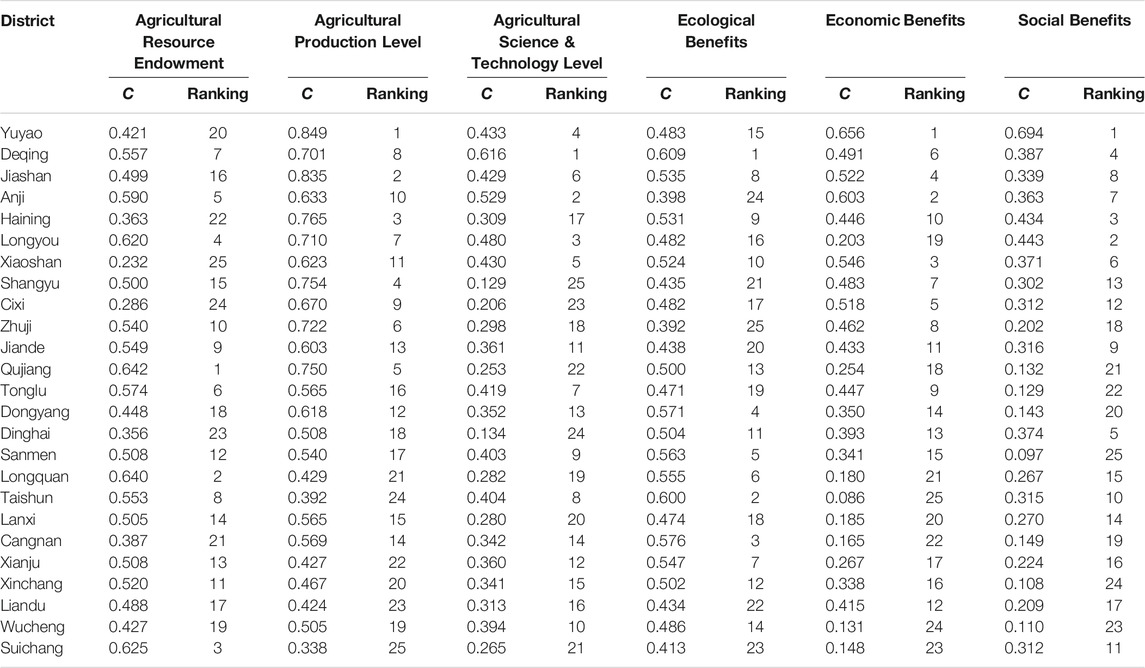
Regarding the six evaluation aspects (see Table 8), Yuyao ranked first in terms of agricultural production level, economic benefits, and social benefits, whereas Deqing ranked first in terms of agricultural science and technology level and ecological benefits. Regarding between-county disparities, the relative closeness, C, was the highest for agricultural production level (Yuyao, 0.849) and lowest for economic benefits (Taishun, 0.086). Its mean was also highest for agricultural production level (0.598), while it was lowest for social benefits (0.280). The between-county disparity was the most significant in terms of social benefits, with the difference in the value of C reaching 0.597, while it was the least significant in terms of ecological benefits, with a difference of only 0.217.
Regarding agricultural resource endowment, the value of C for the 25 pilot demonstration zones varied between 0.232 and 0.642, with Qujiang ranking first, followed by Longquan and Suichang, and Xiaoshan ranking last. The 25 pilot demonstration zones showed great disparities in their cultivated land areas, with a gap of 0.411 between Qujiang and Xiaoshan. However, the growth of the agricultural economy at the county level was not affected by the stock of raw resources, as the more developed districts, such as Xiaoshan, Cixi, and Haining, did not enjoy advantages in terms of agricultural resource endowment. By contrast, the districts endowed with more abundant agricultural resources, such as Longquan and Suichang, ranked among the bottom.
In terms of agricultural production level, the value of C for the 25 pilot demonstration zones varied between 0.338 and 0.849, with Yuyao ranking first, followed by Jiashan and Haining, and Suichang ranking last, following Taishun and Liandu. The gap between Yuyao and Suichang was 0.511; however, despite a few exceptions, the between-county disparities were generally small. Mountainous and hilly areas, constrained by their landforms, have difficulty developing large-scale, intensive, and mechanized agricultural production, leading to a relatively low production level.
Regarding agricultural science and technology level, the value of C for the 25 pilot demonstration zones varied between 0.129 and 0.616, with Deqing ranking first, followed by Anji and Longyou, and Suichang ranking last, following Dinghai and Cixi. Overall, the 25 pilot demonstration zones made great progress in their agricultural science and technology development; however, between-county disparities were evident, with the gap between Deqing and Shangyu at 0.487. The results also revealed a large disparity between agricultural labor force and government investment in science and technology at the county level.
In respect of ecological benefits, the value of C for the 25 pilot demonstration zones varied between 0.392 and 0.609, with Deqing ranking first, followed by Taishun and Cangnan, and Zhuji ranking last, following Anji and Suichang. Ecological benefits showed the smallest between-county disparity of 0.217, while mountainous areas also had an advantage in terms of the reduced and recycled use of resources.
Regarding economic benefits, the value of C for the 25 pilot demonstration zones varied between 0.086 and 0.656, with Yuyao ranking first, followed by Anji and Xiaoshan, and Taishun ranking last (0.086), following Wucheng and Suichang. Overall, there were evident disparities across the 25 zones, with the difference between Yuyao and Taishun reaching 0.570 (the second-largest), revealing a wide gap in agricultural income and productivity at the county level. Thus, while promoting agricultural productivity and farmers’ living standards, it is also imperative to allow full play to the advantages of regions with higher productivity to increase the productivity and thus the income of farmers in the mountainous areas.
In respect of social benefits, the value of C for the 25 pilot demonstration zones varied between 0.097 and 0.694, with Yuyao ranking first, followed by Longyou and Haining, and Sanmen ranking last, following Xinchang and Wucheng. Overall, the social benefits delivered by ASD showed the largest between-county disparity, as the difference between Yuyao and Sanmen stood at 0.597.
5 Conclusion and Implications
The RUE-based evaluation index system for sustainable agriculture had the greatest weight in the evaluation system, which showed that it was comprehensive, comprising “Wuli (RUE), Shili (sustainability of agriculture), and Renli (sustainability of farmers)” (WSR). Chronologically, Zhejiang made steady progress in its ASD from 2013 to 2019, despite slight fluctuations. Spatially, evident regional disparities were found across its 11 prefecture-level cities and 25 pilot demonstration zones, particularly in terms of the maximum–minimum difference in the value of C; ecological benefits and agricultural resource endowment showed relatively small disparities at the city and county levels. In addition, economic benefits increased substantially over the years and showed a decreasing trend from Zhejiang’s southeast to its northwest. As the 26 mountainous counties scored low in economic benefits, this becomes an urgent issue to be addressed during the establishment of Zhejiang as a demonstration zone for common prosperity. As a resource-limited province, Zhejiang does not enjoy advantages in its agricultural resources. Generally, plain areas have outstanding arable land resource endowments but insufficient forest resources; mountain areas have outstanding forest resource endowments but insufficient arable land resources; island areas have insufficient arable land and freshwater resources; and all resources in semi-mountainous areas are relatively balanced. Comparatively, its land per capita is almost equivalent to that of South Korea, Japan, and the Netherlands, while its cultivated land per capita is close to that of Japan and South Korea. Zhejiang’s forest area per capita is close to that of Germany and South Korea, and its freshwater resources per capita is close to that of the United Kingdom and Japan. For regions with better economic development yet more limited resources, it is imperative to strengthen the intensive and recycled use of resources to comprehensive promote their ASD. Zhejiang’s practices in improving RUE and promoting ASD offer valuable references to other countries.
The first is efficient use of land resources. Cultivated land resources have been found to have far-reaching influences on agricultural production. As plains are more suitable for large-scale, mechanized, and intensive production, they hold an advantage over mountainous and island areas. Facing a shortage of cultivated land per capita and inadequate food supply, Zhejiang was the first province in China to establish functional areas for grain production; the province applied the innovative model of “half-a-ton of grain or a net profit of over 10,000 yuan per mu” and “evaluation only based on the grain output per mu,” ensuring the farming function of 8.1 million mu of grain production areas. In addition, Zhejiang has carried out comprehensive land consolidation and province-wide ecological restoration and optimized the coordination of ecological, agricultural, and construction functions in rural areas. Specifically, it has carried out comprehensive total factor consolidation regarding “farmland, water, forest, roads, and villages,” thus promoting the quality of high-standard farmland. Moreover, Zhejiang has accelerated the building of digital villages and digitization of rural land, enabling the digital registration, transfer, and distribution of scattered farmland among rural households.
Second, there is efficient use of forest and water resources. Zhejiang is confronted by a regional or seasonal shortage of water resources, despite a bare balance between supply and demand. In response, Zhejiang has promoted agricultural water conservation and upgraded its farmland irrigation and drainage systems. It encourages water-saving irrigation in farming and automatic water-saving measures in animal husbandry, and has piloted the water recycling program of “treated waste-water for farmland irrigation.” In addition, Zhejiang has implemented the project of “one village, ten thousand trees,” which aims to plant 10,000 trees, mostly precious or local timber species, in one village, to develop a village-greening pattern of “one product for each village, one scenic view for each road, and one industry for each timber species,” Furthermore, Zhejiang is committed to translating its lucid waters and lush mountains into invaluable assets and ecological advantages into economic ones. By exploring the gross ecosystem production (GEP) accounting system, Zhejiang promotes the coordinated development of its ecological agriculture, industry, and services.
The third reference relates to the introduction and training of the rural labor force. Facing a structural shortage of rural labor force, Zhejiang was the first province in China to promote the campaign for “bringing technologies and funds to villages, and encouraging young people and talent to return to villages.” In addition, Zhejiang has made great efforts to promote the cultivation of new main agricultural management bodies, such as large-scale farmers, family farms, specialized cooperatives, and leading enterprises. By advancing the centralized, continuous, and long-term transfer of rural land to the new main bodies, Zhejiang encourages appropriate scale management in agriculture. Additionally, Zhejiang was also among the first to establish an agronomist college and launch the qualification assessment for senior professional titles for farmers, building a training system with “farmers’ university, farmers’ college, farmers’ school, and field school” at its core.
The fourth relates to efficient use of agricultural material goods. To phase out its traditional production methods featuring high carbon emissions and large material input, Zhejiang has followed through with the requirement for “one control, two reductions, three basics,“1 and promoted the standardization of the industrial chain of green agriculture. Consequently, it was among the first to establish a recycling mechanism for pesticide packaging wastes, with the wastes “collected by market entities, disposed of by professional institutions, and the whole project supported by public finance.” Moreover, Zhejiang has continued with the reform of the “real-name system and quota system for chemical fertilizer and pesticides,” and built corresponding demonstration zones. By substituting organic fertilizer for chemical fertilizer, applying fertilizer based on soil testing, promoting the use of new fertilizer, and advancing the professional and unified prevention and control of pesticide and disease, Zhejiang has built itself into a national model of “pesticides and fertilizer reduction.”
The fifth valuable reference entails empowerment through science and technology. Agricultural science and technology levels were subject to government policies, and policy changes have led to temporal and spatial variations in agricultural science and technology development. Zhejiang has taken the lead in empowering agriculture with science, technology, and mechanization to promote its agricultural productivity and efficiency in an all-around manner and to win the battle for high-quality agricultural development. To advance technological innovation and its application in agriculture, Zhejiang has focused on three aspects: modern agricultural biotechnologies; green, intelligent, and efficient agricultural production technologies; and the quality and life health of agricultural products. Considering its farming conditions, Zhejiang has developed miniature, portable, and versatile agricultural machinery that is suitable for hilly areas, greenhouses, and family farms. With the improvement in the mechanization level of farmland and the combination of agronomy and agricultural machinery, farmers in Zhejiang can use agricultural machinery free from worry and at a more affordable price.
Data Availability Statement
The data are available upon request at ZnVsbDE5ODgxMTI5QDEyNi5jb20=.
Author Contributions
LF contributed to conception and design of the study, performed the statistical analysis and wrote the first draft of the manuscript. XM organized the database. XM and JW wrote sections of the manuscript. All authors contributed to manuscript revision, read, and approved the submitted version.
Funding
We appreciate the funds from the National Natural Science Foundation of China (Grant No. 71903178); Soft Science Project of the Science Technology Department of Zhejiang Province (Grant No. 2019C35011); Soft Science Project of the Science Technology Department of Zhejiang Province (Grant No. 2020C35004).
Conflict of Interest
The authors declare that the research was conducted in the absence of any commercial or financial relationships that could be construed as a potential conflict of interest.
Publisher’s Note
All claims expressed in this article are solely those of the authors and do not necessarily represent those of their affiliated organizations, or those of the publisher, the editors and the reviewers. Any product that may be evaluated in this article, or claim that may be made by its manufacturer, is not guaranteed or endorsed by the publisher.
Footnotes
1One control, two reductions, three basics: “one control” refers to controlling the total amount of water used in agriculture and agricultural water pollution; “two reductions” refer to reducing the use of pesticides and fertilizer; and “three basics” refer to the basic realization of recycling and non-hazardous treatment of animal manures, agricultural plastic films, and straw.
References
Füsun Tatlıdil, F. F., Boz, İ., and Tatlidil, H. (2009). Farmers’ Perception of Sustainable Agriculture and its Determinants: A Case Study in Kahramanmaras Province of Turkey. Environ. Dev. Sustainability. 11, 1091–1106.
Harwood, R. R. (2020). A History of Sustainable Agriculture. Sustainable Agricultural Systems. Boca Raton, FL: CRC Press, 3–19. doi:10.1201/9781003070474-2A History of Sustainable Agriculture
Hobbs, P. R., Sayre, K., and Gupta, R. (2008). The Role of Conservation Agriculture in Sustainable Agriculture. Phil. Trans. R. Soc. B 363, 543–555. doi:10.1098/rstb.2007.2169
Kilian, B., Jones, C., Pratt, L., and Villalobos, A. (2006). Is Sustainable Agriculture a Viable Strategy to Improve Farm Income in Central America? A Case Study on Coffee. J. Business Res. 59, 322–330. doi:10.1016/j.jbusres.2005.09.015
Luo, X., Liao, J., and Hu, L. (2016). Improving Agricultural Mechanization Level to Promote Agricultural Sustainable Development. Trans. Chin. Soc. Agric. Eng. 32, 1–11.
Millennium Ecosystem Assessment (2005). Mea. Ecosystems and Human Well-Being. Washington, DC: Island Press.
Muller, A. (2009). Sustainable Agriculture and the Production of Biomass for Energy Use. Climatic Change 94, 319–331. doi:10.1007/s10584-008-9501-2
Ngo, T., Nguyen, H. D., Ho, H., Nguyen, V. K., Dao, T. T. T., and Nguyen, H. T. H. (2021). Assessing the important factors of sustainable agriculture development: An Indicateurs de Durabilité des Exploitations Agricoles ‐ Analytic Hierarchy Process study in the northern region of Vietnam. Sust. Dev. 29, 327–338. doi:10.1002/sd.2148
Reytar, K., Hanson, C., and Henninger, N. (2014). Indicators of Sustainable Agriculture: A Scoping Analysis. Washington, DC: World Resources Institute.
Sands, G. R., and Podmore, T. H. (2000). A Generalized Environmental Sustainability index for Agricultural Systems. Agric. Ecosyst. Environ. 79, 29–41. doi:10.1016/s0167-8809(99)00147-4
Sarkar, A., Azim, J. A., Asif, A. A., Qian, L., and Peau, A. K. (2021). Structural Equation Modeling for Indicators of Sustainable Agriculture: Prospective of a Developing Country's Agriculture. Land Use Policy 109, 105638. doi:10.1016/j.landusepol.2021.105638
Velten, S., Leventon, J., Jager, N., and Newig, J. (2015). What Is Sustainable Agriculture? A Systematic Review. Sustainability 7, 7833–7865. doi:10.3390/su7067833
Wezel, A., Casagrande, M., Celette, F., Vian, J.-F., Ferrer, A., and Peigné, J. (2014). Agroecological Practices for Sustainable Agriculture. A Review. Agron. Sustain. Dev. 34, 1–20. doi:10.1007/s13593-013-0180-7
Zahm, F., Ugaglia, A., and Barbier, J. M. (2018). Evaluating Sustainability of Farms: Introducing a New Conceptual Framework Based on Three Dimensions and Five Key Properties Relating to the Sustainability of Agriculture. Chania, Greece: Eur. IFSA Symposium.
Zhao, D., Liu, C., and Bao, B. (2018). Agricultural Sustainable Development Ability Evaluation and Subsystem Coordination Degree Analysis: Take the Major Grain-Producing Areas of China as an Example. Econ. Geogr. 38, 157–163.
Keywords: agricultural sustainable development, resource use efficiency, entropy weight TOPSIS method, Zhejiang, temporal and spatial variations
Citation: Fu L, Mao X, Mao X and Wang J (2022) Evaluation of Agricultural Sustainable Development Based on Resource Use Efficiency: Empirical Evidence From Zhejiang Province, China. Front. Environ. Sci. 10:860481. doi: 10.3389/fenvs.2022.860481
Received: 23 January 2022; Accepted: 08 February 2022;
Published: 03 March 2022.
Edited by:
Huaping Sun, Jiangsu University, ChinaReviewed by:
Long Qian, Nanjing University of Finance and Economics, ChinaXinjie Shi, Zhejiang University, China
Yan Zhang, Lanzhou University, China
Copyright © 2022 Fu, Mao, Mao and Wang. This is an open-access article distributed under the terms of the Creative Commons Attribution License (CC BY). The use, distribution or reproduction in other forums is permitted, provided the original author(s) and the copyright owner(s) are credited and that the original publication in this journal is cited, in accordance with accepted academic practice. No use, distribution or reproduction is permitted which does not comply with these terms.
*Correspondence: Xiaobao Mao, bTEzNjI1NzFAMTYzLmNvbQ==
 Linlin Fu
 Xiaobao Mao*