
95% of researchers rate our articles as excellent or good
Learn more about the work of our research integrity team to safeguard the quality of each article we publish.
Find out more
ORIGINAL RESEARCH article
Front. Environ. Sci. , 04 March 2022
Sec. Soil Processes
Volume 10 - 2022 | https://doi.org/10.3389/fenvs.2022.858816
This article is part of the Research Topic Better Management of Phosphorus Fertilizer in Intensive Cropping Systems: An Approach Basing on Integrated Agronomic, Ecological and Environmental Compromises View all 11 articles
 Xiaojun Yan1†Guohua Li2,3†Weiqiang Zhang1†Muhammad Atif Muneer1Wenjia Yu4Changcheng Ma1
 Liangquan Wu1*
Phosphorus (P) is a non-renewable source, requires in large amount for maintaining better crop growth and development. The excessive P fertilizer contributes to the accumulation of P in the soil and results in increased soil total P and Olsen P. However, the spatio-temporal variation of soil P remains unclear in pomelo orchard systems. Therefore, this study aimed to assess the temporal and spatial variation of soil P in pomelo orchards and future to predict P pool from 1985 to 2100, based on the dynamic P pool simulator (DPPS) model. We found that an average of 282.23 kg P ha−1 yr−1 accumulated in pomelo orchard soil, resulting in increased concentration of Olsen P (i.e., 5–212 mg kg−1) and total P (i.e., 80–1883 mg kg−1) in the topsoil. It showed that Olsen P and total P pools increased in topsoil about 42 and 25 folds, respectively from 1985 to 2015. Soil P accumulation occurred not only in topsoil but also found in deeper soil horizon of pomelo orchard. Compared with the natural forest, the concentration of Olsen P and fractions (Al-P and Fe-P) in 20-year-old pomelo orchard increased significantly in soil depth of 0–120 cm, while Sol-P increased significantly in 0–60 cm soil depth. Scenario analyses from 1985 to 2100 indicated that the P application rate at 31 kg P ha−1 could maintain pomelo yield at its optimum level. These findings could provide the synthesized novel insight for understanding the soil P status and its sustainable management in the pomelo orchard systems.
Phosphorus (P) is one of the essential nutritional elements for plant growth and development (Smith et al., 2011). It plays an important role in maintaining soils fertility and sustainable agricultural production. However, it could be a future constraint for the agricultural system owing to the depletion of P resources (Van Vuuren et al., 2010; Reijnders, 2014; Yan et al., 2020). The modern agricultural system is mainly dependent on P derived from phosphate rock, a non-renewable resource, and current P global reserves could be depleted in the next 50–100 years (Cordell et al., 2009). Therefore, future sustainable agriculture development is needed to exploit P legacy reserves in soil for improving P use efficiency in various cropping systems.
The excess use of P fertilizer results in a large amount of P accumulation (Sharma et al., 2017). Zhang et al. (2017) investigated the global croplands and found the P pool increased rapidly from 1900 to 2010 in soils of Europe (+31%), South America (+2%), North America (+15%), Asia (+17%), and Oceania (+17%). In China, the consumption of chemical P fertilizers has been increased from 1.23 million metric tonnes (Mt) (1980) to 5.54 Mt (2007), and only 15–20% of the P applied was taken up by plants in the growing season (Zhang et al., 2008). An average of 8.96 kg P ha−1 yr−1accumulated in soil for field crop production during 1980–2007, whereas soil Olsen P increased from 7.4 to 24.7 mg kg−1 (Li et al., 2011). Besides, Chen et al. (2017) found that the P budget per cropland area ranged from 35 to 66 kg ha−1 yr−1 in the Yong’an watershed, eastern China, and total P in surface soil (0–20 cm) significantly increased by 107–640 mg kg−1 from 1984 to 2009. To date, it is well established that the level of P pools in field cropland soils increases with the increase of cropping history, but the status of P pools in orchards of acidic soil regions, i.e., characterized by high nutrient input, is far from being understood (Zhang et al., 2011).
So far, P over-fertilization builds up P reserves in soils that may remain accessible to plants (Roberts and Johnston, 2015). Dynamic P pool simulator (DPPS) is a simple two P pool model used to simulate the P transformations in soil and buildup of the residual soil P pools (Sattari et al., 2012). As a widely used model, DPPS has reported that the soil has a high P supply potential from residual soil P pool due to the cumulative input of P grossly exceeding the cumulative P uptake by crops in Europe (Sattari et al., 2012). It is also suggested that 20% of P fertilizer could be saved until 2050 by exploiting the residual P in China (Sattari et al., 2014). Residual soil P pool could also supply for decades of cultivation in Brazilian agriculture, which also can buffer the impact of a sharp increase in the price of P fertilizer (Withers et al., 2018). Nevertheless, the prediction of P pools by the DPPS model should be implemented in the orchard systems (Lu et al., 2012), so that dynamic changes of P pool could be predicted and sensible P management strategies could be adopted for agriculture sustainability.
Likewise, the deep soil P reserves may not be neglected for P sustainable management in orchards system. The previous report has found that high P reserves availability in deep soil layers results in a higher P leaching rate (Khan et al., 2019). The variation of soil P pools along the soil horizons is preferentially influenced by agronomic management practices, e.g., P fertilizer application rate (Damian et al., 2020). However, the majority of studies on soil P pools have mainly focused exclusively on the topsoil layer (0–20 cm) rather than deep soils (García-Oliva et al., 2018; Jiménez et al., 2019). Furthermore, unveiling the availability of P reservoirs for plants requires detailed chemical speciation of abundant soil P components by sequential extraction schemes (Maranguit et al., 2017). Two broad categories of soil P pools are inorganic P (Pi) and organic P (Org–P). Inorganic P (Pi) is considered a major source of available P in soils (Waqas et al., 2019). Most of the Pi is accumulated in association with aluminum and iron compounds in the acidic soils, whereas in calcareous soils, calcium phosphate is the main form (Pizzeghello et al., 2011; Turner and Blackwell, 2013). Long-term excessive P application significantly impacted the soil P fractions in pomelo orchards (Chen et al., 2022). However, most of the previous studies have focused on the soil P pools in topsoil, and only limited studies have explicitly focused on the P pools and their components in whole soil profiles under long-term cultivation.
Citrus is the leading fruit crop globally. Over 140 countries have been producing citrus fruits, and China is one of the leading producers, with an annual citrus production of 5,121 × 104 tons in 2020 (NBS, 2021). Pomelo (Citrus grandis) is the third major type of citrus after Citrus reticulata and Citrus sinensis. The pomelo production in Pinghe County have increased rapidly over the past three decades, and it is the most famous and largest pomelo production county estimated the output accounts for more than 80% of the domestic production (Wei et al., 2020). Although pomelo industry has become important source of finance, but it also faced a huge challenge in P fertilizer management, e.g. most farmers are still applying much more P fertilizer than recommended in the past decades (Li et al., 2019; Chen et al., 2020). Therefore, this study was designed to answer the following research questions: 1) what is the difference of the P pools in surface soil (0–20 cm) during 1985, 2005, 2010, and 2015 (temporal variation of P pools) in Pinghe County? 2) What is the impact of the long-term P fertilizer on P pools in the 20-year-old pomelo orchard compared to the natural forest (spatial variation of P pools) in soil profiles from 0 to 200 cm? 3) How could the P application influence the P reservoirs? The key objectives of this study were to 1) estimate the temporal and spatial variation of P pools in pomelo production in Pinghe County 2) predict the P dynamics during 2016–2100. We hypothesize that P fertilizer input in pomelo production may increase the P accumulation from 1985 to 2015 and could affect the P distribution in the whole soil profile.
The study area is in Pinghe County (24°02′–24°35′ N, 116°54′–117°31′ E, and 10–1,545 m above sea level), Zhangzhou City, Fujian Province, Southeast China (Figure 1). It is characterized by a subtropical oceanic monsoon climate with an annual average temperature of 17.5–21.3°C, annual precipitation 1,600–2,000 mm, and the soil type is ferrallisols, which is classified as the red soil in the Chinese soil classification (Smith, 2014). Low-elevation mountains and hills constitute the main types of landforms in Pinghe County. These landforms are mostly distributed in the valleys and intermountain regions of the Huashanxi basin, accounting for 91.5% of the total area.
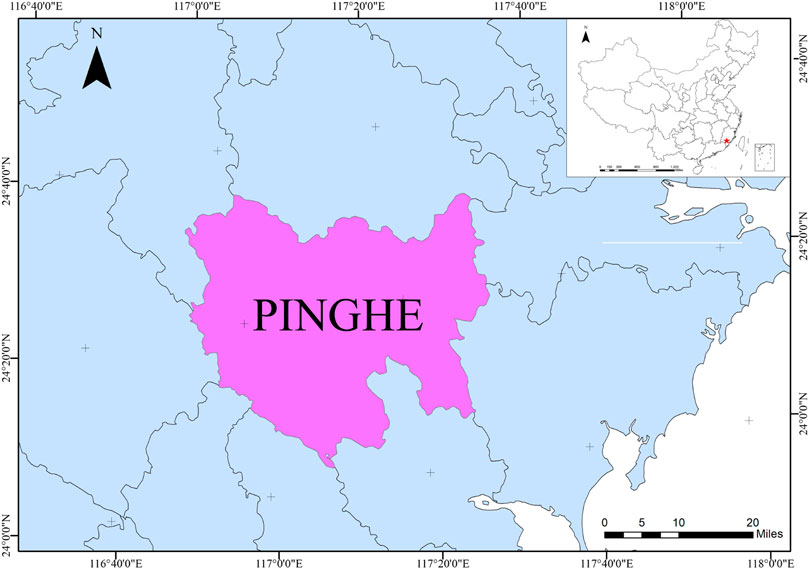
FIGURE 1. Geographical distribution of the Pinghe County in China.
Data on P fertilizer input and pomelo yield from 1985 to 2015 were collected by interviewing the local farmer and Pinghe Statistical Yearbook 1985–2015. The concentration of P in the pomelo orchard system was collected from the published literature (Xu, 2019). The value of P uptake was calculated by multiplying the pomelo yield by its P concentration.
Soil samples were collected randomly from surface soil (0–20 cm) in 4 years (i.e., 1985, 2005, 2010, and 2015). Each soil sample was a composite of four sub-samples taken from a single orchard. Finally, 3,040 composite samples (1985, 12; 2005, 2,386; 2010, 297; and 2015, 345) were collected for this study. Besides, in early November 2019, soil samples from natural forest and 20-year-old pomelo orchard were also collected. Three sampling sites were selected for each treatment. Each soil sample was a composite of five sub-samples, and soil samples were collected from 10 soil layers (i.e., 0–200 cm, each at 20 cm intervals). All soil sampling was performed away from the trunk at the drip line of the plant, using a soil core sampler (3 cm diameter) after removing plant biomass and litter. To avoid the fertilization and edge effects, soil samples were collected from the center of each orchard after harvesting.
All soil samples were air-dried, visible root segments and organic debris were removed by shaking and with forcep. Air-dried soil samples were sieved through a 2 mm sieve to determine soil available phosphorus (Olsen P), representative sub-samples were passed through a 0.25 mm sieve to determine soil organic matter (SOM), total phosphorus, and phosphorus fraction (P fraction). P fraction was determined only in soils collected from natural forest and 20-year-old pomelo orchard. Briefly, Olsen P was extracted using 0.5 mol L−1 NaHCO3 at pH 8.5 (Li Y. et al., 2015), total P was extracted using aqua regia (HCl/HNO3 mix) (Aainaa et al., 2018). Both these P forms were analyzed using the molybdate blue procedure (Murphy and Riley, 1962). SOM was determined using K2CrO7 oxidation with the heated oil bath method (Li Y. et al., 2015). P fraction was measured according to the method described by (Yan et al., 2020). Specifically, the soil Pi was divided into easily soluble P (Sol-P; extracted with ammonium chloride at 1 mol L−1 NH4Cl), aluminum P (Al–P; extracted with ammonium fluoride at 0.5 mol L−1 NH4F, pH = 8.2), iron P (Fe–P; extracted with sodium hydroxide at 0.1 mol L−1 NaOH), occluded P (O-P; extracted with sodium citrate and dithionite at 0.3 mol L−1 Na3C6H5O7.2H2O and 1 g Na2S2O4) and calcium P (Ca-P; extracted with sulfuric acid at 0.25 mol L−1 H2SO4), and Org-P was estimated by pyrolyzing in a 550°C muffle furnace under ignition (Chen et al., 2022).
The dynamic P pool simulator (DPPS) model, including two dynamic P pools, was used to simulate the long-term historical annual P uptake by plants for a time series of P inputs and to estimate the future P inputs for a specific future target P uptake (Wolf et al., 1987; Sattari et al., 2012). In general, the major inputs of P for this model mainly included P fertilizer, weathering, and atmospheric deposition, and output sources mainly included P uptake and P loss. The P budget (the differences between inputs and uptake) is allocated to the labile (80%) and stable (20%) pools. These two P pools are mutually transformed every year. A detailed description and application guide of this model can be found in related references (Wolf et al., 1987; Sattari et al., 2012).
Three different scenarios for the 2100 years were built in this study to simulate P legacy changes in the DPPS model; 1) P application rate would be constant at 413.63 kg ha−1 [S1], 2) P application rate would maintain pomelo yield at 2015 level (28.14 t ha−1) [S2], 3) P application rate would be constant at 0 kg ha−1 [S3].
We calculated the P pool (Olsen P pool and total P pool) based on Eq. 1
Where BD (g cm−3) is the soil bulk density, which was calculated with Adams equation (Adams, 1973) (Eq. 2). SOM (g kg−1) is the soil organic matter. PC (mg kg−1) represents the concentration of P (Olsen P, total P) in soil. 20 cm was the surface soil depth. 104 square meters are equal to 1 ha.
Data processing was performed using Microsoft Office Excel 2016, and all statistical analyses were conducted using SPSS 21.0. One-way analysis of variance (ANOVA) and Least Significant Difference (LSD) tests were used to check the differences in P concentrations (Olsen P, total P) among each measurement year and soil layers.
The average amount of annual P input in Pinghe pomelo production was 70.34 kg ha−1 in 1985, peaked at 463.86 kg ha−1 in 2007, and then slightly changed around 413.63–460.76 kg ha−1 from 2008 to 2015. The amount of P output was much lower than those of P application. Average annual P output increased from 0.15 kg ha−1 in 1985 to 19.13 kg ha−1 in 2015. Therefore, annual P surplus ranged from 70.19 to 449.12 kg ha−1 with an average of 282.23 kg ha−1 (Figure 2).
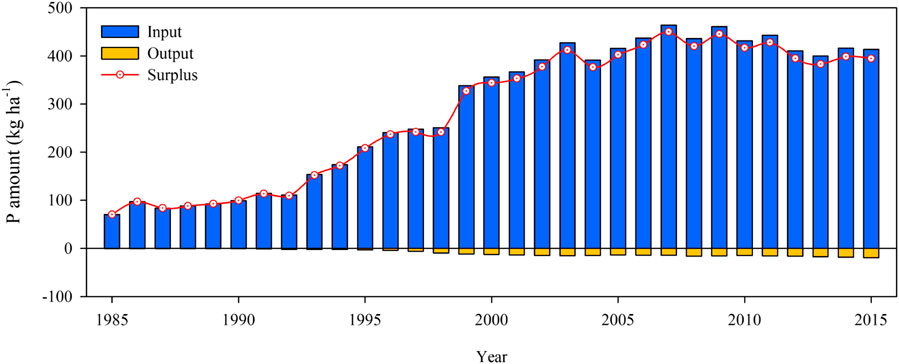
FIGURE 2. Historical P input, output, and surplus in pomelo production for the period 1985–2015.
Generally, the average soil P concentration and P pool showed an increasing trend during the 30 years (Figures 3, 4). The results of the analysis of variance showed that the concentration of soil P was significantly affected by years. Compared with 1985, Olsen P concentration in 2015 increased by 41-fold, while total P concentration increased by 24-fold (Figure 3). The corresponding Olsen P pool and total P pool increased by 42 and 25-fold, which increased from 7 to 297 kg ha−1 and 105–2,675 kg ha−1, respectively (Figure 4).
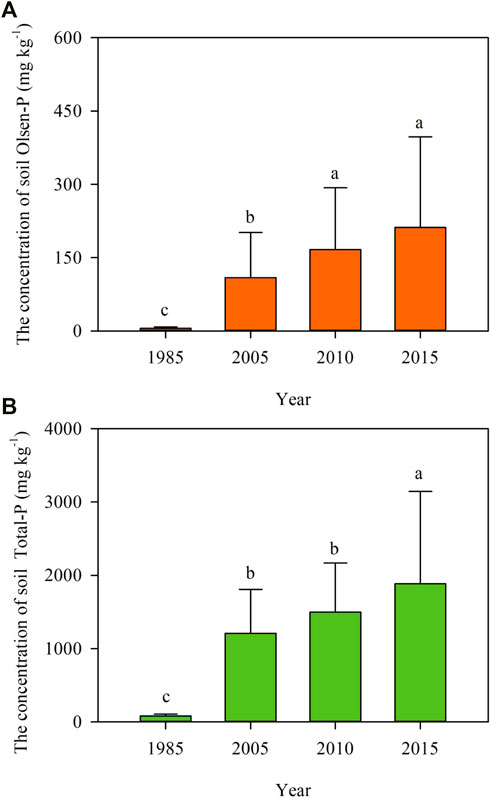
FIGURE 3. Temporal changes in the concentration of Olsen-P (A) and Total-P (B) in Pinghe County over the 1985–2015 study period. Bars indicate mean ± SD. Different letters on the bars indicate a significant difference between different years.
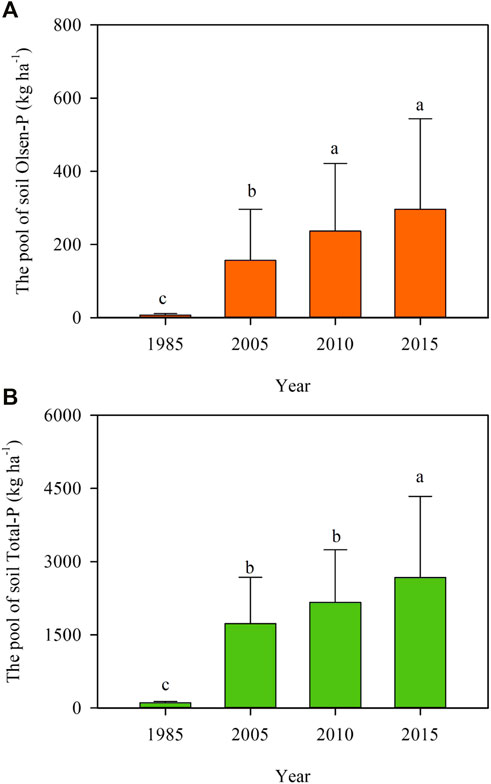
FIGURE 4. Temporal changes in the Olsen-P pool (A) and Total-P pool (B) in Pinghe County over the 1985–2015 study period. Bars indicate mean ± SD. Different letters on the bars indicate a significant difference between different years.
Overall, the concentration of soil P and P pools in the natural forest did not change significantly with different soil layers. Comparing the 20-year-old pomelo orchard with the natural forest, the concentration of soil P and P pools significantly increased in 0–120 cm soil layers, but the increase rate decreased gradually with the increase in soil depth and then remained almost stable below 120 cm soil layers (Figures 5, 6).
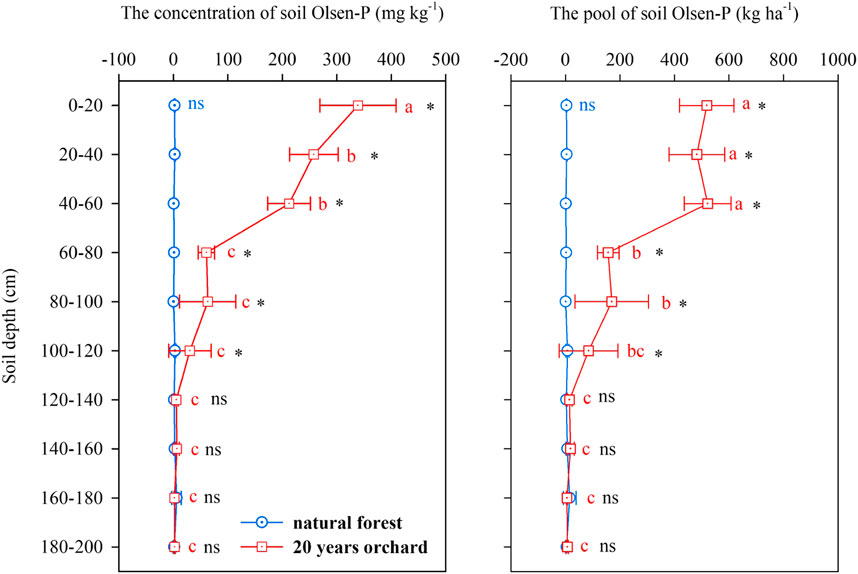
FIGURE 5. Spatial variations of the concentration and pool of Olsen-P in different land-use treatments. Dots indicate mean ± SD (n = 3). Different letters on the dots for the same land use indicate a significant difference between different soil layers. ns indicates no significant difference, *indicates significant difference at p < 0.05 between natural forest and 20 years orchard.
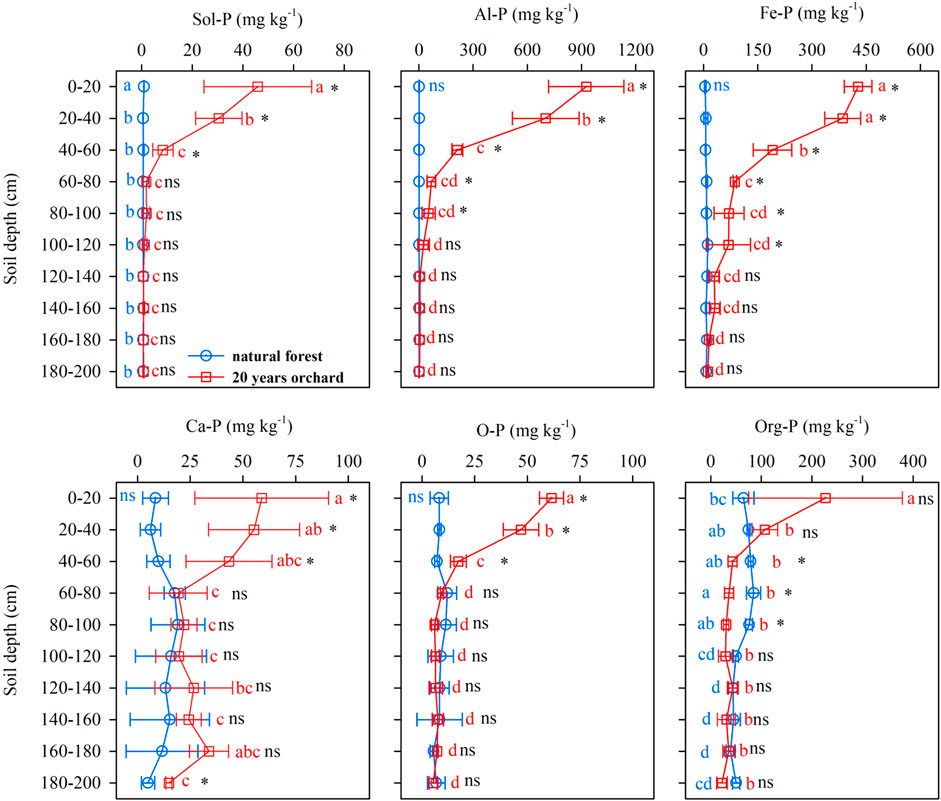
FIGURE 6. Spatial variations of the concentration of P fraction in different land-use treatments. Dots indicate mean ± SD (n = 3). Different letters on the dots for the same land use indicate a significant difference between different soil layers. ns indicates no significant difference, *indicates significant difference at p < 0.05 between natural forest and 20 years orchard.
The average of soil Olsen P concentration and pool in 0–200 cm soil profile was 2.16 mg kg−1 (ranged from 0.29 to 5.80 mg kg−1) and 5.76 kg ha−1 (ranged from 0.66 to 15.66 kg ha−1) for the natural forest (Figure 5). By comparison, the soil Olsen P concentration in 20-year-old pomelo orchard under 0–20, 20–40, 40–60, 60–80, 80–100 and 100–120 cm was 338.66, 257.74, 212.37, 60.62, 63.06 and 30.39 mg kg−1, respectively, and the soil Olsen P concentration ranged from 1.85 to 6.41 mg kg−1 under the soil depth of 120–200 cm (Figure 5). Correspondingly, in the 20-year-old pomelo orchard, the Olsen P pool at 0–120 cm depth decreased from 666.40 to 90.43 kg ha−1 with increase in soil depth, and then stabilized below 120 cm soil depth (Figure 5).
The differences in different P components were very small among diffeent soil layers of the natural forest. The average concentration of Sol-P, Al-P, Fe-P, O-P, Ca-P, and Org-P along with the 0–200 cm soil profile for the natural forest was 0.64 (ranged from 0.56 to 0.88), 0.97 (ranged from 0.45 to 1.47), 8.03 (ranged from 4.65 to 11.64), 12.27 (ranged from 5.01 to 19.15), 8.46 (ranged from 5.50 to 11.94), and 60.64 (ranged from 39.08 to 84.71) mg kg−1, respectively (Figure 6). On contrary, a significant increase in the concentration of soil P fractions was found between 0 and 120 cm soil layers of the 20-year-old pomelo orchard (Figure 6).
The total P pool in the natural forest was increased first and decreased later from 0 to 200 cm soil layer, but the variation was minor. In a natural forest, Org-P was the dominant P fraction, accounting for 55.2–76.6% of the sum of the P fractions, and others in order as follow: O-P > Ca-P > Fe-P > Al-P > Sol-P (Figure 7). For 20-year-old pomelo orchard soil, Al-P and Fe-P were the dominant P fractions with the proportion ranging from 77.2 to 82.0% in the layer of 0–60 cm and 62.4–69.9% in the layer of 60–120 cm, respectively. However, in the soil layer below 120 cm, Org-P and O-P were the dominant P fractions, which was similar to that of natural forest (Figure 7).
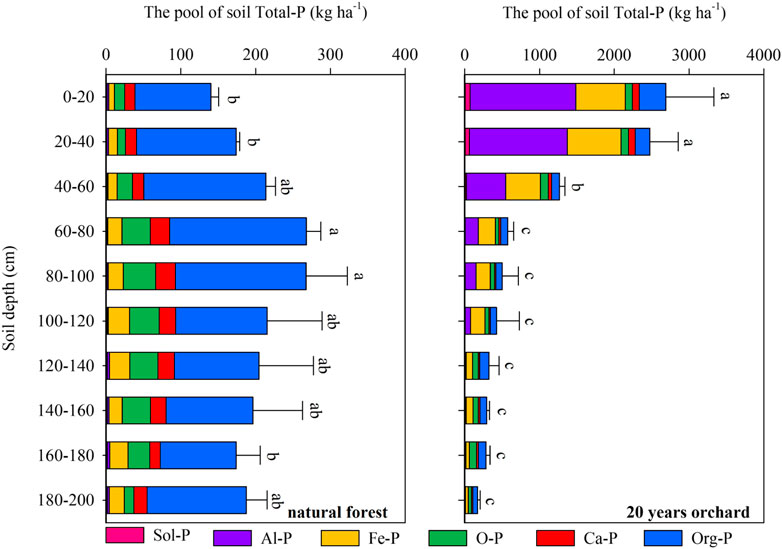
FIGURE 7. Spatial variations of total-P pool in different land-use treatments. Dots indicate mean ± SD (n = 3). Different letters on the dots for the same land use indicate a significant difference between different soil layers.
Labile and stable P pools simulated by DPPS showed a continuous increase from 1985 to 2015 with the annual P application. The labile and stable P pools in 0–20 cm soil layer was increased from 67.49 to 2,235.70 kg ha−1 and 155.15–5,532.95 kg ha−1 from 1980 to 2015, respectively (Figures 8, 9).
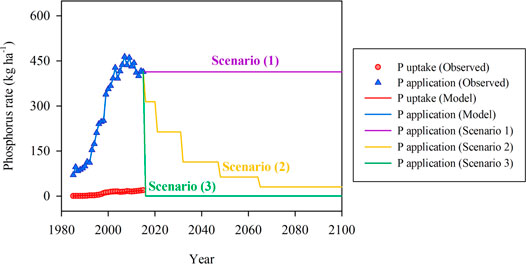
FIGURE 8. Historical P and modeled P application/uptake (observed and simulated by DPPS model) in pomelo production for the period 1985–2015 and the trends of annual P application in pomelo production for the period 2016–2100 according to different scenarios. Scenarios 1 to 3 means the P application rate would be constant at 413.63 kg ha−1, the P application rate would maintain pomelo production at 2015 level (28.14 t ha−1), and the P application rate would be constant at 0 kg ha−1, respectively.
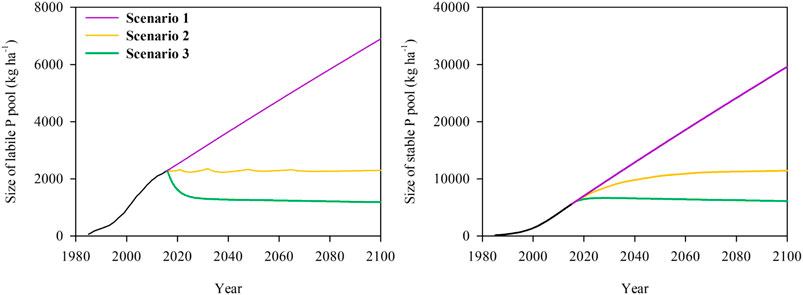
FIGURE 9. The size of labile and stable P pools in 0–20 cm from 1985–2100 according to different scenarios. Scenarios 1 to 3 means the P application rate would be constant at 413.63 kg ha−1, the P application rate would maintain pomelo production at 2015 level (28.14 t ha−1), and the P application rate would be constant at 0 kg ha−1, respectively.
The scenario analysis also showed that the labile P pool would increase from 2,235.70 to 6,892.56 kg ha−1 for the S1; In the S2, the amount of P application decreased and remained relatively constant at approximately 31 kg P ha−1 after 2015 (Figure 8). the labile P pool would remain fairly constant around 2,233.56–2,353.00 kg ha−1 for the S2; and the labile P pool would decrease grafually firstly and then to equilibrium in S3. Meanwhile, the average size of a stable P pool would continue to rise from 5,532.95 kg ha−1 in 2016–29,592.92, 11,423.81, and 6,104.48 kg ha−1 in 2100 for the S1, S2, and S3 scenarios, respectively (Figure 9).
P application was much higher than the uptake by pomelo orchards (Figure 2), thereby, the P surplus in this study (282.23 kg P ha−1) was much higher than the annual average P surplus for field crops production (8.96 kg P ha−1) from 1980 to 2007 in China (Li et al., 2011). Due to study limited resources, it was not possible to quantify the P stored in above ground biomass of the tree, hence, soil P surplus was over-estimated. However, it could not affect the final results because we measured the P accumulation in the soil, and it is generally accepted that soil P accumulation is much higher than tree accumulation (Li G. et al., 2015; Chen et al., 2022). A previous study reported that when the soil P surplus exceeds 4,128 kg P ha−1, there would be a serious risk of P leaching (Chen et al., 2022). In the past 30 years, the soil P surplus exceeds 8,467 kg P ha−1, which was much larger than the safe value. With the P accumulation in the soil, soil Olsen P and total P concentration of surface soil in 2015 were 42 and 24-folds higher, respectively, in comparison with the year 1985 (Figures 3, 4). The increase rate of soil P in the current study was much higher than previous findings (Khan et al., 2018). This difference was mainly attributed to the higher P budget value. There was no big difference in P uptake between pomelo production and field crops production (Macdonald et al., 2011; Sattari et al., 2012; Chen and Graedel, 2016). However, the average amount of P application in pomelo production was about 15-fold higher than field crop production (Macdonald et al., 2011; Sattari et al., 2012; Chen and Graedel, 2016). In the present study, the increased rate of Olsen P and total P was different, which was in agreement with the observations of other authors Bai et al. (2013), who also found that the relationship between total P and Olsen P can be split into two straight lines with two different slopes by a change point, when above the change point, Olsen P exhibited a quicker increase with soil total P.
Typically, the red soils are ancient and highly weathered, and as a result, they are abundant in duricrusts with low P content (Dent et al., 2005). The primary source of soil P in mineral weathering and atmospheric deposition to the natural forest is minimal (Yu et al., 2018). Hence, a small range of variation in Olsen P and P fractions among different soil layers was detected in the natural forest (Figure 5). In contrast, the concentration of Olsen P and P fractions of 20-year-old pomelo orchard increased quickly among 0–120 cm soil layers (Figures 5–7). The difference in soil P status between natural forest and agricultural lands has been verified in many studies, which was strongly influenced by high P fertilizer application (Korai et al., 2018; Xu et al., 2019). Also, a higher level of P input in long-term tea cultivation increased the concentration of soil P significantly at 0–90 cm soil depth (Yan et al., 2018). Overall, the Org-P and O-P were the dominant fractions in natural forest soil. However, the dominant P fractions in the soil layer of 0–120 cm in 20-year-old pomelo orchard were converted to Al-P and Fe-P fraction. The proportion of P fraction changed was closely associated with the size of total P pool, the proportion of Al-P and Fe-P increased with total P increased and became the predominant fractions. The previous study also demonstrated that Al-P presented the greatest liability as plant absorption occurred (Wang et al., 2014). Therefore, the bioavailability of soil P was increased with the net P accumulation in soil. On the other side, the results in the study also implied that there was an increase environmental risk of P leaching in soil layer 0–120 cm in the current pomelo production system. Bai et al. (2013) reported that the P losses via leaching and overland flow greatly increases once the critical Olsen-P values has surpassed 90 mg kg–1 in red soil. Therefore, maximizing the P utilization and mitigation of its environment by P leaching in fruit orchards should be investigated on a priority basis. Hence, an integrated optimal P management for the intensive pomelo production with the high level of P fertilizer application in Pinghe County is urgently needed.
P pool plays a crucial role in sustaining the P uptake, and it has been confirmed by the conceptual model (Sattari et al., 2014). The annual increase rate of soil labile and stable P pools in pomelo orchards from 1985–2015 was almost 16-fold and 8-fold (Figure 9) higher than those of the field crop production system in China (4.4 and 21.7 kg ha−1 yr−1 for labile and stable P pools, respectively) (Yu et al., 2021), and around 43-fold and 20-fold higher than those of field crop production system in the United States (1.6 and 8.7 kg ha−1 yr−1 for labile and stable P pools, respectively) (Zhang et al., 2017), respectively. So, a significant legacy P pool has accumulated in soils of the pomelo orchards where it may be transformed to becoming a vital P source for future agriculture development.
The effects of the different P application rates on the sizes of soil labile and stable P pools during 2015–2100 were simulated by the DPPS model in the study. P pools displayed a sharp rise in S1 compared to past 30-year (Figure 9), consequently, the P management in S1 would have a more significant risk impact on the environment in the future. A recent study reported that the increasing trend of P concentration in the river water would continue in the foreseeable future (Chen et al., 2018). Such increasing trends have also been observed in the United States (Stackpoole et al., 2019). Hence, improved incentives and optimal management strategies are necessary to reduce soil P leaching losses and alleviate environmental water pollution. In the S2, P application would decrease and remain relatively constant at approximately 31 kg ha−1 after 2015 (Figure 8). It was very close to 30–40 kg P ha−1 in United States (Obreza and Morgan, 2008) and 43 kg P ha−1 per year at the yield of 28 t ha−1 for China’s citrus orchard (Li et al., 2019). Even in the S3, the labile P pool firstly decreased gradually in the first 10 years, and then decrease very slowly to the same level as in 2003 until 2100 (Figure 9). Correspondingly, the simulated pomelo yield would be stable in the first 6 years and would decrease gradually to 80% of the yield in 2015 until 2032, then the yield simulated in 2100 would finally drop slowly to approximately 75% of the yield in 2015 (Supplementary Figure S1). However, the situation is not always so straightforward. On the one hand, the agronomically-optimum critical level of Olsen P concentration ranges from 15–80 mg kg−1 for pomelo grown (Liu et al., 2021), but in the current soil Olsen-P is about 212 mg kg–1 (Figure 3). And continued agricultural innovations such as uncover mechanisms by which soil legacy P is mobilized through root physiological and morphological processes and through arbuscular mycorrhizal fungi and P-solubilizing bacteria in rhizosphere and hyphosphere are likely to improve the P use efficiency further, but these potentials were not taken into account in our analysis (Feng et al., 2019). On the other hand, root of the tree much larger than 20 cm, but the current model only considered the topsoil, so 0–20 cm soil layer may provide incomplete information about soil P pool. So, without P application until 2100, this pomelo yield will be no less than 75% of 2015. Therefore, sustainable P management decisions and environmental policymaking strategies must be based on the status quo of the P pool, and also establish the recommended standards for P application in pomelo orchards.
Temporal and spatial variations of P concentrations and P pools were recorded for the pomelo orchard system in China. For temporal analysis, P concentration and P pool increased significantly from 1985 to 2015 in the topsoil of the pomelo orchard system. For spatial analysis, pomelo planting affected the Olsen P concentration and P pool in the deep soil at 0–60 cm. In addition, the scenario analyses indicated that P Pools from 2016 to 2100 could be affected by different P management strategies and could provide a vital resource for future P management in the pomelo orchard system in China. Overall, these findings suggest that the accumulation of P in soil is an important source for future agriculture development and it is very crucial for optimal P management in the pomelo orchard system to prevent the excessive P accumulation for sustainable and green agriculture development, and P resource protection.
The raw data supporting the conclusion of this article will be made available by the authors, without undue reservation.
XY analyzed the data and wrote the manuscript. GL provided the DPPS model and revised the manuscript. WZ analyzed the data and wrote the manuscript. MAM revised the manuscript. WY analyzed the data. CM analyzed the data. LW designed the study and revised the manuscript.
This work were supported by Cooperative Project of Chinese Academy of Engineering (2020-FJ-XZ-8) and National Key Research and Development Program of China (2017YFD0200207).
GL was employed by the company Israel Chemicals Ltd. (ICL).
The remaining authors declare that the research was conducted in the absence of any commercial or financial relationships that could be construed as a potential conflict of interest.
All claims expressed in this article are solely those of the authors and do not necessarily represent those of their affiliated organizations, or those of the publisher, the editors and the reviewers. Any product that may be evaluated in this article, or claim that may be made by its manufacturer, is not guaranteed or endorsed by the publisher.
The Supplementary Material for this article can be found online at: https://www.frontiersin.org/articles/10.3389/fenvs.2022.858816/full#supplementary-material
Adams, W. A. (1973). The Effect of Organic Matter on the Bulk and True Densities of Some Uncultivated Podzolic Soils. J. Soil Sci. 24, 10–17. doi:10.1111/j.1365-2389.1973.tb00737.x
Ahmed, W., Jing, H., Kaillou, L., Qaswar, M., Khan, M. N., Jin, C., et al. (2019). Changes in Phosphorus Fractions Associated with Soil Chemical Properties under Long-Term Organic and Inorganic Fertilization in Paddy Soils of Southern China. PLoS ONE 14, e0216881. e0216881. doi:10.1371/journal.pone.0216881
Bai, Z., Li, H., Yang, X., Zhou, B., Shi, X., Wang, B., et al. (2013). The Critical Soil P Levels for Crop Yield, Soil Fertility and Environmental Safety in Different Soil Types. Plant Soil 372 (1–2), 27–37. doi:10.1007/s11104-013-1696-y
Chen, D., Hu, M., Guo, Y., Wang, J., Huang, H., and Dahlgren, R. A. (2017). Long-term (1980-2010) Changes in Cropland Phosphorus Budgets, Use Efficiency and Legacy Pools across Townships in the Yongan Watershed, Eastern China. Agric. Ecosyst. Environ. 236, 166–176. doi:10.1016/j.agee.2016.12.003
Chen, K., Liu, Y., Huang, D., Ke, H., Chen, H., Zhang, S., et al. (2018). Anthropogenic Activities and Coastal Environmental Quality: a Regional Quantitative Analysis in Southeast China with Management Implications. Environ. Sci. Pollut. Res. 25, 3093–3107. doi:10.1007/s11356-017-9147-6
Chen, M., and Graedel, T. E. (2016). A Half-century of Global Phosphorus Flows, Stocks, Production, Consumption, Recycling, and Environmental Impacts. Glob. Environ. Change 36, 139–152. doi:10.1016/j.gloenvcha.2015.12.005
Chen, X., Xu, X., Lu, Z., Zhang, W., Yang, J., Hou, Y., et al. (2020). Carbon Footprint of a Typical Pomelo Production Region in China Based on Farm Survey Data. J. Clean. Prod. 277, 124041. doi:10.1016/j.jclepro.2020.124041
Chen, X., Yan, X., Wang, M., Cai, Y., Weng, X., Su, D., et al. (2022). Long-term Excessive Phosphorus Fertilization Alters Soil Phosphorus Fractions in the Acidic Soil of Pomelo Orchards. Soil Tillage Res. 215, 105214. doi:10.1016/j.still.2021.105214
Cordell, D., Drangert, J.-O., and White, S. (2009). The story of Phosphorus: Global Food Security and Food for Thought. Glob. Environ. Change 19, 292–305. doi:10.1016/j.gloenvcha.2008.10.009
Damian, J. M., Firmano, R. F., Cherubin, M. R., Pavinato, P. S., de Marchi Soares, T., Cerri, C. E. P., et al. (2020). Changes in Soil Phosphorus Pool Induced by Pastureland Intensification and Diversification in Brazil. Sci. Total Environ. 703, 135463. doi:10.1016/j.scitotenv.2019.135463
Dent, D., Jacquier, D., Isbell, R., and Brown, K. (2005). Australian Soils and Landscapes-An Illustrated Compendium. Geoderma 125, 369–370. doi:10.1016/j.geoderma.2004.08.004
Feng, G., Gai, J., Feng, X., Li, H., Zhang, L., Yi, K., et al. (2019). Strategies for Improving Fertilizer Phosphorus Use Efficiency in Chinese Cropping Systems. Front. Agr. Sci. Eng. 6 (4), 341–347. doi:10.15302/j-fase-2019280
García-Oliva, F., Merino, A., Fonturbel, M. T., Omil, B., Fernández, C., and Vega, J. A. (2018). Severe Wildfire Hinders Renewal of Soil P Pools by thermal Mineralization of Organic P in forest Soil: Analysis by Sequential Extraction and 31P NMR Spectroscopy. Geoderma 309, 32–40. doi:10.1016/j.geoderma.2017.09.002
González Jiménez, J. L., Healy, M. G., and Daly, K. (2019). Effects of Fertiliser on Phosphorus Pools in Soils with Contrasting Organic Matter Content: A Fractionation and Path Analysis Study. Geoderma. 338, 128–135. doi:10.1016/j.geoderma.2018.11.049
Huang, X., Muneer, M. A., Li, J., Hou, W., Ma, C., Jiao, J., et al. (2021). Integrated Nutrient Management Significantly Improves Pomelo (Citrus Grandis) Root Growth and Nutrients Uptake under Acidic Soil of Southern China. Agronomy 11, 1231. doi:10.3390/agronomy11061231
Jordan-Meille, L., Rubaek, G. H., Ehlert, P. A. I., Genot, V., Hofman, G., Goulding, K., et al. (2012). An Overview of Fertilizer-P Recommendations in Europe: Soil Testing, Calibration and Fertilizer Recommendations. Soil Use Manage 28, 419–435. doi:10.1111/j.1475-2743.2012.00453.x
Khan, A., Lu, G., Ayaz, M., Zhang, H., Wang, R., Lv, F., et al. (2018). Phosphorus Efficiency, Soil Phosphorus Dynamics and Critical Phosphorus Level under Long-Term Fertilization for Single and Double Cropping Systems. Agric. Ecosyst. Environ. 256, 1–11. doi:10.1016/j.agee.2018.01.006
Khan, A., Lu, G., Zhang, H., Wang, R., Lv, F., Xu, J., et al. (2019). Land Use Changes Impact Distribution of Phosphorus in Deep Soil Profile. J. Soil Sci. Plant Nutr. 19, 565–573. doi:10.1007/s42729-019-00055-6
Korai, P. K., Xia, X., Liu, X., Bian, R., Omondi, M. O., Nahayo, A., et al. (2018). Extractable Pool of Biochar Controls on Crop Productivity rather Than Greenhouse Gas Emission from a rice Paddy under rice-wheat Rotation. Sci. Rep. 8, 802. doi:10.1038/s41598-018-19331-z
Li, G., Zhou, C., Yang, B., He, Z., Xu, P., Yang, S., et al. (2015a). The Accumulation and Distribution Characteristics of mineral Nutrients in “Shatangju” Mandarin. Chin. J. Trop. Crop 36 (12), 2166–2170. [in Chinese, with English summary].
Li, H., Huang, G., Meng, Q., Ma, L., Yuan, L., Wang, F., et al. (2011). Integrated Soil and Plant Phosphorus Management for Crop and Environment in China. A Review. Plant Soil 349 (1), 157–167. doi:10.1007/s11104-011-0909-5
Li, Y., Han, M. Q., Lin, F., Ten, Y., Lin, J., Zhu, D. H., et al. (2015b). Soil Chemical Properties, ‘Guanximiyou’ Pummelo Leaf mineral Nutrient Status and Fruit Quality in the Southern Region of Fujian Province, China. J. Soil Sci. Plant Nutr. 15 (3), 615–628. doi:10.4067/S0718-9516201500500002
Li, Y. J., Yang, M., Zhang, Z. Z., Li, W. L., Guo, C. Y., Chen, X. P., et al. (2019). An Ecological Research on Potential for Zero-Growth of Chemical Fertilizer Use in Citrus Production in China. Ekoloji 28, 1049–1059.
Liu, X. M., Liu, X. D., Liu, W. D., Tang, Q. L., Hu, C. X., and Li, J. X. (2021). Nutritional Status of Different Citrus Trees and the Recommended Dosages of N, P and K for Citrus Production in China. J. Plant Nutr. Fert 27 (4), 565–574. [in Chinese, with English summary].
Lu, S., Yan, Z., Chen, Q., and Zhang, F. (2012). Evaluation of Conventional Nitrogen and Phosphorus Fertilization and Potential Environmental Risk in Intensive Orchards of North China. J. Plant Nutr. 35, 1509–1525. doi:10.1080/01904167.2012.689911
Macdonald, G. K., Bennett, E. M., Potter, P. A., and Ramankutty, N. (2011). Agronomic Phosphorus Imbalances across the World's Croplands. Proc. Natl. Acad. Sci. 108, 3086–3091. doi:10.1073/pnas.1010808108
Maranguit, D., Guillaume, T., and Kuzyakov, Y. (2017). Land-use Change Affects Phosphorus Fractions in Highly Weathered Tropical Soils. Catena 149, 385–393. doi:10.1016/j.catena.2016.10.010
Murphy, J., and Riley, J. P. (1962). A Modified Single Solution Method for the Determination of Phosphate in Natural Waters. Analytica Chim. Acta 27, 31–36. doi:10.1016/S0003-2670(00)88444-5
National Bureau of Statistics (NBS) (2021). 2020. China Statistical Yearbook. Beijing: China Statistics Press. in Chinese.
Nur Aainaa, H., Haruna Ahmed, O., and Ab Majid, N. M. (2018). Effects of Clinoptilolite Zeolite on Phosphorus Dynamics and Yield of Zea Mays L. Cultivated on an Acid Soil. PLoS ONE 13, e0204401. doi:10.1371/journal.pone.0204401
Obreza, T., and Morgan, K. (2008). Nutrition of Florida Citrus Trees 2nd Edition. Fla. Coop. Ext. SL–253.
Pizzeghello, D., Berti, A., Nardi, S., and Morari, F. (2011). Phosphorus Forms and P-Sorption Properties in Three Alkaline Soils after Long-Term mineral and Manure Applications in north-eastern Italy. Agric. Ecosyst. Environ. 141, 58–66. doi:10.1016/j.agee.2011.02.011
Reijnders, L. (2014). Phosphorus Resources, Their Depletion and Conservation, a Review. Resour. Conservation Recycling 93, 32–49. doi:10.1016/j.resconrec.2014.09.006
Roberts, T. L., and Johnston, A. E. (2015). Phosphorus Use Efficiency and Management in Agriculture. Resour. Conservation Recycling 105, 275–281. doi:10.1016/j.resconrec.2015.09.013
Sattari, S. Z., Bouwman, A. F., Giller, K. E., and van Ittersum, M. K. (2012). Residual Soil Phosphorus as the Missing Piece in the Global Phosphorus Crisis Puzzle. Proc. Natl. Acad. Sci. 109, 6348–6353. doi:10.1073/pnas.1113675109
Sattari, S. Z., van Ittersum, M. K., Ittersum, K. E., Zhang, F., Bouwman, A. F., and Bouwman, A. (2014). Key Role of China and its Agriculture in Global Sustainable Phosphorus Management. Environ. Res. Lett. 9, 054003. doi:10.1088/1748-9326/9/5/054003
Sharma, R., Bell, R. W., and Wong, M. T. F. (2017). Dissolved Reactive Phosphorus Played a Limited Role in Phosphorus Transport via Runoff, Throughflow and Leaching on Contrasting Cropping Soils from Southwest Australia. Sci. Total Environ. 577, 33–44. doi:10.1016/j.scitotenv.2016.09.182
Smith, D. (2014). Soil Survey Staff: Keys to Soil Taxonomy. Washington, DC, USA: Natural Resources Conservation Service.
Smith, S. E., Jakobsen, I., Grønlund, M., and Smith, F. A. (2011). Roles of Arbuscular Mycorrhizas in Plant Phosphorus Nutrition: Interactions between Pathways of Phosphorus Uptake in Arbuscular Mycorrhizal Roots Have Important Implications for Understanding and Manipulating Plant Phosphorus Acquisition. Plant Physiol. 156, 1050–1057. doi:10.1104/pp.111.174581
Stackpoole, S. M., Stets, E. G., and Sprague, L. A. (2019). Variable Impacts of Contemporary versus Legacy Agricultural Phosphorus on US River Water Quality. Proc. Natl. Acad. Sci. U.S.A 116, 20562–20567. doi:10.1073/pnas.1903226116
Turner, B. L., and Blackwell, M. S. A. (2013). Isolating the Influence of pH on the Amounts and Forms of Soil Organic Phosphorus. Eur. J. Soil Sci. 64, 249–259. doi:10.1111/ejss.12026
Van Vuuren, D. P., Bouwman, A. F., and Beusen, A. H. W. (2010). Phosphorus Demand for the 1970-2100 Period: A Scenario Analysis of Resource Depletion. Glob. Environ. Change 20, 428–439. doi:10.1016/j.gloenvcha.2010.04.004
Wang, Y., Tang, J., Zhang, H., Schroder, J. L., and He, Y. (2014). Phosphorus Availability and Sorption as Affected by Long‐Term Fertilization. Agron.j. 106, 1583–1592. doi:10.2134/agronj14.0059
Wei, H., He, C., Zhang, S., Xiong, H., Ni, H., and Li, Q. (2020). Effects of Four Storage Conditions on the Sugar Content, Acidity, and Flavor of "Guanxi" Honey Pomelo. J. Food Process. Preserv 45, e15088. doi:10.1111/jfpp.15088
Withers, P. J. A., Rodrigues, M., Soltangheisi, A., de Carvalho, T. S., Guilherme, L. R. G., Benites, V. d. M., et al. (2018). Transitions to Sustainable Management of Phosphorus in Brazilian Agriculture. Sci. Rep. 8, 2537. doi:10.1038/s41598-018-20887-z
Wolf, J., Wit, C. T., Janssen, B. H., and Lathwell, D. J. (1987). Modeling Long‐Term Crop Response to Fertilizer Phosphorus. I. The Model 1. Agron.j. 79, 445–451. doi:10.2134/agronj1987.00021962007900030009x10.2134/agronj1987.00021962007900030008x
Xu, H., Qu, Q., Li, P., Guo, Z., Wulan, E., and Xue, S. (2019). Stocks and Stoichiometry of Soil Organic Carbon, Total Nitrogen, and Total Phosphorus after Vegetation Restoration in the Loess Hilly Region, China. Forests. 10, 27. doi:10.3390/f10010027
Xu, X. Z. (2019). Comprehensive Evaluation of Carbon Emission and Optimum Fertilization in Guanxi Pomelo Production. Fuzhou, P. R. China: Master thesis. Fujian Agriculture and Forestry University.
Yan, P., Shen, C., Fan, L., Li, X., Zhang, L., Zhang, L., et al. (2018). Tea Planting Affects Soil Acidification and Nitrogen and Phosphorus Distribution in Soil. Agric. Ecosyst. Environ. 254, 20–25. doi:10.1016/j.agee.2017.11.015
Yan, X., Yang, W., Chen, X., Wang, M., Wang, W., Ye, D., et al. (2020). Soil Phosphorus Pools, Bioavailability and Environmental Risk in Response to the Phosphorus Supply in the Red Soil of Southern China. Ijerph 17, 7384. doi:10.3390/ijerph17207384
Yu, L., Zanchi, G., Akselsson, C., Wallander, H., and Belyazid, S. (2018). Modeling the forest Phosphorus Nutrition in a Southwestern Swedish forest Site. Ecol. Model. 369, 88–100. doi:10.1016/j.ecolmodel.2017.12.018
Yu, W., Li, G., Hartmann, T. E., Xu, M., Yang, X., Li, H., et al. (2021). Development of a Novel Model of Soil Legacy P Assessment for Calcareous and Acidic Soils. Front. Environ. Sci. 8, 621833. doi:10.3389/fenvs.2020.621833
Zhang, F., Cui, Z., Fan, M., Zhang, W., Chen, X., and Jiang, R. (2011). Integrated Soil-Crop System Management: Reducing Environmental Risk while Increasing Crop Productivity and Improving Nutrient Use Efficiency in China. J. Environ. Qual. 40 (4), 1051–1057. doi:10.2134/jeq2010.0292
Zhang, F., Wang, J., Zhang, W., Cui, Z., Ma, W., Chen, X., et al. (2008). Nutrient Use Efficiencies of Major Cereal Crops in China and Measures for Improvement. Acta Pedologica Sinica 2008 (05), 915–924. In Chinese, with English summary. doi:10.3321/j.issn:0564-3929.2008.05.018
Keywords: pomelo orchard, P budget, temporal and spatial variation, soil P management, DPPS
Citation: Yan X, Li G, Zhang W, Muneer MA, Yu W, Ma C and Wu L (2022) Spatio-Temporal Variation of Soil Phosphorus and Its Implications for Future Pomelo Orcharding System Management: A Model Prediction From Southeast China From 1985–2100. Front. Environ. Sci. 10:858816. doi: 10.3389/fenvs.2022.858816
Received: 20 January 2022; Accepted: 14 February 2022;
Published: 04 March 2022.
Edited by:
Gu Feng, China Agricultural University, ChinaReviewed by:
Xueyun Yang, Northwest A&F University, ChinaCopyright © 2022 Yan, Li, Zhang, Muneer, Yu, Ma and Wu. This is an open-access article distributed under the terms of the Creative Commons Attribution License (CC BY). The use, distribution or reproduction in other forums is permitted, provided the original author(s) and the copyright owner(s) are credited and that the original publication in this journal is cited, in accordance with accepted academic practice. No use, distribution or reproduction is permitted which does not comply with these terms.
*Correspondence: Liangquan Wu, bGlhbmdxdWFuMDFAMTYzLmNvbQ==
†These authors have contributed equally to this work and share first authorship
Disclaimer: All claims expressed in this article are solely those of the authors and do not necessarily represent those of their affiliated organizations, or those of the publisher, the editors and the reviewers. Any product that may be evaluated in this article or claim that may be made by its manufacturer is not guaranteed or endorsed by the publisher.
Research integrity at Frontiers
Learn more about the work of our research integrity team to safeguard the quality of each article we publish.