 Zongfeng Chen
 Yurui Li
 Zhengjia Liu1
- 1Institute of Geographic Sciences and Natural Resources Research, Chinese Academy of Sciences (CAS), Beijing, China
- 2Faculty of Geographical Science, Beijing Normal University, Beijing, China
While the eco-environmental effects of rural settlement expansion are of great significance to rural sustainable land use, the relationship between rural settlement expansion and eco-environment under different expansion patterns is still unclear. To fill this gap, the current study used Baota district of the loess hilly and gully region as a case study area. We first investigated the spatiotemporal expansion patterns of rural settlements from 1990 to 2015 and then estimated their impacts on ecosystem services by implementing the Integrated Valuation of Ecosystem Services and Tradeoffs (InVEST) model and the global agro-ecological zones (GAEZ) model. Results showed the following: 1) edge expansion was the primary pattern of rural settlement expansion in Baota district from 1990 to 2015, and the area of edge expansion was 757.40 h m2, accounting for 71.76% of the total expansion area of rural settlements. 2) Rural settlement expansion caused 1744.60 t loss of crop yield, 40,155.78 Mg C loss of carbon storage, and a significant decline in habitat quality of water areas during 1990–2015. 3) According to the unit expansion area, the edge expansion and leapfrog expansion patterns contributed more to ecosystem services loss than the infilling expansion pattern. 4) There were gradient differences in the impacts of three expansion patterns on ecosystem services, and the impacts were gradually weakened by the increased distance. Accordingly, we concluded that the expansion of rural settlements reduced surrounding ecosystem services, especially food production service, and that the edge expansion and leapfrog expansion patterns had higher levels of stress on ecosystem services.
1 Introduction
Rural settlement changes reflect development in society and economics and affect ecosystem services (ESs) in the rural regional system (Gude et al., 2006; Röder et al., 2015). Rural settlements in many countries have grown evidently due to influences such as rapid population growth and accelerated urbanization, which is especially the case in developing countries (Tassinari et al., 2010; Song and Liu, 2014). Unsystematic growth will encroach on a large amount of ecological space, which indeed will bring a series of ecological security problems like local temperature rise (Yang et al., 2021; Zhao et al., 2021; Ren et al., 2022), flooding (Tiepolo and Galligari, 2021), water pollution (Kröger et al., 2012; Wu et al., 2012), air pollution (Braniš and Domasová, 2003; Zhou et al., 2020), and food yield reduction (Ju et al., 2018; Zou et al., 2021). Therefore, regulating rural development and minimizing negative effects of rural settlement expansion on eco-environment are of great significance in achieving sustainable rural development.
To achieve this, many studies have been conducted to reveal rural settlement expansion. Through this, policymakers and rural planners can generate evidence-based suggestions for sustainable land use planning and harmonious development. For instance, Song et al. (2014) analyzed the impacts of socioeconomic factors (i.e., rural register population, rural housing investment, and per-capita rural housing area) on rural settlement expansion patterns in China. Similarly, Chen and Ye (2014) found that decisions made by individuals and village collective organizations play an important role in rural settlement expansion. Moreover, Li et al. (2017) analyzed the effects of rural settlement evolution on ecosystem service values in the western part of the Songliao Plain, China. In comparison, from the perspective of maintaining regional ecological security, Yin et al. (2020) put forward different optimization directions and management strategies of rural settlements for different areas of the Da’an city, China.
More recently, the concept of expansion patterns, describing or analyzing landscape pattern changes, has been introduced into rural settlement expansion studies (Bhatta, 2010; Xu et al., 2016; Chen et al., 2021a). This concept offers a scientific basis for rural sustainable land use planning from the perspective of the landscape pattern. For instance, Tian et al. (2014) defined rural settlement dynamics into three patterns of edge expansion, dispersion, and urban encroachment in the Beijing metropolitan region, China. Their results also found that the expansion of rural settlements was mainly developed around the metropolitan region, and it gradually extended into the periphery of the metropolitan region. Moreover, Chen et al. (2021b) analyzed the variation in the expansion scale, speed, and pattern diversity of rural settlements by increased distance to urban built-up areas. Tan and Li (2013) examined the impacts of socioeconomic factors (i.e., decrease in household size, increase in numbers of migrants, and improvements in living conditions) on rural settlement expansion patterns in Beijing, China.
It is, therefore, concluded that rural settlement expansion is affected by various factors such as physical geography, socio-economy, and policy, which also determine the diversity of its expansion patterns (Yang et al., 2015). Meanwhile, the impacts of diverse expansion patterns on eco-environment were different due to morphological characteristics and scale of expansion types (Xian et al., 2019). Accordingly, analyses of the effects on eco-environmental are required for specific cases and different expansion patterns in order to obtain the most accurate results for rural settlement planning. To the best of the authors’ knowledge, this is one of the first studies examining the impacts of rural settlement expansion on ecosystem services from the perspective of different expansion patterns in the loess hilly and gully region. The study aims to understand such impacts through the case study of Baota, a typical county in the loess hilly and gully region, China. This study uses the landscape expansion index (LEI) to identify rural settlement expansion patterns and uses the ecological loss contribution rate to assess the impacts of different expansion patterns on eco-environment. This study sheds the light for rural development planning in ecologically fragile areas and further provides a reference for rural settlement expansion.
2 Materials and Methods
2.1 Study Area
In this study, Baota district, a district in Yan’an in the Shannxi province of China, was selected as the case study area. It is recognized as a typical ecological fragile area with serious soil erosion (Yuan et al., 2019). The Baota district is situated in the south part of the loess hilly and gully region (36°10′N–37°02′ N, 109°14′E–110°50′E), with a total territorial area of approximately 3,539 km2 (Figure 1). In terms of topography, 50.8% of the area is hillside land and the gully density ranges from 3.04 to 5.01 km/km2. The soil erosion area of Baota district is 3,154 km2 (89.12% of the total territorial area) with an average annual sediment loss of 22 million tons (Wang, 2009). Moreover, the average annual precipitation is about 550 mm, mostly from July to September. The annual average evaporation is 1,579.7 mm, which is about three times of precipitation.
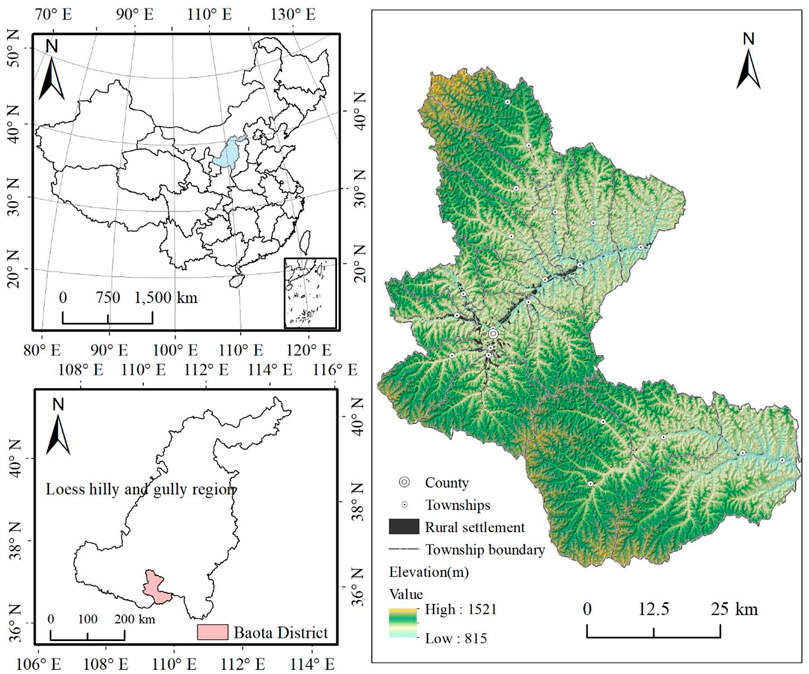
FIGURE 1. Location of Baota district.
The rapid economic and social development in Baota district has put tremendous pressure on the local eco-environment. By the end of 2018, Baota district governed 611 administrative villages, with a total population of 472,000, and achieved gross domestic product (GDP) of 32.89 billion CNY (Chinese Yuan). Along with the rapid urbanization, the rural residential area of Baota district expanded rapidly, which occupied massive ecological land. For example, from 1990 to 2015, the rural settlement area of Baota district expanded to 1,052 hm2, 75.52% of which were transformed from agricultural lands, 6.32% transformed from woodlands, and 15.32% from grasslands (Chen et al., 2021b). Therefore, taking Baota district as a case in response to eco-environment to the expansion of rural settlements is highly representative of the ecological fragile areas.
2.2 Data Source
The rural settlements in this study are defined as rural land for residential purposes and commercial purposes. The resources of the land-use data (1990, 1995, 2000, 2005, 2010, and 2015; multispectral, 30-m spatial resolution) used in this study came from the Resources and Environmental Science Data Center (http://www.resdc.cn). The first-level land use types are divided into agricultural land, woodland, grassland, water area, construction land, and unused land, and the subclasses land use types are divided into 17 types. For the classification of land use/cover change, its overall accuracy is more than 90%, which is the most exact land area utilized; the data monitoring is performed by remote sensing in China (Liu et al., 2014).
2.3 Methods
2.3.1 Landscape Expansion Index
The landscape expansion index was a vital indicator to define the construction land expansion pattern. In this study, the expansion pattern of rural settlements was determined by LEI (Liu et al., 2010). The calculation of LEI for the novel patch of rural settlement was conducted using Eq. 1, as follows:
where A1 represents the intersecting area of the old patch of rural settlements and the buffer zone, while A2 represents the cross-sectional area between the former zone of non-rural settlements and the buffer zone. The buffers are defined as the zones with specified distances around a newly grown settlement patch. The buffer radius in this formula was set to 30 m and equal to the resolution of land use raster data to ensure the reasonableness of the intersection area. In accordance with LEI, rural settlements could be divided into three expansion patterns: infilling expansion, leapfrog expansion, and edge expansion. The edge expansion pattern is defined as the novel patch of rural settlements growing from the edge, and its LEI range is between 0 and 50. The leapfrog expansion pattern is defined as the novel patch of rural settlements isolated from the old patches with the LEI equal to 0. The infilling expansion pattern refers to as a new rural settlement filling the gaps among old rural settlements with the LEI between 50 and 100.
2.3.2 Ecosystem Services Evaluation
In this study, we followed the United Nations Millennium Ecosystem Assessment (MA), which divides ecosystem services into provisioning services (i.e., production of food and water), regulating services (i.e., regulation of climate and water), supporting services (i.e., provisioning of habitat), and cultural services (i.e., spiritual, recreational, and cultural benefits) (Millennium Ecosystem Assessment, 2005). The cultural service is not discussed in this study because we are interested primarily in the eco-environment impacts of rural settlement expansion. Thus, we selected representative indicators of provisioning (food production), regulating (carbon storage), and supporting (habitat quality) services to quantify the impacts of rural settlement expansion on ecosystem services (Hou et al., 2017; Wu et al., 2018; Lyu et al., 2021).
2.3.2.1 Food Production
Food production, a critical provisioning service that ecosystems provide for human survival, is primarily assessed using census and remote sensing data (Tao et al., 2012; Tian and Qiao, 2014). However, it is difficult to assess the spatial variability of food productivity under complex environments using this regular approach. The GAEZ model comprehensively considers multiple factors (i.e., light, temperature, moisture, agro-climatic conditions, soil, and terrain) and provides a solution for evaluating food productivity under complex environmental conditions (Li et al., 2019). Considering the complex terrain in the loess hilly and gully region, the GAEZ model was used in our study to calculate the yield potential of crops under the average climate conditions from 1990 to 2015. The GAEZ model calculated the crop potential yield utilizing a step-by-step limiting approach, containing the climate potential yield (i.e., limiting water, temperature, and light), land potential yield (i.e., limiting temperature, light, soil, and water), and crop potential yield (i.e., limiting management approaches and level of agricultural input) (Figure 2) (Jiang et al., 2020). Because of the accumulated temperature in Baota district above 10°C was 3,245°C, it meets the needs of the one-crop farming system (Liu et al., 2021). Therefore, the crop potential yield was determined using the one-crop farming system.
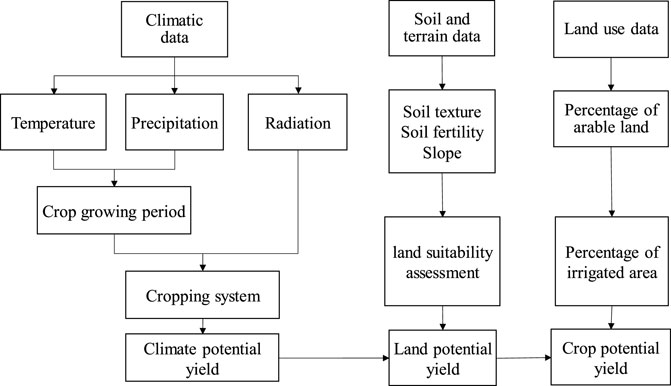
FIGURE 2. Schematic diagram of overall structure and data integration of GAEZ.
The model of GAEZ contained the rain-fed and irrigated scenarios. Under the irrigated and rain-fed conditions, for each grid cell, the potential yields of crop are revealed as follows:
where Yirrigated represents the potential yield of crop under the irrigated conditions in each grid cell (kg/hm2), Yrain represents the potential yield of crop under the rain-fed conditions in each grid cell (kg/hm2), and Yt represents the potential yield of crop in each grid cell (kg/hm2), while i represents the ratio between total cultivated area and the irrigation-cultivated area. The results showed that the yield values followed a normal distribution, so the zonation outputs were divided in five categories using the natural breakpoint method: low yield (0< Y ≤ 1,000), medium–low yield (1,000< Y ≤ 1,500), medium yield (1,500< Y ≤ 2000), medium–high yield (2000< Y ≤ 3,000), and high yield (Y > 3,000).
2.3.2.2 Habitat Quality
Habitat quality is an ecosystem’s ability of providing suitable living conditions for individual and population persistence (Sharp et al., 2015). In the model of InVEST, the habitat quality module utilizes threat factors and land use data as the major data sources, which offers an intuitive and fast approach to assess the habitat quality (Bai et al., 2019). The habitat quality index changes continuously from 0 to 1, and the closer the value is to 1, the more conducive it is for the maintenance of biodiversity (Sun et al., 2019; Li et al., 2021). The calculation of habitat quality was conducted using Eq. 3, as follows:
where
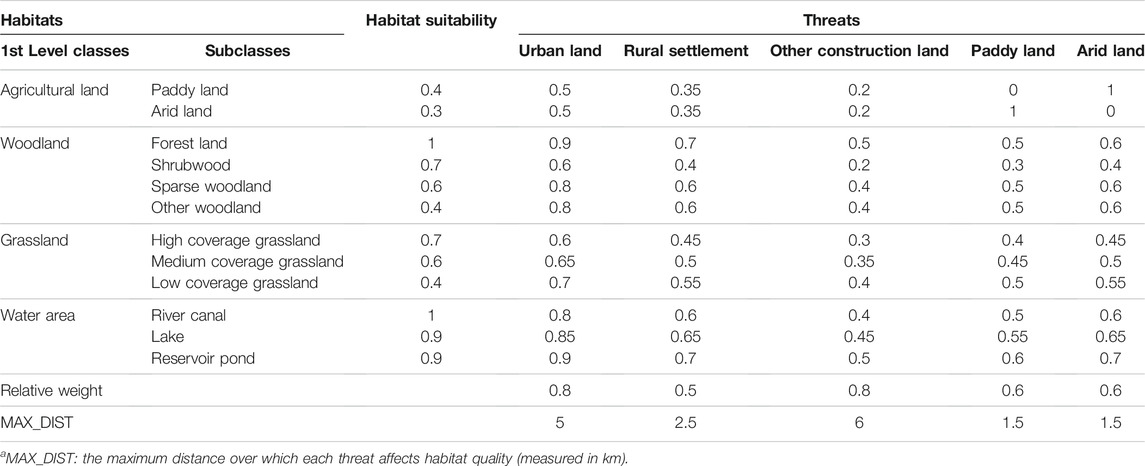
TABLE 1. Habitat suitability and sensitivity of habitats to threats.
2.3.2.3 Carbon Storage
The InVEST carbon storage module estimated the total carbon sequestration by using the land use-and-cover data and the amount of carbon stored in carbon pools (He et al., 2016). The formula for carbon stocks in the InVEST model is as follows:
where CSxj is the carbon stocks value at the xth pixel of land type j, Mg C; Axj represents the xth pixel area for the j type land, hm2; ACj represents the aboveground density of carbon for the j type land, Mg C/hm2; BCj represents the underground density of carbon for the j type land, Mg C/hm2; SCj represents the density of soil organic carbon for the j type land, Mg C/hm2; and DCj represents the density of dead organic carbon for the j type land, Mg C/hm2.
The carbon density parameter determines the accuracy of the simulation. Therefore, it is necessary to reasonably define the carbon density. Carbon density is affected by various factors (i.e., climate, vegetation, parent material, and topography), and the carbon density parameters in different regions are quite different. In this study, we adopted the average value of the carbon density of each land use type based on the published literature in recent years, whose study areas were located in the loess hilly and gully region, and built a carbon density database of different land use types. (Table 2).

TABLE 2. Carbon density for each land use type (unit: Mg C/hm2).
2.3.2.4 Ecological Loss Contribution Rate
The contribution rate of rural settlement expansion to ecosystem services loss refers to the loss of ecosystem services resulting from the expansion of rural settlements. This index can quantify the effect of rural settlement expansion on regional ecosystem services and help to study the major factors leading to the loss of ecosystem services. The formula is as follows:
where Rij is the loss contribution rate of the i-type ecosystem service caused by the rural settlement expansion pattern j; ESij is the loss value of the i-type ecosystem service caused by the rural settlement expansion pattern j; and ESi is the loss value of the i-type ecosystem service caused by the rural settlement expansion. In addition, in accordance with He et al. (2016) and Goldstein et al. (2012), for residential land, we presumed that the ecosystem services of rural settlements can be ignored owing to its relatively small value of ecosystem services, which was hard to quantify for the residential land with high heterogeneousness.
3 Results
3.1 Spatiotemporal Expansion Patterns of Rural Settlement
Edge expansion was the major rural settlement expansion pattern in Baota district from 1990 to 2015. The area with edge expansion was 757.4 h m2, accounting for 71.76% of the total expansion area in the course of study. During the same time period, the areas with infilling and leapfrog patterns were 86.1 h m2 and 211.9 h m2, respectively, accounting for 8.16 and 20.08% of the total expanded area, respectively.
The rural settlement expansion patterns in central suburb areas (20 km within the county center) were diversified while those in far-flung suburb areas (20 km outside the county center) were simplistic (Figure 3F). Specifically, between 1990 and 1995, edge expansion was the main expansion pattern of rural settlement expansion and concentrated in central suburb areas (Figure 3A). From 1995 to 2005, with the “Grain for Green” Project implemented, rural settlements in Baota district gradually concentrated from hillsides to valleys. Thus, the edge expansion pattern dominated in far-flung suburb areas. Meanwhile, with the development of township enterprises, the leapfrog expansion pattern emerged in central suburb areas (Figures 3B,C). Although the expansion of rural settlements in Baota district was gradually active before 2005, it was difficult to form a filling expansion model due to the small scale of expansion. In the period between 2005 and 2010, the infilling expansion pattern emerged but in central suburb areas, and the area of leapfrog expansion pattern increased. The edge expansion pattern was still the primary mode in far-flung suburb areas (Figure 3D). In the period of 2010–2015, as a result, the area of leapfrog and infilling expansion patterns increased to 151.3 h m2 and 55.3 h m2 in central suburb areas (Figure 3E).
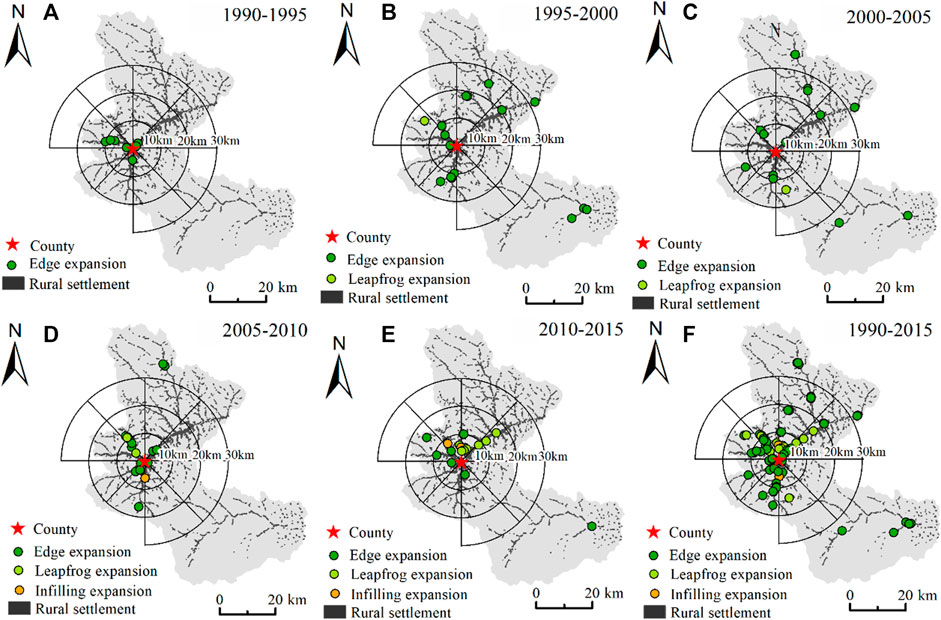
FIGURE 3. Spatiotemporal expansion patterns of rural settlements in Baota district during different periods (A) 1990–1995, (B) 1995–2000, (C) 2000–2005, (D) 2005–2010, (E) 2010–2015 and (F) 1990-2015.
3.2 Ecosystem Services Change
3.2.1 Change of Food Production
The estimated total crop yield of Baota district in 1990 and 2015 were 254,913 t and 172,931 t, respectively, which decreased by 81,982 t based on the GAEZ model (Figures 4A,B). The change area of low yield, medium–low yield, medium yield, medium–high yield, and high yield areas were −44.6 km2, 91.2 km2, −88.5 km2, −241.2 km2, and −60.2 km2, respectively (Figure 4C). Obviously, the medium–high yield area had largest loss, and the area ratio dropped by 12.5%. From the spatial distribution perspective, the crop yield was high in valleys and low in hillside. Specifically, the high yield and medium–high yield areas were concentrated in the valley fields with slopes below 15°. The low yield, medium–low yield, and medium yield areas were distributed in the hillside fields with slopes above 15°. Previous studies reported that newly added rural settlements were primarily concentrated in areas with slope below 15° in Baota district (Chen et al., 2021b), which resulted in a large loss of medium–high yield areas.
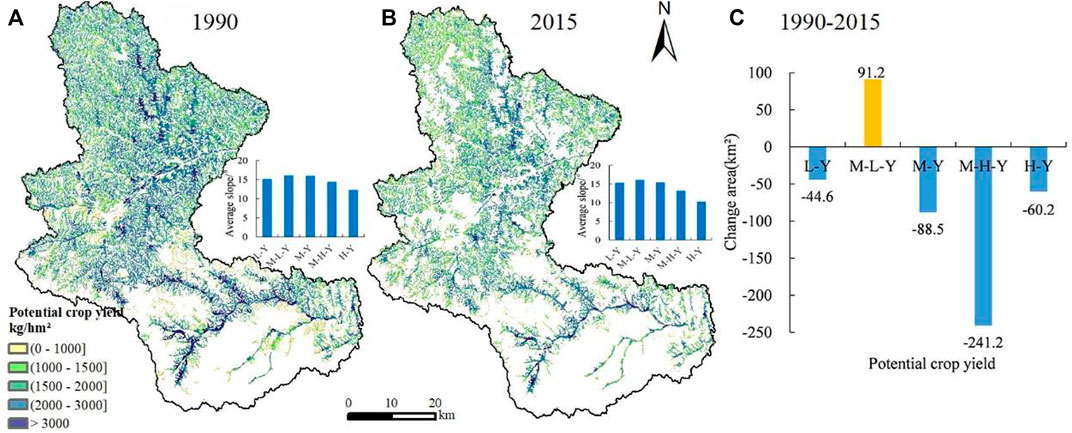
FIGURE 4. Distribution of crop yield in Baota district for the years (A) 1990 and (B) 2015; (C) the area changes of different crop yield levels in Baota district from 1990 to 2015. HY: high yield, M-HY: medium–high yield, MY: medium yield, M-LY: medium–low yield, LY: low yield.
3.2.2 Change of Habitat Quality
The habitat quality value of Baota district in 1990 and 2015 were 0.43 and 0.48 based on Eq. 3, which indicated that the overall quality of habitat has improved over the course of study. The proportion of the low-quality areas was maintained at approximately 6%. The proportion of areas with medium–low quality reduced in this period. Particularly, the proportion of the areas with medium–low quality reduced from 56.7 to 43.6%. On the contrary, from 1990 to 2015, the proportion of high quality, medium–high quality, and medium quality areas raised, with rates of 1.2, 7.1, and 5.4%, respectively. In general, the expanded areas of medium quality habitats and declined areas of medium–low quality habitats led to the regional habitat quality improvement over the past 25 years in Baota district (Figures 5A,B).
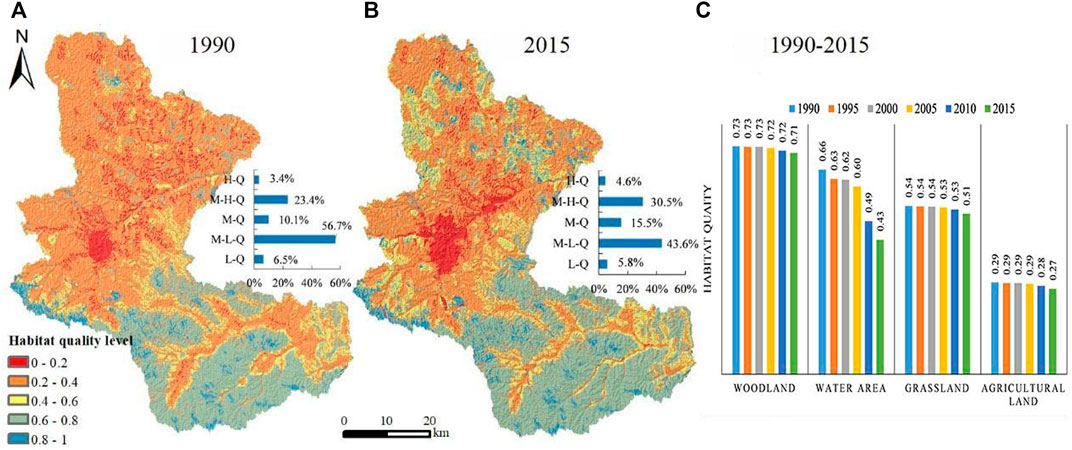
FIGURE 5. Distribution of habitat quality in Baota district for the years (A) 1990 and (B) 2015; (C) the habitat quality of different land use types in Baota district from 1990 to 2015. HQ: high quality, M-HQ: medium–high quality, MQ: medium quality, M-LQ: medium–low quality, LQ: low quality.
The habitat quality of diverse land use types presented a downward trend during the study period (Figure 5C). Specifically, the habitat quality of water areas in Baota decreased by 34.2% from 1990 to 2015, and the rate of annual average change was −1.66%. The average habitat quality of woodland, grassland, and agricultural land decreased by 2.9, 4.7, and 6.8%, respectively, from 1990 to 2015, and the rate of annual average change was −0.12, −0.19, and −0.28%, correspondingly.
The habitat quality of Baota district revealed the spatial distribution pattern of “low in the north and high in the south”, and the overall spatial manner had a remarkable regional difference during 1990–2015. The medium–high quality areas and high quality areas were mainly distributed in the southern part of Baota district, and the primary types of land use were grassland and forests. The medium–low quality areas decreased significantly in the northern part of Baota district. However, the changing features of medium–low quality and medium quality areas were opposite in the northern area of Baota district from 1990 to 2015. There was a noticeable increase in the medium quality areas, while the low quality areas showed a trend of gathering to urban built-up areas.
3.2.3 Change of Carbon Storage
The estimated total carbon storage value of Baota district in 1990 and 2015 were 2.59 × 10⁷ Mg C and 2.66 × 10⁷ Mg C, respectively, based on the results of the InVEST model. The carbon storage had a strong relation with the land-use type and topography in the area of research. As a result, the carbon storage in Baota district exhibited significant regional differences in the overall spatial pattern. For the carbon storage, the high-value parts were mostly in the southern areas of Baota district, and the land-use types were mainly grassland and woodland, while the area of low-carbon storage was mainly distributed in the northern areas of Baota district, and the land use types were primarily agricultural land, rural settlement, and urban built-up areas (Figures 6A,B).
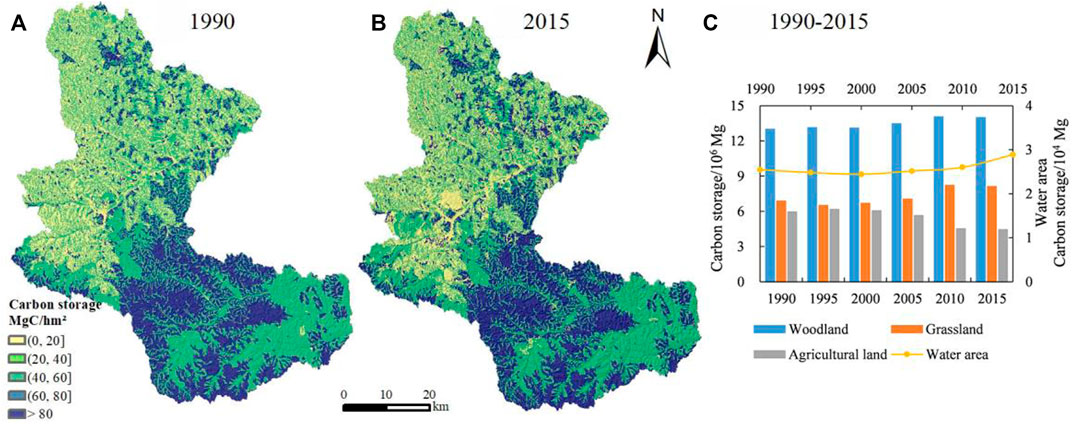
FIGURE 6. Distribution of carbon storage in Baota district for the years (A) 1990 and (B) 2015; (C) the carbon storage of different land use types in Baota district from 1990 to 2015.
From 1990 to 2015, the carbon storage for distinct land use types exhibited diverse changing characteristics (Figure 6C). The carbon storage of woodland, grassland, and agricultural land revealed a fluctuated pattern. Specifically, the woodland carbon storage increased by 9.9 × 10⁵ Mg C and showed an “increase → decrease → increase → decrease” route during the study period. The carbon storage of grassland increased by 1.24 × 10⁶ Mg C and revealed a route of “decrease → increase → decrease” in this period. The carbon storage of agricultural land decreased by 1.51 × 10⁶ Mg C and showed an “increase → decrease” route during the time period. The carbon storage of water area remained around 3 × 10⁴ Mg C.
3.3 Impacts of Rural Settlement Expansion on Ecosystem Services
Rural settlement expansion inevitably had a negative impact on local ecosystem services (Table 3). Specifically, the habitat quality of Baota district improved from 0.43 to 0.48, which related to more than 300 km2 agricultural land transformed into woodland and grassland. Yet, the quality of different habitats decreased during the time period, especially in the water area. This was mainly due to the fact that most of the recently developed settlements situated near the water area were highly sensitive to threat sources. In addition, the total carbon storage in Baota district increased during 1990–2015, but the loss of carbon storage resulting from the expansion of rural settlement was up to 40,155.78 Mg C. Furthermore, the total output of crop in Baota district decreased to 1744.60 t during the study period. The reduction in food production was shown to be related to various explanations, such as climate change, returning agricultural land to woodland, abandoning agricultural land, and rural settlement expansion (Brown, 2016; Liu et al., 2021). Our research found that the decrease of medium–high yield areas was the main reason that led to regional food production decline over the past 25 years in Baota district, and 461.52 h m2 of medium–high yield areas was transformed into rural settlements.
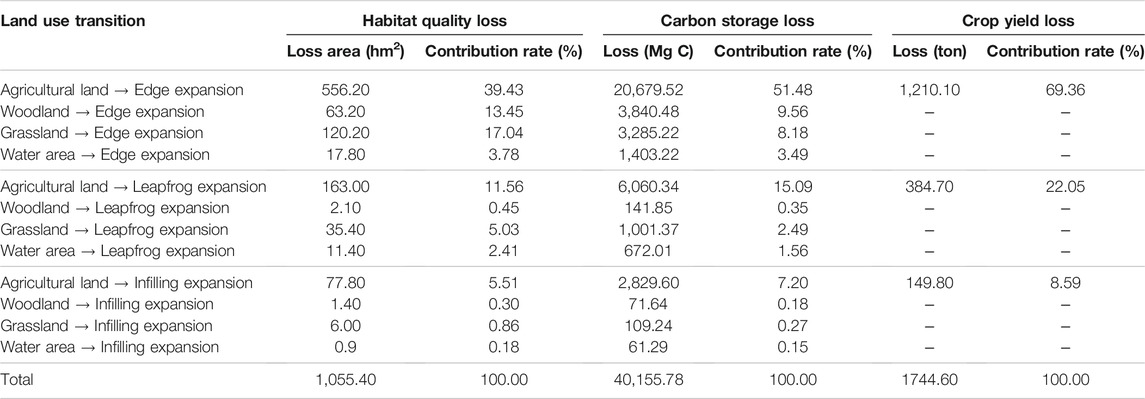
TABLE 3. Land use transition and ecosystem services loss contribution rate in Baota district.
The transition from agricultural land, grassland, and woodland to the edge expansion pattern of rural settlements explained 69.92% of the loss contribution rate, which deteriorated the quality of human settlements in Baota district. The transformation from agricultural land and woodland to edge expansion and from agricultural land to leapfrog expansion pattern was the major types of land transition that resulted in the reduction of carbon storage in Baota district, and their contribution rate reached 76.13%. Furthermore, the transition from agricultural land to edge expansion pattern was the primary type of land transition that led to the reduction of crop yield in Baota district with the contribution rate of 69.36%.
4 Discussion
4.1 Differentiated Impacts of Three Expansion Patterns on Ecosystem Services
Edge expansion and leapfrog expansion patterns increased the risk of ecosystem services loss. According to Table 3, leapfrog expansion and edge expansion in total contributed up to 93.15% of the habitat quality loss; these two expansion patterns together contributed to 92.20% of the loss of carbon storage, and their total contribution rate to the loss of crop yield was 91.41%. According to the unit area of the expansion of rural settlement, the ecological effects of the diverse rural settlement expansion patterns were different (Figure 7). More than 38.56 Mg C carbon stocks were lost for each additional hectare of the edge expansion pattern, more than 36.95 Mg C carbon stocks were lost for each additional hectare of the leapfrog pattern, and more than 36.41 Mg C carbon stocks were lost for each additional hectare of the infilling pattern. Meanwhile, the edge and leapfrog expansion patterns caused more habitat quality loss than the infilling pattern. Additionally, the leapfrog expansion pattern caused 2.36 t crop yield loss for each additional hectare, more than the edge pattern (2.18 t) and the infilling pattern (1.93 t). To summarize, the leapfrog and edge expansion patterns caused more habitat quality, carbon storage, and crop yield loss than the infilling expansion pattern. Our results, to some extent, supported previous findings that the edge and leapfrog expansion patterns were the primary mode causing dramatically declines in ecosystem services (Tian et al., 2014; Xu et al., 2016).
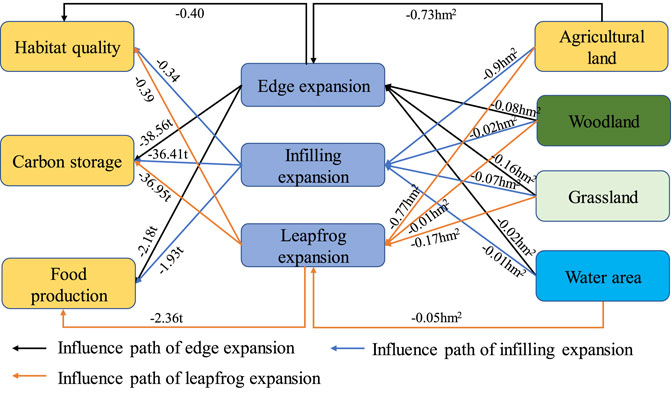
FIGURE 7. Ecological land and ecosystem services loss resulting from per hectare of rural settlement expansion patterns.
4.2 Gradient Changes in the Impacts of Three Expansion Patterns on Ecosystem Services
We took the county government location as the center and conducted a gradient analysis with equal intervals of 10 km. Results indicated that there were gradient differences in the impact of three expansion patterns on ecosystem services. The impacts of the edge and infilling expansion patterns on the four type habitats were mainly concentrated within 10 km, and the impacts were gradually weakened by increased distance (Figures 8A,C). The impacts of the leapfrog expansion pattern on the four type habitats were mainly concentrated in the range of 20 km, particularly the impact on agricultural land was mainly within 10–20 km (Figure 8B). This further confirmed the phenomenon of habitat quality degradation around urban built-up areas (Figure 8D). Furthermore, the impacts of three expansion patterns on crop yield and carbon storage were mainly concentrated within 10 km, and the impacts again were gradually weakened by increased distance. It is noted that in the 10–20 km range, the impacts of the leapfrog pattern on ecosystem services were higher than the edge and infilling expansion patterns (Figures 8E,F). This was similar to the circle-level expansion characteristics of cities (Yang et al., 2018). The “inner circle” was dominated by the edge and the infilling expansion modes, while the “outer circle” was dominated by the leapfrog expansion mode. With the continuous expansion of city, the built-up area of the “inner circle” was increasingly connected with the leapfrog patches of the “outer circle”, thus forming a new urban built-up area (Bhatta, 2010).
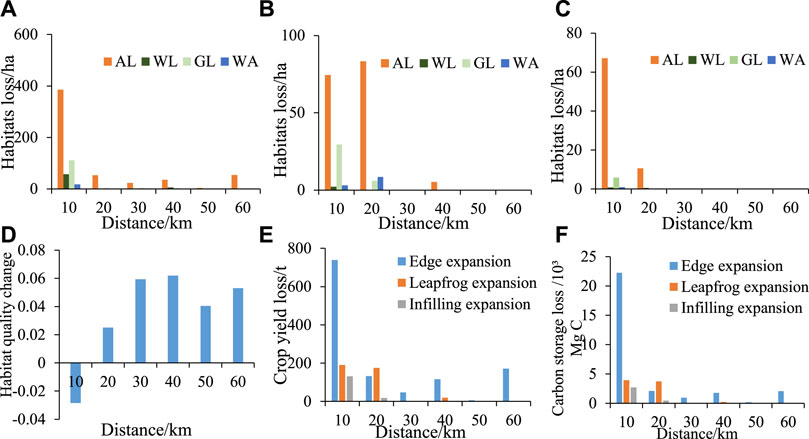
FIGURE 8. Gradient changes in the impacts of three expansion patterns on ecosystem services. (A) Edge expansion pattern on habitat quality; (B) leapfrog expansion pattern on habitat quality; (C) infilling expansion pattern on habitat quality; (D) habitat quality change; (E) three expansion patterns on crop yield; (F) three expansion patterns on carbon storage. AL: agricultural land, WL: woodland, GL: grassland, WA: water area.
4.3 Key Issue Causing the Conflict Between Rural Settlement and Ecosystem Services
The unbalanced growth between population and residential land have led to conflicts between human and ecosystem services (Castro-Prieto et al., 2017). The aforementioned analysis suggested that the area of rural settlement in Baota district has grown remarkably with an average annual growth rate of 3.13% during the study period. Especially after 2005, with the stimulation of the “New Countryside Construction” policy and other policies for rural development, the expansion speed of rural settlement was accelerated (Li and Song, 2020), and in Baota district specifically, the average annual expansion rate of the rural settlement increased to 4.31%. However, the incoordination between rural settlement expansion and rural population growth has become increasingly noticeable. In particular, the average annual change rate of rural settlement in Baota district were 1.93%, 2.58%, and 6.08% in 2000–2005, 2005–2010, and 2010–2015, respectively. Yet, the changing characteristics of rural populations in Baota district were opposite. The average annual change rate of rural populations continuously decreased from 3.47% to 0.25% during the time period. Despite the decline in rural population growth rate, our study found that the rural settlement expansion in Baota district was still dominated by the edge and leapfrog expansion patterns which was in line with previous studies (Tan and Li, 2013; Tian et al., 2014; Xu et al., 2016).
4.4 Implications for Rural Land Management
In the course of rapid urbanization and economic development, the ecologically fragile region is facing dual pressures of rural development and eco-environment protection (Yu et al., 2018). Rural settlements, therefore, should be appropriately planned in order to balance environmental and socioeconomic benefits and then achieve the rural sustainable development. (Pacione, 2013; Tudor et al., 2014). In this study, the spatial distribution, degree, and eco-environment effects of rural settlement expansion patterns are quite different in Baota district, which determine that the governance strategies of rural settlements should be tailored to local conditions. For example, in the far-flung suburb area, where outside 20 km from the county center, the expansion intensity of rural settlement is relatively weak. The most prominent problem is food production loss due to the occupation of cultivated land in edge expansion. In this type of area, the red line for cultivated land protection should be focused on preventing further loss of cultivated land. At the same time, the gully land consolidation project should be carried out to achieve a balance between the occupation and compensation of cultivated land. In area within 10–20 km from the county center, the problem of food production and carbon storage loss caused by the leapfrog expansion is most prominent. In this type of area, the red line of “planning and development of villages” extremely needs more attention, so as to limit the disorderly expansion of rural settlements and improve the efficiency of land use. In area within 10 km from the city center, the land used for settlements expanded rapidly, and the habitat quality, carbon storage, and grain yield all declined obviously. In this type of area, strict space utilization control measures should be implemented, focusing on the delineation of ecological protection red lines to prevent ecological land from being further eroded.
In addition, there are inevitably some limitations in this study. For instance, we mainly analyzed the expansion of rural settlements and their ecological effects from 1990 to 2015. In the follow-up study, we will supplement the research on the latest dynamics of rural settlement expansion and its impact on eco-environment. In addition, the parameters for the InVEST model in this study are mainly based on experts’ experience and published literature. We would further improve our approach by field sampling or a biogeochemical model in future study.
5 Conclusion
This study analyzed the dynamic changes of rural settlement and used GAEZ and InVEST models to quantitatively examine the associated effects of ecosystem services in Baota district. The results showed the following: 1) the change of rural settlement in the area of research is extensive during 1990–2015, reflecting the rapid expanding features of the edge expansion pattern, and those areas with edge expansion are mostly transitioned from agricultural lands. 2) Overall, the total yield of crop decreased over the last 25 years. The habitat quality and carbon storage were also affected by rural settlement expansion, although the average habitat quality and total carbon storage of Baota district increased during the time period. 3) The habitat quality deterioration was mainly due to the conversion from agricultural land, grassland, and woodland to the edge expansion pattern; the predominant reason of the decreased carbon storage was the transformation from agricultural land and woodland to the edge expansion pattern, and the decrease of crop yield was mainly caused by the transition from agricultural land to edge expansion pattern. This study suggested that the governance strategies for rural settlements should be tailored to local conditions and appropriately planned in order to balance environmental and socioeconomic benefits and then achieve the rural sustainable development.
Data Availability Statement
The original contributions presented in the study are included in the article/Supplementary Material, further inquiries can be directed to the corresponding author.
Author Contributions
ZC: conceptualization, methodology, and writing–original draft. YL: formal analysis and writing–review and editing. ZL: formal analysis and writing–review and editing. JW: supervision and funding acquisition. XL: formal analysis and data curation.
Funding
This work was supported by the National Natural Science Foundation of China (Grant Nos. 42001204 and No.42071227) and the Strategic Priority Research Program of the Chinese Academy of Sciences (Grant Nos. XDA28130400 and XDA19040402).
Conflict of Interest
The authors declare that the research was conducted in the absence of any commercial or financial relationships that could be construed as a potential conflict of interest.
Publisher’s Note
All claims expressed in this article are solely those of the authors and do not necessarily represent those of their affiliated organizations, or those of the publisher, the editors, and the reviewers. Any product that may be evaluated in this article, or claim that may be made by its manufacturer, is not guaranteed or endorsed by the publisher.
References
Bai, L., Xiu, C., Feng, X., and Liu, D. (2019). Influence of Urbanization on Regional Habitat Quality:a Case Study of Changchun City. Habitat Int. 93, 102042. doi:10.1016/j.habitatint.2019.102042
Bao, Y. (2015). Temporal and Spatial Change of Ecological Services on Loess Plateau of Shaanxi by InVEST Model. Xi'an: Northwest University.
Baral, H., Keenan, R. J., Sharma, S. K., Stork, N. E., and Kasel, S. (2014). Spatial Assessment and Mapping of Biodiversity and Conservation Priorities in a Heavily Modified and Fragmented Production Landscape in north-central Victoria, Australia. Ecol. Indicators 36, 552–562. doi:10.1016/j.ecolind.2013.09.022
Braniš, M., and Domasová, M. (2003). PM10 and Black Smoke in a Small Settlement: Case Study from the Czech Republic. Atmos. Environ. 37, 83–92.
Brown, M. E. (2016). Remote Sensing Technology and Land Use Analysis in Food Security Assessment. J. Land Use Sci. 11, 623–641. doi:10.1080/1747423x.2016.1195455
Castro-Prieto, J., Martinuzzi, S., Radeloff, V. C., Helmers, D. P., Quiñones, M., and Gould, W. A. (2017). Declining Human Population but Increasing Residential Development Around Protected Areas in Puerto Rico. Biol. Conservation 209, 473–481. doi:10.1016/j.biocon.2017.02.037
Chen, M., and Ye, C. (2014). Differences in Pattern and Driving Forces between Urban and Rural Settlements in the Coastal Region of Ningbo, China. Sustainability 6, 1848–1867. doi:10.3390/su6041848
Chen, Z., Li, Y., Liu, Y., and Liu, X. (2021a). Does Rural Residential Land Expansion Pattern lead to Different Impacts on Eco-Environment? A Case Study of Loess Hilly and Gully Region, China. Habitat Int. 117, 102436. doi:10.1016/j.habitatint.2021.102436
Chen, Z., Liu, X., Lu, Z., and Li, Y. (2021b). The Expansion Mechanism of Rural Residential Land and Implications for Sustainable Regional Development: Evidence from the Baota District in China's Loess Plateau. Land 10, 172. doi:10.3390/land10020172
Cheng, J., Cheng, J., and Yang, X. (2011). Grassland Vegetation and Soil Carbon Sequestration in the Loess Plateau. J. Nat. Resour. 23, 401–411.
Goldstein, J. H., Caldarone, G., Duarte, T. K., Ennaanay, D., Hannahs, N., Mendoza, G., et al. (2012). Integrating Ecosystem-Service Tradeoffs into Land-Use Decisions. Proc. Natl. Acad. Sci. U.S.A. 109, 7565–7570. doi:10.1073/pnas.1201040109
Gude, P. H., Hansen, A. J., Rasker, R., and Maxwell, B. (2006). Rates and Drivers of Rural Residential Development in the Greater Yellowstone. Landscape Urban Plann. 77, 131–151. doi:10.1016/j.landurbplan.2005.02.004
He, C., Zhang, D., Huang, Q., and Zhao, Y. (2016). Assessing the Potential Impacts of Urban Expansion on Regional Carbon Storage by Linking the LUSD-Urban and InVEST Models. Environ. Model. Softw. 75, 44–58. doi:10.1016/j.envsoft.2015.09.015
Hou, Y., Lü, Y., Chen, W., and Fu, B. (2017). Temporal Variation and Spatial Scale Dependency of Ecosystem Service Interactions: a Case Study on the central Loess Plateau of China. Landscape Ecol. 32, 1201–1217. doi:10.1007/s10980-017-0497-8
Jiang, P., Li, M., and Cheng, L. (2020). Dynamic Response of Agricultural Productivity to Landscape Structure Changes and its Policy Implications of Chinese farmland Conservation. Resour. Conservation Recycling 156, 104724.
Ju, H., Zhang, Z., Zhao, X., Wang, X., Wu, W., Yi, L., et al. (2018). The Changing Patterns of Cropland Conversion to Built-Up Land in China from 1987 to 2010. J. Geogr. Sci. 28, 1595–1610. doi:10.1007/s11442-018-1531-8
Kröger, C., Xu, A., Duan, S., Zhang, B., Eckstädt, H., and Meissner, R. (2012). The Situation of Sanitary Systems in Rural Areas in the Miyun Catchment, China. Water Sci. Technol. 66, 1178–1185. doi:10.2166/wst.2012.296
Li, D., Wang, D., Li, H., Zhang, S., and Tian, W. (2017). The Effects of Rural Settlement Evolution on the Surrounding Land Ecosystem Service Values: a Case Study in the Eco-Fragile Areas, China. Ijgi 6, 49. doi:10.3390/ijgi6020049
Li, F., Zhou, M., and Hu, M. (2019). Climate Change in Different Geographical Units and its Impact on Land Production Potential: a Case Study of Shaanxi Province, China. Environ. Sci. Pollut. Res. 26, 22273–22283.
Li, H., and Song, W. (2020). Evolution of Rural Settlements in the Tongzhou District of Beijing under the New-type Urbanization Policies. Habitat Int. 101, 102198. doi:10.1016/j.habitatint.2020.102198
Li, Y., Duo, L., Zhang, M., Wu, Z., and Guan, Y. (2021). Assessment and Estimation of the Spatial and Temporal Evolution of Landscape Patterns and Their Impact on Habitat Quality in Nanchang, China. Land 10, 1073. doi:10.3390/land10101073
Liang, Y., Hashimoto, S., and Liu, L. (2021). Integrated Assessment of Land-Use/land-Cover Dynamics on Carbon Storage Services in the Loess Plateau of China from 1995 to 2050. Ecol. Indicators 120, 106939. doi:10.1016/j.ecolind.2020.106939
Liu, G., and Zhao, Z. (2018). Analysis of Carbon Storage and its Contributing Factors-A Case Study in the Loess Plateau (China). Energies 11, 1596. doi:10.3390/en11061596
Liu, J., Kuang, W., Zhang, Z., Xu, X., Qin, Y., Ning, J., et al. (2014). Spatiotemporal Characteristics, Patterns, and Causes of Land-Use Changes in China since the Late 1980s. J. Geogr. Sci. 24, 195–210. doi:10.1007/s11442-014-1082-6
Liu, X., Li, X., Chen, Y., Tan, Z., Li, S., and Ai, B. (2010). A New Landscape index for Quantifying Urban Expansion Using Multi-Temporal Remotely Sensed Data. Landscape Ecol. 25, 671–682. doi:10.1007/s10980-010-9454-5
Liu, X., Liu, Y., Liu, Z., and Chen, Z. (2021). Impacts of Climatic Warming on Cropping System Borders of China and Potential Adaptation Strategies for Regional Agriculture Development. Sci. Total Environ. 755, 142415. doi:10.1016/j.scitotenv.2020.142415
Liu, Y., Li, J., and Yang, Y. (2018). Strategic Adjustment of Land Use Policy under the Economic Transformation. Land Use Policy 74, 5–14. doi:10.1016/j.landusepol.2017.07.005
Lyu, R., Clarke, K. C., Zhang, J., Feng, J., Jia, X., and Li, J. (2021). Dynamics of Spatial Relationships Among Ecosystem Services and Their Determinants: Implications for Land Use System Reform in Northwestern China. Land Use Policy 102, 105231. doi:10.1016/j.landusepol.2020.105231
Millennium Ecosystem Assessment (2005). Ecosystems and Human Well-Being. Washington, DC: Island Press.
Pacione, M. (2013). Private Profit, Public Interest and Land Use Planning-A Conflict Interpretation of Residential Development Pressure in Glasgow's Rural-Urban Fringe. Land Use Policy 32, 61–77. doi:10.1016/j.landusepol.2012.09.013
Polasky, S., Nelson, E., Pennington, D., and Johnson, K. A. (2011). The Impact of Land-Use Change on Ecosystem Services, Biodiversity and Returns to Landowners: A Case Study in the State of Minnesota. Environ. Resource Econ. 48, 219–242. doi:10.1007/s10640-010-9407-0
Ren, J., Yang, J., Zhang, Y., Xiao, X., Xia, J. C., Li, X., et al. (2022). Exploring thermal comfort of Urban Buildings Based on Local Climate Zones. J. Clean. Prod. 340, 130744. doi:10.1016/j.jclepro.2022.130744
Röder, A., Pröpper, M., Stellmes, M., Schneibel, A., and Hill, J. (2015). Assessing Urban Growth and Rural Land Use Transformations in a Cross-Border Situation in Northern Namibia and Southern Angola. Land Use Policy 42, 340–354.
Sharp, R., Tallis, H. T., Ricketts, T., Guerry, A. D., Wood, S. A., Chaplin-Kramer, R., et al. (2015). InVEST 3.2.0 User's Guide. Stanford: The Natural Capital Project.
Song, W., Chen, B., and Zhang, Y. (2014). Land-use Change and Socio-Economic Driving Forces of Rural Settlement in China from 1996 to 2005. Chin. Geogr. Sci. 24, 511–524. doi:10.1007/s11769-013-0633-6
Song, W., and Liu, M. (2014). Assessment of Decoupling between Rural Settlement Area and Rural Population in China. Land Use Policy 39, 331–341. doi:10.1016/j.landusepol.2014.02.002
Sun, X., Jiang, Z., Liu, F., and Zhang, D. (2019). Monitoring Spatio-Temporal Dynamics of Habitat Quality in Nansihu Lake basin, Eastern China, from 1980 to 2015. Ecol. Indicators 102, 716–723. doi:10.1016/j.ecolind.2019.03.041
Tan, M., and Li, X. (2013). The Changing Settlements in Rural Areas under Urban Pressure in China: Patterns, Driving Forces and Policy Implications. Landscape Urban Plann. 120, 170–177. doi:10.1016/j.landurbplan.2013.08.016
Tao, F., Zhang, Z., Zhang, S., Zhu, Z., and Shi, W. (2012). Response of Crop Yields to Climate Trends since 1980 in China. Clim. Res. 54, 233–247. doi:10.3354/cr01131
Tassinari, P., Carfagna, E., Torreggiani, D., Benni, S., and Zagoraiou, M. (2010). The Study of Changes in the Rural Built Environment: Focus on Calibration and Improvement of an Areal Sampling Approach. Biosyst. Eng. 105, 486–494. doi:10.1016/j.biosystemseng.2010.01.008
Tian, G., and Qiao, Z. (2014). Assessing the Impact of the Urbanization Process on Net Primary Productivity in China in 1989-2000. Environ. Pollut. 184, 320–326. doi:10.1016/j.envpol.2013.09.012
Tian, G., Qiao, Z., and Gao, X. (2014). Rural Settlement Land Dynamic Modes and Policy Implications in Beijing Metropolitan Region, China. Habitat Int. 44, 237–246. doi:10.1016/j.habitatint.2014.06.010
Tiepolo, M., and Galligari, A. (2021). Urban Expansion-Flood Damage Nexus: Evidence from the Dosso Region, Niger. Land Use Policy 108, 105547. doi:10.1016/j.landusepol.2021.105547
Tu, S., and Long, H. (2020). The Theoretical Cognition of Rural Settlements Spatial Restructuring. Scientia Geographica Sinica 40, 509–517.
Tudor, C. A., Iojă, I. C., Pǎtru-Stupariu, I., Nită, M. R., and Hersperger, A. M. (2014). How Successful Is the Resolution of Land-Use Conflicts? A Comparison of Cases from Switzerland and Romania. Appl. Geogr. 47, 125–136. doi:10.1016/j.apgeog.2013.12.008
Wang, S. (2009). Current Situation and Development Countermeasures of Comprehensive Management of Soil and Water Conservation in Baota District of Yan'an City. Soil and Water Conservation in China, 60–61.
Wu, L., Long, T.-Y., and Cooper, W. J. (2012). Simulation of Spatial and Temporal Distribution on Dissolved Non-point Source Nitrogen and Phosphorus Load in Jialing River Watershed, China. Environ. Earth Sci. 65, 1795–1806. doi:10.1007/s12665-011-1159-9
Wu, X., Wang, S., Fu, B., Liu, Y., and Zhu, Y. (2018). Land Use Optimization Based on Ecosystem Service Assessment: A Case Study in the Yanhe Watershed. Land Use Policy 72, 303–312. doi:10.1016/j.landusepol.2018.01.003
Xian, S., Li, L., and Qi, Z. (2019). Toward a Sustainable Urban Expansion: A Case Study of Zhuhai, China. J. Clean. Prod. 230, 276–285. doi:10.1016/j.jclepro.2019.05.087
Xu, M., He, C., Liu, Z., and Dou, Y. (2016). How Did Urban Land Expand in China between 1992 and 2015? A Multi-Scale Landscape Analysis. PLOS ONE 11, e0154839. doi:10.1371/journal.pone.0154839
Yang, J., Wang, Y., Xue, B., Li, Y., Xiao, X., Xia, J., et al. (2021). Contribution of Urban Ventilation to the thermal Environment and Urban Energy Demand: Different Climate Background Perspectives. Sci. Total Environ. 795, 148791. doi:10.1016/j.scitotenv.2021.148791
Yang, R., Liu, Y., Long, H., and Qiao, L. (2015). Spatio-temporal Characteristics of Rural Settlements and Land Use in the Bohai Rim of China. J. Geogr. Sci. 25, 559–572. doi:10.1007/s11442-015-1187-6
Yang, Y., Bao, W., and Liu, Y. (2020). Coupling Coordination Analysis of Rural Production-Living-Ecological Space in the Beijing-Tianjin-Hebei Region. Ecol. Indicators 117, 106512. doi:10.1016/j.ecolind.2020.106512
Yang, Y., Liu, Y., Li, Y., and Du, G. (2018). Quantifying Spatio-Temporal Patterns of Urban Expansion in Beijing during 1985-2013 with Rural-Urban Development Transformation. Land Use Policy 74, 220–230. doi:10.1016/j.landusepol.2017.07.004
Yin, J., Li, H., Wang, D., and Liu, S. (2020). Optimization of Rural Settlement Distributions Based on the Ecological Security Pattern: A Case Study of Da'an City in Jilin Province of China. Chin. Geogr. Sci. 30, 824–838. doi:10.1007/s11769-020-1128-x
Yu, Z., Wu, C., Tan, Y., and Zhang, X. (2018). The Dilemma of Land Expansion and Governance in Rural China: A Comparative Study Based on Three Townships in Zhejiang Province. Land Use Policy 71, 602–611. doi:10.1016/j.landusepol.2017.09.054
Yuan, X., Han, J., Shao, Y., Li, Y., and Wang, Y. (2019). Geodetection Analysis of the Driving Forces and Mechanisms of Erosion in the Hilly-Gully Region of Northern Shaanxi Province. J. Geogr. Sci. 29, 779–790. doi:10.1007/s11442-019-1627-9
Zhao, Z., Sharifi, A., Dong, X., Shen, L., and He, B.-J. (2021). Spatial Variability and Temporal Heterogeneity of Surface Urban Heat Island Patterns and the Suitability of Local Climate Zones for Land Surface Temperature Characterization. Remote Sensing 13, 4338. doi:10.3390/rs13214338
Zhou, Y., Zi, T., Lang, J., Huang, D., Wei, P., Chen, D., et al. (2020). Impact of Rural Residential Coal Combustion on Air Pollution in Shandong, China. Chemosphere 260, 127517. doi:10.1016/j.chemosphere.2020.127517
Keywords: rural settlement, expansion patterns, ecosystem services, loess hilly and gully region, China
Citation: Chen Z, Li Y, Liu Z, Wang J and Liu X (2022) Impacts of Different Rural Settlement Expansion Patterns on Eco-Environment and Implications in the Loess Hilly and Gully Region, China. Front. Environ. Sci. 10:857776. doi: 10.3389/fenvs.2022.857776
Received: 19 January 2022; Accepted: 04 March 2022;
Published: 28 March 2022.
Edited by:
Wenqiu Ma, China Agricultural University, ChinaReviewed by:
Guan Xiaoke, Zhengzhou University of Light Industry, ChinaJun Yang, Northeastern University, China
Jintao Li, Shandong University, China
Copyright © 2022 Chen, Li, Liu, Wang and Liu. This is an open-access article distributed under the terms of the Creative Commons Attribution License (CC BY). The use, distribution or reproduction in other forums is permitted, provided the original author(s) and the copyright owner(s) are credited and that the original publication in this journal is cited, in accordance with accepted academic practice. No use, distribution or reproduction is permitted which does not comply with these terms.
*Correspondence: Jieyong Wang, d2p5QGlnc25yci5hYy5jbg==