 Dong Chen
 Qiuyue Zhao1
 Mengqi Wei
 Miao Guan
94% of researchers rate our articles as excellent or good
Learn more about the work of our research integrity team to safeguard the quality of each article we publish.
Find out more
ORIGINAL RESEARCH article
Front. Environ. Sci., 11 March 2022
Sec. Atmosphere and Climate
Volume 10 - 2022 | https://doi.org/10.3389/fenvs.2022.857510
The study of air quality over the Yangtze River is important for the pollution of urban agglomeration along the longest river in China. A comprehensive 15-day shipborne observation was conducted in the Yangtze River of the Jiangsu section in the summer of 2019. Through online observation and offline chemistry analysis of aerosol and gaseous pollutants, the result showed that the air pollution over the Yangtze River was more severe than that in surrounding cities. Sulfate, nitrate, and ammonium (SNA) dominated the water-soluble inorganic species and accounted for 35.0% ± 7.3% of the fine particle concentration (PM2.5) along the Yangtze River. The high concentration of sulfate in the droplet mode (0.56–1.0 μm) was due to the formation of sulfate through in-cloud processes under high sulfur dioxide (SO2) concentration by ship emission and high relative humidity along the river. The strong correlation between the measured mass absorption efficiency value by carbon analyzer and that simulated based on the assumption of core–shell suggested that the core–shell mode was the main composition form of aerosol in the Yangtze River. The scattering effect was the main part of the aerosol light extinction, and the scattering coefficient of 0.4- to 1.1-μm particles accounted for 85.0% of the total extinction coefficient. Positive matrix factorization model was applied for the source apportionment of particle size segment of main extinction contribution (0.4–2.1 μm), and the result showed that secondary nitrate, ship emission, coal combustion, fugitive dust, and biomass burning were the main sources of aerosols in the Yangtze River. After source reanalysis, the result indicated that the contribution of secondary nitrate from nitrogen oxide (NOx) by ship emission and coal combustion should not be ignored.
The Yangtze River is the longest river in China and Asia, which geographically flows from Qinghai Province to eastern China at Shanghai. There are more than 3,600 navigable rivers in the Yangtze River Basin, accounting for nearly 70% of the national inland waterway mileage (Liu et al., 2007). The economic density is more than 2 times the national average, showing the dominant role of the Yangtze River shipping network in the inland waterway of China. Three mega cities (Shanghai, Nanjing, and Wuhan) are located on the shore of the Yangtze River, which are the cities with intensive and complicated sources of air pollutants (Xu et al., 2016). However, rapid industrialization and urbanization in the Yangtze River Delta led to an increase in air pollution.
Due to the complexity of chemical composition and size distribution, aerosols have different impacts on visibility degradation, climate change, and human health in different regions. In recent years, many studies focused on the chemical compositions, optical properties, and source apportionment of ambient aerosol in the Yangtze River Delta cities. A previous study indicated that size distributions of nitrate and ammonium presented significant seasonal variations and distinctive characteristics in polluted days in Shanghai (Ding et al., 2017). Wang et al. (2016a) indicated that vehicle exhaust, secondary nitrate, and secondary sulfate were identified as the most significant sources for aerosol light extinction in Hangzhou. Chen et al. (2020) suggested that the increased primary particle emissions from vehicles and industry were the major causes of the aerosol extinction in urban and industrial regions in Nanjing, respectively. Different from the urban regional studies (Li et al., 2014; Zhang et al., 2021), however, aerosol along the Yangtze River was largely affected by ship emissions (Li et al., 2018). According to the International Environmental Protection Organization’s Natural Resources Protection Association (NRDC), a medium-sized container ship with 70% of the maximum power load emits fine particles (PM2.5) equivalent to the particle emissions of 50 thousand diesel trucks (Natural Resources Defense Council (NRDC), 2014). Based on the Automatic Identification System (AIS) data, a previous study showed that ship emissions were mainly distributed at the port areas, intersection areas, and the north channel of the Yangtze River estuary (Weng et al., 2020). Though pollutant emissions from ships occur mainly in the river or ocean, they can also affect the air quality in the surrounding cities. On the analysis of the metallic concentration (V, Ni) in PM2.5, Li et al. (2018) found that ship emission was one of the important sources of aerosol in Shanghai. Huang et al. (2020) suggested that PM2.5 concentrations of five stations in Yantai were largely affected by ship emission in the ocean. It showed that the Yangtze River is an important route of trade and travel in China. However, there are seldom data related to chemical characterization and optical properties of aerosol along the Yangtze River channel, and related shipborne observations for optical characteristics and source apportionment of aerosols along the Yangtze River remain insufficient.
With the length of 1/7 of the Yangtze River’s navigation mileage, the Jiangsu section of the Yangtze River undertakes 70% of the total freight volume, and it includes seven billion tons of large ports and more than four million tons of berths (Zhao et al., 2021). A large scale of shipping navigation brings convenience and low cost of logistics transportation. However, large emissions of air pollutants from anthropogenic sources such as ships, port freight cars, and storage tanks bring a great challenge to the improvement of atmospheric environment quality in Jiangsu. Based on AIS and Lloyd’s Register of Shipping, Yuan et al. (2020) estimated that two important aerosol gaseous precursors, SO2 and NOx, of the ship emissions were 5.5 and 19.2 million tons, respectively, and the emissions of the two pollutants both account for more than 12% of the total emissions in Jiangsu (MEIC, http://www.meicmodel.org/). In order to study the air quality and the source apportionment of visibility degradation along the Yangtze River of the Jiangsu section, a comprehensive shipborne observation was conducted from August 22 to September 6, 2019. Multitudinous offline and online instruments were applied in the observation of chemical characteristics and size distribution of aerosol from Nanjing to Suzhou. The primary objectives of this study were to evaluate the air pollution, to characterize the chemical components and light extinction of atmospheric aerosols, and to estimate the contributions of emission sources to visibility degradation along the Yangtze River.
A mobile atmospheric pollutant monitoring platform (A container: length 12 m, width 2.5 m and height 3 m) was placed on a vessel (length 30 m, width 20 m), sailing from August 22 to September 6, 2019, along the Yangtze River channel from Nanjing to Suzhou (31.97°N–31.52°N, 118.64°E–121.31°E). This campaign route is illustrated in Figure 1.
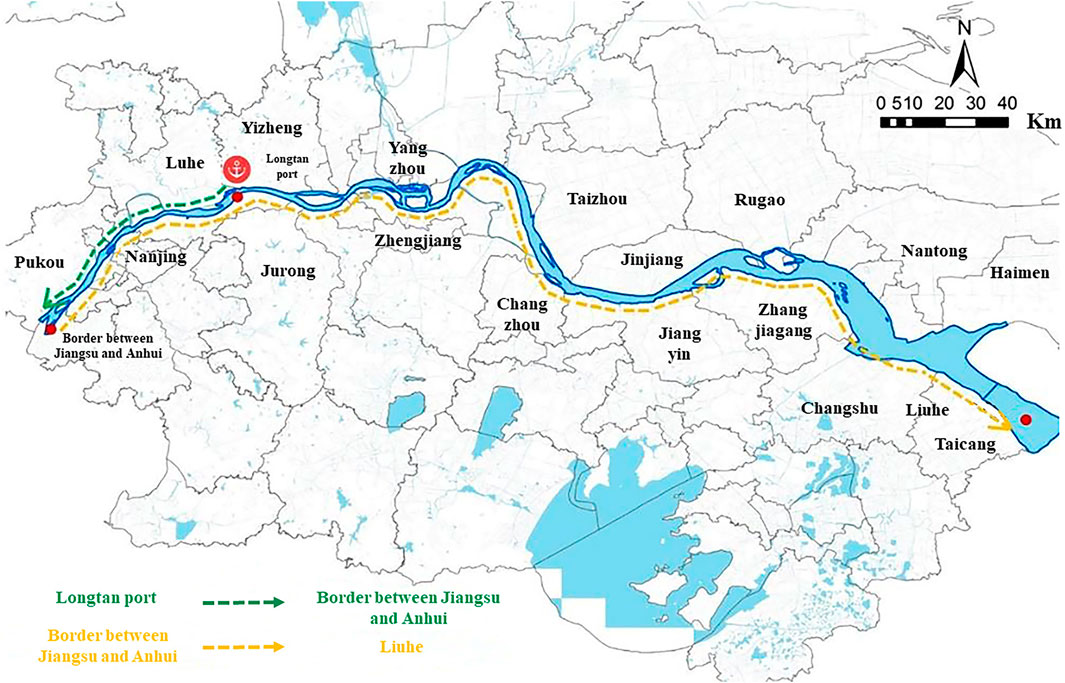
FIGURE 1. Cruise tracks during the Yangtze River Campaign (YRC).
Starting on August 22 in the Longtan port of Nanjing, the vessel sailed from east to west and arrived at the intersection of Nanjing and Ma’anshan on August 23. After berthing in the port of western Nanjing for one night, the vessel crossed the Jiangsu section of the Yangtze River from west to east and finally arrived at the Taicang port in Suzhou on September 6 along the Yangtze River waterway.
A wide range of data, including online observation of aerosols (PM2.5 and PM10), trace gas concentrations (CO, NO2, SO2, and O3), were acquired during the Yangtze River Campaign (YRC). Moreover, the filter samples of PM2.5 and size-resolved particles were also collected for the studies of optical properties and sources of aerosols.
Aerosol (PM2.5 and PM10) online monitor (TEOM 1405DF, Thermo Fisher Scientific, Waltham, MA, USA) and a set of trace gas instruments (Thermo Fisher Scientific, USA), including 42i NO2 analyzer, 43i SO2 analyzer, 48i CO analyzer, and 49i O3 analyzer, were installed in the air-conditioned container to measure mass concentrations of aerosol and gaseous pollutants along the Yangtze River. Quality control and assurance including regular cleanness and weekly and monthly calibration of the instruments were followed according to the technical guidance established by U.S. Environmental Protection Agency (U.S. Environmental Protection Agency, 1998).
Pre-combusted (at 500°C for ∼5 h) quartz filters (90 and 47 mm in diameter, Whatman International Ltd., Maidstone, UK) were applied for the sampling of PM2.5 and particles with different sizes. The filter samples were weighed before and after sampling under the constant temperature (23°C ± 2°C) and relative humidity (RH) (40% ± 3%) for 24-h conditioning. All the filter samples were collected using the medium-volume sampler by TH-150C (Wuhan Tianhong Ltd., Wuhan, China) (flow rate 100 L/min). During the YRC, a total of 15 daily PM2.5 samples were obtained. Size-resolved particles were collected by a 28 L/min eight-stage Anderson Cascade impactor (Thermo Electron North America, Palm Beach, FL, USA; model E-0162). The 50% cutoff points of the impactor were 9.0, 5.8, 4.7, 3.3, 2.1, 1.1, 0.65, and 0.43 μm (aerodynamic diameter). A total of eight sets of size-resolved filter samples were obtained. To obtain sufficient particles at each stage for the chemical analysis, PM2.5 and size-resolved particles samplings both lasted continuously for 24 h starting at 8:00 a.m. All the filter samples were weighed by using a sensitive microbalance (Mettler Toledo, Greifensee, Switzerland; model AX205) with a resolution of 0.1 mg. Before chemical analysis, all quartz filter samples were stored in a freezer at −20°C to prevent the volatilization of particles.
Four anions (SO42−, NO3−, Cl−, and F−) and five cations (Na+, NH4+, K+, Mg2+, and Ca2+) in particles were measured in the extracted solution of the filter samples with ion chromatography (Dx-120, Dionex Ltd., Sunnyvale, CA, United States). CS12A column (Dionex Ltd.) with 20 mM of methanesulfonic acid MSA eluent and AS11-HC column (Dionex Ltd.) with 8 mM KOH eluent were used to measure cations and anions, respectively (Chen et al., 2019). The relative SD of each ion was less than 2% from three reproducibility tests. Five blank samples were analyzed with the same processes to remove possibly contaminations. Organic carbon (OC) and elemental carbon (EC) were measured with a thermal optical carbon analyzer (Desert Research Institute, DRI, Reno, NV, USA; model 2001) following the IMPROVE protocol and the thermal-optical reflectance (TOR).
In addition to OC and EC mass concentrations, the light attenuation (ATN) was also measured by the DIR analyzer to estimate the mass absorption efficiency (MAE) of EC, and MAE is calculated as
where ECs is the elemental carbon loading on the filter (µg/cm2). C and R (ATN) are the two empirical factors for correcting the artifacts due to multiple scattering and shadowing effects, respectively. In this study, an empirical factor of 2.14 (C) was adopted for correcting the artifact due to multiple scattering according to previous studies (Ram and Sarin, 2009; Cheng et al., 2011). In order to rectify shadowing effects, Weingartner et al. (2003) estimated R (ATN) based on the aethalometer data:
Ram and Sarin calculated the shadowing effects (660 nm) by setting f as 1.103 during wintertime and 1.114 for the rest of the seasons.
The aerosol extinction coefficient (including scattering and absorption coefficient) for particles at a given size (bext; including bsca and babs) is calculated with the Mie theory (Bohren and Huffman, 1998; Cheng and He, 2015):
where m is the aerosol refractive index; g is the hygroscopic growth factor; Qext is the extinction efficiency for a single spherical particle with diameter Dp and can be calculated with the Mie theory by inputting Dp, m, and the incident wavelength (λ); N(Dp) is the number concentration of particle with diameter Dp. Three typical models are typically proposed to represent the particle mixing state including external, internal, and core–shell mixture (Jacobson, 2001; Seinfeld and Pandis, 2006; Tan et al., 2016). The methods of calculating the parameters including m and N (Dp) are different for the three mixed states, and the details can be referred to Ding et al. (2015).
Positive matrix factorization (PMF) is a multivariate statistical tool that had been widely used in the study of source apportionment of aerosol (Kim and Hopke, 2004). In this technique, the potential sources and their respective contributions to the mass concentration of aerosols were estimated. In total, 45 aerosol samples in this study were analyzed, and the mass concentrations of water-soluble ions and a carbonaceous component of aerosols were used for source appointment analysis. The source contributions of primary particles were obtained using the PMF model, and those of secondary inorganic aerosol (SIA) were further determined based on estimates of the nitrogen oxides (NOx) and sulfur dioxide (SO2) emissions in a local inventory. We followed the methods described in the PMF manual and Chen et al. (2020) to calculate the chemical component uncertainties in the measurement dataset. Criteria including the optimum number of factors and the minimization of an objective function Q were determined based on the principles described in previous studies (Watson et al., 2015; Tian et al., 2016) and applied in the model to obtain the best PMF solution. More details on the PMF solution were described in our previous study (Chen et al., 2020).
Supplementary Figure S1 presents the comparisons of PM concentrations of air quality monitoring stations along the Yangtze River during the sampling period (from August 22 to September 11) along the Yangtze River. The highest PM2.5 and PM10 concentrations in Wuxi were observed among all the cities. According to the concentration ratio of PM2.5 to PM10 (PM2.5/PM10), fine particle pollution was serious in the area along the Yangtze River in Nanjing, while coarse particle pollution in Zhenjiang was more prominent. Compared with the monitoring data of the air quality monitoring stations in the cities along the Yangtze River (Figure 2), the mass concentrations of SO2, NO2, O3, PM2.5, PM10, and CO along of the Yangtze River were 146%, 214%, 48%, 33%, 25%, and 50% larger, respectively, and the specific comparison with seven cities is shown in Supplementary Figure S2. The results showed that air pollution along the Yangtze River was more serious than that in surrounding cities. It could be supposed that the air quality of the Yangtze River may be largely affected by pollution emissions from the ship and anthropogenic sources distributed on both the bank of the river.
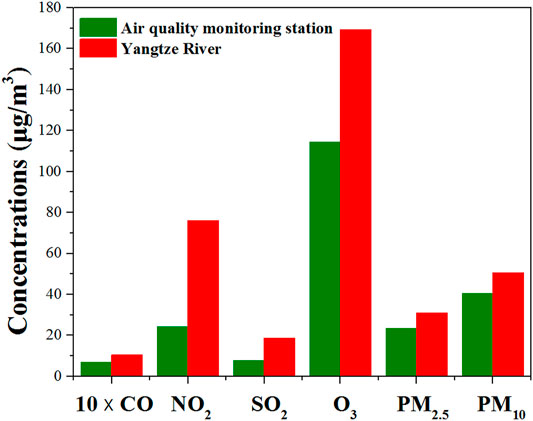
FIGURE 2. Comparison of pollutant concentrations between the Yangtze River and surrounding cities (The unit of CO is mg/m3 and others are μg/m3).
In the offline aerosol sampling observation, the average mass concentration (±SD) of PM2.5 during the sampling period along the Yangtze River was 64.6 ± 22.0 μg/m3 (Table 1), which was 84.64% larger than the China National Ambient Air Quality Standers (GB3095-2012) for annual PM2.5 (35.0 μg/m3). The water-soluble ions during YRC had an average mass concentration of 23.6 ± 12.0 μg/m3, accounting for 35.0% ± 7.3% of the total PM2.5 concentration. The average concentrations of the main ions followed the sequence of SO42− > NO3− > NH4+ > Mg2+ > K+ >Na+. Among these, SO42−, NO3−, and NH4+ (SNA) dominated the water-soluble inorganic species and accounted for 88.7% ± 5.3% of the total ion mass.
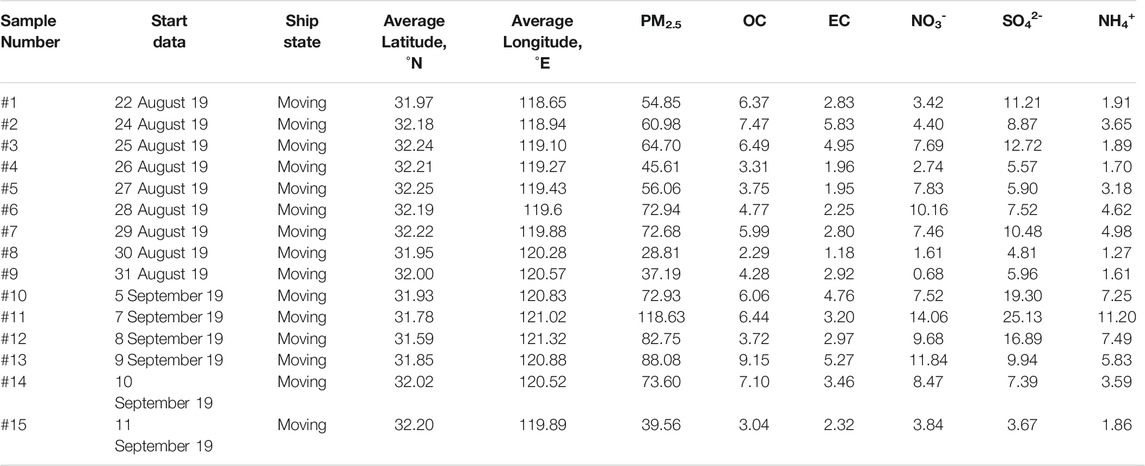
TABLE 1. The concentrations of PM2.5 and its chemical species during YRC (μg/m3).
Compared with aerosol chemical compositions in urban sites (Wang et al., 2016b; Honglei Wang et al., 2016; Meng et al., 2020), a low ratio of NO3−/SO42− (0.7 ± 0.4) along the Yangtze River was found. The low ratio during YRC was probably due to the large SO2 emission from ship exhaust and the decomposition of nitrate by high temperatures in the summertime. A previous study estimated that the Jiangsu section of the Yangtze River ship emissions of SO2 was 553 million tons in 2017 (Yuan et al., 2020), which was 2.7 times those of total SO2 emissions in Nanjing and was 17.5% of total SO2 emissions in Jiangsu Province (MEIC, http://www.meicmodel.org/). Moreover, there were lots of industrial sources including steel and iron plants, power plants, and chemical plants surrounding the Yangtze River, emitting amounts of SO2 and sulfate particles (Li et al., 2018). In addition, nitrate can be easily resolved under high temperatures (Li et al., 2014), leading to a low NO3−/SO42− ratio in the summer observation campaign.
Figure 3 presents the fractions of chemical species under the different PM2.5 concentrations. The proportion of SNA concentrations varied significantly as the increased PM2.5 concentration, from 58.0% at low PM2.5 concentration (20–40 μg/m3) to 76.0% in the high PM2.5 concentration range (90–120 μg/m3). In order to improve the air quality of the Yangtze River, more control measures of the precursor gases (SO2, NO2, and NH3) emitted from emission sources such as ships and industrial along the Yangtze River are urgently needed.
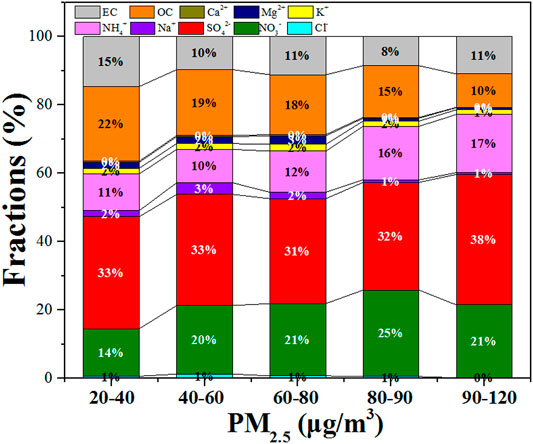
FIGURE 3. The mass fractions of the main chemical species under the different PM2.5 concentrations.
In addition to SNA, carbonaceous components were also the dominant chemical species of PM2.5. The average OC and EC mass concentrations were 5.4 ± 1.9 and 3.4 ± 1.4 μg/m3, respectively. As shown in Supplementary Figure S3, a strong correlation was found (R2 = 0.66) between OC and EC during YRC, suggesting the existence of their common sources. The OC to EC ratio could be roughly identified as the emission source. Previous studies suggested that OC/EC ratios ranged from 0.3 to 7.6 in coal combustion emissions, from 4.1 to 4.5 in biomass burning emissions (Watson et al., 2001), and at 0.21 for a full load in ship emission (Zhang et al., 2014). The OC/EC ratios in this study ranged from 1.3 to 2.3, and the average ratio was 1.7 ± 0.4, which seemed to be related to shipping emission and coal combustion processes.
Figure 4 presents the size distributions of particles and their main chemical species. As shown in Figure 4A, the size distributions of particles (PM), sulfate, and ammonium were similar, which were a bimodal pattern that peaked at 0.65–1.1 μm and 4.7–5.8 μm. Sulfate and ammonium were mainly concentrated in fine particles (0.43–2.1 μm), accounting for a larger proportion (65.0% and 67.0%) of the total mass (Figure 4A). A previous study indicated that the peak in the droplet mode (0.56–1.0 μm) was due to the formation of sulfate through in-cloud processes under high SO2 concentration and high RH conditions (Zhuang et al., 1999; Liu et al., 2008). The fact that high SO2 by ship emission and high RH on the river in this study would benefit the liquid phase reaction of SO2 and thereby the high sulfate concentration existed in the fine particle mode. Compared with nitrate and chloride, ammonium was easily combined with sulfate, since ammonium sulfate was more stable (Liu et al., 2008). As shown in Supplementary Figure S4, the high correlation between NH4+ and SO42− was found in the fine mode (0.43–1.1 μm), with R2 equal to 0.82. The mole ratio of NH4+ and SO42− was 1.1, indicating that NH4+ cannot completely neutralize SO42− and ammonium existed mainly in the form of (NH4)2SO4 along the Yangtze River. Different from previous studies in urban (Wang et al., 2016b; Honglei Wang et al., 2016), no obvious difference was found in the size distribution of NO3− concentration, and there was even no peak in accumulation mode in this study, which probably is less affected by vehicle NO2 emissions. Moreover, high temperatures during the sampling period may favor the dissociation of nitrate in the small particle size.
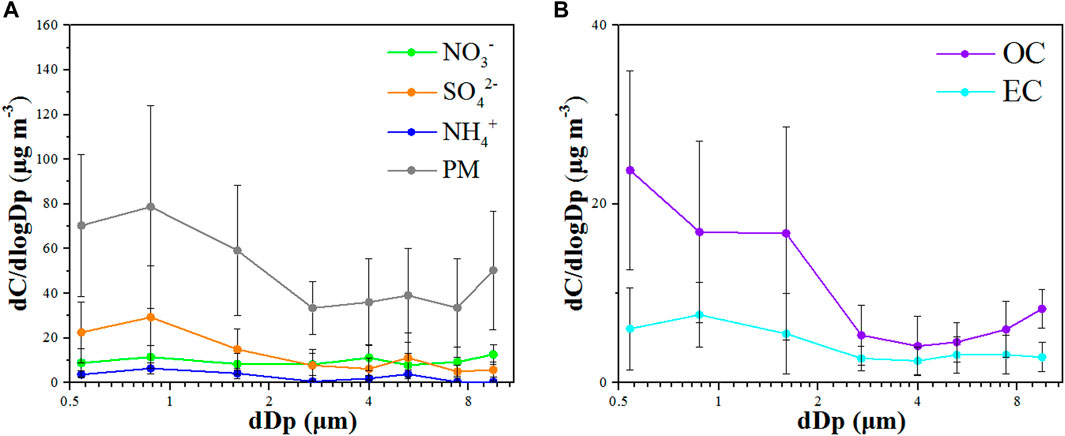
FIGURE 4. The size distributions of mass concentrations of PM, NO3−, SO42−, NH4+ (A) and OC, EC (B).
As shown in Figure 4B, the peak OC concentration was found at 0.43–0.65 μm, and EC showed a unimodal distribution that peaked at 0.65–1.1 μm. As shown in Supplementary Figure S5, there was a stronger correlation between OC and EC in fine particles (0.43–2.1 μm) (R2 = 0.82) compared to that in coarse particles (2.1–10.0 μm) (R2 = 0.41). This result indicated that the source of OC and EC in fine particles was similar. The OC and EC in fine particles were generally derived from exhaust emissions by moving source, coal combustion, and biomass burning (Zhang et al., 2015). The weak correlation between OC and EC in coarse mode indicates that there were different sources for OC and EC. A previous study suggested that coarse-mode OC was mainly attributed to the hygroscopic growth of water-soluble OC (WSOC)-containing particles from the emission of particulate OC (POC) by industrial sources (Wang et al., 2014). Coarse-mode EC could be formed through the mix of particles and hygroscopic growth by the resuspension of soil dust (Lan et al., 2011; Wang et al., 2014).
Figure 5 presents the MAE values measured by the carbon analyzer and those estimated by Mie theory. The simulated MAE values based on the assumption of external mixing states were much smaller than those based on core–shell and internal mixing states. The simulated MAE of the internal mixing mode was 27.0% larger than the measured MAE, whereas the MAE of the external mixing mode was 78.0% less than the measured value. Compared with core–shell and internal mixing, the simulated MAE value of the core–shell mode was much closer to the measured MAE, and its slope was 0.97, indicating that the core–shell mode was the main form of aerosol chemical component particles in the air along the Yangtze River channel.
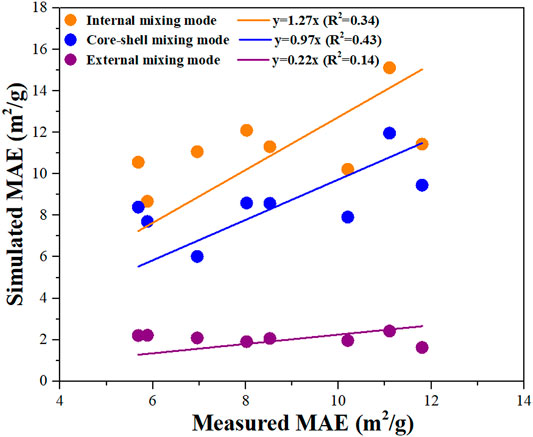
FIGURE 5. The comparison of the measured MAE values and those estimated with the external, internal, core-shell mixture assumption during YRC.
The size distribution of aerosol extinction was then estimated based on core–shell state, and the result is shown in Figure 6A. Small-size particles dominated the light extinction, as shown in Figure 6B, and particles in the size ranges of 0.4–0.7, 0.7–1.1, and 1.1–2.1 μm contributed the most (90.5%) to the total extinction coefficient. The light scattering effect was the main part of light extinction, and the contribution of the scattering coefficient of 0.4- to 1.1-μm particles was up to 85.0% in the total extinction coefficient. It should be noted that the absorption coefficient contributed more than 20% to the total extinction when the particle size was in the range of 1.1–10.0 μm. Wu et al. (2021) indicated that ships at high speed emitted more black carbon (BC). Mass concentration is often proportional to particle size. Thus, BC of coarse particle size from high-speed vessels probably is the main cause for the high contribution of absorption effect. More works on the influence of ship driving conditions on particle size distribution are needed for a better understanding of radiative forcing along the Yangtze River.
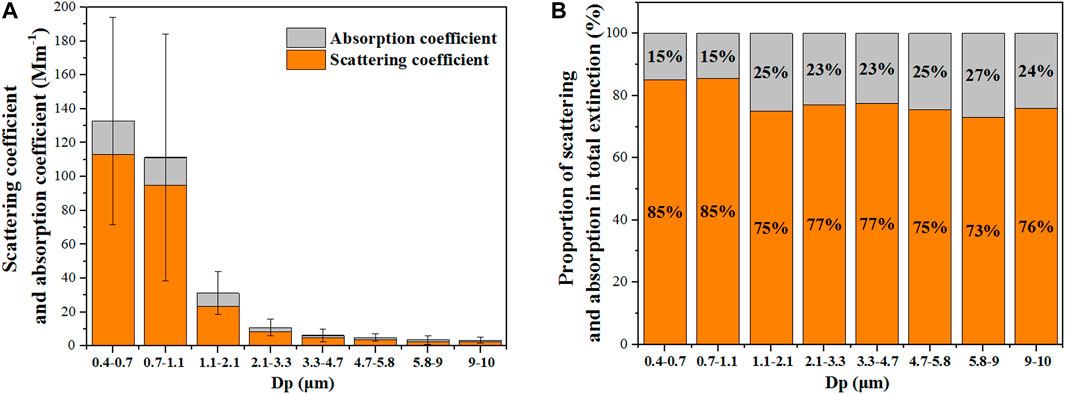
FIGURE 6. The extinction coefficients (including absorption and scattering coefficients) (A) and their fractions (B) of particles with different sizes during YRC.
Based on the mass concentrations of aerosol chemical components, the PMF model was used to estimate the contributions of emission sources to particles in the size range of 0.4–2.1 μm over the Yangtze River Basin. As shown in Supplementary Figure S6, five factors were extracted by the PMF model.
The load values of NO3− and NH4+ predominated in Factor 1. The two ions in aerosols were generally derived from inorganic precursors; thus, Factor 1 could represent a secondary nitrate source that contributed to 47.3% of the total PM2.5 mass. High loading of EC (45.1%) was found in Factor 2, and EC is the main species of aerosols emitted by diesel vehicles, ships, and coal combustion. In addition, the ratio of OC to EC in Factor 2 was smaller than that in Factor 3. Based on the actual situation of sampling in the Yangtze River channel, Factor 2 is identified as ship emission. High loadings of SO42−, OC, and EC were found in Factor 3. Compared with Factor 2, larger OC/EC was found in Factor 3, which could thus be defined as coal combustion. The main species of Factor 4 were Mg2+ and Ca2+. The two species were typically considered as the chemical tracers of fugitive dust. Factor 5 was dominated by K+, Cl−, and OC. These species are the key markers of biomass burning. As shown in Table 2, secondary inorganic sources, ship emission, coal combustion, fugitive dust, and biomass burning that contributed to PM2.5 were estimated at 47.3%, 28.6%, 16.7%, 4.0%, and 3.4%, respectively. The results suggested that secondary inorganic source was the important contributor to the aerosols along the Yangtze River.
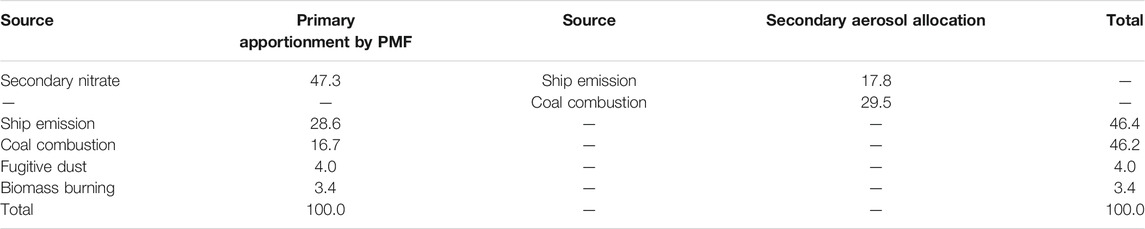
TABLE 2. The source apportionment of particles in the size range of 0.4–2.5 μm during YRC (Unit: %).
With the use of the STEAM model, ship emission and coal combustion have been confirmed as the two important sources of inorganic gaseous pollutants (SO2 and NOx) over the Yangtze River (Li et al., 2018; Weng et al., 2020). Based on the nitrogen oxide (NOx) emissions of ship and coal power plants in Jiangsu province, we further estimate the contributions of the two sources to secondary nitrate. Previous studies estimated that NOx emissions of ship and coal power plants were 192,100 and 318,000 tons, respectively (Zhang et al., 2014; MEIC, http://www.meicmodel.org/). Based on the above estimation, the contributions of the main sources to SIAs were further estimated (Table 2). The contributions of ship emission and coal combustion increased 17.8% and 29.5% compared to those of primary particles, respectively. The sum of the contribution of ship emission and coal combustion to PM2.5 was as high as 92.6%. The result indicated that ship emission and coal combustion were the main sources for the aerosol pollution along the Yangtze River, and the contribution of the gaseous precursors from ship emission and coal combustion to visibility reduction should not be ignored.
In order to better characterize air pollution over the Yangtze River, an intensive cruise campaign was conducted in the Yangtze River of the Jiangsu section from August 22 to September 6, 2019. A combination of online measurements of multiple pollutants and offline aerosol samples was used to characterize the air pollution, chemical characterization, and optical properties in this region. The mass concentrations of SO2, NO2, O3, PM2.5, PM10, and CO along the Yangtze River were 146%, 214%, 48%, 33%, 25%, and 50% larger than those of the air quality monitoring stations in adjacent cities, respectively. SNA mass concentration dominated the water-soluble inorganic species and accounted for 35.0% ± 7.3% of the total PM2.5 concentration. Compared with previous studies in urban sites, the low ratio of NO3−/SO42− was mainly due to the large SO2 emission of ship exhaust. High SO42− concentration in the droplet mode (0.56–1.0 μm) was due to the formation of sulfate through in-cloud processes under high SO2 concentration by ship emission and high RH condition along the river. Compared with internal and external mixing states, the simulated MAE values based on the core–shell mixing assumption were much closer to the measured values, indicating that core–shell mixed particles widely existed in the air of the Yangtze River. Particles in the size ranges of 0.4–2.1 μm contributed the most (90.5%) to the total light extinction, especially the light scattering effect (85.0%). Through the PMF model, we found that secondary nitrate, ship emission, coal combustion, fugitive dust, and biomass burning were the main contributors to the aerosols in the Yangtze River. The NOx from ship emission and coal combustion over the river plays an important role in aerosol extinction. The source apportionment of the major contributor to visibility degradation in this work provides scientific evidence for the control of aerosol pollution in the Yangtze River and surrounding cities.
The raw data supporting the conclusions of this article will be made available by the authors, without undue reservation.
DC: aerosol sample sampling, methodology, investigation, data analyses, and writing-original draft. MW, FC, and HL: aerosol sample sampling, investigation, and resources. LL, SX, and LZ: data analyses, project administration, and funding acquisition. MG and QZ: conceptualization, resources, and software.
For the support, we thank the National Key Research and Development Project (No. 2018YFC0213803), Jiangsu Planned Projects for Postdoctoral Daily Funds (No. 2020Z362), Jiangsu Provincial Fund on PM2.5 and O3 pollution mitigation (No. 2019023), Natural Science Foundation of the Jiangsu Higher Education Institutions (No. 19KJB180003), and the Program B for Outstanding Candidates of Nanjing University (Nos. 201702B058 and 201702B056).
The authors declare that the research was conducted in the absence of any commercial or financial relationships that could be construed as a potential conflict of interest.
All claims expressed in this article are solely those of the authors and do not necessarily represent those of their affiliated organizations, or those of the publisher, the editors, and the reviewers. Any product that may be evaluated in this article, or claim that may be made by its manufacturer, is not guaranteed or endorsed by the publisher.
The Supplementary Material for this article can be found online at: https://www.frontiersin.org/articles/10.3389/fenvs.2022.857510/full#supplementary-material
Bohren, C. F., and Huffman, D. R. (1998). Absorption and Scattering of Light by Small Particles. New York: Wiley, Inc.
Chen, D., Zhao, Y., Lyu, R., Wu, R., Dai, L., Zhao, Y., et al. (2019). Seasonal and Spatial Variations of Optical Properties of Light Absorbing Carbon and its Influencing Factors in a Typical Polluted City in Yangtze River Delta, China. Atmos. Environ. 199, 45–54. doi:10.1016/j.atmosenv.2018.11.022
Chen, D., Zhao, Y., Zhang, J., Yu, H., and Yu, X. (2020). Characterization and Source Apportionment of Aerosol Light Scattering in a Typical Polluted City in the Yangtze River Delta, China. Atmos. Chem. Phys. 20, 10193–10210. doi:10.5194/acp-20-10193-2020
Cheng, Y., and He, K.-b. (2015). Uncertainties in Observational Data on Organic Aerosol: An Annual Perspective of Sampling Artifacts in Beijing, China. Environ. Pollut. 206, 113–121. doi:10.1016/j.envpol.2015.06.012
Cheng, Y., He, K. B., Zheng, M., and Duan, F. K. (2011). Mass Absorption Efficiency of Elemental Carbon and Water-Soluble Organic Carbon in Beijing, China. Atmos. Chem. Phys. 11, 24727–24764. doi:10.5194/acp-11-11497-2011
Ding, J., Han, S., Zhang, Y., Feng, Y., Wu, J., Shi, G., et al. (2015). Chemical Characteristics of Particles and Light Extinction Effects in winter in Tianjin. Res. Environ. Sci. 28, 1353–1361. doi:10.13198/j.issn.1001-6929.2015.09.03
Ding, X., Kong, L., Du, C., Zhanzakova, A., Wang, L., Fu, H., et al. (2017). Long-range and Regional Transported Size-Resolved Atmospheric Aerosols during Summertime in Urban Shanghai. Sci. Total Environ. 583, 334–343. doi:10.1016/j.scitotenv.2017.01.073
Wang, H., An, J., Cheng, M., Shen, L., Zhu, B., Li, Y., et al. (2016). One Year Online Measurements of Water-Soluble Ions at the Industrially Polluted Town of Nanjing, China: Sources, Seasonal and Diurnal Variations. Chemosphere 148, 526–536. doi:10.1016/j.chemosphere.2016.01.066
Huang, B., Wang, M. L., Chen, Q., Wang, X. J., Bi, Y. R., Tian, Y. Z., et al. (2020). Mass Spectra Characteristics of Ship Emission and its Influence on Air Quality of Yantai City. Acta Scientiarum Naturalium Universitatis Sunyatseni 59, 98–108. doi:10.13471/j.cnki.acta.snus.2020.05.15.2020B057
Jacobson, M. Z. (2001). Strong Radiative Heating Due to the Mixing State of Black Carbon in Atmospheric Aerosols. Nature 409, 695–697. doi:10.1038/35055518
Kim, E., and Hopke, P. K. (2004). Improving Source Identification of fine Particles in a Rural Northeastern U.S. Area Utilizing Temperature-Resolved Carbon Fractions. J. Geophys. Res. 109, D09204. doi:10.1029/2003jd004199
Lan, Z.-J., Chen, D.-L., Li, X., Huang, X.-F., He, L.-Y., Deng, Y.-G., et al. (2011). Modal Characteristics of Carbonaceous Aerosol Size Distribution in an Urban Atmosphere of South China. Atmos. Res. 100, 51–60. doi:10.1016/j.atmosres.2010.12.022
Li, L., Yin, Y., Kong, S., Wen, B., Chen, K., Yuan, L., et al. (2014). Altitudinal Effect to the Size Distribution of Water Soluble Inorganic Ions in PM at Huangshan, China. Atmos. Environ. 98, 242–252. doi:10.1016/j.atmosenv.2014.08.077
Li, Z., Li, C., Ye, X., Fu, H., Wang, L., Yang, X., et al. (2018). Air Quality in the Middle and Lower Reaches of the Yangtze River Channel: A Cruise Campaign. Atmos. Chem. Phys. 18, 14445–14464. doi:10.5194/acp-18-14445-2018
Liu, J. P., Xu, K. H., Li, A. C., Milliman, J. D., Velozzi, D. M., Xiao, S. B., et al. (2007). Flux and Fate of Yangtze River Sediment Delivered to the East China Sea. Geomorphology 85, 208–224. doi:10.1016/j.geomorph.2006.03.023
Liu, S., Hu, M., Slanina, S., He, L.-Y., Niu, Y.-W., Bruegemann, E., et al. (2008). Size Distribution and Source Analysis of Ionic Compositions of Aerosols in Polluted Periods at Xinken in Pearl River Delta (PRD) of China. Atmos. Environ. 42, 6284–6295. doi:10.1016/j.atmosenv.2007.12.035
Meng, Z., Wu, L., Xu, X., Xu, W., Zhang, R., Jia, X., et al. (2020). Changes in Ammonia and its Effects on PM2.5 Chemical Property in Three winter Seasons in Beijing, China. Sci. Total Environ. 749, 142208. doi:10.1016/j.scitotenv.2020.142208
Natural Resources Defense Council (NRDC) (2014). A white Paper on the Prevention and Control of Air Pollution from China's Ships and Ports. Available at: http://www.nrdc.cn/information/informationinfo?id=91. Accessed February, 2022.
Ram, K., and Sarin, M. M. (2009). Absorption Coefficient and Site-specific Mass Absorption Efficiency of Elemental Carbon in Aerosols over Urban, Rural, and High-Altitude Sites in India. Environ. Sci. Technol. 43, 8233–8239. doi:10.1021/es9011542
Seinfeld, J. H., and Pandis, S. N. (2006). Atmospheric Chemistry and Physics: From Air Pollution to Climate Change. doi:10.1080/00139157.1999.10544295
Tan, H., Liu, L., Fan, S., Li, F., Yin, Y., Cai, M., et al. (2016). Aerosol Optical Properties and Mixing State of Black Carbon in the Pearl River Delta, China. Atmos. Environ. 131, 196–208. doi:10.1016/j.atmosenv.2016.02.003
Tian, S. L., Pan, Y. P., and Wang, Y. S. (2016). Size-resolved Source Apportionment of Particulate Matter in Urban Beijing during Haze and Non-Haze Episodes. Atmos. Chem. Phys. 15, 9405–9443. doi:10.5194/acp-15-9405-2015
U.S. Environmental Protection Agency (1998). Technical Guidance Document: Compliance Assurance Monitoring. Available at: https://www.epa.gov/sites/default/files/2016-05/documents/cam-tgd.pdf.
Wang, H. L., Zhu, B., An, J. L., Duan, Q., Zou, J. N., and Shen, L. J. (2014). Size Distribution and Characterization of OC and EC in Atmospheric Aerosols during the Asian Youth Games of Nanjing, China. Huan Jing Ke Xue 35, 3271–3279. doi:10.13227/j.hjkx.2014.09.005
Wang, J., Zhang, Y.-f., Feng, Y.-c., Zheng, X.-j., Jiao, L., Hong, S.-m., et al. (2016a). Characterization and Source Apportionment of Aerosol Light Extinction with a Coupled Model of CMB-IMPROVE in Hangzhou, Yangtze River Delta of China. Atmos. Res. 178-179, 570–579. doi:10.1016/j.atmosres.2016.05.009
Wang, J., Zhou, M., Liu, B.-s., Wu, J.-h., Peng, X., Zhang, Y.-f., et al. (2016b). Characterization and Source Apportionment of Size-Segregated Atmospheric Particulate Matter Collected at Ground Level and from the Urban Canopy in Tianjin. Environ. Pollut. 219, 982–992. doi:10.1016/j.envpol.2016.10.069
Watson, J. G., Chow, J. C., and Houck, J. E. (2001). PM2.5 Chemical Source Profiles for Vehicle Exhaust, Vegetative Burning, Geological Material, and Coal Burning in Northwestern Colorado during 1995. Chemosphere 43, 1141–1151. doi:10.1016/s0045-6535(00)00171-5
Watson, J. G., Chow, J. C., Lowenthal, D. H., Antony Chen, L.-W., Shaw, S., Edgerton, E. S., et al. (2015). PM2.5 Source Apportionment with Organic Markers in the Southeastern Aerosol Research and Characterization (SEARCH) Study. J. Air Waste Manage. Assoc. 65, 1104–1118. doi:10.1080/10962247.2015.1063551
Weingartner, E., Saathoff, H., Schnaiter, M., Streit, N., Bitnar, B., and Baltensperger, U. (2003). Absorption of Light by Soot Particles: Determination of the Absorption Coefficient by Means of Aethalometers. J. Aerosol Sci. 34, 1445–1463. doi:10.1016/s0021-8502(03)00359-8
Weng, J., Shi, K., Gan, X., Li, G., and Huang, Z. (2020). Ship Emission Estimation with High Spatial-Temporal Resolution in the Yangtze River Estuary Using AIS Data. J. Clean. Prod. 248, 119297. doi:10.1016/j.jclepro.2019.119297
Wu, Y., Liu, D., Wang, X., Li, S., Zhang, J., Qiu, H., et al. (2021). Ambient marine Shipping Emissions Determined by Vessel Operation Mode along the East China Sea. Sci. Total Environ. 769, 144713. doi:10.1016/j.scitotenv.2020.144713
Xu, X., Zhao, T., Liu, F., Gong, S. L., Kristovich, D., Lu, C., et al. (2016). Climate Modulation of the Tibetan Plateau on Haze in China. Atmos. Chem. Phys. 16, 1365–1375. doi:10.5194/acp-16-1365-2016
Yuan, S., Feng, X. J., and Zhu, Y. F. (2020). Rapid Inventory of Ship Exhaust Emissions for Inland Waterway: a Case Study in Jiangsu Section of Yangtze River. Transport Res. 6, 91–100. doi:10.16503/j.cnki.2095-9931.2020.02.011
Zhang, C., Zhou, Z. E., Zhang, D., Ren, L. H., Zhao, X. Y., Fang, W. K., et al. (2014). “A Study on the Composition Characteristics of Particulate Matter in the Exhaust Gas of Chongqing Port,” in The Annual Conference of Chinese Society of Environmental Sciences, Chengdu.
Zhang, Y.-L., Schnelle-KreisKreis, J., Abbaszade, G., Zimmermann, R., Zotter, P., Shen, R.-r., et al. (2015). Source Apportionment of Elemental Carbon in Beijing, China: Insights from Radiocarbon and Organic Marker Measurements. Environ. Sci. Technol. 49, 8408–8415. doi:10.1021/acs.est.5b01944
Zhang, W., Peng, X., Bi, X., Cheng, Y., Liang, D., Wu, J., et al. (2021). Source Apportionment of PM2.5 Using Online and Offline Measurements of Chemical Components in Tianjin, China. Atmos. Environ. 244, 117942. doi:10.1016/j.atmosenv.2020.117942
Zhao, Q. Y., Chen, F., Li, H. P., Chen, D., and Zhang, Y. (2021). Research on Air Pollution Characteristics of the Yangtze River in Jiangsu Section. Environ. Sci. Technol. 34, 50–54. doi:10.19824/j.cnki.cn32-1786/x.2021.0041
Keywords: chemical composition, size-resolved particles, light extinction, Yangtze River, source apportionment
Citation: Chen D, Zhao Q, Li L, Xia S, Chen F, Wei M, Li H, Zhang L and Guan M (2022) Shipborne Observations of Chemical Characterization and Light Extinction of Aerosol Along the Yangtze River, China. Front. Environ. Sci. 10:857510. doi: 10.3389/fenvs.2022.857510
Received: 18 January 2022; Accepted: 09 February 2022;
Published: 11 March 2022.
Edited by:
Dantong Liu, Zhejiang University, ChinaReviewed by:
Xiaotong Jiang, Zhejiang University, ChinaCopyright © 2022 Chen, Zhao, Li, Xia, Chen, Wei, Li, Zhang and Guan. This is an open-access article distributed under the terms of the Creative Commons Attribution License (CC BY). The use, distribution or reproduction in other forums is permitted, provided the original author(s) and the copyright owner(s) are credited and that the original publication in this journal is cited, in accordance with accepted academic practice. No use, distribution or reproduction is permitted which does not comply with these terms.
*Correspondence: Dong Chen, d3d3LmNoZW5kb25nOEAxNjMuY29t
Disclaimer: All claims expressed in this article are solely those of the authors and do not necessarily represent those of their affiliated organizations, or those of the publisher, the editors and the reviewers. Any product that may be evaluated in this article or claim that may be made by its manufacturer is not guaranteed or endorsed by the publisher.
Research integrity at Frontiers
Learn more about the work of our research integrity team to safeguard the quality of each article we publish.