 Xiaobo Dong
 Xiaoshen Sun2
94% of researchers rate our articles as excellent or good
Learn more about the work of our research integrity team to safeguard the quality of each article we publish.
Find out more
ORIGINAL RESEARCH article
Front. Environ. Sci., 01 April 2022
Sec. Atmosphere and Climate
Volume 10 - 2022 | https://doi.org/10.3389/fenvs.2022.855813
This article is part of the Research TopicAir Pollution Remote Sensing and the Subsequent Interactions with Ecology on Regional ScalesView all 31 articles
A two-layer stratus cloud was developed under the weather of an upper-level trough and return flow in North China. King-air 350 meteorological aircraft was designated to acquire the microphysical characteristics of this cloud. Within the lower-level warm cloud, the width of cloud particle size distribution (PSD) grew larger from the cloud top to the base. The particles in the warm cloud were developed mostly through collision–coalescence process. Supercooled liquid water (SLW) was detected abundantly in the upper layer cold cloud, which was developed under the westerly trough. In this study, the cold cloud in the upper level was targeted for AgI seeding. After seeding, the PSD of both cloud droplets and ice crystals were broadened as SLW was consumed and developed into ice crystals.
Water depletion has been an arising problem in North China and put negative effects on climate, agriculture, and air pollution (Kendy et al., 2004; Fan et al., 2012; Chen et al., 2013; Yuan and Shen, 2013). For the past decades, the Hebei Weather Modification Office has implemented abundant cloud seeding experiments to increase rainfall and snowfall, preferably into reliable ground water resources. Based on field experiments, stratiform clouds were the main rainfall sources during the spring and autumn seasons. These precipitation clouds were always connected with large-scale weather systems and consisted of several cloud (rain) bands (Zhou, 2004). Stratiform clouds have been the most targeted clouds in North China for artificial rainfall enhancement (Zhao and Lei, 2008; Guo et al., 2015).
Stratus clouds are normally categorized as warm and cold clouds. A detailed microphysical mechanism for both warm and cold clouds can be found in Flossmann et al. (2019). Warm clouds were packed with water droplets that can grow into falling precipitation particles mainly through collision–coagulation, especially when large cloud droplets already existed (Kenneth and Harry, 1993). Hu et al. (1983) investigated the precipitation mechanism of warm clouds by a one-dimension time-dependent numerical model. They pointed out that raindrop growth through randomly gravitational collision required the vertical depth of cloud to be thicker than 1 km. For cold clouds that vertically develop above the freezing level, the Wegener–Bergeron–Findeisen (WBF) process was applied, and it explained cloud particle transformation (Wegener, 1911; Bergeron, 1935; Findeisen, 1938). Precipitation can be generated through water vapor diffusion as well as the collision–coalescence and riming of ice crystals (Flossmann et al., 2019). The “seeder–feeder” mechanism was first brought up by Bergeron to explain orographic cloud seeding (Bergeron, 1960) but also laid the theoretical foundation for stratus cloud seeding. Gu (1980) proposed a conceptual model for precipitation particle formation within stratus clouds. The vertical structure of a stratiform cloud was layered into ice-phase layer, mixed layer with both ice and liquid water, and liquid water layer. In addition to the “seeder–feeder” structure, You et al. (2002) discovered a dry layer between the two-layer clouds in North China. Yang et al. (2010) simulated a stratiform precipitation in Jilin Province by a single-dimension cloud classification model. Within the frontal stratus cloud, the ice crystal layer acted as a “seeder” layer to provide ice crystals for the lower mixed layer. In their findings, ice crystals thinner than 300 µm were the most active particles, and water droplets larger than 100 µm and partially melting ice crystals were both fueled into the mixed layer. Large particles were proven to be the most competent for collision and collection of surrounding small cloud particles in the warm layer (Yang et al., 2010).
According to the WBF process (Wegener, 1911; Bergeron, 1935; Findeisen, 1938), in the mixed layer, the temperature was below zero, and ice crystals and water vapor coexisted. When saturated vapor pressure was between the value of ice and water, vapor condensed over ice crystals because the equilibrium vapor saturation pressure was lower over the icy surface than the water surface (Rauber et al., 2019). Therefore, water drops continuously evaporated until completely absent. These formed ice crystals would “compete” to capture the water drops and consume water content. Consequently, catalysts like solid carbon dioxide and silver iodide (AgI) were released into cold clouds that can either increase the concentration of aerosol particles (INP) or freeze SLW (Flossmann et al., 2019). The mass of ice increased to compensate for available water vapor and SLW, finally enhancing the precipitation probability. Researchers worldwide have put efforts into the exploration of stratus clouds by high spatial and temporal resolution airborne particle measurement system (PMS), satellite, and radar for comprehensive observations of stratified cloud structures. Geerts et al. (2010) adopted an airborne Doppler radar to detect the change of wintertime orographic clouds after AgI seeding. Intensified radar echo near the ground was observed as strong evidence for increased ground precipitation. Cai et al. (2013) compared the number of concentration variations of cloud particles and ice crystals before and after seeding along the flight trajectory. They concluded that clouds with higher SLW content were confirmed to be more affected by the seeding. AgI acted as ice-nucleating agents for glaciogenic seeding, and heterogeneous ice nucleation was mainly though immersion freezing, condensation freezing, and contact freezing (Marcolli et al., 2016). AgI agents were released into the SLW layer to accelerate these water droplets to participate in ice nucleation and ice crystal growth. As ice crystals were falling, they continually grew into large precipitation particles through the process of riming (Dong et al., 2021), aggregation (Breed et al., 2014), or collision–coalesce (Dong et al., 2020).
Cloud seeding projects have been carried out for mountainous snowfall like Wyoming Weather Modification Pilot Project (WWMPP, Breed et al., 2014) and Seeded and Natural Orographic Wintertime Clouds: The Idaho Experiment (SNOWIE, French et al., 2018). When evaluating and quantifying cloud seeding, ground radar was one of the most obvious approaches to evaluate and confirm airborne AgI seeding (Rauber et al., 2019; Friedrich et al., 2020; Wang et al., 2021). Recent attempts on evaluating the cloud seeding included coherent Doppler wind lidar (Yuan et al., 2021), satellite, weather radar, and disdrometer (Wang et al., 2021) and Weather Research and Forecasting model (Liu et al., 2021). Similar to orographic cloud seeding, stratus cloud seeding shall also follow the hypothesis from Rauber et al. (2019). The timing and the location to release artificial INP were the key to perform an effective cloud seeding. However, synoptic weather background shall not be neglected when performing the cloud seeding. Even though the aircraft was mobile and would easily locate the optimal microphysical condition inside the cloud, airborne AgI seeding still required verification from abundant field experiments.
In this study, we conducted a cloud seeding experiment together with cloud detection to a two-layer stratus cloud. The vertical structure of both warm and cold cloud was explored, and the microphysical response of cloud seeding was analyzed.
Data and process methods are described in “Data and Methods”, followed by synoptic weather in “Synoptic Weather Analysis”. The sections “Analysis and Results” and “Conclusion” show the details of the result analysis and conclusion.
We carried out an airborne seeding experiment after the vertical detection to the clouds on May 15, 2021 over Shijiazhuang, Hebei Province (Figure 1). Airborne AgI was released into the cloud for potential rainfall enhancement. Theoretically, a single seeding agent contains 27 g AgI. The mean size of AgI is 0.1 µm (Flossmann et al., 2019). The same approach can be found in previous studies (Dong et al., 2020; Dong et al., 2021). The cloud seeding experiment lasted from 12:02 to 14:32 UTC (20:02–22:32 in local time, UTC time as follows) over Luancheng District of Shijiazhuang.
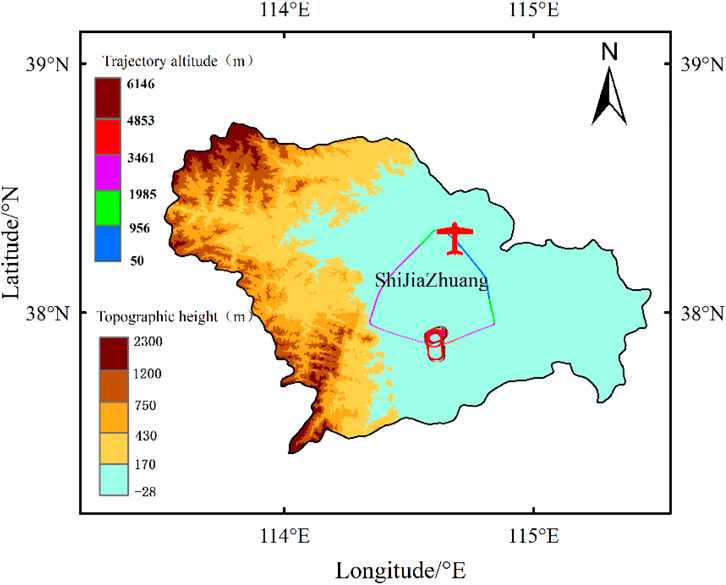
FIGURE 1. The altitudinal terrain and flight trajectory in the experiment zone on May 15, 2021.
The terrain altitude and aircraft trajectory above the seeding targeted region is shown in Figure 1. The research plane took off from Zhengding Airport at 12:09 and flew southward at 2,400 m towards the target location. In the experiment zone, the aircraft first spiraled upwards from 900 to 6,000 m with a radius of 5 km to acquire the vertical profile of the stratiform cloud. SLW was detected at the height of 5,200 m, and afterwards seeding agents were released into the clouds at this altitude. The flight flew elliptically with a longitudinal and latitudinal trajectory of 6 and 15 km. In total, 18 AgI agents were released during the experiment, and each 6-AgI agent was ignited at 13:23, 13:29, and 13:36. After seeding, the plane continued circling throughout the clouds at 5,200 m for further detection of catalyzed physical response.
The “King Air” 350 research aircraft, belonging to the Hebei Weather Modification Center, was outfitted for cloud detection and cloud seeding. Details on airborne instruments and related parameters are listed in Table 1. The PMS was mounted on this research aircraft as well as aircraft integrated meteorological measurement system (AIMMS-20) with 20-Hz detection frequency, remote temperature probe, Nevzorov hotwire probe, and global positioning system. The PMS consists of three particle size detectors, including a fast cloud droplet probe (FCDP), cloud imager probe (CIP), cloud particle imager (CPI), and high-volume precipitation spectrometer (HVPS). FCDP can measure cloud particles ranging from 2 to 50 µm in diameter with an uncertainty of 20% (Lance et al., 2010; Faber et al., 2018). The CIP detects both cloud droplets and ice crystals from 25 to 1,500 µm (Lawson, 2011). The HVPS probe can detect even larger ice crystals and raindrops, covering the range of 150–19,200 µm. The CPI imager can capture images of cloud particles, water droplets, and ice crystals. Nevzorov hotwire can provide both liquid water content (LWC) and total water content (TWC) data with 15% inaccuracy (King et al., 1978). All probes were checked and calibrated before cloud detection and cloud seeding.
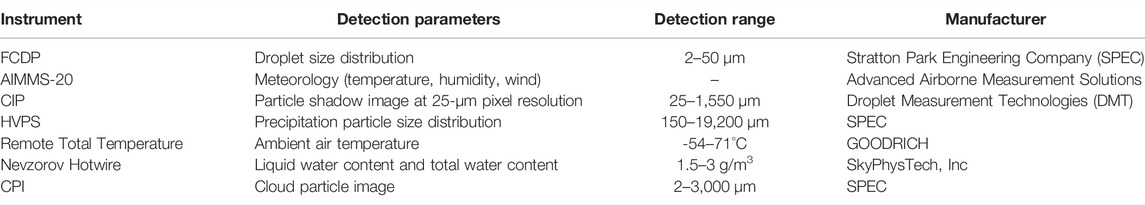
TABLE 1. Detailed instruments and related parameters during the seeding experiment.
As recommended by previous studies (Yang et al., 2019; Zhao et al., 2019), the last size bin of FCDP and the first three bins of CIP are all excluded due to large uncertainties. PSD was retrieved from original FCDP data from 2 to 50 µm. For large particles, the size bins were chosen between 100 and 1,500 µm for the CIP probe, where small cloud particles were excluded. The particle diameter range within 150–19,200 µm was set for the HVPS probe. We followed with a previous method to differ ice crystals and cloud droplets (Dong et al., 2020; Dong et al., 2021). A 100-µm threshold is introduced such that particles in cold clouds larger than 100 will be defined as ice crystals; otherwise, they are cloud droplets. The time interval for each airborne prober data is 1 s.
The effective radius re and number concentration Nd of cloud particles are calculated based on the cloud PSD as follows:
where n(r) denotes the cloud PSD, and Nci and ri correspondingly represent the number concentration and mean diameter of cloud droplets at the i-th size bin. The merged cloud particle spectrum is therefore derived from FCDP, CIP, and HVPS prober data, covering the whole size range of both droplets and ice crystals.
According to daytime weather analysis and observations (Figure 2), wide-range, stable, low clouds were developed in the southern part of Hebei Province. The low clouds were below 4 km and consecutively brought warm cloud precipitation under the influence of east wind and warm shear at 700 hPa. Meanwhile, no high cloud was observed over the experiment area due to the influence of a weak ridge. Near dawn, the aircraft observed clouds around 500 hPa under the influence of an upper trough (Figure 3).
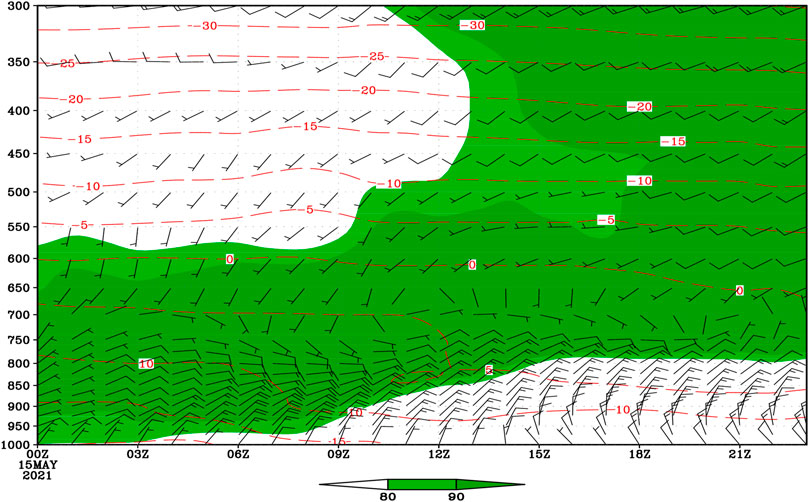
FIGURE 2. The temporal variation of relative humidity (contour), temperature (dotted line), and wind on May 15, 2021 in Luancheng District of Shijiazhuang.
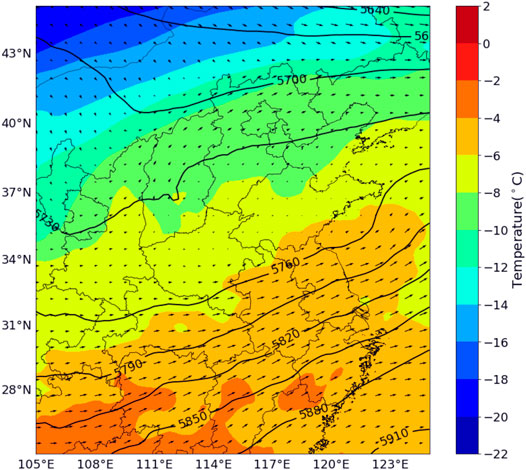
FIGURE 3. Geopotential height (black contour line, units: pm), temperature (shaded, unit: °C), and wind field (arrows) at 500 hPa 12:00 on May 15, 2021.
HYSPLIT model was employed to calculate the estimated trajectory of cloud air mass 24 h prior to the experiment zone on May 15, 2021 (Figure 4). A return flow was notable at 3,572 m, and at 5472 m an air mass approached from the southwest. Aircraft detection was in the beginning period of a high-level trough and the last stage of a return flow. Under the interactive impact of two cloud masses, the stratus cloud was layered with low-level warm clouds and high-level cold clouds.
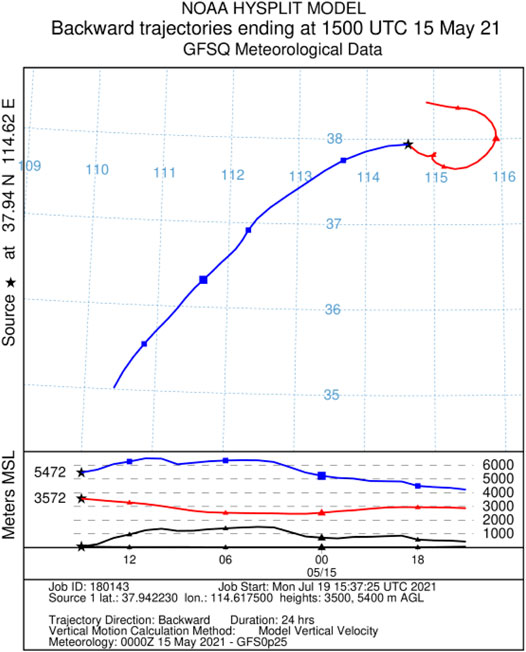
FIGURE 4. The 24-h backward trajectory of cloud mass in the experiment zone simulated from the HYSPLIT model starting from 15:00 May 15, 2021 (black star). The red and the blue lines represent the trajectory of warm and cold cloud mass at 3,572 and 5,472 m, respectively.
The vertical profiles of temperature (temperature probe), liquid water content (Nevzorov), and cloud particle number concentration (FCDP, CIP, and HVPS) are shown in Figure 5. The research aircraft spiraled upwards from 900 to 6,000 m, with a cycling radius of 5 km. During the climbing, the temperature dropped from 9°C (900 m) to −9.7°C (6,000 m), and 0°C was recorded at 4,262 m. Entirely 3 thermal inversion layers were detected, including 1,100–1,200 m, 3,100–3,500 m, and near 5,400 m.
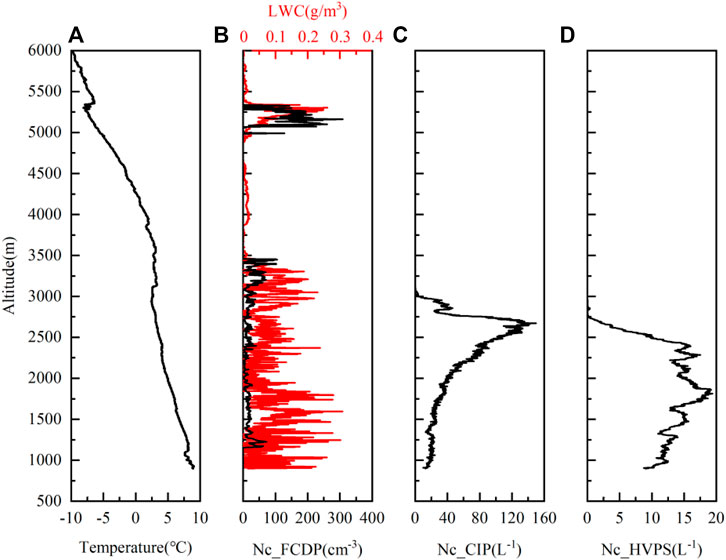
FIGURE 5. The vertical distribution of (A) atmosphere temperature, (B) cloud particle number concentration measured by fast cloud droplet probe and liquid water content measured by Nevzorov, (C) cloud particles larger than 100 µm number concentration measured by cloud imager probe, and (D) cloud particle number concentration measured by a high-volume precipitation spectrometer.
To define cloud boundaries, we required the FCDP number concentration to be greater than 10 cm−3 to be considered “in-cloud”. From the FCDP probe, the vertical distribution of cloud particle number concentration was notably divided into two layers, roughly representing the two-layer cloud. The lower layer was defined as the warm cloud, spread from 1,100 to 3,500 m. In this layer, the cloud particle number concentration reached a maximum of 105.9 cm−3 according to the FCDP probe (small cloud particles), while the temperature varied from 2.9 to 8.2°C. The other layer was a cold cloud located at an altitude of 5,100–5,300 m, and the largest cloud particle number concentration was 309.3 cm−3, with temperature ranging from −6 to −7.5°C. The highest liquid water content in the warm and cold layer was 0.308 and 0.26 g/m3 at 1,596 and 5,250 m, respectively. Supercooled water droplets existed in the upper-level cold cloud. Particles larger than 100 µm are captured by the CIP probe, and the highest number concentration is 149.86 L−1 at 2,671 m in the warm layer but only 0.2 L−1 in the cold layer. For even larger particles, within the warm clouds, the number concentration measured by the HVPS probe is 19.4 L−1 at 1,811 m but less than 0.2 L−1 in the cold layer. From these observations, cloud droplets and raindrops were mostly found in low-level warm layers, while supercooled water droplets were in high-level cold clouds. However, in the high-level cloud, ice crystals were scarce, and cloud seeding was logically favorable.
Near the top of warm cloud (around 3,500 m), cloud particles were only detected by the FCDP probe, and the highest concentration of cloud particle was 100 cm−3, while both CIP and HVPS detected almost nothing. At the top of warm cloud, only cloud droplets smaller than 50 µm existed according to the FCDP probe. The LWC content was also less than 0.1 g/m3. Below 3,000 m, the cloud particle number concentration was reduced for the FCDP probe but increased for both the CIP and HVPS probes. The CIP and HVPS probes can both detect cloud particles larger than 100 µm, and the highest number concentration reached was at 2,700 and 1,800 m, respectively. Meanwhile, the LWC content increased. This indicated the growth of small cloud droplets into large droplets through collision–coalescence. Near the warm cloud base, the small cloud droplets detected by FCDP increased, and the large cloud droplets or raindrop number concentration detected by CIP and HVPS appeared to follow a decreasing trend due to the break-up and evaporation of large droplets. Afterwards the large droplets grew into raindrops, which would fall outside the cloud. The decrease of the number concentration of CIP and HVPS was also possibly from the larger velocity of raindrops.
The cloud PSD in the lower warm cloud was retrieved from the FCDP, CIP, and HVPS probes (Figure 6). The PSD combined with temperatures and CPI images is shown in Figure 6. The cloud top reached up to 3,456 m, with a temperature of 2.8°C. The particle spectrum was narrow, and the particle size ranged from 3 to 27 μm, where the peak size was 10 µm. Near the cloud top, only cloud droplets were observed. In order from the cloud top towards the base, the diameters of the cloud droplets at the highest number concentration with corresponding temperature are listed as follows: 21 µm (temperature 3–5°C), 24 µm (5–6°C), 27 µm (6–7°C), and 16 µm (1,158 m at cloud base, 8.2°C). The maximum diameters for raindrops with corresponding temperature were 1,050 µm (temperature 3–4°C), 1,350 µm (4–5°C), 2,100 µm (5–7°C), and 2,250 µm (cloud base, 8.2°C).
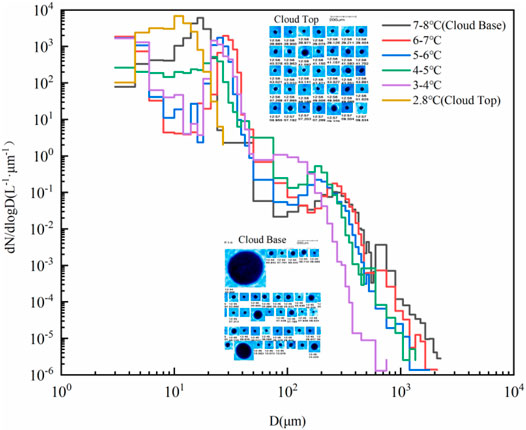
FIGURE 6. Cloud particle size distribution and cloud particle images in the warm layer from 1,158 to 3,456 m. The colored lines represent cloud particle distribution under different temperatures.
In the warm cloud, the cloud particle spectrum spanned wider from the cloud top to the base as the temperature rose higher. While falling, these cloud droplets enlarged through collision–coalescence. The CPI probe captured both small and large cloud droplets near the cloud base. As shown in Figure 6, raindrops larger than 200 µm only existed in the cloud base, while in the top cloud the droplets were less than 100 µm. The broadening of the large-particle spectrum indicated the growth of large droplets into raindrops. This could explain why the HVPS concentration gradually dropped near the cloud base. Subject to entrainment and evaporation (Yamaguchi and Randall, 2008), the diameter of cloud droplets was comparatively smaller near the cloud top than the cloud base.
At an altitude of 5,200 m, the aircraft flew several loops for cloud seeding experiments and in situ cloud microphysical detection. The elliptical flight trajectory was 15-km south–north long and 6-km east–west wide. A single whole circuit took approximately 5 min. Figure 7 demonstrates the real-time track of a research aircraft during seeding, overlaid with cloud particle concentration detected by FCDP. At this altitude, the horizontal wind speed and the wind direction were 4.8 m/s and 210° as the average temperature was −6.9°C. As shown in Figure 7, the cloud particle concentration that was less than 10 cm−3 (black dots) indicated that the aircraft was outside of the cloud. The airborne seeding was counter-clockwise from A to B.
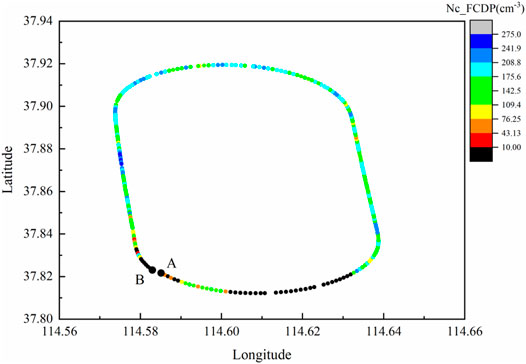
FIGURE 7. The flight trajectory at 5,200 m for the cloud seeding with cloud particle number concentration retrieved from fast cloud droplet probe. Black marks denote that the aircraft was outside the cloud.
Figure 8 illustrates the temporal variation of cloud particle number concentration, LWC, and TWC before and after the cloud seeding. In total, 18 AgI seeding agents were activated at 13:23, 13:29, and 13:36, with 6 agents at each time. Each AgI agent was estimated for a life of 5 min. During the airborne seeding, from 13:23 to 13:27, no change was detected, and the number concentration of cloud particles remained unchanged. This is because the seeding agent was just released into the cloud, and the cloud droplets were not responsive yet. The average number concentration and LWC content were 167 cm−3 and 0.124 g/m3, and the maximum values were 274.79 cm−3 and 0.211 g/m3. The change of LWC content was almost consistent with the FCDP concentration. The zero value of FCDP concentration and LWC content indicated that the aircraft was outside the cloud. After seeding, the number concentration of cloud droplets dropped dramatically at times 13:31, 13:36, 13:40, and 13:45. Meanwhile, ice crystals measured by CIP and HVPS both increased notably from 0 L−1 before the seeding into 332.53 L−1 (13:45:01) and 56.25 L−1 (13:44:59) after seeding. The increase of both CIP and HVPS concentration was evident when the FCDP concentration was depleted. At the same time, the amount of liquid water was reduced, while the ice water content was augmented with the highest value of 0.21 g/m3. This proved that the seeding was activated inside the cloud.
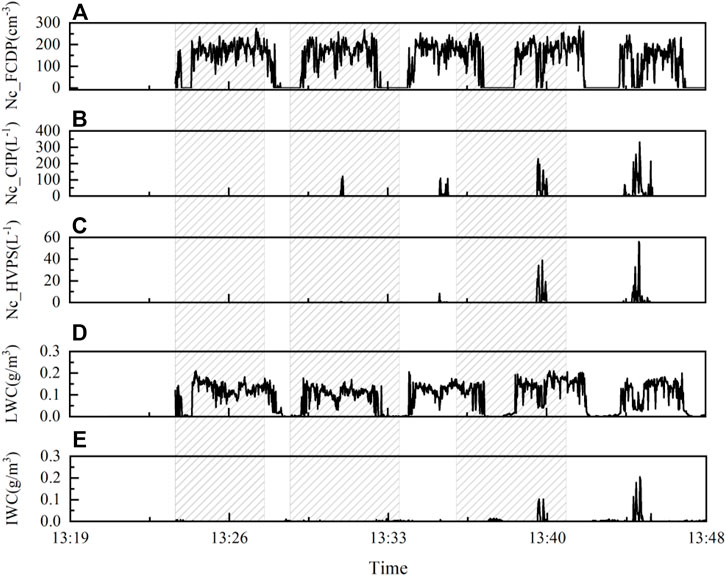
FIGURE 8. The temporal change of cloud particle number concentration measured by fast cloud droplet probe, cloud imager probe, and high-volume precipitation spectrometer as well as liquid water content and ice water content measured by Nevzrov hotwire, where the seeding periods were marked as shaded areas.
Figure 9 shows the cloud PSD and particle images before (13:09) and after (13:44) the seeding experiment within the seeded plume. The CPI probe captured spherical drops before the seeding, indicating the existence of SLW. After seeding, the column shape and the aggregates of ice crystals were photographed. As mentioned, FCDP measured small cloud particles (droplets), while CIP and HVPS detected ice crystals (Figure 8). The cloud particle spectrum width from FCDP enlarged from 27 to 46 µm after seeding. The cloud PSD exhibited a single peak distribution both before and after seeding. The number concentration peaked at 10 and 14 µm before and after seeding, respectively. After seeding, the cloud particle number concentration decreased in the areas affected by the seeding material. Remarkably, more ice crystals (>100 µm) were detected within the stratus cloud. The spectrum of ice crystals widened as the maximum diameter measured by the CIP probe increased from 100 to 625 µm. The same results were concluded from HVPS; the maximum diameter was enlarged from 300 to 1,500 µm.
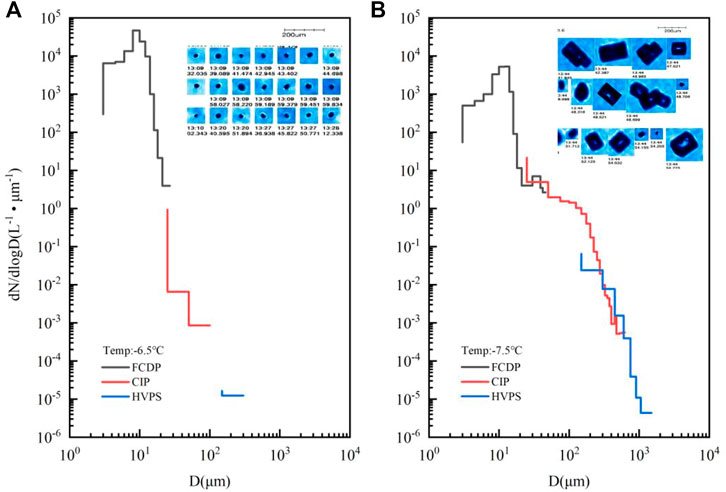
FIGURE 9. The cloud particle spectrum and particle images before [(A), 13:09] and after seeding [(B), 13:44]. The black line denotes cloud particle measured by fast cloud droplet probe, the red line denotes ice crystals measured by cloud imager probe, and the blue line denotes ice crystals measured by HVPS. The particle images captured by the cloud particle imager are shown on the upper right side of the figure.
For detection of falling ice crystals after seeding, the plane flew at 4,700 m (−4.2°C) during 14:00–14:08 following the same longitude and latitude trajectory as at 5,200 m. Consistent with the previous vertical profile, the number concentration of cloud particles measured by the FCDP probe was lower than 0.4 cm−3, indicating that the plane was in a dry sub-cloud middle layer (Figure 10). However, CIP and HVPS both recorded ice crystals larger than 100 µm, with a maximum value of 71.04 and 13.47 L−1 correspondingly. The LWC content was less than 0.01 g/m3, while the highest IWC content was merely 0.075 g/m3. This was largely resulting from the change of cloud particles. The particle images showed that most ice crystals were aggregated ice crystals.
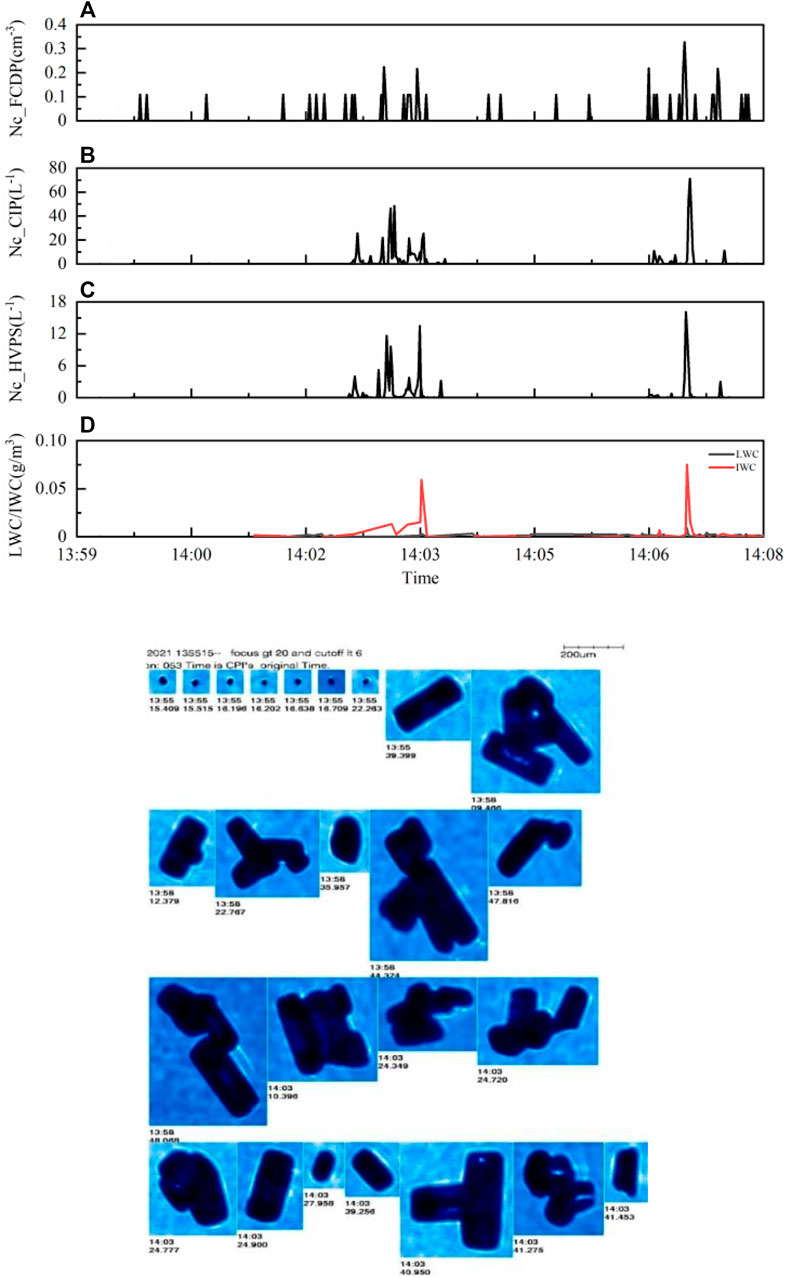
FIGURE 10. The temporal change of cloud particle number concentration measured by fast cloud droplet probe (A), cloud imager probe (B), high-volume precipitation spectrometer (C), and liquid water content and ice water content (D) measured by Nevzorov hotwire and particle images (below) at 4,700 m.
At around 14:11, the plane descended at 4,500 m with no detection of cloud particles and ice crystals. A dry layer was therefore defined between the lower warm cloud and upper cold cloud. Due to the dry layer that was too thick, the ice crystals detected above 4,500 m sublimated before reaching the lower cloud. Therefore, the seeding experiment targeting the upper layer with abundant SLW was not effective as the aggregated ice crystals were not able to fall into the lower warm cloud.
A two-layer stratus cloud was developed under the weather of an upper-level trough and return flow on May 15, 2021. The vertical characteristics of the cloud was well investigated with airborne observation equipment. A cloud seeding experiment targeting the SLW within the upper-layer cold cloud was carried out. Both before and after seeding, the microphysical characteristics of the two-layer cloud were analyzed, and the related microphysical response of cloud seeding was concluded as follows:
1) A two-layer cloud structure was formed under the influence of an upper-level trough and return flow, where warm clouds were in the low level and cold clouds were above. Within the low-level warm clouds, the particle spectrum expanded wider from the cloud top to the base. The upper cold cloud was detected with abundant SLW but with few ice crystals.
2) In the warm cloud, the cloud particles were relatively smaller near the cloud top due to entrainment and evaporation. The small cloud particles grew into large droplets and further into raindrops through collision–coalescence during falling. Near the warm cloud base, the small cloud droplets increased, and the concentration of CIP and HVPS appeared to follow a decreasing trend due to the break-up and evaporation.
3) Artificial nuclei (AgI agents) were released into cold clouds with SLW, and liquid droplets were vastly consumed and formed into large ice crystals. The CPI imager captured pristine columns and aggregated ice crystals. The spectrum of both cloud particles and ice crystals broadened, therefore proving the evidence for the microphysical response of cloud seeding.
The raw data supporting the conclusions of this article will be made available by the authors without undue reservation.
XD was the main contributor. XS contributed to writing and translation. FY contributed to data analysis and description. JZ contributed to weather analysis. SW contributed to data analysis. MP and HZ were in charge of the graphics.
This work was supported by the S & T Program of Hebei (20375042D) and Hebei Meteorological Service Scientific Research and Development Project (20ky28).
The authors declare that the research was conducted in the absence of any commercial or financial relationships that could be construed as a potential conflict of interest.
All claims expressed in this article are solely those of the authors and do not necessarily represent those of their affiliated organizations or those of the publisher, the editors, and the reviewers. Any product that may be evaluated in this article or claim that may be made by its manufacturer is not guaranteed or endorsed by the publisher.
Bergeron, T. (1935). “On the Physics of Cloud and Precipitation,” in Proceedings of Fifth Assembly UGGI (Lisbon, Portugal: Union Géodésique et Géophysique Internationale), 156–178.
Bergeron, T. (1960). “Problems and Methods of Rainfall Investigation, Address of the Honorary Chairman of the Conference,” in Physics of Precipitation (Massachusetts, United States: American Geophysical Union), 5, 152–157. Geophysical Monogram.
Breed, D., Rasmussen, R., Weeks, C., Boe, B., and Deshler, T. (2014). Evaluating winter Orographic Cloud Seeding: Design of the Wyoming Weather Modification Pilot Project (WWMPP). J. Appl. Meteorol. Climatol. 53 (2), 282–299. doi:10.1175/JAMC-D-13-0128.1
Cai, Z. X., Zhou, Y. Q., and Cai, M. (2013). Analysis on Comprehensive Observation of Artificial Precipitation Enhancement Operation for a Convective-Stratiform Mixed Cloud. Plateau Meteorol. 32 (5), 1460–1469. (In Chinese). doi:10.7522/j.issn.1000-0534.2012.00115
Chen, C., Baethgen, W. E., and Robertson, A. (2013). Contributions of Individual Variation in Temperature, Solar Radiation and Precipitation to Crop Yield in the North China Plain, 1961–2003. Climatic Change 116 (3), 767–788. doi:10.1007/s10584-012-0509-2
Dong, X. B., Zhao, C. F., Yang, Y., Wang, Y., Sun, Y., and Fan, R. (2020). Distinct Change of Supercooled Liquid Cloud Properties by Aerosols from an Aircraft-Based Seeding experiment. Earth Space Sci. 7 (8), e2020EA001196. doi:10.1029/2020EA001196
Dong, X. B., Zhao, C. F., Huang, Z. C., Mai, R., Lv, F., Xue, X. W., et al. (2021). Increase of Precipitation by Cloud Seeding Observed from a Case Study in November 2020 over Shijiazhuang, China. Atmos. Res. 262 (5), 105766. doi:10.1016/j.atmosres.2021.105766
Faber, S., French, J. R., and Jackson, R. (2018). Laboratory and In-Flight Evaluation of Measurement Uncertainties from a Commercial Cloud Droplet Probe (CDP). Atmos. Meas. Tech. 11 (6), 3645–3659. doi:10.5194/amt-11-3645-2018
Fan, L., Lu, C., Yang, B., and Chen, Z. (2012). Long-term Trends of Precipitation in the North China Plain. J. Geogr. Sci. 22 (6), 989–1001. doi:10.1007/s11442-012-0978-2
Findeisen, W. (1938). Die kolloidmeteorologischen Vorgänge bei der Niederschlagsbildung (Colloidal meteorological processes in the formation of precipitation). Meteorol. Z. 55, 121–133. doi:10.1127/metz/2015/0675
Flossmann, A. I., Manton, M., Abshaev, A., Bruintjes, R., Murakami, M., Prabhakaran, T., et al. (2019). Review of Advances in Precipitation Enhancement Research. Bull. Am. Meteorol. Soc. 100 (8), 1465–1480. doi:10.1175/BAMS-D-18-0160.1
French, J. R., Friedrich, K., Tessendorf, S. A., Rauber, R. M., Geerts, B., Rasmussen, R. M., et al. (2018). Precipitation Formation from Orographic Cloud Seeding. Proc. Natl. Acad. Sci. USA 115 (6), 1168–1173. doi:10.1073/pnas.1716995115
Friedrich, K., Ikeda, K., Tessendorf, S. A., French, J. R., Rauber, R. M., Geerts, B., et al. (2020). Quantifying Snowfall from Orographic Cloud Seeding. Proc. Natl. Acad. Sci. USA 117 (10), 5190–5195. doi:10.1073/pnas.1917204117
Geerts, B., Miao, Q., Yang, Y., Rasmussen, R., and Breed, D. (2010). An Airborne Profiling Radar Study of the Impact of Glaciogenic Cloud Seeding on Snowfall from winter Orographic Clouds. J. Atmos. Sci. 67 (10), 3286–3302. doi:10.1175/2010JAS3496.1
Gu, Z. C. (1980). Base of Cloud and Mist Precipitation Physics. Beijing: Science Press, 173–179. (In Chinese).
Guo, X. L., Fu, D. H., Li, X. Y., Hu, Z. X., Lei, H. C., Xiao, H., et al. (2015). Advances in Cloud Physics and Weather Modification in China. Adv. Atmos. Sci. 32, 230–249. doi:10.1007/s00376-014-0006-9
Hu, Z. J., Qin, Y., and Wang, Y. B. (1983). An Numerical Model of the Cold Stratified Clouds. Acta Meteorol. Sin. 41 (2), 194–202. (In Chinese). doi:10.11676/qxxb1983.021
Kendy, E., Zhang, Y., Liu, C., Wang, J., and Steenhuis, T. (2004). Groundwater Recharge from Irrigated Cropland in the North China Plain: Case Study of Luancheng County, Hebei Province, 1949-2000. Hydrol. Process. 18 (12), 2289–2302. doi:10.1002/hyp.5529
Kenneth, V. B., and Harry, T. O. (1993). Warm-Rain Initiation: An Overview of Microphysical Mechanisms. J. Appl. Meteorol. 32 (4), 608–625. doi:10.1175/1520-0450(1993)032<0608:WRIAOO>2.0.CO;2
King, W. D., Parkin, D. A., and Handsworth, R. J. (1978). A Hot-Wire Liquid Water Device Having Fully Calculable Response Characteristics. J. Appl. Meteorol. 17 (12), 1809–1813. doi:10.1175/1520-0450(1978)017<1809:ahwlwd>2.0.co;2
Lance, S., Brock, C. A., Rogers, D., and Gordon, J. A. (2010). Water Droplet Calibration of the Cloud Droplet Probe (CDP) and In-Flight Performance in Liquid, Ice and Mixed-phase Clouds during ARCPAC. Atmos. Meas. Tech. 3 (6), 1683–1706. doi:10.5194/amt-3-1683-2010
Lawson, R. P. (2011). Effects of Ice Particles Shattering on the 2D-S Probe. Atmos. Meas. Tech. 4 (7), 1361–1381. doi:10.5194/amt-4-1361-2011
Liu, W. G., Tao, Y., Zhou, Y. Q., Dang, J., Tan, C., and Gao, Y. (2021). Simulation of Stratiform Cloud Seeding, its Rainfall Enhancement Effect and Mechanism Study Based on a Real Trajectory of Aircraft. Acta Meteorol. Sin. 79 (2), 340–358. (In Chinese). doi:10.11676/qxxb2021.011
Marcolli, C., Nagare, B., Welti, A., and Lohmann, U. (2016). Ice Nucleation Efficiency of AgI: Review and New Insights. Atmos. Chem. Phys. 16 (14), 8915–8937. doi:10.5194/acp-16-8915-2016
Rauber, R. M., Geerts, B., Xue, L., French, J., Friedrich, K., Rasmussen, R. M., et al. (2019). Wintertime Orographic Cloud Seeding-A Review. J. Appl. Meteorol. Climatol. 58 (10), 2117–2140. doi:10.1175/JAMC-D-18-0341.1
Wang, J., Yue, Z., Rosenfeld, D., Zhang, L., Zhu, Y., Dai, J., et al. (2021). The Evolution of an AgI Cloud-Seeding Track in Central China as Seen by a Combination of Radar, Satellite, and Disdrometer Observations. J. Geophys. Res. Atmos. 126 (11), e2020JD033914. doi:10.1029/2020JD033914
Wegener, A. (1911). Thermodynamik der Atmosphäre (Thermodynamics of the Atmosphere). Leipzig: J. A. Barth, 331.
Yamaguchi, T., and Randall, D. A. (2008). Large-eddy Simulation of Evaporatively Driven Entrainment in Cloud-Topped Mixed Layers. J. Atmos. Sci. 65 (5), 1481–1504. doi:10.1175/2007JAS2438.1
Yang, J. F., Lei, H. C., and Hu, Z. X. (2010). Simulation of the Stratiform Cloud Precipitation Microphysical Mechanism with the Numerical Model. Chin. J. Atmos. Sci. 34 (2), 275–289. (In Chinese). doi:10.3878/j.issn.1006-9895.2010.02.04
Yang, Y., Zhao, C. F., Dong, X. B., Fan, G. C., Zhou, Y. Q., Wang, Y., et al. (2019). Toward Understanding the Process-Level Impacts of Aerosols on Microphysical Properties of Shallow Cumulus Cloud Using Aircraft Observations. Atmos. Res. 221, 27–33. doi:10.1016/j.atmosres.2019.01.027
You, L. G., Ma, P. M., and Hu, Z. J. (2002). Researches on Precipitation Enhancement of Strati Form Cloud in Northern China. Sci. Meteorol. Sin. 30, 19–56. (In Chinese).
Yuan, Z., and Shen, Y. (2013). Estimation of Agricultural Water Consumption from Meteorological and Yield Data: a Case Study of Hebei, North China. PloS one 8 (3), e58685. doi:10.1371/journal.pone.0058685
Yuan, J., Wu, K., Wei, T., Wang, L., Shu, Z., Yang, Y., et al. (2021). Cloud Seeding Evidenced by Coherent Doppler Wind Lidar. Remote Sensing 13 (19), 3815. doi:10.3390/rs13193815
Zhao, Z., and Lei, H. C. (2008). A Numerical Simulation of Cloud Physical Structure and Microphysical Processes Associated with Stratiform Precipitation in Northwest China. Chin. J. Atmos. Sci. 32 (2), 323. (In Chinese). doi:10.3878/j.issn.1006-9895.2008.02.11
Zhao, C. F., Zhao, L. J., and Dong, X. B. (2019). A Case Study of Stratus Cloud Properties Using In Situ Aircraft Observations over Huanghua, China. Atmosphere 10 (1), 19. doi:10.3390/atmos10010019
Keywords: supercooled liquid water, aircraft observation, cloud seeding, stratus cloud, precipitation
Citation: Dong X, Sun X, Yan F, Zhang J, Wang S, Peng M and Zhu H (2022) Aircraft Observation of a Two-Layer Cloud and the Analysis of Cold Cloud Seeding Effect. Front. Environ. Sci. 10:855813. doi: 10.3389/fenvs.2022.855813
Received: 16 January 2022; Accepted: 15 February 2022;
Published: 01 April 2022.
Edited by:
Honglei Wang, Nanjing University of Information Science and Technology, ChinaReviewed by:
Liang Yuan, Chengdu University of Information Technology, ChinaCopyright © 2022 Dong, Sun, Yan, Zhang, Wang, Peng and Zhu. This is an open-access article distributed under the terms of the Creative Commons Attribution License (CC BY). The use, distribution or reproduction in other forums is permitted, provided the original author(s) and the copyright owner(s) are credited and that the original publication in this journal is cited, in accordance with accepted academic practice. No use, distribution or reproduction is permitted which does not comply with these terms.
*Correspondence: Fei Yan, eWFuZmVpXzExQDEyNi5jb20=
Disclaimer: All claims expressed in this article are solely those of the authors and do not necessarily represent those of their affiliated organizations, or those of the publisher, the editors and the reviewers. Any product that may be evaluated in this article or claim that may be made by its manufacturer is not guaranteed or endorsed by the publisher.
Research integrity at Frontiers
Learn more about the work of our research integrity team to safeguard the quality of each article we publish.