 Mingwei Liu1
 Liqin Zeng
94% of researchers rate our articles as excellent or good
Learn more about the work of our research integrity team to safeguard the quality of each article we publish.
Find out more
ORIGINAL RESEARCH article
Front. Environ. Sci., 10 March 2022
Sec. Freshwater Science
Volume 10 - 2022 | https://doi.org/10.3389/fenvs.2022.855334
This article is part of the Research TopicThe Urban Fluvial and Hydro-Environment SystemView all 21 articles
The dynamic characteristics of the flow around the pile directly determine the distribution law of the force of the flow on the pile, which is the basis of the calculation of the flow load of the hydraulic structure. At present, the model test and numerical simulation methods are mainly used to study the flow characteristics around the pile. There are problems of model scale effect and test accuracy in the laboratory model test, and inherent problems in the numerical simulation method, such as the determination of medium parameters, mesh division, and boundary conditions. Therefore, the research results cannot reflect the actual situation of the interaction between water flow and pile. This paper developed a field test system for measuring the hydrodynamic pressures on surface of piles which are the vital foundations of wharves under superhigh Reynolds number. And the analysis methods of in-situ data, which can realize the multifunction including calibration and transformation for test data, frequency and time-domain statistical analysis process, were put forward according to the theory of stationary random process and mathematical statistics method. A representative frame wharf located in the upper reaches of the Yangtze River was performed as a case study, and the developed system was utilized to operate the in-situ test on this practice. Application showed that the field test system and the analysis methods can be applied to obtain the more accurate distribution of the pile surface hydrodynamic pressure. And the drag coefficient in wharf field ranged from 0.30 to 0.40. These findings in this paper may provide significant technical support for the in-situ test in similar structures and some reference for drag force calculation of flow around pile in the engineering design.
The hydrodynamic characteristics of flow around single pile and group of piles directly determine the distribution of fluid force along piles, which presents the significant foundations for the water flow load evaluation on frame-type wharf structures. Currently, the physical model experiments and the numerical simulations are mainly adopted for research on characteristics of the flow around pile. Yang et al. (2020) studied the flow field distribution around square columns with different pile length/pile diameter ratios through experiments. Wang et al. (2019) obtained the hydrodynamic coefficients of each section of the pile under the action of isolated waves through laboratory model tests. Tian et al. (2019) studied the influencing factors of hydrodynamic coefficient of jackup platform in wave flume. Han et al. (2018) studied the hydrodynamic characteristics of an inclined slender flexible cylinder under vortex-induced vibration by using a towing tank experiment. Lin K et al. (2020) obtained the dynamic response and hydrodynamic coefficient of the transverse flow oscillation cylinder with upstream wake interference by using the forced vibration test. Yang et al. (2021) used PIV technology to conduct experiments on the flow field around a multi-cylinder pile group and obtained the isoline map of the time-averaged velocity component, turbulence intensity, and Reynolds shear stress in the clearance area between piles. Ning et al. (2016) studied the hydrodynamic performance of the pile constrained WEC type floating breakwater and found that the parameters such as wave period, wave height, system size, and excitation current had significant influences on the hydrodynamic performance of the system. Wang et al. (2018) proposed a three-dimensional incompressible smooth particle hydrodynamic (ISPH) erosion model to simulate the scouring process around a large vertical cylinder and used high-speed cameras to monitor fluid movement around the pile in real time. In fact, the flow regime of the river is extremely complex. There are some problems about model scale effect and test accuracy in laboratory model tests. Kazemi et al. (2017) established a numerical model based on smooth particle hydrodynamics method to simulate open channel turbulence at limited depth in hydraulic rough bed and obtain hydrodynamic law. Lin J et al. (2020), based on the centralized mass point method and mesh clustering technology, studied the hydrodynamic characteristics of the mesh of pile-post Seine unit under the action of water flow through computer simulation. Liu et al. (2020) used a three-dimensional numerical model to study the distribution of pore water pressure and effective stress on seabed depth under the action of a single pile under wave load. Wu and Yang. (2020), on the basis of the secondary development of ANSYS software, established a numerical calculation model considering fluid-solid interaction under the combined action of earthquake, wave, and water flow, and explored the influence of pile group on the hydrodynamic force of large sea-crossing bridge piles. Wang et al. (2020) studied the vortex-induced vibration response of a cylinder with two degrees of freedom when Re = 150 through numerical simulation, and analyzed the oscillation characteristics and hydrodynamic characteristics. Zhu et al. (2020) used the direct numerical simulation (DNS) method to study the hydrodynamic characteristics and wake structure of cylinder at low and medium Reynolds numbers. Wen et al. (2022) used numerical simulation method to study the hydrodynamic characteristics of coastal bridge deck under the combined action of wave and shore wind. Ramnarayan et al. (2021) compared the hydrodynamic characteristics of two kinds of concave pile breakwaters (GS-PSB and CPS-PSB) through numerical simulation. Deng et al. (2019) studied the influence of wave load on pile caps and found that pile caps are affected by the free surface fluctuation of wave force on pile, and the negative wave force on piles near the leading edge of pile caps is obviously greater than the positive wave force. However, due to the inherent problems of the numerical simulation method, such as medium parameter determination, meshing, and boundary condition determination, the research results cannot reflect the actual situation of the interaction between the water flow and the pile. The existing flow load calculation standard British standard BS (1994) and the Port Engineering Load Code, (2010) assume ideal conditions, which cannot well reflect the flow load of a piled wharf in a mountainous river with large pile diameter and multi-layer transverse and longitudinal supports. To sum up, in-situ test is a means of high reliability and accurate measurement results.
In this paper, a new field test system of pile hydrodynamic pressure was designed to detect the hydrodynamic characteristics of flow around the pile based on the in-situ test. The new designed test system was installed at the site of the Phase II Project of Guoyuan in Chongqing Port to collect the in-situ data. A set of feasible methods for analyzing the hydrodynamic water pressure, including calibration and transformation of test data, outlier adjustment, frequency domain analysis, digital filtering, time-domain statistical analysis, and hydrodynamic pressure calculation, was put forward. Distribution laws of hydrodynamic pressure on piles’ surface and drag coefficient of flow around piles under the field condition were obtained.
In-situ tests have complicated and random hydrological conditions. And it takes a long time to carry out field experiments, which easily causes damages to the test system. So, there are high requirements for the test system as follows:
1) The system must accurately test the distribution of hydrodynamic pressure on component’s different surfaces,
2) The system must be suitable for the various complex flow conditions,
3) The test system should be reliable,
4) It should be easy for the system to conduct site installation and removal.
The signal acquisition module was designed to measure the dynamic water pressure on the surface of the component and transmit the measured signal to the signal analysis system. It is composed of a miniature dynamic pressure sensor, a miniature dynamic pressure transmitter, a positioning device, and a DH5922 signal acquisition instrument.
Miniature dynamic pressure sensor: The precision of the miniature dynamic pressure sensor is 0.5, the range is 0–200 kPa, and the power supply is ±15/DC. When the sensor probe is placed in a sufficiently small hole, the pressure of the sensor probe is consistent in all directions. Therefore, the hydrodynamic pressure at a certain point on the surface of the component can be directly measured by micro dynamic pressure sensor and converted into electrical signals.
Miniature dynamic pressure transmitter: The miniature dynamic pressure transmitter converts the corresponding signal measured by the pressure sensor into standard analog signal or digital signal and transmits it to the dynamic signal analysis module through the wire.
Positioning device: In order to install the sensor on the surface of the component easily and quickly on the premise of not damaging the existing structure components, the positioning device is designed, as shown in Figure 1A. The micro-sensor is installed in the slot of the positioning part made of PP sheet in advance, and then the positioning part is placed on the surface of the component, as shown in Figure 1B. The diameter of the pile was 2 m and the thickness of the positioning part (1 cm) can be ignored. The pore pressure measured by the sensor is the instantaneous hydrodynamic pressure on the pile surface.
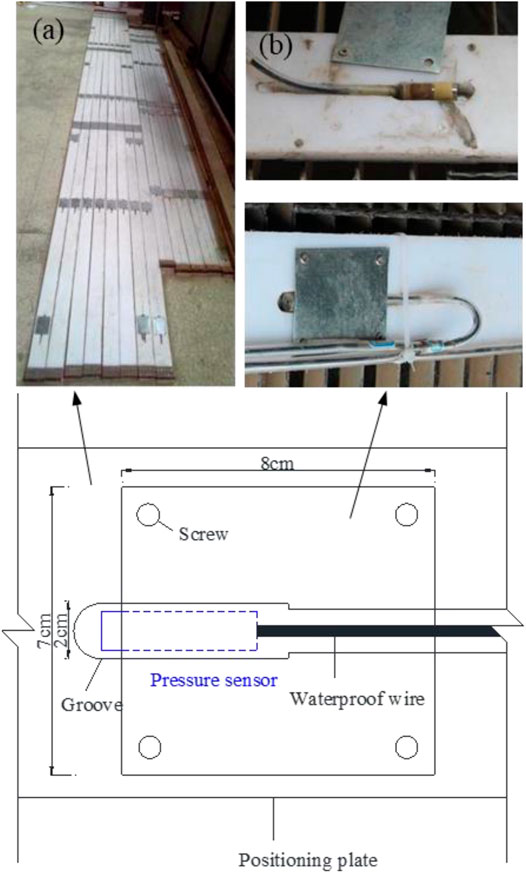
FIGURE 1. Schematic diagram of positioning piece. (A) Positioning plate (B) Micro-sensor.
According to those requirements, the test system was composed of signal acquisition module, dynamic signal analysis module, and signal output module.
In order to collect more accurate water pressure signal in the test system, the pressure sensor is fixed on the pile post with the positioning device. The positioning part is made of PP material, which has great toughness and is convenient to be made into a circular arc. The pressure sensor is placed in the strip-through hole of the positioning member, the waterproof wire is drawn along the strip-shaped groove, and the sensor is fixed on the positioning part with aluminum skin.
DH5922 signal acquisition instrument: Each acquisition module supports four signal inputs, and Zigbee was used to transmit digital signals from the signal acquisition instrument. It has the characteristics of high integration and high portability, which can meet the demand of multi-channel, high precision, and high-speed dynamic signal measurement, and is convenient for field application.
Dynamic signal transmission module (Figure 2) was mainly used to transmit the signals collected by the acquisition instrument. The acquisition instrument and controller adopt Zigbee wireless transmission, controller, and cloud server support 4G mode connection; each controller can control up to 16 acquisition modules. Digital signal after demodulation of the controller was sent to the cloud storage database for saving, and the cloud database can send the digital signal to the signal output module.
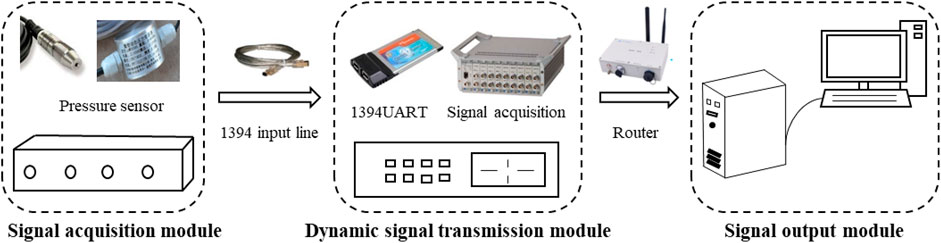
FIGURE 2. In-situ test system of hydrodynamic pressure of pile.
The signal output module (Figure 2) displays the changing characteristics of the signal on the screen through the analysis software on the computer. Meanwhile, the analysis software can be used to process the signal and save the data.
The working process of the system involved the pressure sensor sensing dynamic water pressure and electrical signal via wire transfer to the transmitter; the signal was amplified and then spread to the dynamic signal transmission system, and dynamic signal transmission module sent signals to computers through cloud servers. Finally, the analysis software displays the changing characteristics of the signals on a computer screen. At the same time, the signal can be preliminarily analyzed and processed by the analysis software, and the data can be saved.
The field test site was located at the upstream of the Yangtze River. The test system was set on the first four dock shelving. According to the arrangement principle that dense layout of key parts and general sparse arrangement of other parts, to layout test points, the main measuring point fix on the first shelf and the second column pile as well as the rest are the auxiliary. A total of 84 measuring points were arranged.
According to the plan, we can install sensors to the corresponding position of locating pieces, promoting the test system to the corresponding elevation and confirming the position of sensors on the pile surface. Then, we can detect the reliability and stability of pressure sensor system after installation and make corresponding records. Consequently, the whole process of installation and testing is completed. The pore pressure sensors are distributed around the circular pile in a symmetrical manner, as shown in Figure 3.
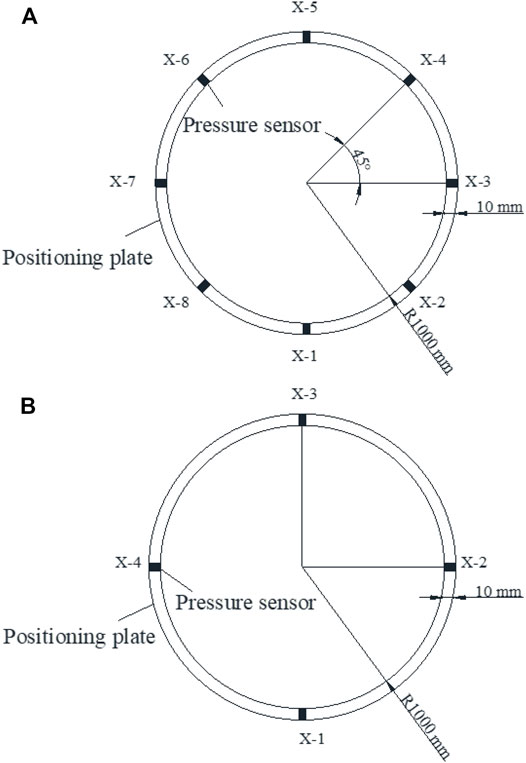
FIGURE 3. Distribution diagram of pressure sensor on pile (The sensor is named X-Y, where “X” represents the positioning part number and “Y” represents the sensor number in the positioning part). (A) The layout of eight sensors (B) The layout of four sensors.
The location of measuring points and the in-situ installation process are shown in Figure 4.
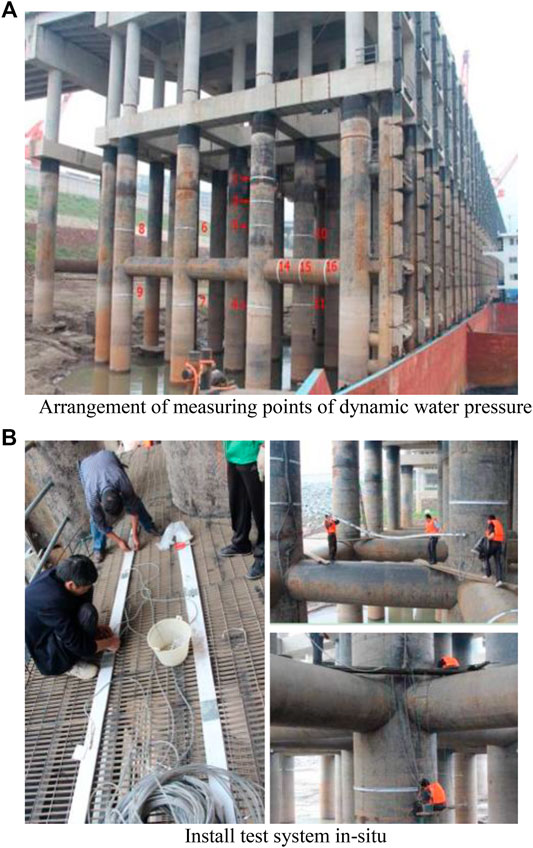
FIGURE 4. In-situ test installation. (A) Arrangement of measuring points of dynamic water pressure (B) install test system in-situ.
1) Acquisition time: The gushing period at the field investigation area is about 15 min. In order to ensure the data integrity, the sensor data collection time period was set as 30 min and the long-time track test was set as 60 min. The testing time was mainly in the daytime, and data collection was carried out for about 8 h continuously. Continuous testing was selected when water flow conditions are relatively ideal, so as to achieve the purpose of long-term observation, large data volume, and integrity.
2) Acquisition environment: The data accuracy can be affected by shipping, construction around the wharf, and wharf platform work conditions, so the collection time is chosen when there is no sail, construction, or operation. When a set of sensor tests is completed, the test system needs to be reset and balanced before testing another group to ensure the stability of every part in the testing system.
To sum up, the ideal hydrological conditions are chosen according to the conditions which were mentioned above. These include conducting the field flow load test on the condition of high velocity and flood peak, and setting the sampling frequency as 100 Hz. Instantaneous voltage signal at different times can be measured at different bents, different piles, different layers, and different flow angles in the wharf area.
In ocean engineering, the waves are often regarded as superposition of multiple cosine waves. If the value of the wave height is zero, the waves satisfy stability requirement. It is called stationary stochastic theory. For the hydrodynamic pressure studied in this article, the average of the hydrodynamic pressure measured by the pressure sensor can be seen as zero. The fluctuation around zero of hydrodynamic pressure can be regarded as multiple waves’ superposition and considered as satisfying the requirement of stability. Therefore, a single sample is representative, and a long enough period of time can be selected from any one sample for statistical analysis, as shown in Figure 5.
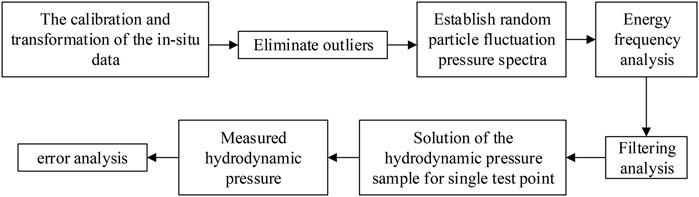
FIGURE 5. Data acquisition and processing flow of field test system.
The data collected on the dock are electrical signals, and the conversion formula between input electrical signals and output pressure signals is established through laboratory tests.
The in-situ data collected from wharf field is electrical signals. The calibration and conversion formula acquired by laboratory tests have established a relationship between the input signals and output pressure signals (Eq. 1), which will convert the data collected in the field into pressure signals. Three Times Standard Deviation Method is used to adjust outliers. The outlier is adjusted by using the Spline Interpolation Methods or replaced with the interpolation of two adjacent right signals for the value within the range between the two normal signals.
Where, Y is voltage signal, V; X is hydrodynamic pressure, kPa.
The mechanism of fluctuating pressure formation in a turbulent region is complicated. At present, the value of fluctuating pressure and the study about hydrodynamic characteristics of structures under fluid-solid coupled interaction mainly depend on the indoor and prototype tests to complete. But their conditions are ideal. And field test results can show the real situation. Based on the theory of stationary random, by taking the average value as zero, the actual fluctuating pressure signal can be obtained from the instantaneous pressure signal, as shown in Figure 6.
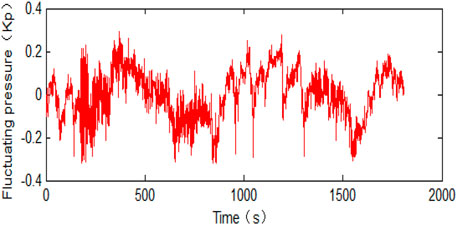
FIGURE 6. Pulsation pressure signal.
Turbulent flow is made up of many different sizes of eddy motion, fracture, and stretch of vortex happening during flow motion. Pressure field with characteristics of pulsation was caused by relative movement of vortex form fluctuation pressure. As the energy and frequency of the vortex are different, the pulsation pressure is also different. To determine the energy weight distribution of different pulsating pressures, fast Fourier transform (DFT) was used for energy frequency analysis, as shown in Figure 7. DFT operation formula was:
where,
where,
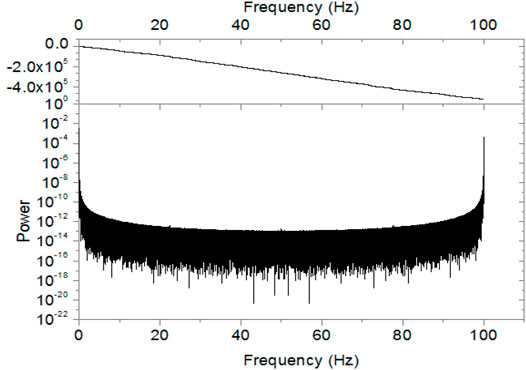
FIGURE 7. Frequency spectra of a group of collected data after fast Fourier transform.
Field data is mingled with certain noise and other useless signals. In order to eliminate or weaken the interference noise and retain the useful signals, the specific frequency band waves need to be filtered out in Figure 8. N-order low-pass filter Butterworth is chosen, whose characteristic function is as follow:
where, N is the order of the filter and
where,
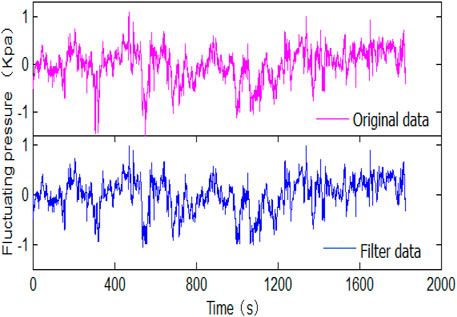
FIGURE 8. Comparison of fluctuating pressure values before and after filtering.
Based on DFT, the distribution of different band frequency wave energy weight can be obtained. This paper retains the signal whose energy accounted for 99.9% of total energy of the full frequency band signal by the first filter. And through the further filtering of pressure signal, pressure dynamic expectations value can be obtained, as shown in Figure 9.
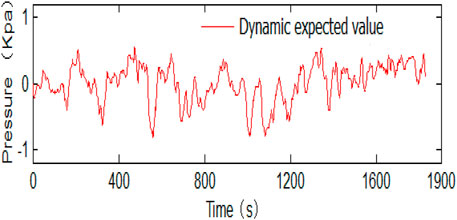
FIGURE 9. Dynamic expectation curve of fluctuating pressure.
The existence of the eddy current will cause strong shore erosion and bed deformation. And it is also the main reason for the change of the single point pressure. Instantaneous pressure fluctuates up and down around the fluctuating pressure dynamic expectation curve in a certain period. The period of fluctuation is just the eddy current cycle, as the “ac” of curve shown in Figure 10. The absolute value of the difference value between the maximum (or the minimum) in the first half period and the minimum (or the max) in the second half of a period is a hydrodynamic pressure sample value.
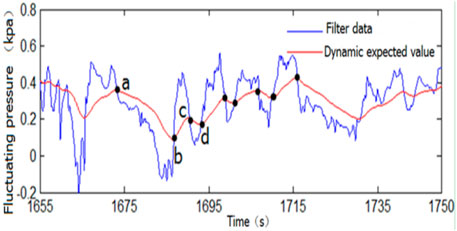
FIGURE 10. Partial amplification of pulsating pressure signal and eddy current cycle judgment diagram.
A total of 84 sensors’ hydrodynamic pressure values are collected in our study. The distribution of the hydrodynamic pressure on pile surface is influenced by hydrological conditions, such as flow velocity, flow direction, and water depth. And it is also affected by the arrangement of pile foundation and vertical and horizontal contact brace as shown in Figure 11A. The combined effect of other piles, braces, and shipping on the main test pile is located in the first single truss of pile at the upstream is minimum, as shown in Figure 11B. The NO. 1 locating piece has four sensors, and the NO. 3 locating piece has eight sensors, which are representative. So, take the NO. 1 and NO. 3 Figure 11C locating pieces fixed on the main test pile to carry out application analysis.
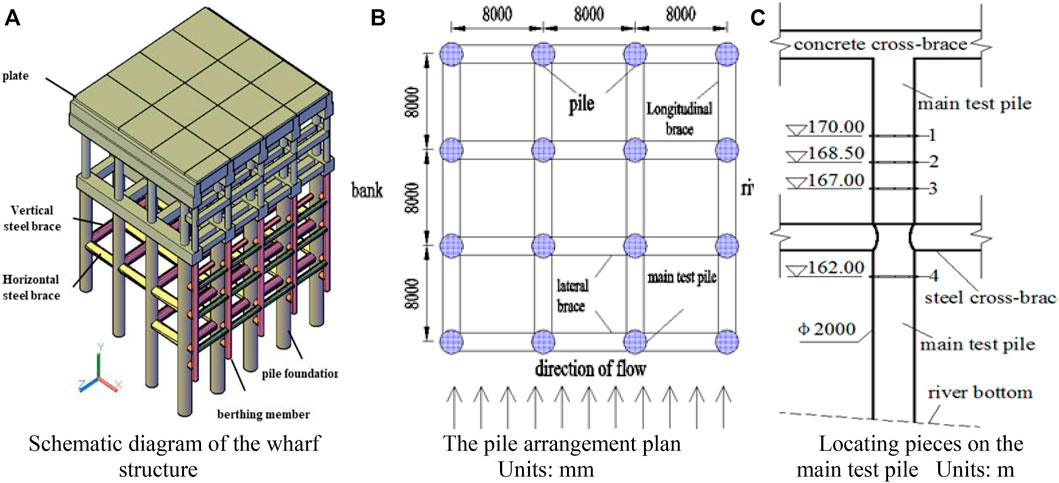
FIGURE 11. Piles layout and locating pieces on the main test pile. (A) Schematic diagram of the wharf structure. (B) The pile arrangement plan units: mm. (C) Locating pieces of the main test pile units: m.
The measuring time is 30.44 min, and the wharf field hydrology conditions are shown in Table 1.

TABLE 1. The wharf field hydrological conditions.
According to the aforementioned data processing method, the characteristic values of hydrodynamic pressure on the surface of the pile are shown in Table 2.
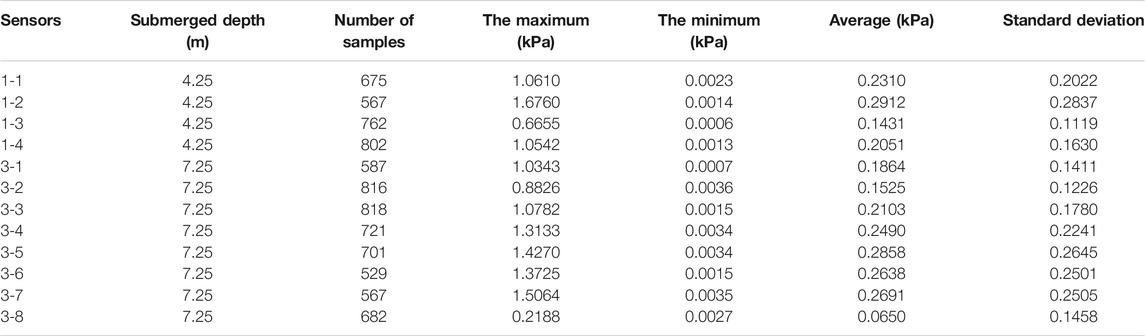
TABLE 2. The eigenvalues of the hydrodynamic pressure.
The sensor is named X-Y, where “X” refers to the positioning part number, and “Y” refers to the sensor number in the positioning part.
The average value is selected as the characteristic value index of hydrodynamic pressure, because the average value is representative and can better reflect the distribution characteristics of hydrodynamic pressure.
According to the study (Ong et al., 2009; Ouvrard et al., 2008), the separation angle of the flow around the circular pile is about 108°∼114° at superhigh Reynolds number. Combined with the characteristic values of the hydrodynamic pressure on pile surface measured by field test, the profile of the hydrodynamic pressure distribution can be achieved, as shown in Figure 12.
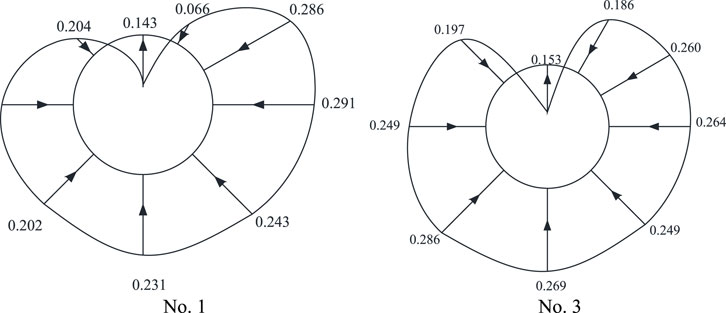
FIGURE 12. Distribution diagram of hydrodynamic pressure along pile circumference.
Figure 12 shows that the hydrodynamic pressure in the direction of incoming flow is maximum. Then the pressure reduces along the pile perimeter, and negative pressure zone is formed behind the pile. Affected by the flow direction angle, pile hydrodynamic pressure distribution is not symmetrical, which conforms to the general law of hydrodynamic pressure distribution.
Based on the figure of the hydrodynamic pressure distribution around the pile, the drag force
Where
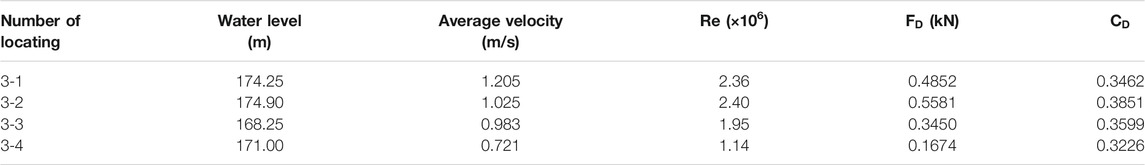
TABLE 3. The calculation of drag coefficient in wharf field.
It is found from the above table that the flow resistance coefficient calculated from the experimental data fluctuates within a certain range, which is about 0.32∼0.38. The flow resistance coefficient in BS standard is 0.45∼0.47, which is larger than the result of this test due to the ideal conditions in the standard.
In conclusion, the hydrodynamic pressure distribution on the surface of the pile can be successfully obtained by using the field test and analysis method of the dynamic characteristics of the pile flowing around the pile. By analyzing the dynamic water pressure distribution on the surface of the pile under different hydrological conditions, we can further study the dynamic water pressure distribution and flow resistance on the surface of the pile under different flow rates, directions, and water depths.
In this paper, the field test system of the hydrodynamic pressure around circular pile was developed, which consisted of the fixed pressure sensing system and dynamic signal test and analysis system. And the system was installed in the Phase II Guoyuan Project in Chongqing Port to collect in-situ data. Based on the theory of the stationary random process and the mathematical statistics method, a set of methods including the calibration and transformation of test data, the outlier adjustment, frequency domain analysis, digital filter, time-domain statistical analysis, and hydrodynamic pressure calculation were applied. The results indicate that:
1) The results show that the signal of the hydrodynamic pressure in the Yangtze River water flow is mainly low frequency signal. The distribution laws of the hydrodynamic pressure around the pile can be obtained by using the field test system and the method for analyzing the test data, which can lay the foundation of the further research on the distribution laws of the hydrodynamic pressure and drag force for inland hydraulic structure under different flow velocity, different flow direction, and different water depth.
2) By calculating the dynamic water pressure around the pile under different conditions, the resistance coefficient range of the pile flow at large Reynolds number is about 0.30∼0.40.
The original contributions presented in the study are included in the article/Supplementary Material, further inquiries can be directed to the corresponding author.
Conceptualization, ML; methodology, ML and LZ; validation, LS; formal analysis, GC and LW; investigation, EA; resources, ML; data curation, LZ and GC; writing—original draft preparation, ML and LZ; supervision, LW. All authors have read and agreed to the published version of the manuscript. All authors have read and agreed to the published version of the manuscript.
This research is funded by the National Natural Science Foundation of China (51479014) and the Talents Plan Project in Chongqing of China, project number: cstc2021ycjh-bgzxm0053.
GC was employed by the company Sichuan Communication Surveying and Design Institute CO.,LTD. and LS was employed by the company CCCC Second Harbor Engineering Company Ltd.
The remaining authors declare that the research was conducted in the absence of any commercial or financial relationships that could be construed as a potential conflict of interest.
All claims expressed in this article are solely those of the authors and do not necessarily represent those of their affiliated organizations, or those of the publisher, the editors and the reviewers. Any product that may be evaluated in this article, or claim that may be made by its manufacturer, is not guaranteed or endorsed by the publisher.
Deng, L., Yang, W., Li, Q., and Li, A. (2019). CFD Investigation of the Cap Effects on Wave Loads on Piles for the Pile-Cap Foundation. Ocean Eng. 183, 249–261. doi:10.1016/j.oceaneng.2019.05
Han, Q., Ma, Y., Xu, W., Fan, D., and Wang, E. (2018). Hydrodynamic Characteristics of an Inclined Slender Flexible cylinder Subjected to Vortex-Induced Vibration. Int. J. Mech. Sci. 148, 352–365. doi:10.1016/j.ijmecsci.2018.09.010
Karthik Ramnarayan, S., Sannasiraj, S. A., and Sundar, V. (2021). Hydrodynamic Characteristics of Curved Front Face Pile-Supported Breakwaters in Random Waves. Appl. Ocean Res. 117, 102922. doi:10.1016/j.apor.2021.102922
Kazemi, E., Nichols, A., Tait, S., and Shao, S. (2017). SPH Modelling of Depth-Limited Turbulent Open Channel Flows over Rough Boundaries. Int. J. Numer. Meth. Fluids 83, 3–27. doi:10.1002/fld.4248
Lin, J, J., Zhang, J.-s., Sun, K., Wei, X.-l., and Guo, Y.-k. (2020). Numerical Analysis of Seabed Dynamic Response in Vicinity of Mono-Pile under Wave-Current Loading. Water Sci. Eng. 13, 74–82. doi:10.1016/j.wse.2020.02.001
Lin, K, K., Fan, D., and Wang, J. (2020). Dynamic Response and Hydrodynamic Coefficients of a cylinder Oscillating in Crossflow with an Upstream Wake Interference. Ocean Eng. 209, 107520. doi:10.1016/j.oceaneng.2020.107520
Liu, C., Fu, S., Zhang, M., Ren, H., and Xu, Y. (2020). Hydrodynamics of a Flexible cylinder under Modulated Vortex-Induced Vibrations. J. Fluids Structures 94, 102913. doi:10.1016/j.jfluidstructs.2020.102913
Ning, D., Zhao, X., Göteman, M., and Kang, H. (2016). Hydrodynamic Performance of a Pile-Restrained WEC-type Floating Breakwater: An Experimental Study. Renew. Energ. 95, 531–541. doi:10.1016/j.renene.2016.04.057
Ong, M. C., Utnes, T., Holmedal, L. E., Myrhaug, D., and Pettersen, B. (2009). Numerical Simulation of Flow Around a Smooth Circular cylinder at Very High Reynolds Numbers. Mar. Structures 22, 142–153. doi:10.1016/j.marstruc.2008.09.001
Ouvrard, H., Koobus, B., Salvetti, M.-V., Camarri, S., and Dervieux, A. (2008). Variational Multiscale LES and Hybrid RANS/LES Parallel Simulation of Complex Unsteady Flows. Int. Conf. High Perform. Comput. Comput. Sci. 5336, 465–478. doi:10.1007/978-3-540-92859
Tian, X., Liu, Y., Liu, G., Xie, Y., and Wang, S. (2019). Experimental Study on Influencing Factors of Hydrodynamic Coefficient for jack-up Platform. Ocean Eng. 193, 106588. doi:10.1016/j.oceaneng.2019.106588
Wang, D., Shao, S., Li, S., Shi, Y., Arikawa, T., and Zhang, H. (2018). 3D ISPH Erosion Model for Flow Passing a Vertical cylinder. J. Fluids Structures 78, 374–399. doi:10.1016/j.jfluidstructs.2018.01.003
Wang, F., Sun, R., Wang, C. X., Fu, Q., Li, P., and Guo, H. Y. (2019). Experimental Study on Flow Field Induced by Internal Solitary Wave and Load Characteristics on Pile Sections at Different Depth. Ocean Eng. 188, 106292,. doi:10.1016/j.oceaneng.2019.106292
Wang, H. B., Ding, L., Zhang, L., Sharma, R. N., and Yang, L. (2020). Numerical Study on Two-Degree-Of-freedom Vortex Induced Vibrations Suppression of a Circular cylinder via Synthetic Jets at Different Excitation Frequencies. Int. J. Heat Fluid Flow 84, 108593,. doi:10.1016/j.ijheatfluidflow.2020.108593
Wen, B. H., Qu, K., Lan, G. Y., Sun, W. Y., Yao, Y., Deng, B., et al. (2022). Numerical Study on Hydrodynamic Characteristics of Coastal Bridge Deck under Joint Action of Regular Waves and Wind. Ocean Eng. 245, 110450,. doi:10.1016/j.oceaneng.2021.110450
Wu, A. J., and Yang, W. L. (2020). Numerical Study of Pile Group Effect on the Hydrodynamic Force on a Pile of Sea-Crossing Bridges during Earthquakes. Ocean Eng. 199, 106999,. doi:10.1016/j.oceaneng.2020.106999
Yang, H., Yang, W., Yang, T., and Li, Q. (2020). Experimental Investigation of Flow Around a Square cylinder with Very Small Aspect Ratios. Ocean Eng. 214, 107732. doi:10.1016/j.oceaneng.2020.107732
Yang, Y., Qi, M., Li, J., and Ma, X. (2021). Experimental Study of Flow Field Around Pile Groups Using PIV. Exp. Therm. Fluid Sci. 120, 110223. doi:10.1016/j.expthermflusci.2020.110223
Keywords: flow around pile, hydrodynamic pressure, in-situ test system, drag coefficient, hydrodynamic characteristics
Citation: Liu M, Zeng L, Wu L, Chen G, Shen L and Abi E (2022) In-Situ Test Method for Hydrodynamic Characteristics of Water Flowing Around Piles. Front. Environ. Sci. 10:855334. doi: 10.3389/fenvs.2022.855334
Received: 15 January 2022; Accepted: 27 January 2022;
Published: 10 March 2022.
Edited by:
Jaan H. Pu, University of Bradford, United KingdomReviewed by:
Yang Shi, Tsinghua University, ChinaCopyright © 2022 Liu, Zeng, Wu, Chen, Shen and Abi. This is an open-access article distributed under the terms of the Creative Commons Attribution License (CC BY). The use, distribution or reproduction in other forums is permitted, provided the original author(s) and the copyright owner(s) are credited and that the original publication in this journal is cited, in accordance with accepted academic practice. No use, distribution or reproduction is permitted which does not comply with these terms.
*Correspondence: Liqin Zeng, emxxX3BibEAxMjYuY29t
Disclaimer: All claims expressed in this article are solely those of the authors and do not necessarily represent those of their affiliated organizations, or those of the publisher, the editors and the reviewers. Any product that may be evaluated in this article or claim that may be made by its manufacturer is not guaranteed or endorsed by the publisher.
Research integrity at Frontiers
Learn more about the work of our research integrity team to safeguard the quality of each article we publish.