 Renee Sniegocki1Jessica B. Moon1,2Abigail L. Rutrough3Jude Gireneus4Jaya Seelan Sathiya Seelan4
 Michael C. Farmer5David C. Weindorf6
 Kusum Naithani1*
- 1Department of Biological Sciences, University of Arkansas, Fayetteville, AR, United States
- 2Department of Biological Sciences, Murray State University, Murray, KY, United States
- 3Department of Biology, Texas Tech University, Lubbock, TX, United States
- 4Institute for Tropical Biology and Conservation (ITBC), Universiti Malaysia Sabah, Kota Kinabalu, Sabah, Malaysia
- 5Department of Agricultural and Applied Economics, Texas Tech University, Lubbock, TX, United States
- 6Department of Plant and Soil Science, Texas Tech University, Lubbock, TX, United States
Logging and forest conversion are occurring at alarming rates in tropical forests. These disturbances alter soil microbial community structure and functions. While direct links between changes in soil properties, such as pH and microbial community structure are well established, the indirect effects of logging and forest conversion on soil microbial community structure and functions are poorly understood. We used a space-for-time substitution to investigate the changes in soil microbial diversity and functions across a forest recovery gradient in the tropical montane forests of northern Borneo. We used surface (top 5 cm) soil to assess soil physicochemical and microbial (next-generation DNA sequencing) properties, and standardized litterbags (Tea Bag Index) to assess litter decomposition and stabilization. Our results show that bacterial and fungal diversity increases with recovery time and reaches pre-disturbance levels between 60- and 80-years post-disturbance. Litter decomposition rate constants increased linearly with increasing bacterial and fungal diversity. Litter stabilization also increased linearly with fungal diversity, but was highest at intermediate levels of bacterial diversity. Our results provide insights on the effects of forest logging and conversion on soils and highlight the tight coupling between soil microbial diversity and soil functions in tropical montane forests.
1 Introduction
Understanding the complex links between disturbance regimes, biodiversity, and ecosystem functions is a central theme of ecological research. Disturbance regimes such as logging and forest conversion are specific concerns in tropical forests, which store the largest amount of living carbon (C) (Pan et al., 2013), account for over half of the global annual net primary production (Melillo et al., 1993), and are the most biodiverse ecosystems (Dirzo and Raven, 2003) in the world. An estimated 27.2 million ha were cleared from tropical forests between 2000 and 2005 (Hansen et al., 2008). Logging and forest conversion can have lasting effects on canopy structure (Okuda et al., 2003), microclimate (Meijide et al., 2018), soil pH (Waldrop et al., 2000), soil nutrient content (McGrath et al., 2001), C sequestration, productivity (Pinard and Cropper, 2000; DeFries et al., 2002), and multitrophic biodiversity (Barnes et al., 2014; Barlow et al., 2016). For example, logging and forest conversion can decrease soil C and nitrogen (N) content as well as soil pH (Waldrop et al., 2000; Templer P. et al., 2005; Alele et al., 2014). While logging and forest conversion can affect microbial community composition and microbial biomass (Kerfahi et al., 2014; Maharjan et al., 2017), little is known about its role in shaping diversity and functions of soil microbial communities.
Microbes such as bacteria and fungi make up a significant portion of the biodiversity of tropical forests (Whitman et al., 1998; Arnold and Lutzoni, 2007), and are major drivers of the belowground C cycle through their role in processes such as litter decomposition and stabilization (Schimel and Schaeffer, 2012). However, there is a lack of consensus on how soil microbial diversity changes as a function of land use gradients and ultimately, relates to shifts in ecosystem functions. For example, while some have found no difference in microbial diversity between logged and unlogged tropical forests (Lee-Cruz et al., 2013; Tripathi et al., 2016), others have found an increase in microbial diversity in post disturbance tropical and temperate forests (Wallander et al., 2010; Zhu et al., 2012) and along a tropical land-use intensification gradient (Mendes et al., 2015; Carvalho et al., 2016). Studies that have looked for relationships between microbial diversity and C processing have also found mixed results. For example, while one study showed little to no effect of microbial diversity on litter decomposition in a manipulative grassland experiment (Griffiths et al., 2000a), another found positive relationships between the two in a controlled laboratory experiment (Maron et al., 2018).
With an overall goal of understanding the post-disturbance trajectory of soil microbial community structure (fungal and bacterial diversity) and functions (litter decomposition and stabilization) in tropical ecosystems, we used a space-for-time replacement design to investigate forest regeneration in northern Borneo. Specifically, we asked: 1) do bacterial and fungal diversity exhibit recovery trajectories following logging and forest conversion similar to soil physicochemical properties, and do they differ in their trajectories? Changes in fungal diversity are often attributed to successional changes in the plant community (Zhu et al., 2012), while bacteria are often more strongly linked to soil properties such as pH (Tripathi et al., 2012). We hypothesize that soil microbial diversity of tropical forests will increase with increasing recovery time, but that recovery time will be different for bacterial and fungal communities. 2) do litter decomposition and stabilization follow the same recovery trajectories as bacterial and fungal diversity following logging and forest conversion? Based on previous comparative studies (Ribolzi et al., 2017; Sarneel et al., 2020) we know that litter decomposition rates are greater in mature forests, but there is a lack of information about the post-disturbance trajectory of litter decomposition and stabilization. 3) are there links between microbial community structure (bacterial and fungal diversity) and functions (litter decomposition and stabilization)? Given the mixed responses, ranging from no relationship (Griffiths et al., 2000b) to a positive relationship (Maron et al., 2018) between microbial diversity and ecosystem functions in controlled experiments, we hypothesize that there will be high uncertainty in these relationships in our observational study.
2 Materials and methods
2.1 Study area
We selected five study sites along a forest recovery gradient (time since the last major disturbance ranged from 4 to 150 year) in the Tambunan District of central Sabah, Malaysia (5.71750°, 116.40055°) (Figure 1 and Table 1). Two of the sites, the Mahua Falls Forest (MaF) and the Malungung Forest (MuF), were located within the federally protected Crocker Range Park area which covers ∼139,919 ha. MaF and MuF were heavily logged ∼100 and ∼70 years (respectively) prior to this study. The remaining three sites were in nearby privately-owned lands within the Tambunan Valley. The oldest site, Angelo’s Forest (AnF), had not been clear-cut/logged for over 150 years (150–500 years, personal communication with the landowner). The abandoned rubber plantation (ARP) was cleared, terraced, and planted 41 years ago; trees at this site were untapped at the time of the sampling. The Abandoned Agricultural Field (AAF) was previously cultivated for chili, cleared again in 2014, and left abandoned for 4 year prior to sampling. The study sites ranged in elevation from 870 to 1,150 m asl and experienced a similar regional climate with a mean annual temperature of 24.3°C (Supplementary Figure S1) and annual precipitation of ∼1,968 mm. The underlying geology of this region consists mainly of Quaternary fluvial gravels and sands (Tjia, 2007), and the soils in this region are characterized as orthic acrisols, having low base saturation (<50%) and high clay content in the B Horizon (Chesworth, 2008).
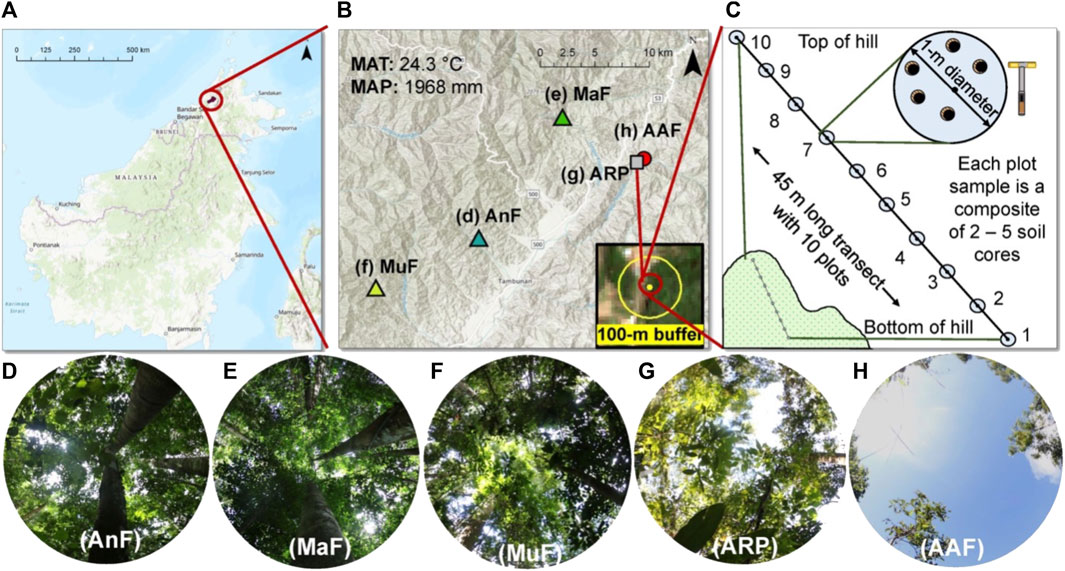
FIGURE 1. Description of the study sites and soil sampling scheme. Map of the study area (A) showing the location of the five study sites across a forest recovery gradient in Sabah, Malaysian Borneo (B). The average elevation of the sites was 934 m, mean annual air temperature (MAT) was 24.3°C, and mean annual precipitation (MAP) was 1 968 mm. A 100-m buffer (yellow circle) was used around each site (yellow dot) to estimate percent forest cover using SENTINEL-2 imagery (B). Soil sampling scheme displaying a 45-m long transect with 10 sampling plots on an elevational gradient at each study site (C). Different sites including Angelo’s Forest (AnF), Mahua Falls Forest (MaF), Malungung Forest (MuF), Abandoned Rubber Plantation (ARP), and Abandoned Agriculture Field (AAF) are displayed using different colors and symbols (B) and corresponding canopy photos (D–H) are displayed below. Canopy photos were taken using a Canon EOS 7D Mark II Digital SLR camera with an Altura Ultra Wide Angle Aspherical Fisheye Lens (8 mm f/3.0).
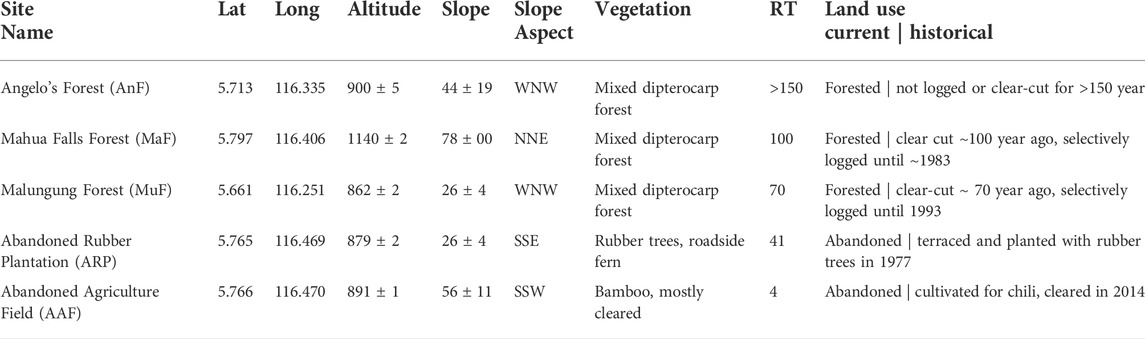
TABLE 1. Study site description including geographical location (latitude (Lat), longitude (Long) in decimal degree), altitude (m ± SE), slope (% ± SE), dominant vegetative cover, recovery time (RT, year), and current/historical land use.
2.2 Site land cover classification
To describe current land use surrounding our sites, we classified land cover within a 100-m radius (Figure 1B) of the transect center (Figure 1C) using a maximum likelihood supervised classification. Maximum likelihood supervised classification uses pixel color and pattern recognition aided by user-provided training samples to classify satellite imagery into land cover classes (Parece et al., 2014). We classified land cover as forest and non-forest in ArcMap (version 10.6.1, ESRI, Inc., © 1995–2018) using SENTINEL-2 satellite imagery. SENTINEL-2 imagery was downloaded from the Copernicus Open Access Hub (https://scihub.copernicus.eu/, last accessed 17 March 2019) and was selected due to its availability in our study area and high spatial resolution (10 m). Using all forested pixels within the 100-m radius buffer, we calculated percent forest cover for each site.
2.3 Field sampling
At each site, we collected the top 5 cm of soil (organic and mineral both) at 5 m intervals along a 45 m transect positioned along a slope gradient (Figure 1C; Table 1) during the peak growing season of June 2018. To sample maximum within-site variability, we collected two to five soil cores (corer diameter = 6.35 cm) within 1 m of each plot center to create one composite soil sample per plot (Figure 1C). Overall, 10 plots were sampled per site (sample size = 10 plots x 5 sites = 50) and each plot was a composite sample of 2-5 cores. Due to extremely rocky terrain at AnF, we were unable to use the 6.35 cm diameter soil auger and used a 2.54 cm diameter corer for soil sampling instead. We homogenized each composite sample and immediately preserved a 1 g subsample in RNALater stabilization solution (ThermoFisher Scientific). The preserved samples (n = 50) were shipped to the Molecular Research Laboratory (MR DNA, Shallowater, TX, United States) for microbial analysis within a week of sampling. In the remaining sample, we removed large roots, rocks, and undecayed litter. We then air-dried, ground, and sieved (2 mm) the soil to remove non-soil fractions; and shipped these samples to the Texas Tech University’s soil laboratory for analysis of soil physicochemical properties. We measured surface (0–5 cm) soil temperature (digital soil thermometer probe, HANNA Instruments) in the field and collected additional surface soil samples in air-tight containers for assessing gravimetric soil water content (i.e., dried at 60°C until sample weight remained constant).
2.4 Soil physicochemical analysis
We measured soil pH using the saturated paste method (Salinity Laboratory Staff, 1954), characterized soil elements (aluminum, sulphur, potassium, manganese, iron, nickel, copper, zinc, lead) using portable x-ray fluorescence (pXRF) (Goff et al., 2020), estimated soil organic matter (SOM) concentrations using the loss-on-ignition method (Schulte and Hoskins, 2011), total C and N using the Dumas method (Dumas, 1831), and soil texture (i.e., % sand, silt, clay) using a Hydrometer particle size analysis (152H Hydrometer) (Gee and Bauder, 2018). Due to an insufficient sample size at some plots, we performed soil texture analysis on 28 soil samples out of 50. Sites fell within the sandy clay (AnF, MaF), clay (ARP, AAF), and clay loam (MuF) soil texture classifications (Supplementary Figure S2).
2.5 Litter decomposition and stabilization
Inherent differences in litter quality can affect decomposition rates following disturbance (Keuskamp et al., 2013). The Tea Bag Index (TBI) method employs a standardized litter bag technique to compare plant litter decomposition and stabilization across sites without the influence of litter quality, and focuses on identifying environmental factors that influence decomposition rates across sampling locations (see global data in Keuskamp et al., 2013). We buried 10 pairs of pre-weighed litter bags (i.e., nonwoven tetrahedron-shaped polypropylene tea bags, Lipton, Unilever) per site, one green tea [89% green tea, fast decomposing (labile) litter] and one rooibos tea [93% rooibos tea, slow decomposing (recalcitrant) litter], at 8 cm below surface. Fine mesh size (0.25 mm) allowed microorganisms and mesofauna to enter the bags, but excluded macrofauna (Setälä et al., 1996). After 72–77 day, we retrieved the teabags and manually removed debris and roots following the “Tea Bag Index: Scientific Protocol, 2016” (http://www.teatime4science.org/method/stepwise-protocol/).
We used the initial and final oven-dried (70°C for 48 h) mass to calculate the stabilization factor (S, unitless) and the decomposition rate constant (k, d-1).
During litter decomposition process, a portion of the labile compounds is stabilized and becomes recalcitrant (Prescott, 2010). This is calculated from the green tea bags (labile litter), as its labile component is expected to be decomposed within the incubation period (Eq. 1).
where
The assumption that the environmental stabilization of labile material is independent of the relative size and composition of the hydrolysable fraction has been tested using alternate analyses in previous work (Keuskamp et al., 2013).
The decomposition rate constant (k) can only be estimated from the early stages of decomposition. Since the green tea is collected after its labile material is decomposed, k is calculated from the rooibos tea (recalcitrant litter), using a single time point assuming an exponential decay function (Eq. 3).
where W(t) is the weight of the substrate after incubation time t, a is the labile and (1 − a) is the recalcitrant fraction of the litter. Additional details can be found in Keuskamp et al. (2013).
2.6 Soil microbial diversity
We received final operational taxonomic units (OTUs) that were assigned based on 97% similarity and followed the proprietary MR DNA analysis pipeline (Dowd et al., 2008) from the Molecular Research Laboratory (MR DNA, Shallowater, TX, United States). Briefly, the 16S rRNA gene (bacteria) and ITS1 region (fungi) were amplified, respectively. PCR primers 515, ITS1 and ITS2, along with HotStarTaq Master Mix Kit (Qiagen, United States) were used in 30 PCR cycles with the following steps: 94°C for 3 min followed by 30 cycles of 94°C for 30 s; 53°C for 40 s and 72°C for 1 min; and a final elongation step at 72°C for 5 min. Following amplification, DNA fragments were sorted by molecular weight and concentration using 2% agarose gel. The sorted DNA samples were then purified using an 1X AmpureXP beads and checked on Agilent High Sensitivity (HS) chip on Bioanalyzer 2100 and quantified on a fluorimeter by Qubit dsDNA HS Assay kit (Brand from MR DNA). The library was loaded onto the Illumina Platform for clustering and sequencing. Paired-End sequencing allows the template fragments to be sequenced in both the forward and reverse directions. Sequencing was carried out on an Illumina MiSeq following the manufacturer’s guidelines and data were analyzed using the proprietary MR DNA analysis pipeline (Dowd et al., 2008). Sequences with <150 bp or with ambiguous base calls were removed. Briefly, sequences were denoised, operational taxonomic units (OTUs) were assigned based on 97% similarity, and chimeras were removed. Singletons and OTUs appearing in only one sample were removed from OTU tables. Archaea and mitochondrial or chloroplasts OTUs were removed from the 16S data and non-fungi OTUs from ITS1 data. In total, 31,261 bacterial and 0 fungal chimeric were removed from further downstream analysis. Final OTUs were assigned using BLASTn; cloned sequences were searched against a database derived from RDP-II and NCBI (www.ncvi.nlm.nih.gov, http://rdp.cme.msu.edu). A total of 3,439,724 (68,794 ± 3,167 on average) high quality 16S sequences and 2,920,915 (58,418 ± 1,185) high quality ITS sequences for the 50 soil samples were analyzed. The average of 1,274 ± 180 bacterial and 2,105 ± 59 fungal OTUs at 97% identity cutoff were obtained for 16S and ITS sequences.
2.7 Statistical analyses
We calculated Chao1 bacterial and fungal diversity at the OTU level for each soil sample in R (R Core Team, 2017) using the package “SpadeR” (Chao et al., 2016) and used SigmaPlot 14.0 (Systat Software Inc., San Jose California, United States) to display and fit the statistical models to the bivariate relationships between recovery time, soil microbial diversity, and litter decomposition and stabilization. All regression models were evaluated for strength (simpler models with greater R2 were selected) and significance (only significant (p ≤ 0.05) models were selected).
We used the “randomForest” package (Cutler and Wiener, 2018) in R to evaluate the relative importance of recovery time as a predictor of soil microbial diversity (bacterial and fungal) and soil functions (litter decomposition and stabilization) when compared with other predictors including soil physicochemical properties, aboveground vegetation cover, and environmental variables. Random forest is an ensemble machine learning technique that creates a series of uncorrelated regression trees from random subsamples of the data. These trees decide as a committee which variables are the most predictive, and rank the variables in order of their ability to increase the mean square error when removed from the model (Breiman, 2001). Before running the random forest analysis, we used the package “corrplot” in R to identify and remove highly correlated variables (|r| > 0.70) (Wei and Simko, 2017) (Supplementary Figure S3), retaining the most ecologically relevant and/or proximal predictor variables (Dormann et al., 2013). Through this process iron, C, manganese, sulfur, potassium, C:N, and zinc were removed from the random forest analysis. Although recovery time and pH were highly correlated (|r| = 0.82), we chose to leave both variables in the analysis because of their unique ecological contributions to the model. To ensure that the importance given to each predictive variable would not be biased by the presence of the two correlated variables, we ran the random forest analyses again removing each of the two correlated variables one at a time and then simultaneously. We found reductions in the overall variance explained by the model, however the top predictive variables for each model were the same, excluding the variable(s) removed. Therefore, we concluded that the correlation of the variables had little effect on our model and chose to include them both in the final analyses. One extreme fungal diversity outlier was removed from the random forest and regression analyses but is displayed in figures and noted with an asterisk. We built 200 trees (ntrees = 200) for each run and sampled 3−4 variables (Mtry = 3–4, depending on the number of predictor variables) with replacement for each tree. Finally, we took the top four predictors and used regression analysis to further explore the trends.
3 Results
3.1 Surrounding forest cover
Surrounding forest cover varied among the study sites, with 100% forest cover measured at MaF, 99.4% at MuF, 88.4% at AnF, 60.3% at AAF, and 40% at ARP. While surrounding forest cover was not significantly related to recovery time (Supplementary Figure S4A), higher surrounding forest cover was found at the three naturally forested sites than the agricultural (AAF) and converted (ARP) sites and surrounding forest cover had a cooling effect on daytime soil temperatures (Supplementary Figure S4B).
3.2 Relative influence of recovery time on soil properties
3.2.1 Physicochemical properties
There were a range of responses between soil physicochemical properties and recovery time (Figure 2). Soil pH (p < 0.001, Adj R2 = 0.67, Figure 2A), sulfur (p = 0.05, Adj. R2 = 0.28, Figure 2F), and % sand (p < 0.001, Adj. R2 = 0.60 Figure 2B) increased linearly while aluminum decreased linearly (p < 0.001, Adj. R2 = 0.43, Figure 2D) with increasing recovery time. SOM (p < 0.001, Adj. R2 = 0.36) showed a peaked response at ∼100 years following recovery (Figure 2E). Total N content increased linearly (p < 0.001, Adj. R2 = 0.31) while total C content (p < 0.001, Adj. R2 = 30) showed a saturated response with recovery time (Supplementary Figure S5); taken together this generated a peaked response of C:N at ∼80 years following recovery (Figure 2C).
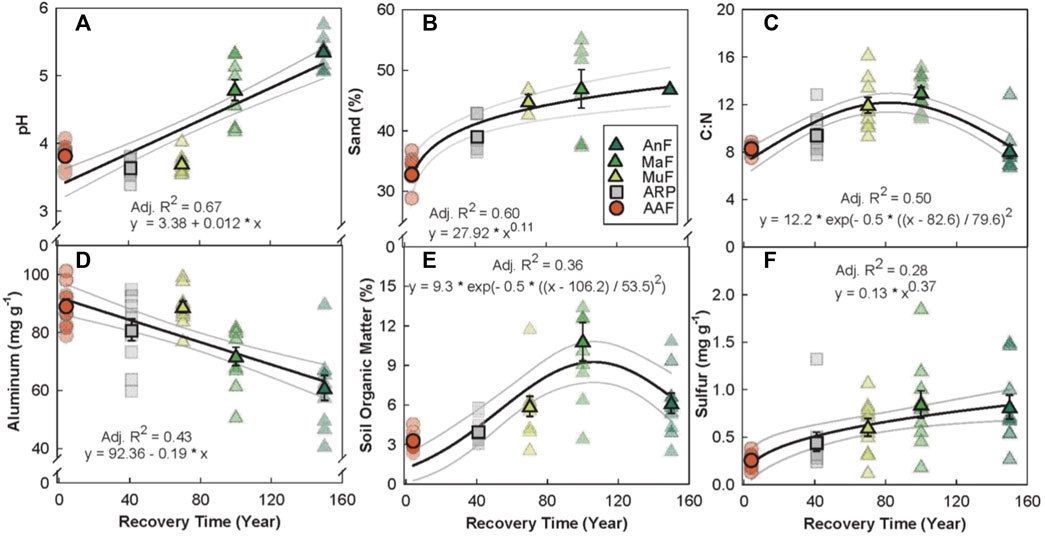
FIGURE 2. Relationship between recovery time (year) and soil physicochemical properties (A–F) across a forest recovery gradient: Angelo’s Forest (AnF), Mahua Falls Forest (MaF), Malungung Forest (MuF), Abandoned Rubber Plantation (ARP), and Abandoned Agriculture Field (AAF). Smaller symbols in the background of each plot represent raw data points (n = 10 per site), while larger symbols represent site means. Sample size for % sand varied from 1 to 10 depending on the site [AnF (n = 1), MaF (n = 6), MuF (n = 3), ARP (n = 8), AAF (n = 10)] due to logistical difficulties of collecting enough soil. Bars represent the standard error of mean and gray lines represent 95% confidence intervals. All statistical models are significant at p ≤ 0.05.
3.2.2 Bacterial diversity
The random forest analysis explained 67.08% of the total variance in Chao1 bacterial OTU diversity (hereafter, bacterial diversity) with recovery time, soil pH, percent forest cover, and SOM as the top four predictors (Figure 3A). Bacterial diversity peaked at a soil pH of 5 (p < 0.001, Adj. R2 = 0.63, Figure 3B), and linearly increased with both recovery time (p ≤ 0.01, Adj. R2 = 0.56, Figure 3C) and surrounding forest cover (p < 0.001, Adj. R2 = 0.43, Figure 3D). Bacterial diversity levels saturated around 6% SOM (p < 0.001, Adj. R2 = 0.29, Figure 3E).
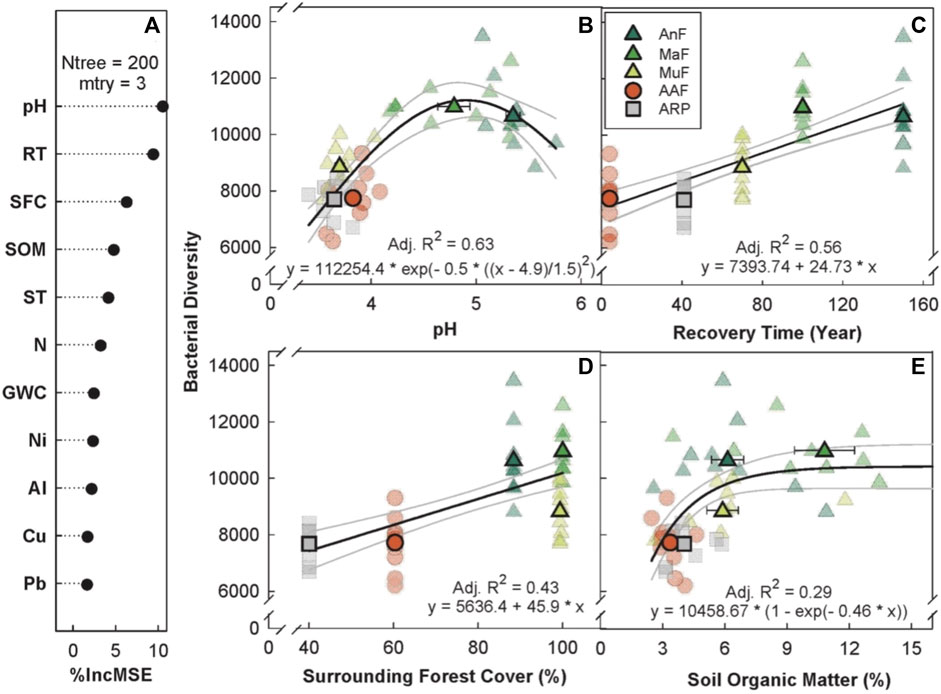
FIGURE 3. Variable importance prediction from random forest analysis (A) and bivariate relationships of the top four predictors (B–E) of bacterial diversity (Chao1 diversity index) across a forest recovery gradient. Soil variables included in random forest analyses, in order of importance, are pH, recovery time (RT, year), surrounding forest cover (SFC, %), soil organic matter (SOM, %), daytime soil temperature (ST, °C), N (%), gravimetric water content (GWC, g g−1), Ni (mg g−1), Al (mg g−1), Cu (mg g−1), and Pb (mg g−1). Sites including Angelo’s Forest (AnF), Mahua Falls Forest (MaF), Malungung Forest (MuF), Abandoned Rubber Plantation (ARP), and Abandoned Agriculture Field (AAF) are displayed using different colors and symbols. Smaller symbols in the background of each bivariate plot represent raw data points (n = 10 per site), while larger symbols represent site means. Bars represent the standard error of mean and gray lines represent 95% confidence intervals. All statistical models are significant at p ≤ 0.05.
3.2.3 Fungal diversity
The random forest analysis explained 18.69% of the total variance in Chao1 fungal OTU diversity (hereafter, fungal diversity) with recovery time, percent forest cover, soil pH, and soil aluminum as the top four predictors (Figure 4A). Fungal diversity increased with recovery time, saturating at ∼100 years (p < 0.001, Adj. R2 = 0.34, Figure 4B), but showed weaker relationship with recovery time as compared to bacterial diversity (R2 = 0.63, Figure 3B). Surrounding forest cover was the second most important predictor of fungal diversity, with a positive linear relationship (p < 0.001, Adj. R2 = 0.21, Figure 4C). Fungal diversity peaked at a soil pH of ∼5 (p ≤ 0.01, Adj. R2 = 0.17, Figure 4D) and had a weak inverse relationship as a function of soil aluminum concentration (p ≤ 0.01, Adj. R2 = 0.09, Figure 4E).
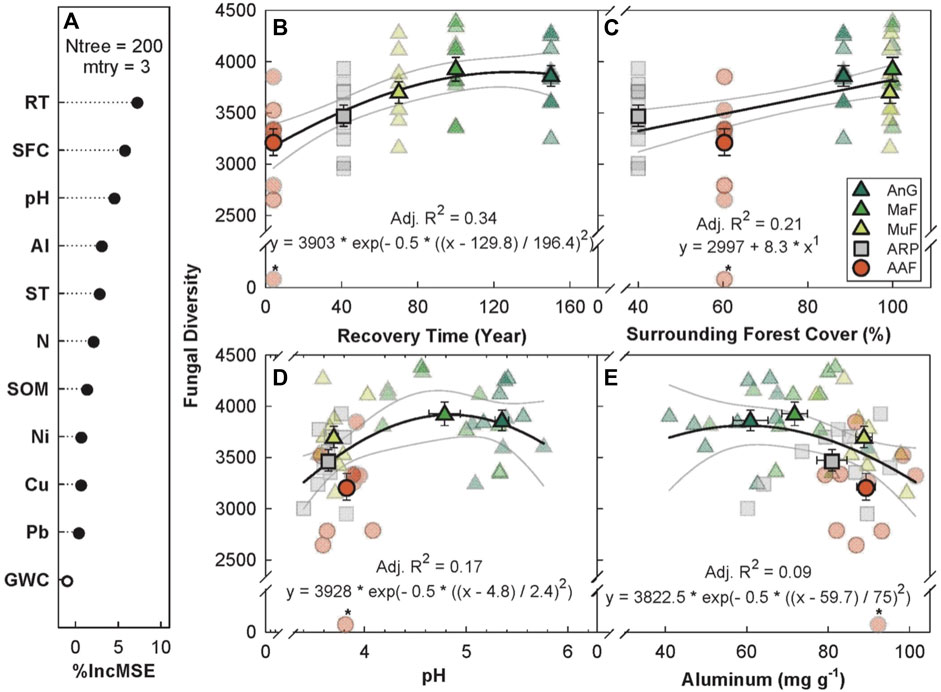
FIGURE 4. Variable importance prediction from random forest analysis (A) and bivariate relationships of the top four predictors of fungal diversity (Chao1 diversity index) across a forest recovery gradient (B–E). Soil variables included in random forest analyses, in order of importance, are recovery time (RT, year), surrounding forest cover (SFC, %), pH, Al (ppm), daytime soil temperature (ST, °C), N (%), soil organic matter (SOM, %), Ni (mg g−1), Cu (mg g−1), Pb (mg g−1), gravimetric water content (GWC, g g−1, not significant). Sites including Angelo’s Forest (AnF), Mahua Falls Forest (MaF), Malungung Forest (MuF), Abandoned Rubber Plantation (ARP), and Abandoned Agriculture Field (AAF) are displayed using different colors and symbols. Smaller symbols in the background of each bivariate plot represent raw data points (n = 10 per site), while larger symbols represent site means. Bars represent the standard error of mean and gray lines represent 95% confidence intervals. All statistical models are significant at p ≤ 0.05.
3.3 Relative influence of recovery time on ecosystem functions
3.3.1 Litter decomposition rate constant (k)
The random forest analysis explained 15.08% of the overall variance in k with N, pH, fungal diversity, bacterial diversity, and recovery time as the top five predictors (Figure 5A). k increased linearly with increasing soil N (p < 0.05, Adj. R2 = 0.22, Figure 5B), fungal (p ≤ 0.05, Adj. R2 = 0.22, Figure 5D), and bacterial diversity (p < 0.001, Adj. R2 = 0.19, Figure 5E). k peaked at a soil pH of ∼5 (p < 0.05, Adj. R2 = 0.13, Figure 5C) and increased with recovery time, saturating at ∼100 years (p < 0.05, Adj. R2 = 0.52, Supplementary Figure S7 in appendix).
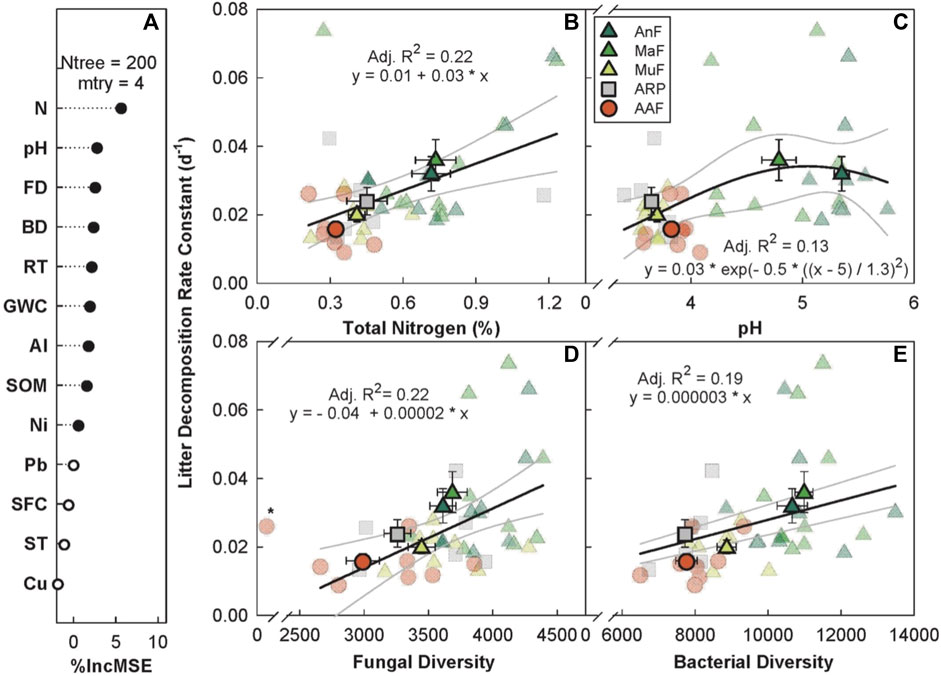
FIGURE 5. Variable importance prediction from random forest analysis (A) and bivariate relationships of the top four predictors of litter decomposition rate across a forest recovery gradient (B–E). Significant (filled circles) soil variables included in random forest analyses, in order of importance, are N (%), pH, fungal diversity (FD, Chao1 diversity index), bacterial diversity (BD, Chao1 diversity index), recovery time (RT, year), gravimetric water content (GWC, g g−1), Al (mg g−1), soil organic matter (SOM, %), and Ni (mg g−1). Sites including Angelo’s Forest (AnF), Mahua Falls Forest (MaF), Malungung Forest (MuF), Abandoned Rubber Plantation (ARP), and Abandoned Agriculture Field (AAF) are displayed using different colors and symbols. Smaller symbols in the background of each bivariate plot represent raw data points (n = 10 per site), while larger symbols represent site means. Bars represent the standard error of mean and gray lines represent 95% confidence intervals. All statistical models are significant at p ≤ 0.05.
3.3.2 Litter stabilization factor (S)
The random forest analysis explained 47.09% of the overall variance in S with recovery time as one of the top five predictors along with surrounding forest cover, bacterial diversity, and daytime soil temperature (Figures 6A–E). S increased with surrounding forest cover, saturating at ∼80% (p < 0.005, Adj. R2 = 0.63, Figure 6B), increased linearly with recovery time (p < 0.01, Adj. R2 = 0.14, Figure 6D), and showed a peaked response to bacterial diversity and increasing daytime soil temperature. S peaked at intermediate bacterial diversity (p < 0.001, Adj. R2 = 0.32, Figure 6C) and between 20°C–21°C (p < 0.001, Adj. R2 = 0.22, Figure 6E). All three naturally regenerating forests had higher mean S estimates (AnF = 0.239 ± 0.014, MaF = 0.245 ± 0.011, and MuF = 0.242 ± 0.017) than the abandoned rubber plantation (S = 0.070 ± 0.025) and agriculture (S = 0.201 ± 0.017) sites.
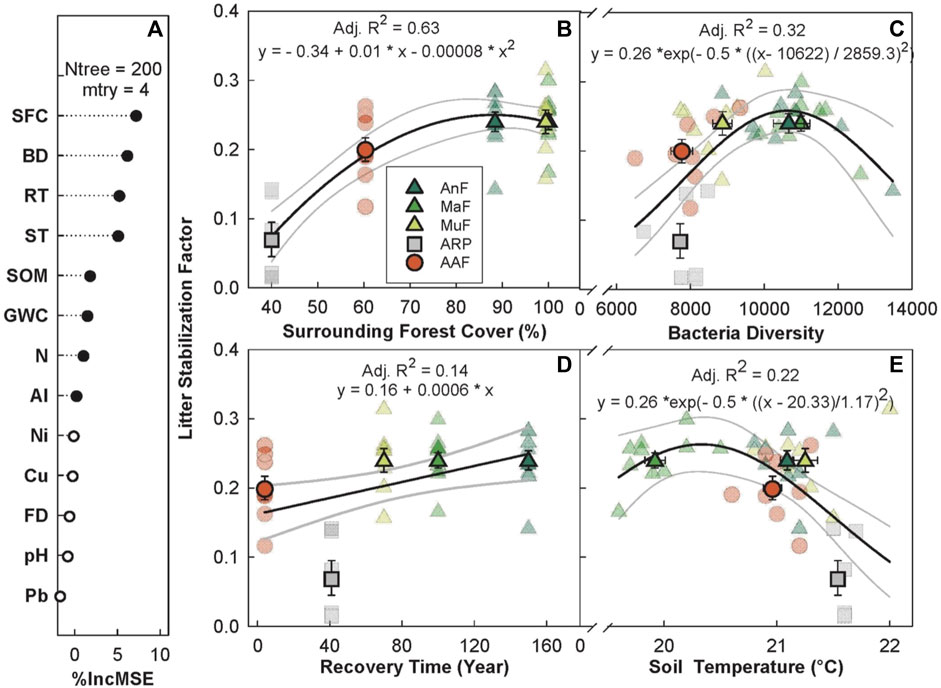
FIGURE 6. Variable importance prediction from random forest analysis (A) and bivariate relationships of the top four predictors of litter stabilization across a forest recovery gradient (B–E). Significant (filled circles) soil variables included in the random forest analysis, in order of importance, are surrounding forest cover (SFC, %), bacterial diversity (BD, Chao1 diversity index), recovery time (RT, year), daytime soil temperature (ST, °C), soil organic matter (SOM, %), GWC (gravimetric water content, g g−1), Ni (mg g−1), and Al (mg g−1). Sites including Angelo’s Forest (AnF), Mahua Falls Forest (MaF), Malungung Forest (MuF), Abandoned Rubber Plantation (ARP), and Abandoned Agriculture Field (AAF) are displayed using different colors and symbols. Smaller symbols in the background of each bivariate plot represent raw data points (n = 10 per site), while larger symbols represent site means. Bars represent the standard error of mean and gray lines represent 95% confidence intervals. All statistical models are significant at p ≤ 0.05.
3.4 Influence of microbial diversity on ecosystem functions
Looking at each site individually, we didn’t find significant relationships among bacterial diversity (k in Supplementary Figure S8, S in Supplementary Figure S9, in appendix) or fungal diversity (k in Supplementary Figure S10, S in Supplementary Figure S11, in appendix) and ecosystem functions. However, significant patterns emerged at the biome scale when all sites across the disturbance gradient were evaluated together. For example, k increased linearly with increasing bacterial diversity (Figure 5E, also shown as Supplementary Figure S8F, in appendix) and fungal diversity (Figure 5D, also shown as Supplementary Figure S10F, in appendix). S showed a peak response with bacterial diversity (Figure 6C, also shown as Supplementary Figure S9F, in appendix), while it had a weak positive linear response to fungal diversity (Supplementary Figure S11F, in appendix).
4 Discussion
Logging and forest conversion continue to craft the tropical montane landscape, yet we still have a limited understanding of its consequences to the global C cycle. In this study, we show strong links between forest regeneration and soil physicochemical properties, microbial diversity, and C cycling in a tropical montane region of Sabah, Borneo. We found that many of the physical and biological variables covary across this forest regeneration gradient and take 80–100 years to reach pre-disturbance levels; this highlights the vulnerability of these systems to forest conversion and logging.
4.1 Relative influence of recovery time on soil properties
4.1.1 Physicochemical properties
We compared soil properties at five sites across a forest recovery gradient (space-for-time substitution), with sites ranging from four to over 150 years of post-disturbance regeneration. As expected, recovery time significantly affected the soil physicochemical properties (Figure 2). Soil pH had the most significant change along the gradient, increasing from 3.7 at the youngest site (AAF) to 5.4 at the oldest site (AnF) (Figure 2A). This pH range is similar to the range reported by others across a forest disturbance gradient in Sabah, Borneo (Tripathi et al., 2016), and is consistent with findings in other tropical systems that reported lower pH after forest logging and conversion (Templer P. H. et al., 2005; Alele et al., 2014; Tripathi et al., 2016). Lower pH levels measured in recently recovered sites could be attributed to recent harvesting. For example, plants are capable of altering the pH of the rhizosphere and bulk soil through ion uptake. The removal of soil cations (e.g., calcium and magnesium) can lead to soil acidification when plant material is removed from a site during harvest (Rengel, 2003). Previous logging and cultivation of the sites may have resulted in a decrease in soil pH, with soil pH gradually increasing over time in older forests with organic matter decomposition (Allen, 1985).
We found that sulfur (Figure 2F) increased linearly, while SOM (Figure 2E), C content (Supplementary Figure S5B, in appendix), and C:N (Figure 2C) showed peaked responses with recovery time. Our results are consistent with prior work that reported higher concentrations of total soil C, N (Dinesh et al., 2003), and SOM (Templer P. H. et al., 2005) in forested sites compared to both agricultural and plantation sites, mainly attributed to a decrease in quantity and quality of plant residues returned to the soil. Though there is no information on how sulfur changes along a forest regeneration gradient, soil sulfur concentrations can be tightly coupled with total soil C content and SOM levels (Kirkby et al., 2011). Our results reflect this nutrient coupling, with the soil sulfur concentration increasing proportionally with soil C across the forest recovery gradient. Previous studies have observed significant losses of soil nutrients due to leaching (Brouwer and Riezebos, 1998), biomass removal (Martinelli et al., 2000; Olander et al., 2005), and altered nutrient allocation (Swinfield et al., 2020) associated with logging. The increased soil C pools and nutrients along this forest regeneration gradient might be due to the soil nutrient stocks rebuilding to pre-disturbance levels.
Given that rates of organic matter accumulation typically slow over time (Silver et al., 2000), the observed peaked relationships were not surprising. Percent SOM has been found to return to pre-disturbance levels within 40–50 years of succession in tropical forests (Brown and Lugo, 1990), however, others have observed this return in less than a decade (Templer P. H. et al., 2005). The recovery time required to accumulate organic matter in the soil is variable and can be affected by vegetation (i.e., quantity and quality of litter inputs), abiotic and biotic soil properties (i.e., soil texture and microbial activity), and land use history (Post and Kwon, 2000). Additionally, inherent differences among our forested sites in terms of their soil textures and terrains (the oldest site, AnF, had rocky terrain) could have resulted in the high variability and lower amounts of SOM at AnF as compared to MaF. Similar to soil C and SOM, C:N peaked at ∼100 years and subsequently declined at the oldest site (Figure 2C), due to the combined effects of total soil C decreasing and total soil N increasing (Supplementary Figure S5, in appendix). Nitrogen fixing organisms, particularly microbial plant symbionts, are considered an important source of new N in tropical soils (Gehring et al., 2005). Some late-successional plant species have higher leaf N content, with correspondingly high soil N content, as compared with early-successional forests (Yan et al., 2006). Greater N content in litter could result in enhanced decomposition rates, driving soil C and SOM levels down.
Soil texture also changed significantly along the recovery gradient; % sand increased until around 100-years post-recovery (Figure 2B). Fine particles can be lost from soil following disturbance events such as tillage due to erosion and runoff, leaving a higher percentage of larger particles such as sand (Brady and Weil, 2017). Our results contradict these findings and could be a result of several factors including variation in soil parent material and natural erosion patterns. While we identified no effects of recovery time on soil microclimate, we found a decrease in daytime soil temperature with increasing forest cover (Supplementary Figure S4, in appendix). Removal of the forest canopy during logging events increases daytime soil temperature (Yashiro et al., 2008), and reforestation can have significant surface cooling effects (Novick and Katul, 2020).
4.1.2 Bacterial diversity
Our results show that bacterial diversity increased linearly with recovery time (Figure 3C), which is consistent with prior studies that found an increase in microbial diversity with stand age (Wallander et al., 2010; Zhu et al., 2010). While previous work has reported a peak in bacterial diversity at ∼40-years post-disturbance in a subtropical secondary forest (Zhu et al., 2010), our study showed no decline in bacterial diversity with recovery time. We also found that the surrounding forest cover is a significant predictor of bacterial diversity (Figure 3D).
The lowest bacterial diversity was found in the landscapes dominated by human activities (ARP and AAF), evident from the existence of social trails, grazing (AAF), greater amount of exposed soil, and the proximity to inhabited areas. The three naturally regenerated forested sites (MuF, MaF, and AnF) were relatively undisturbed and surrounded by a large tropical forest buffer. Previous research suggests that anthropogenic disturbances such as conversion to pasture or plantation can induce biotic homogenization (Devictor et al., 2008; Lôbo et al., 2011) of the soil bacterial community, leading to the loss of some more endemic taxa and to the broader dispersal of the existing taxa within a site (Rodrigues et al., 2013; Alele et al., 2014). This pattern is also supported by our findings that the naturally forested sites showed the highest variation along their transects for several soil properties, including pH, SOM, and total C content. Associated losses of endemic taxa are likely to be better quantified by the Chao1 diversity index, used in this study, as it is weighted by rare taxa.
Soil pH was the top predictor of bacterial diversity (Figure 3B), consistent with previous work in the tropics (Tripathi et al., 2012; Tripathi et al., 2016), temperate forests, grasslands (Fierer and Jackson, 2006; Bahram et al., 2018; Malik et al., 2018), and alpine meadows (Shen et al., 2019). Bacterial diversity peaked at a pH of ∼5; this is a consistent pattern in other forested systems (Tripathi et al., 2012; Kaiser et al., 2016), but peak diversity occurred at a pH of ∼7 in one of these studies (Tripathi et al., 2012). Bacteria are known to experience physiological constraints at extreme pH levels and optimum soil pH varies among bacterial taxa (Tripathi et al., 2012). However, the intracellular pH of bacteria is often close to neutral (Slonczewski et al., 1981; Krulwich et al., 2011), and a more extreme external pH may place stress on bacterial cells (Lauber et al., 2009). Bacterial diversity may also be indirectly affected by pH through its effect on the availability of various soil nutrients (Lauber et al., 2009; Tripathi et al., 2012).
SOM is the fourth most important predictor of bacterial diversity, showing a saturating response of bacterial diversity at ∼6% SOM (Figure 3E). Soil bacterial communities rely on the decomposition of organic matter for energy (Trivedi et al., 2013), and SOM has previously been identified as one of the main drivers of soil bacterial diversity on a global scale (Tian et al., 2018).
4.1.3 Fungal diversity
We found that fungal diversity increased significantly with recovery time up until ∼100 years (Figure 4B), which is consistent with prior studies that found an increase in microbial diversity with stand age (Wallander et al., 2010; Zhu et al., 2010). This increase in microbial diversity over time may reflect spatial heterogeneity in accumulation of SOM (Klein et al., 1995) or increased variability in litter quality and quantity as a result of changes in plant diversity (Zhu et al., 2010) as forests mature. Soil disturbance and homogenization from tillage and logging can negatively impact fungal communities (Brinkmann et al., 2019). As mentioned earlier, disturbed sites, AAF and ARP, showed lower variation along the transect for several soil parameters including pH, SOM, and total C content. These findings suggest that the sites incurred resource homogenization during forest clearing, cultivation, and continued anthropogenic disturbance. Many fungal species (e.g., namely ectomycorrhizal fungi), are plant-symbionts and often exhibit strong host tree preference (Tedersoo et al., 2008). Thus, the alteration of tree species composition and abundance can also have direct effects upon fungal community structure and diversity (Gao et al., 2013). While we didn’t document forest composition, we did find that the current surrounding forest cover (i.e., cover by a mature tree canopy) is a significant predictor of fungal diversity, with AAF and ARP exhibiting the lowest levels of fungal diversity, and mature forests (AnF and MaF) exhibiting higher fungal diversity (Figure 4C).
Future studies in this region, relating plant community cover, composition, and root structure to the relative abundance of fungal taxa, would aid in establishing these linkages. The random forest analysis explained only 18.69% of variation in fungal diversity. The lack of strong direct ties between fungal diversity and soil physicochemical properties, in contrast to bacterial diversity that showed strong links to soil properties and recovery time, could be tied to the fungal scale of operation; fungal hyphae can access a larger volume of soil, making fungi more able to survive in a variety of soil conditions, while bacteria are more heavily impacted by local substrate and nutrient availability (Zheng et al., 2019). Of the physicochemical properties evaluated we found that soil pH (Figure 4D) and soil aluminum concentrations (Figure 4E), which were negatively correlated with each other (|r| = 0.66), were the strongest predictors of fungal diversity. Although similar results have been found in previous studies (Zheng et al., 2019) these relationships are often weaker (Lauber et al., 2008; Zheng et al., 2019) than those between soil pH and bacterial community composition and diversity (Fierer and Jackson, 2006; Lauber et al., 2009; Tripathi et al., 2012; Tripathi et al., 2016).
4.2 Relative influence of recovery time on ecosystem functions
4.2.1 Litter decomposition rate constant (k)
Our results suggest that soil N (Figure 5B) and pH (Figure 5C) were significant predictors of k. Because microbially mediated litter decomposition is generally thought to be nutrient limited (Crews et al., 1995), it is likely that increases in nutrient levels in these ecosystems increased k. These results are consistent with a previous meta-analysis (Knorr et al., 2005) that found that N addition often increased decomposition of high-quality litter. k was also related to recovery time, saturating quickly at ∼40 years (Supplementary Figure S7, in appendix). During litter decomposition, some labile plant tissues are microbially and biochemically transformed into recalcitrant, stable compounds. The diversion of labile plant tissues, which would otherwise decompose, into stabilized organic matter builds upon humus pools, thereby sequestering more C in the soil (Prescott, 2010).
4.2.2 Litter stabilization factor (S)
S increased linearly with recovery time (Figure 6D) and showed a saturating response to surrounding forest cover (Figure 6B), reaching a maximum at ∼ 90% cover in the older forests (AnF and MaF). Previous studies have found that the presence/absence of woody vegetation (Sarneel et al., 2020) can affect C turnover. It is likely that increased forest cover and live root mass in older sites protected the litter bags from decomposition and led to higher stabilization. The three forested sites (AnF, MaF, and MuF) had the highest S followed by AAF, and ARP. The youngest site (AAF) had relatively low tree cover, but had a dense herbaceous understory that could have provided some physical protection to the soil, an effect that has been previously documented in fallow land in tropical montane regions (Ribolzi et al., 2017). The ARP site on the other hand, had a considerable amount of exposed soil both beneath the tree cover and in the surrounding area. Possible mechanisms for litter stabilization include the formation of a specialized microbial community with distinct stabilizing capabilities (Keiser et al., 2011), the addition of a more preferential microbial energy source through root exudates (Sparling et al., 1982), the increased input of recalcitrant root tissue, the physical protection of organic matter by the formation of soil aggregates (Prescott, 2010), and reduced erosion and leaching (Ribolzi et al., 2017).
4.2.3 Comparison with the global data
Our results match the global pattern (Keuskamp et al., 2013) of the relationship between the litter decomposition rate constant (k, d−1) and the litter stabilization factor (S, unitless) (Supplementary Figure S6 in appendix). The litter decomposed faster in the two old growth forests (AnF = 0.032 and MaF = 0.036 d−1), and k values were comparable to the other lowland tropical forests from global data. All three naturally regenerating forests showed relatively high S (AnF = 0.239, MaF = 0.245, and MuF = 0.242) similar to mixed and birch forests from global dataset. Interestingly, the younger natural forest (MuF) closely matched the agriculture (AAF) site with intermediate k (MuF = 0.020, AAF = 0.016 d−1) and relatively high S (MuF = 0.242, AAF = 0.201). Contrastingly, the rubber plantation (ARP) had a low S (0.070) similar to the lowland tropical forest, coupled with an intermediate k (0.024 d−1), placing it near the geothermal wet grassland ecosystem within the global dataset.
4.3 Influence of microbial diversity on ecosystem functions
Soil microbial communities are one of the main drivers of soil C cycling through processes such as litter decomposition and stabilization (Schimel and Schaeffer, 2012). Previous studies connecting microbial diversity to C cycling have found mixed results. For example, some have found little to no effect of microbial diversity on litter decomposition (Griffiths et al., 2000b), while others have found positive relationships between the two (Maron et al., 2018). When evaluating sites individually we found no significant relationships between microbial diversity metrics and ecosystem functions (Supplementary Figures S8–S11, in appendix). However, patterns emerged at the biome scale. For example, we found that k increased linearly with increasing fungal diversity (Figure 5D, also shown as Supplementary Figure S10F, in appendix) and bacterial diversity (Figure 5E, also shown as Supplementary Figure S8F, in appendix). These results suggest a structural metric, such as microbial diversity, can be used as an indicator of functional shifts in the tropical montane systems. Our findings contribute insights into the current debate about diversity versus functional redundancy (Giller et al., 1996); they suggest that reduced microbial diversity results in a reduction of functional capabilities in the soil. Changes in microbial growth efficiency, or the ability of the microbial community to incorporate substrates into biomass and byproducts, can alter litter transformation rates (Six et al., 2006). Our data matched the global patterns of litter decomposition and stabilization, but both processes were decoupled unlike the global data which showed an inverse relationship between k and S (Keuskamp et al., 2013) (Supplementary Figure S6, in appendix).
Conclusion
Considering the rapid rate of deforestation in the tropics and microbial role in nutrient cycling, it is critical to investigate how logging and forest conversion affect soil microbial structure and functions in these systems. Our results suggest that logging and forest conversion significantly affect soil microbial diversity and can have prolonged effects on C cycling in tropical montane forests. Considering the potential global impacts of land-use on the terrestrial C cycle in one of the most productive biomes on Earth, these results have wide implications for land management and biodiversity conservation.
Data availability statement
The datasets presented in this study can be found in online repositories. The names of the repository/repositories and accession number(s) can be found below: https://datadryad.org/stash, https://doi.org/10.5061/dryad.0vt4b8h1t.
Author contributions
KN and JM designed the study; MF collaborated with private landowners for land access and selected sites across a gradient of land use disturbance; RS, JM, AR, JG, and KN conducted field work; DW conducted soil physicochemical analysis; RS analyzed the data with assistance from KN; RS and KN wrote the manuscript with assistance from JM, and JS; all authors approved the paper.
Funding
The NSF IRES grants (1658711, 1658722) funded this study, and the data was collected under the Licence Ref. No. [access: #JKM/MBS.1000-2/2 JLD.6(49) and export: #JKM/MBS.1000-2/3 JLD.3(41)] from the Sabah Biodiversity Council.
Acknowledgments
We thank community members for providing access to their land and helping with logistics. We thank Joumin Rangkasan for assistance in the field and Drs. Tigga Kingston, Robin Verble, and Sarah Fritts for helping with the travel and logistics of IRES related activities. DCW gratefully acknowledges the BL Allen Endowment in Pedology at Texas Tech University in conducting this research. We acknowledge support from the Open Access Publishing Fund administered through the University of Arkansas Libraries.
Conflict of interest
The authors declare that the research was conducted in the absence of any commercial or financial relationships that could be construed as a potential conflict of interest.
Publisher’s note
All claims expressed in this article are solely those of the authors and do not necessarily represent those of their affiliated organizations, or those of the publisher, the editors and the reviewers. Any product that may be evaluated in this article, or claim that may be made by its manufacturer, is not guaranteed or endorsed by the publisher.
Supplementary material
The Supplementary Material for this article can be found online at: https://www.frontiersin.org/articles/10.3389/fenvs.2022.853686/full#supplementary-material
References
Alele, P. O., Sheil, D., Surget-Groba, Y., Lingling, S., and Cannon, C. H. (2014). How does conversion of natural tropical rainforest ecosystems affect soil bacterial and fungal communities in the Nile River watershed of Uganda? PLoS ONE 9, e104818. doi:10.1371/journal.pone.0104818
Allen, J. C. (1985). Soil response to forest clearing in the United States and the tropics: Geological and biological factors. Biotropica 17, 15–27. doi:10.2307/2388373
Arnold, A. E., and Lutzoni, F. (2007). Diversity and host range of foliar fungal endophytes: Are tropical leaves biodiversity hotspots? Ecology 88, 541–549. doi:10.1890/05-1459
Bahram, M., Hildebrand, F., Forslund, S. K., Anderson, J. L., Soudzilovskaia, N. A., Bodegom, P. M., et al. (2018). Structure and function of the global topsoil microbiome. Nature 560, 233–237. doi:10.1038/s41586-018-0386-6
Barlow, J., Lennox, G. D., Ferreira, J., Berenguer, E., Lees, A. C., Nally, R. M., et al. (2016). Anthropogenic disturbance in tropical forests can double biodiversity loss from deforestation. Nature 535, 144–147. doi:10.1038/nature18326
Barnes, A. D., Jochum, M., Mumme, S., Haneda, N. F., Farajallah, A., Widarto, T. H., et al. (2014). Consequences of tropical land use for multitrophic biodiversity and ecosystem functioning. Nat. Commun. 5, 5351. doi:10.1038/ncomms6351
Brady, N. C., and Weil, R. R. (2017). The nature and properties of soils. 15th ed. Upper Saddle River, New Jersey, USA: Pearson Education.
Brinkmann, N., Schneider, D., Sahner, J., Ballauff, J., Edy, N., Barus, H., et al. (2019). Intensive tropical land use massively shifts soil fungal communities. Sci. Rep. 9, 3403. doi:10.1038/s41598-019-39829-4
Brouwer, L. C., and Riezebos, H. Th. (1998). “Nutrient dynamics in intact and logged tropical rain forest in Guyana,” in Soils of tropical forest ecosystems. Editors A. Schulte, and D. Ruhiyat (Berlin, Heidelberg: Springer), 73–86.
Brown, S., and Lugo, A. E. (1990). Tropical secondary forests. J. Trop. Ecol. 6, 1–32. doi:10.1017/s0266467400003989
Carvalho, T. S. de, Jesus, E. da C., Barlow, J., Gardner, T. A., Soares, I. C., Tiedje, J. M., et al. (2016). Land use intensification in the humid tropics increased both alpha and beta diversity of soil bacteria. Ecology 97, 2760–2771. doi:10.1002/ecy.1513
Chao, A., Ma, K. H., Hsieh, T. C., and Chiu, C.-H. (2016). SpadeR: Species-Richness prediction and diversity estimation with R. 0.1.1. Available at: https://CRAN.R-project.org/package=SpadeR (Accessed April 12, 2020).
W. Chesworth (Editor) (2008). Encyclopedia of soil science (Netherlands: Springer). Available at: https://www.springer.com/gp/book/9781402039942 (Accessed May 10, 2020).
Crews, T. E., Kitayama, K., Fownes, J. H., Riley, R. H., Herbert, D. A., Mueller-Dombois, D., et al. (1995). Changes in soil phosphorus fractions and ecosystem dynamics across a long chronosequence in Hawaii. Ecology 76, 1407–1424. doi:10.2307/1938144
Cutler, A., and Wiener, M. (2018). Randomforest: Breiman and cutler’s random forests for classification and regression. 4.6-14. Available at: https://CRAN.R-project.org/package=randomForest (Accessed April 12, 2020).
DeFries, R. S., Houghton, R. A., Hansen, M. C., Field, C. B., Skole, D., and Townshend, J. (2002). Carbon emissions from tropical deforestation and regrowth based on satellite observations for the 1980s and 1990s. Proc. Natl. Acad. Sci. U. S. A. 99, 14256–14261. doi:10.1073/pnas.182560099
Devictor, V., Julliard, R., Clavel, J., Jiguet, F., Lee, A., and Couvet, D. (2008). Functional biotic homogenization of bird communities in disturbed landscapes. Glob. Ecol. Biogeogr. 17, 252–261. doi:10.1111/j.1466-8238.2007.00364.x
Dinesh, R., Ghoshal Chaudhuri, S., Ganeshamurthy, A. N., and Dey, C. (2003). Changes in soil microbial indices and their relationships following deforestation and cultivation in wet tropical forests. Appl. Soil Ecol. 24, 17–26. doi:10.1016/S0929-1393(03)00070-2
Dirzo, R., and Raven, P. H. (2003). Global state of biodiversity and loss. Annu. Rev. Environ. Resour. 28, 137–167. doi:10.1146/annurev.energy.28.050302.105532
Dormann, C. F., Elith, J., Bacher, S., Buchmann, C., Carl, G., Carré, G., et al. (2013). Collinearity: A review of methods to deal with it and a simulation study evaluating their performance. Ecography 36, 27–46. doi:10.1111/j.1600-0587.2012.07348.x
Dowd, S. E., Callaway, T. R., Wolcott, R. D., Sun, Y., McKeehan, T., Hagevoort, R. G., et al. (2008). Evaluation of the bacterial diversity in the feces of cattle using 16S rDNA bacterial tag-encoded FLX amplicon pyrosequencing (bTEFAP). BMC Microbiol. 8, 125. doi:10.1186/1471-2180-8-125
Fierer, N., and Jackson, R. B. (2006). The diversity and biogeography of soil bacterial communities. Proc. Natl. Acad. Sci. U. S. A. 103, 626–631. doi:10.1073/pnas.0507535103
Gao, C., Shi, N.-N., Liu, Y.-X., Peay, K. G., Zheng, Y., Ding, Q., et al. (2013). Host plant genus-level diversity is the best predictor of ectomycorrhizal fungal diversity in a Chinese subtropical forest. Mol. Ecol. 22, 3403–3414. doi:10.1111/mec.12297
Gee, G. W., and Bauder, J. W. (2018). “Particle-size analysis,” in Methods of soil analysis (John Wiley & Sons), 383–411. doi:10.2136/sssabookser5.1.2ed.c15
Gehring, C., Vlek, P. L. G., de Souza, L. A. G., and Denich, M. (2005). Biological nitrogen fixation in secondary regrowth and mature rainforest of central Amazonia. Agric. Ecosyst. Environ. 111, 237–252. doi:10.1016/j.agee.2005.06.009
Giller, K. E., Beare, M. H., Lavelle, P., Izac, A.-M. N., and Swift, M. J. (1996). Agriculture intensification, soil biodiversity and agroecosystem. App Soil Ecol. 6, 3–16.
Goff, K., Schaetzl, R. J., Chakraborty, S., Weindorf, D. C., Kasmerchak, C., and Bettis, E. A. (2020). Impact of sample preparation methods for characterizing the geochemistry of soils and sediments by portable X-ray fluorescence. Soil Sci. Soc. Am. J. 84, 131–143. doi:10.1002/saj2.20004
Griffiths, B. S., Ritz, K., Bardgett, R. D., Cook, R., Christensen, S., Ekelund, F., et al. (2000a). Ecosystem response of pasture soil communities to fumigation-induced microbial diversity reductions: An examination of the biodiversity–ecosystem function relationship. Oikos 90, 279–294. doi:10.1034/j.1600-0706.2000.900208.x
Griffiths, B. S., Ritz, K., Bardgett, R. D., Cook, R., Christensen, S., Ekelund, F., et al. (2000b). Ecosystem response of pasture soil communities to fumigation-induced microbial diversity reductions: An examination of the biodiversity–ecosystem function relationship. Oikos 90, 279–294. doi:10.1034/j.1600-0706.2000.900208.x
Hansen, M. C., Stehman, S. V., Potapov, P. V., Loveland, T. R., Townshend, J. R. G., DeFries, R. S., et al. (2008). Humid tropical forest clearing from 2000 to 2005 quantified by using multitemporal and multiresolution remotely sensed data. Proc. Natl. Acad. Sci. U. S. A. 105, 9439–9444. doi:10.1073/pnas.0804042105
Kaiser, K., Wemheuer, B., Korolkow, V., Wemheuer, F., Nacke, H., Schöning, I., et al. (2016). Driving forces of soil bacterial community structure, diversity, and function in temperate grasslands and forests. Sci. Rep. 6, 33696. doi:10.1038/srep33696
Keiser, A. D., Strickland, M. S., Fierer, N., and Bradford, M. A. (2011). The effect of resource history on the functioning of soil microbial communities is maintained across time. Biogeosciences 8, 1477–1486. doi:10.5194/bg-8-1477-2011
Kerfahi, D., Tripathi, B. M., Lee, J., Edwards, D. P., and Adams, J. M. (2014). The impact of selective-logging and forest clearance for oil palm on fungal communities in Borneo. PLOS ONE 9, e111525. doi:10.1371/journal.pone.0111525
Keuskamp, J. A., Dingemans, B. J. J., Lehtinen, T., Sarneel, J. M., and Hefting, M. M. (2013). Tea bag index: A novel approach to collect uniform decomposition data across ecosystems. Methods Ecol. Evol. 4, 1070–1075. doi:10.1111/2041-210X.12097
Kirkby, C. A., Kirkegaard, J. A., Richardson, A. E., Wade, L. J., Blanchard, C., and Batten, G. (2011). Stable soil organic matter: A comparison of C:N:P:S ratios in Australian and other world soils. Geoderma 163, 197–208. doi:10.1016/j.geoderma.2011.04.010
Klein, D. A., McLendon, T., Paschke, M. W., and Redente, E. F. (1995). Saprophytic fungal-bacterial biomass variations in successional communities of a semi-arid steppe ecosystem. Biol. Fertil. Soils 19, 253–256. doi:10.1007/BF00336168
Knorr, M., Frey, S. D., and Curtis, P. S. (2005). Nitrogen additions and litter decomposition: A meta-analysis. Ecology 86, 3252–3257. doi:10.1890/05-0150
Krulwich, T. A., Sachs, G., and Padan, E. (2011). Molecular aspects of bacterial pH sensing and homeostasis. Nat. Rev. Microbiol. 9, 330–343. doi:10.1038/nrmicro2549
Lauber, C. L., Hamady, M., Knight, R., and Fierer, N. (2009). Pyrosequencing-based assessment of soil pH as a predictor of soil bacterial community structure at the continental scale. Appl. Environ. Microbiol. 75, 5111–5120. doi:10.1128/AEM.00335-09
Lauber, C. L., Strickland, M. S., Bradford, M. A., and Fierer, N. (2008). The influence of soil properties on the structure of bacterial and fungal communities across land-use types. Soil Biol. Biochem. 40, 2407–2415. doi:10.1016/j.soilbio.2008.05.021
Lee-Cruz, L., Edwards, D. P., Tripathi, B. M., and Adams, J. M. (2013). Impact of logging and forest conversion to oil palm plantations on soil bacterial communities in Borneo. Appl. Environ. Microbiol. 79, 7290–7297. doi:10.1128/AEM.02541-13
Lôbo, D., Leão, T., Melo, F. P. L., Santos, A. M. M., and Tabarelli, M. (2011). Forest fragmentation drives Atlantic forest of northeastern Brazil to biotic homogenization. Divers. Distrib. 17, 287–296. doi:10.1111/j.1472-4642.2010.00739.x
Maharjan, M., Sanaullah, M., Razavi, B. S., and Kuzyakov, Y. (2017). Effect of land use and management practices on microbial biomass and enzyme activities in subtropical top-and sub-soils. Appl. Soil Ecol. 113, 22–28. doi:10.1016/j.apsoil.2017.01.008
Malik, A. A., Puissant, J., Buckeridge, K. M., Goodall, T., Jehmlich, N., Chowdhury, S., et al. (2018). Land use driven change in soil pH affects microbial carbon cycling processes. Nat. Commun. 9, 3591. doi:10.1038/s41467-018-05980-1
Maron, P.-A., Sarr, A., Kaisermann, A., Lévêque, J., Mathieu, O., Guigue, J., et al. (2018). High microbial diversity promotes soil ecosystem functioning. Appl. Environ. Microbiol. 84, 17. doi:10.1128/AEM.02738-17
Martinelli, L. A., Almeida, S., Brown, I. F., Moreira, M. Z., Victoria, R. L., Filoso, S., et al. (2000). Variation in nutrient distribution and potential nutrient losses by selective logging in a humid tropical forest of rondonia, Brazil1. Biotropica 32, 597–613. doi:10.1111/j.1744-7429.2000.tb00507.x
McGrath, D. A., Duryea, M. L., and Cropper, W. P. (2001). Soil phosphorus availability and fine root proliferation in Amazonian agroforests 6 years following forest conversion. Agric. Ecosyst. Environ. 83, 271–284. doi:10.1016/S0167-8809(00)00176-6
Meijide, A., Badu, C. S., Moyano, F., Tiralla, N., Gunawan, D., and Knohl, A. (2018). Impact of forest conversion to oil palm and rubber plantations on microclimate and the role of the 2015 ENSO event. Agric. For. Meteorology 252, 208–219. doi:10.1016/j.agrformet.2018.01.013
Melillo, J. M., McGuire, A. D., Kicklighter, D. W., Moore, B., Vorosmarty, C. J., and Schloss, A. L. (1993). Global climate change and terrestrial net primary production. Nature 363, 234–240. doi:10.1038/363234a0
Mendes, L. W., Tsai, S. M., Navarrete, A. A., de Hollander, M., van Veen, J. A., and Kuramae, E. E. (2015). Soil-borne microbiome: Linking diversity to function. Microb. Ecol. 70, 255–265. doi:10.1007/s00248-014-0559-2
Novick, K. A., and Katul, G. G. (2020). The duality of reforestation impacts on surface and air temperature. JGR. Biogeosciences 125, e2019JG005543. doi:10.1029/2019JG005543
Okuda, T., Suzuki, M., Adachi, N., Quah, E. S., Hussein, N. A., and Manokaran, N. (2003). Effect of selective logging on canopy and stand structure and tree species composition in a lowland dipterocarp forest in peninsular Malaysia. For. Ecol. Manag. 175, 297–320. doi:10.1016/S0378-1127(02)00137-8
Olander, L. P., Bustamante, M. M., Asner, G. P., Telles, E., Prado, Z., and Camargo, P. B. (2005). Surface soil changes following selective logging in an eastern Amazon forest. Earth Interact. 9, 1–19. doi:10.1175/EI135.1
Pan, Y. D., Birdsey, R. A., Phillips, O. L., and Jackson, R. B. (2013). The structure, distribution, and biomass of the world’s forests. Annu. Rev. Ecol. Evol. Syst. 44, 593–622. doi:10.1146/annurev-ecolsys-110512-135914
Parece, T., Campbell, J., and McGee, J. (2014). Remote sensing in an arcmap environment. Available at: https://www.virginiaview.cnre.vt.edu/tutorial/RS_in_ArcGIS_AllChapters.pdf.[Accessed December 1, 2019].
Pinard, M. A., and Cropper, W. P. (2000). Simulated effects of logging on carbon storage in dipterocarp forest. J. Appl. Ecol. 37, 267–283. doi:10.1046/j.1365-2664.2000.00488.x
Post, W. M., and Kwon, K. C. (2000). Soil carbon sequestration and land-use change: Processes and potential. Glob. Chang. Biol. 6, 317–327. doi:10.1046/j.1365-2486.2000.00308.x
Prescott, C. E. (2010). Litter decomposition: What controls it and how can we alter it to sequester more carbon in forest soils? Biogeochemistry 101, 133–149. doi:10.1007/s10533-010-9439-0
R Core Team (2017). R: A language and environment for statistical computing. Vienna, Austria: R Foundation for Statistical Computing. Available at: https://www.R-project.org/.
Ribolzi, O., Evrard, O., de Rouw, A., Silvera, N., Latsachack, K. O., Soulileuth, B., et al. (2017). From shifting cultivation to teak plantation: Effect on overland flow and sediment yield in a montane tropical catchment. Sci. Rep. 7, 3987. doi:10.1038/s41598-017-04385-2
Rodrigues, J. L. M., Pellizari, V. H., Mueller, R., Baek, K., Jesus, E. d. C., Paula, F. S., et al. (2013). Conversion of the Amazon rainforest to agriculture results in biotic homogenization of soil bacterial communities. Proc. Natl. Acad. Sci. U. S. A. 110, 988–993. doi:10.1073/pnas.1220608110
Salinity Laboratory Staff (1954). Diagnosis and improvement of saline and alkali soils. Washington, DC, USA: US Department of Agriculture.
Sarneel, J. M., Sundqvist, M. K., Molau, U., Björkman, M. P., and Alatalo, J. M. (2020). Decomposition rate and stabilization across six tundra vegetation types exposed to >20 years of warming. Sci. Total Environ. 724, 138304. doi:10.1016/j.scitotenv.2020.138304
Schimel, J., and Schaeffer, S. M. (2012). Microbial control over carbon cycling in soil. Front. Microbiol. 3, 348. doi:10.3389/fmicb.2012.00348
Schulte, E. E., and Hoskins, B. (2011). “Recommended soil organic matter tests,” in Recommended soil testing procedures for the northeastern United States northeast regional bulletin. Editors J. T. Sims, and A. Wolf (Newark, DE: Agricultural Experiment Station, University of Delaware), 63–74.
Setälä, H., Marshall, V. G., and Trofymow, J. A. (1996). Influence of body size of soil fauna on litter decomposition and 15N uptake by poplar in a pot trial. Soil Biol. Biochem. 28, 1661–1675. doi:10.1016/S0038-0717(96)00252-0
Shen, C., Shi, Y., Fan, K., He, J.-S., Adams, J. M., Ge, Y., et al. (2019). Soil pH dominates elevational diversity pattern for bacteria in high elevation alkaline soils on the Tibetan Plateau. FEMS Microbiol. Ecol. 95. doi:10.1093/femsec/fiz003
Silver, W. L., Ostertag, R., and Lugo, A. E. (2000). The potential for carbon sequestration through reforestation of abandoned tropical agricultural and pasture lands. Restor. Ecol. 8, 394–407. doi:10.1046/j.1526-100x.2000.80054.x
Six, J., Frey, S. D., Thiet, R. K., and Batten, K. M. (2006). Bacterial and fungal contributions to carbon sequestration in agroecosystems. Soil Sci. Soc. Am. J. 70, 555–569. doi:10.2136/sssaj2004.0347
Slonczewski, J. L., Rosen, B. P., Alger, J. R., and Macnab, R. M. (1981). pH homeostasis in Escherichia coli: measurement by 31P nuclear magnetic resonance of methylphosphonate and phosphate. Proc. Natl. Acad. Sci. U. S. A. 78, 6271–6275. doi:10.1073/pnas.78.10.6271
Sparling, G. P., Cheshire, M. V., and Mundie, C. M. (1982). Effect of barley plants on the decomposition of 14C-labelled soil organic matter. J. Soil Sci. 33, 89–100. doi:10.1111/j.1365-2389.1982.tb01750.x
Swinfield, T., Both, S., Riutta, T., Bongalov, B., Elias, D., Majalap‐Lee, N., et al. (2020). Imaging spectroscopy reveals the effects of topography and logging on the leaf chemistry of tropical forest canopy trees. Glob. Chang. Biol. 26, 989–1002. doi:10.1111/gcb.14903
Tedersoo, L., Jairus, T., Horton, B. M., Abarenkov, K., Suvi, T., Saar, I., et al. (2008). Strong host preference of ectomycorrhizal fungi in a Tasmanian wet sclerophyll forest as revealed by DNA barcoding and taxon-specific primers. New Phytol. 180, 479–490. doi:10.1111/j.1469-8137.2008.02561.x
Templer, P. H., Groffman, P. M., Flecker, A. S., and Power, A. G. (2005a). Land use change and soil nutrient transformations in the Los Haitises region of the Dominican Republic. Soil Biol. Biochem. 37, 215–225. doi:10.1016/j.soilbio.2004.07.031
Templer, P., Lovett, G., Weathers, K., Findlay, S., and Dawson, T. E. (2005b)., 8. New York, USA, 1–16. doi:10.1007/s10021-004-0230-8Influence of tree species on forest nitrogen retention in the catskill mountains, New York, USAEcosystems
Tian, J., He, N., Hale, L., Niu, S., Yu, G., Liu, Y., et al. (2018). Soil organic matter availability and climate drive latitudinal patterns in bacterial diversity from tropical to cold temperate forests. Funct. Ecol. 32, 61–70. doi:10.1111/1365-2435.12952
Tjia, H. D. (2007). Kundasang (Sabah) at the intersection of regional fault zones of Quaternary age. BGSM 53, 59–66. doi:10.7186/bgsm53200710
Tripathi, B., Edwards, D., Mendes, L., Kim, M., Dong, K., Kim, H., et al. (2016). The impact of tropical forest logging and oil palm agriculture on the soil microbiome. Mol. Ecol. 25, 2244–2257. doi:10.1111/mec.13620
Tripathi, B. M., Kim, M., Singh, D., Lee-cruz, L., Lai-hoe, A., Ainuddin, A. N., et al. (2012). Tropical soil bacterial communities in Malaysia: pH dominates in the equatorial tropics too. Microb. Ecol. 64, 474–484. doi:10.1007/s00248-012-0028-8
Trivedi, P., Anderson, I. C., and Singh, B. K. (2013). Microbial modulators of soil carbon storage: Integrating genomic and metabolic knowledge for global prediction. Trends Microbiol. 21, 641–651. doi:10.1016/J.TIM.2013.09.005
Waldrop, M. P., Balser, T. C., and Firestone, M. K. (2000). Linking microbial community composition to function in a tropical soil. Soil Biol. Biochem. 32, 1837–1846. doi:10.1016/S0038-0717(00)00157-7
Wallander, H., Johansson, U., Sterkenburg, E., Durling, M. B., and Lindahl, B. D. (2010). Production of ectomycorrhizal mycelium peaks during canopy closure in Norway spruce forests. New Phytol. 187, 1124–1134. doi:10.1111/j.1469-8137.2010.03324.x
Wei, T., and Simko, V. (2017). R package “corrplot”: Visualization of a correlation matrix. Available at: https://github.com/taiyun/corrplot.
Whitman, W. B., Coleman, D. C., and Wiebe, W. J. (1998). Prokaryotes: The unseen majority. Proc. Natl. Acad. Sci. U. S. A. 95, 6578–6583. doi:10.1073/pnas.95.12.6578
Yan, E.-R., Wang, X.-H., and Huang, J.-J. (2006). Shifts in plant nutrient use strategies under secondary forest succession. Plant Soil 289, 187–197. doi:10.1007/s11104-006-9128-x
Yashiro, Y., Kadir, W. R., Okuda, T., and Koizumi, H. (2008). The effects of logging on soil greenhouse gas (CO2, CH4, N2O) flux in a tropical rain forest, Peninsular Malaysia. Agric. For. Meteorology 148, 799–806. doi:10.1016/j.agrformet.2008.01.010
Zheng, Q., Hu, Y., Zhang, S., Noll, L., Böckle, T., Dietrich, M., et al. (2019). Soil multifunctionality is affected by the soil environment and by microbial community composition and diversity. Soil Biol. Biochem. 136, 107521. doi:10.1016/j.soilbio.2019.107521
Zhu, H., He, X., Wang, K., Su, Y., and Wu, J. (2012). Interactions of vegetation succession, soil bio-chemical properties and microbial communities in a Karst ecosystem. Eur. J. Soil Biol. 51, 1–7. doi:10.1016/j.ejsobi.2012.03.003
Keywords: 16s RNA, ITS, diversity-function relationship, soil microbiome, litter decomposition, litter stabilization, tropical forests
Citation: Sniegocki R, Moon JB, Rutrough AL, Gireneus J, Seelan JSS, Farmer MC, Weindorf DC and Naithani K (2022) Recovery of soil microbial diversity and functions along a tropical montane forest disturbance gradient. Front. Environ. Sci. 10:853686. doi: 10.3389/fenvs.2022.853686
Received: 12 January 2022; Accepted: 22 July 2022;
Published: 08 September 2022.
Edited by:
Yuncong Li, University of Florida, United StatesReviewed by:
Maria Moreno, CONICET Instituto de Ecorregiones Andinas (INECOA), ArgentinaCarlos Barreto, Ontario Ministry of Northern Development, Mines, Natural Resources and Forestry, Canada
Copyright © 2022 Sniegocki, Moon, Rutrough, Gireneus, Seelan, Farmer, Weindorf and Naithani. This is an open-access article distributed under the terms of the Creative Commons Attribution License (CC BY). The use, distribution or reproduction in other forums is permitted, provided the original author(s) and the copyright owner(s) are credited and that the original publication in this journal is cited, in accordance with accepted academic practice. No use, distribution or reproduction is permitted which does not comply with these terms.
*Correspondence: Kusum Naithani, a3VzdW1AdWFyay5lZHU=