- 1School of Architecture and Urban Planning, Chongqing University, Chongqing, China
- 2Key Laboratory of Mountain Town Construction and New Technology, Ministry of Education, Chongqing, China
Understanding the synergistic effect of multiple parameters is helpful to urban planners trying to design sustainable cities through a holistic approach. The objective of this research was to investigate how the street aspect ratio (HW), street orientation (AO), and greenery parameters, such as leaf area density (LAD) and aspect ratio of trees (ART), could affect the microclimate and outdoor thermal comfort of street canyons in a central business district under the local climate conditions of Chongqing city. To achieve this goal, a series of single- and multi-parameter simulations which followed an orthogonal design of experiments (ODOE) were conducted. The physiological equivalent temperature (PET) was adopted to assess the results of microclimate simulations for different urban models. The main findings are as follows: 1) The aspect ratio and orientation of urban canyons and ART play significant roles in influencing microclimate variables at the pedestrian level. 2) There is an inverse relationship between the street aspect ratio and Tmrt, and likewise for ART; the highest wind velocity was obtained when the aspect ratio of canyons was 2 and 3, which consequently developed the channeling phenomenon (when the domain wind is prevailing with street direction). 3) The East–West streets and canyons with an HW = 0.5 incur the warmest thermal conditions and longest extreme discomfort durations. 4) Results for the PET and meteorological parameters exhibit less significant variation obtained from different values of LAD than those observed in the other three parameters.
Introduction
Over the past 60 years, the global climate has undergone significant changes, with the number of days marked by heat waves continuing to increase (IPPC, 2014). Heat waves not only pose a threat to residents’ lives and health but also cause shortages in the urban infrastructure supply and adversely affect transportation facilities (Luber and McGeehin, 2008). With the rapid development of urbanization, the surface and air temperatures in cities exceed those in rural areas; this phenomenon is known as the urban heat island (UHI) effect (Oke, 1982). It is mainly related to synoptic weather conditions, the characteristics of urban morphology and urban canyons, the lack of green spaces, high-absorbing urban materials, anthropogenic heat generation by human activities, and heat sinks (Haddad et al., 2020a). For any human settlement, the UHI effect and global warming jointly increase the ambient temperature in cities (Haddad et al., 2020b). The rise in temperature has many implications, especially for energy consumption, pedestrian comfort, environmental health, and human well-being (Fahed et al., 2020). In realizing that the interaction between cities and climate could inform urban planning guidelines, potential opportunities that climate change presents could be seized upon to help create healthy and sustainable cities.
The interaction between microclimate and buildings is predominant in urban areas, wherein the urban microclimate is closely linked to the urban climate. Oke (1988) clarified that in terms of urban climatology, the urban microclimate is formed by meteorological parameters and is strongly affected by local surroundings and the anthropogenic sources of both heat and air pollutants (Akbari et al., 1992; Golden, 2004; Chow et al., 2013). The creation of UHI interferes with the microclimatic conditions one is exposed to, whether one is working or staying outdoors, and is directly related to people’s health, life, and work (Harlan et al., 2006; Guhathakurta and Gober, 2007). In related studies, much effort has been devoted to the potential of urban morphology and greenery parameters for optimizing the urban microclimate (Andreou, 2014; Perini and Magliocco, 2014; Morakinyo and Lam, 2016). Recently, Yilmaz et al. (2021) selected a street in Erzurum (Turkey) as a case study scenario; their results showed that in the summer period, the air temperature of the greener street scenario is about 1.0°C cooler than the typical condition and about 2.0°C warmer in the winter period. Earlier, Qaid and Ossen (2015) investigated the influence of six asymmetrical aspect ratio scenarios of streets on their microclimate in Malaysia, finding that an aspect ratio of 0.8–2 reduced the surface temperature by 10°C–14°C and air temperature by 4.7°C, mitigating the effects of tropical heat islands. The landscape elements can also cool down the cities and create a comfortable local microclimate. In a work by Morakinyo et al. (2020), simulations that entailed the combination of 54 generic tree forms and 10 characteristic urban morphology types were conducted. Their results demonstrated that variable temperature regulation by tree forms (species) occurs with varying magnitude across different types of urban morphology. Notably, daytime and nighttime temperature regulation effects were 0.3–1.0°C and 0.0–2.0°C, respectively.
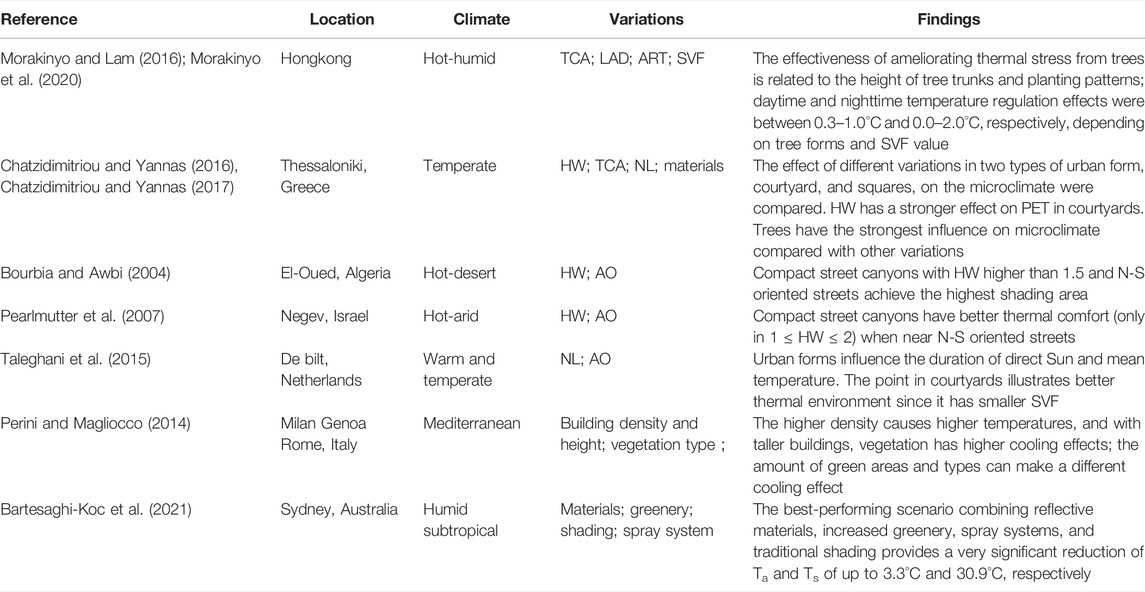
Among the relevant studies, street canyons, as the basic urban geometrical units, play a key role in the formation of microclimate (Oke, 1992). As reviewed by Jamei et al. (2016), urban canyons determine the solar access, shading, and wind conditions, which then affect the air and surface temperatures. The canyon is considered uniform if it has an aspect ratio approximately equal to 1, shallow if the canyon has an aspect ratio less than 0.5, and deep if the aspect ratio is 2 or greater (Ahmad et al., 2005). Over the past few decades, numerous studies have investigated the effects of urban canyon geometries upon the microclimate parameters via field measurements or numerical simulations (Ali-Toudert and Mayer, 2006; Pearlmutter et al., 2007; Andreou, 2014; Chatzidimitriou and Yannas, 2017). The parameters at the urban level include the neighborhood layout configurations (NL) (Taleghani et al., 2015), sky view factor (SVF), aspect ratio of street canyon (HW) (Chatzidimitriou and Yannas, 2016), and their axis orientation (AO) (Pearlmutter et al., 2007). Concerning greenery, the tree covered area (TCA), the leaf area density (LAD), and a measure of tree distribution, like the aspect ratio of trees (ART), are considered the main variables in the design process (Morakinyo and Lam, 2016; Morakinyo et al., 2017; Zhang et al., 2018). Trees not only modify the microclimate by altering the solar radiation reaching and terrestrial radiation leaving the ground they also contribute to outdoor thermal comfort by improving the shading effect via evapotranspiration (Fahmy et al., 2010; Spangenberg et al., 2019). Table 1 reports some relevant studies on the synergistic effects of different parameters on microclimate and outdoor thermal comfort. Only the relationship between HW and OA has been thoroughly studied, and all the reports to date show that the East–West (E–W) orientated canyons suffer the worst thermal comfort vis-a-vis other orientations. There are also some studies on the impact of different greening configurations in canyons on outdoor thermal comfort, as well as investigations of the relationship between SVF and parameters of street trees.
In the aforementioned studies, the outdoor thermal comfort was generally employed to evaluate the field measurement or simulation results. Thermal comfort indexes derived from human energy balance have been developed to evaluate the outdoor environment, such as the outdoor-standard effective temperature (OUT-SET*) (Spagnolo and de Dear, 2003), the predicted mean vote (PMV) (Fanger, 1972), and the universal thermal climate index (UTCI) (Bröde et al., 2012). The physiologically equivalent temperature (PET) (Höppe, 1999) considers individual parameters, such as human activity, metabolic rate, and thermal resistance of clothing. In addition, the PET has been validated in all climates and seasons, and is simply expressed in degree Celsius (°C) (Matzarakis et al., 1999), which is more convenient for researchers and designers to use. Thus, the PET was adopted as the outdoor thermal comfort index to evaluate the pedestrian-level thermal comfort in this study.
Numerical simulations have been widely used to investigate urban microclimates in recent years (Matzarakis et al., 2007; Lindberg et al., 2008; Matzarakis et al., 2010; Rayner et al., 2015; Salata et al., 2016). There are two kinds of numerical simulation methods: distributed parameter and lumped parameter methods. The distributed parameter method is based on computational fluid dynamics (CFD) for analyzing fluid thermodynamic problems (Littlefair et al., 2000; Franke et al., 2007; Tominaga et al., 2008). By using this technology to establish the turbulence model of airflow in a given area, and then setting reasonable boundary conditions and parameters according to meteorological and built environment data, the coupled calculation of convective heat transfer, radiation heat transfer, and heat conduction process in outdoor thermal environment can be realized such that the distribution characteristics of thermal environment parameters, temperature field, humidity field, and velocity field in different positions in the area can be obtained (Li et al., 2015). Currently, the CFD software packages include Fluent, PHOENICS, and ENVI-met, and numerical simulation software has been applied in related research (Yuan et al., 2012; Cao and Wang, 2017; Hou and Ming, 2018; Wang and Wang, 2018). Bo-Ot et al. (2012) used PHOENICS to simulate the influence of a neighborhood-scale green space layout on the outdoor thermal environment in Tainan City, which showed that the green space layout has the best cooling effect in a built environment. Ali-Toudert and Mayer (2007) used ENVI-met to study the effect of certain design parameters, such as the street aspect ratio, axis orientation, symmetry, building facade shape, and landscape greening, upon the thermal comfort of street canyons in a dry and hot climate area. ENVI-met is one of the most widely employed models for simulating the thermal comfort at the street level at a fine resolution (Bruse and Fleer, 1998), and it is the available software package that has the capacity and functions required by our present study. Therefore, in this work, science version V4.5 of ENVI-met was used for the simulations.
The abovementioned studies related to street canyons reported significant effects of geometries and greenery parameters on microclimate and outdoor thermal comfort. Yet, studies on the synergistic thermal benefit of HW and AO of canyons combined with LAD and ART of street trees, which is essential for thermal comfort at the pedestrian level in street canyons, are still lacking. Furthermore, most of these studies were done based on the urban scenarios of a single canyon or block, without consideration of the differential influence from surrounding urban contexts in a real urban environment. Moreover, related studies were carried out in regions with certain climatic conditions, especially in hot, arid, and temperate zones. Accordingly, conclusions drawn from studies in a hot humid climate, mostly in coastal cities, cannot be generalized to inland cities with humid subtropical climate, like Chongqing, a typical mountainous inland city in China.
This study can be seen as extending the above studies, by taking a more comprehensive perspective to examine the synergistic relationship between canyon geometrical and greenery parameters under the local climate of Chongqing. A series of parametric analyses were conducted for a wide range of hypothetical urban scenarios, with various and multiple parameters derived from the streets and planning regulations of Chongqing city. Finally, based on our results, some guidelines and strategies for optimizing the microclimate and outdoor thermal comfort are proposed. This study is a part of the National Social Science project of China entitled “Research on the prevention, control and management mechanism of heat wave disasters in high-density mountainous cities.” Some field measurements and outdoor thermal comfort questionnaire surveys had already been conducted in Chongqing in the summers of 2019 through 2021, whose relevant findings were also incorporated into this study.
Methods
The methodological framework of this study consisted of the following steps:
1) Developing a prototype parametrical model based on the investigation of urban geometrical features in Chongqing, and proposing a wide range of hypothetical urban scenarios with various and multiple geometrical parameters derived from the building and planning regulations of Chongqing.
2) Investigating the thermal performance of various prototype models, and finding out the thermal benefit of each parameter.
3) Adopting the orthogonal test to investigate the synergistic effect among four key parameters including the canyon aspect ratio, canyon axis orientation, the LAD, and the aspect ratio of street trees (ART).
4) Proposing the implications for optimizing the guidelines and strategies of urban design, as based on the obtained results for the aforementioned.
Site Description and Climate Analysis
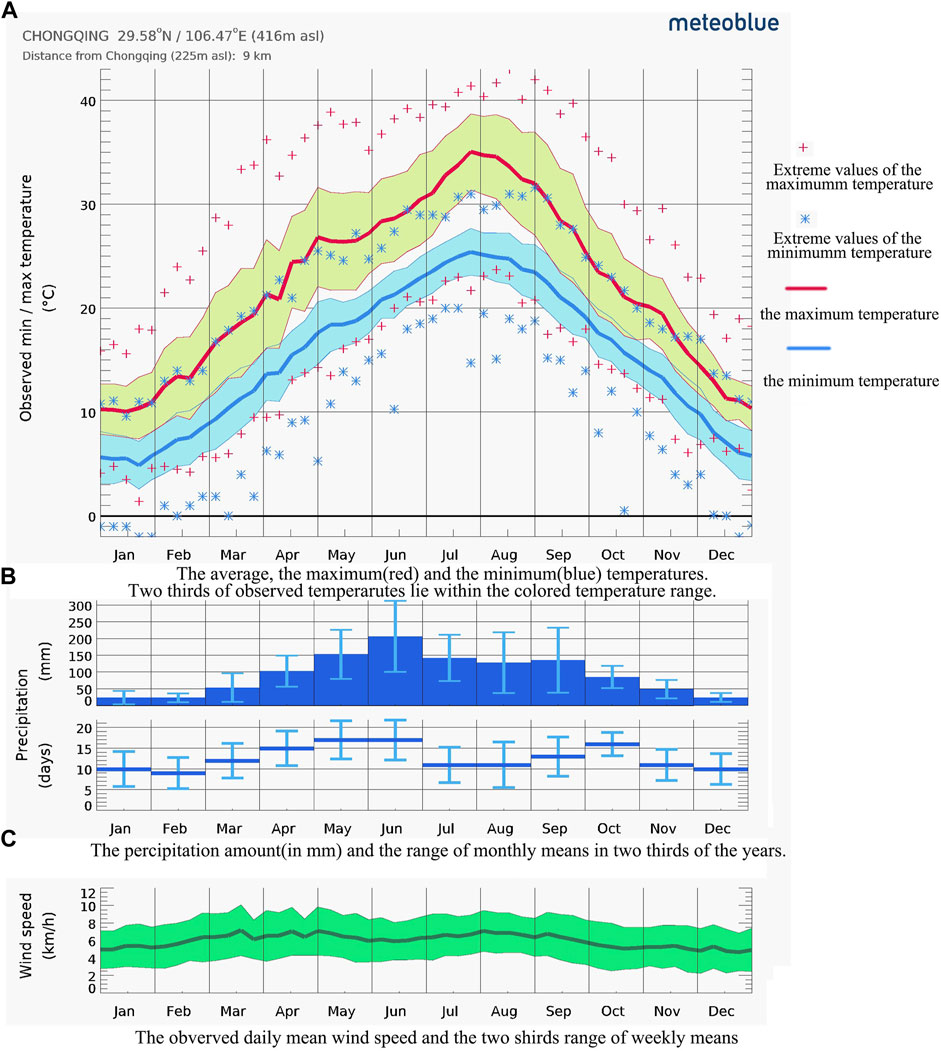
This study was conducted for typical summer conditions in Chongqing city, located at 29.57°-N and 106.55°-E at 238 m a.s.l. According to the world map of the Koppen-Geiger climate classification, Chongqing city belongs to the Cwa and Cfa climate zones (Kottek et al., 2006) corresponding to a humid subtropical climate. This generally takes the form of hot summers, with an average maximum temperature of 32°C, and cool winters. In this region, the highest air temperature occurs in June to September, and the number of days exceeding 35°C accounts for 20–25% of July and August. Wind speed is highest in the spring every year, with prevailing winds from the northeast and East, and a monthly wind speed of 0.28–1.4 m/s. The monthly trends of some essential meteorological variables are depicted in Figure 1.
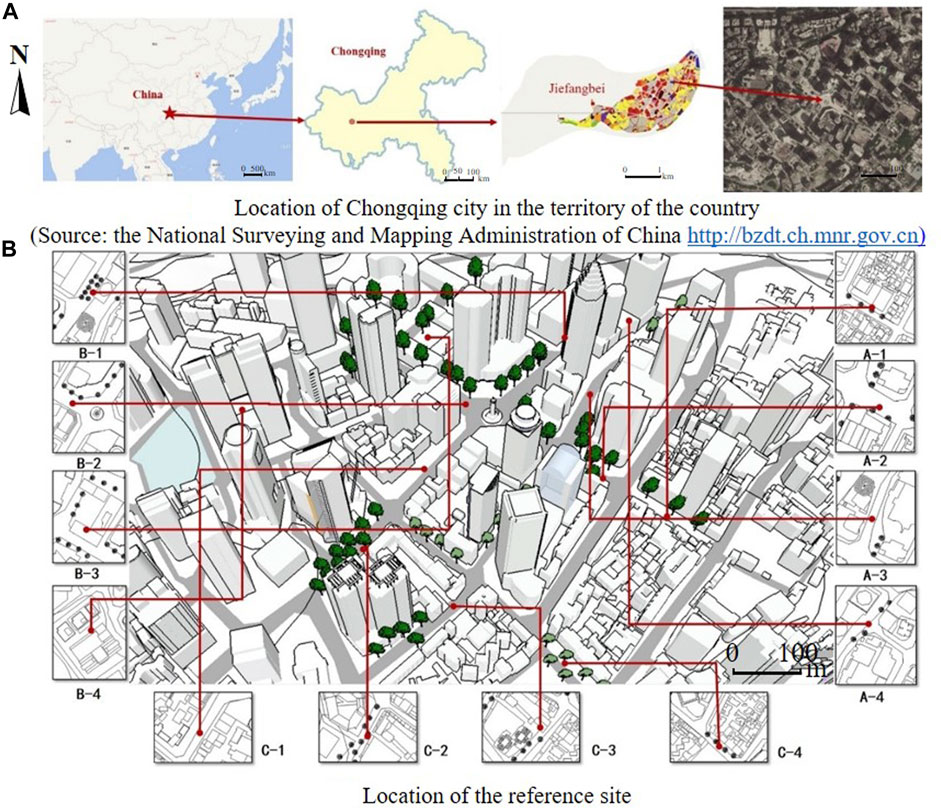
The study area is located in the central part of Chongqing city, called Jiefangbei. It is one of the most famous central business districts (CBD), with a dense urban morphology and complex land-use, as shown in Figure 2A. This area is characterized by tall buildings, and winding and narrow streets, which constitutes a compact urban texture. Most of the street orientations are not strictly N–S or W–E, as some streets have intermediate orientations.
Development of Urban Canyon Scenarios
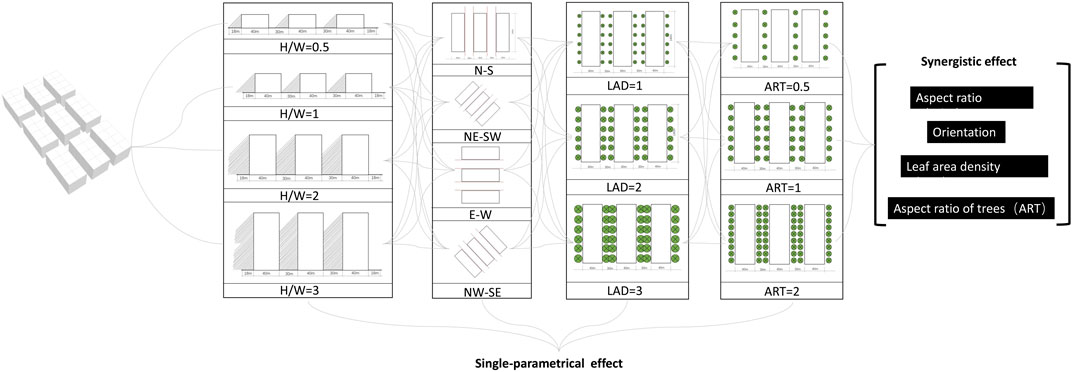
To explore the existing urban canyon geometry, some representational plots were selected for investigating the urban geometrical features in the study area. The locations and their geometrical and greenery parameters, such as the canyon aspect ratio of these plots, are shown in Figure 2B and Table 2. Generally, the aspect ratio of streets in Jiefangbei varies from 0.5 to 3, for which values can be rounded to 0.5, 1, 2, or 3. For the streets’ orientation, four main directions were adopted: E–W, N–S, NE–SW, and NW–SE. According to the investigation results, the LAD of street trees varies from 1 to 3, whose values can be rounded to 1, 2, or 3. The ART of street trees varies from 0.5 to 2, with these values rounded to 0.5, 1, or 2.
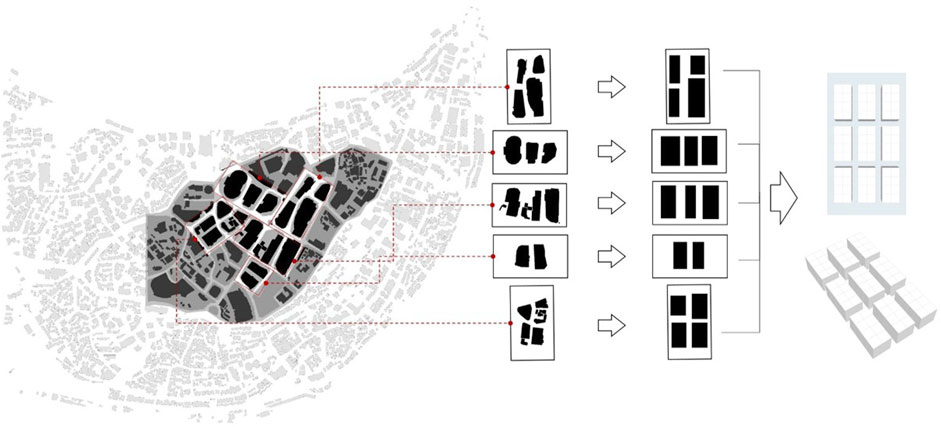
Considering the complexity of urban morphology in CBD, it is necessary to develop a simplified prototype model for describing the characteristics of different neighborhoods as a common pattern from a design perspective. According to an urban morphology analysis, the neighborhood can be seen as a combination of building block layouts and canyon types at different scales, and the typology of the neighborhood can be simplified into a uniform prototype system that consists of square blocks with different street canyons in a rectangular coordinate system, as shown in Figure 3. Some details in these neighborhood blocks, such as small patios and material variations in a block, are ignored because their influence on pedestrian level thermal comfort is relatively weak when compared with that of the layout configurations (Jamei et al., 2016). Therefore, the length-to-width ratio of the uniform building block can be used for representing the configuration of a neighborhood layout. The canyon axis orientation is directly related to the neighborhood layout.
The urban model referred to in this study was developed based on the aforementioned analysis of the aspect ratio and other urban geometrical features of the Jiefangbei area. The urban street canyon served as the basic structural unit for this study’s microclimate simulation and analysis. Chongqing is a typical mountainous city; due to its terrain features, the blocks are not as regular as they would be on flat land, and most of them are 200 m × 200 m in sizes as a unit block in Jiefangbei. Therefore, the simulation adopted this size as a unit block. According to the size measurements of the plots with commercial single buildings in the Jiefangbei area, the size of the unit plot of buildings was set to 40 m × 40 m; this is suitable for a single commercial or business building, to simplify the simulations. According to the Code for Traffic Plan and Route Design of Urban Roads in Chongqing, the main roads, secondary roads, and branch roads are embodied as two-way, six-lane street, and two-way four-lane or two-lane street, respectively. For Chongqing city, the standard width of the main streets, secondary streets, and branch roads is 32–42 m, 20–36 m, and 9–26 m, respectively, and sidewalks should be set on both sides. Considering the mountainous terrain and to facilitate the calculations, the width of the main street and secondary street was chosen to be 24 and 12 m, respectively, with additional 3 m of sidewalks on either side (i.e., 6 m of sidewalk) for a total width of 30 m and 18 for each street type, respectively. Figure 4 shows the basic scenarios of geometrical and green parameters. Based on the aforementioned typological and scale analysis of the urban form, a parametric model can be generated to investigate the single-parametric and synergistic effects of different variables.
Simulating the Microclimate With ENVI-Met and Its Validation
ENVI-met, developed by Bruse (2004), is a grid-based 3D microclimate model with a typical horizontal resolution spanning 0.5–5 m and a time step of 1–5 s. ENVI-met provides a “nesting area” around the core domain to distance the boundaries away from the target area and thus minimize boundary effects acting on the target area (Salata et al., 2016). In this study, five nesting grids that were positioned around the domain area were used. Furthermore, to provide more stable lateral boundary conditions for the simulations, the horizontal boundary of the domain area was set to be at least twice the height as the tallest building in the model.
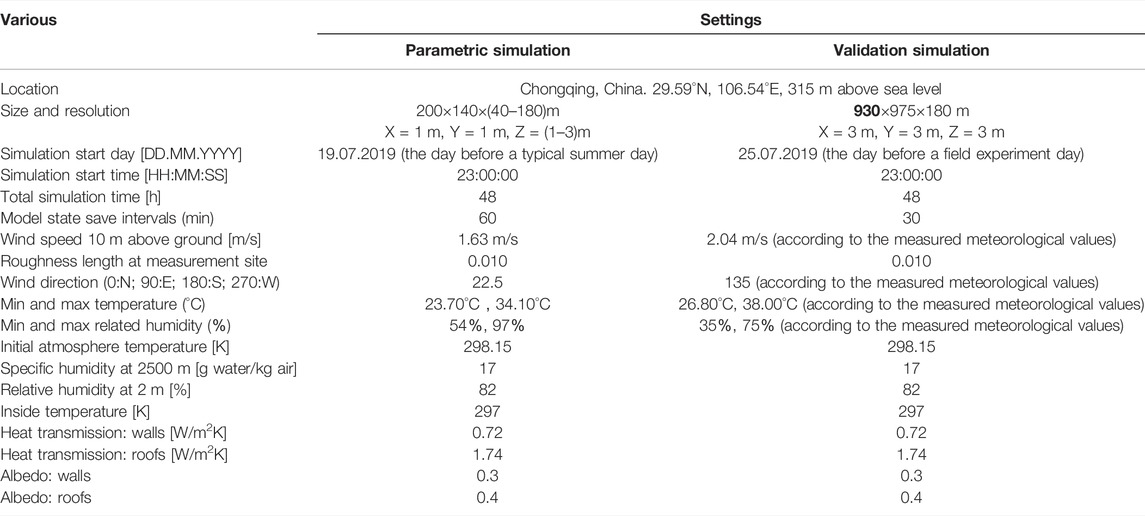
A comparative validation experiment was conducted for observed (actual) versus predicted (simulated) data plotted to check the correspondence of ENVI-met under a hot subtropical climate. According to local measurements in Jiefangbei CBD, the ENVI-met model for the actual scenario was built, and 12 “receptors” were set (same with Figure2B), with the distribution of actual measuring as shown in Figures 5A,B. In addition, the initial meteorological boundary conditions of the model were set according to the measured values on the day of actual measurement, and shown in Table 3. When the measured points of A1 are selected as representative empirical data, the hourly measured and simulated values of air temperature and humidity are shown in Figures 5C,D. The measured values of A1 are highly consistent with its simulated values, and the highest temperature in both appears at the same time; but the measured air temperature value climbs faster than the simulated value and drops more sharply after passing the peak temperature. The initial measured relative humidity is higher than the simulated value; however, the measured values are very close to simulated values as the humidity gradually increases beyond its lowest point. The daily differences between the measured and simulated values of air temperature, relative humidity, and wind velocity are listed in Table 4. It can be seen from Table 4 that the daily difference of air temperature and relative humidity at most measuring points is within the precision range of the testing instrument (±0.5°C and ±3%).
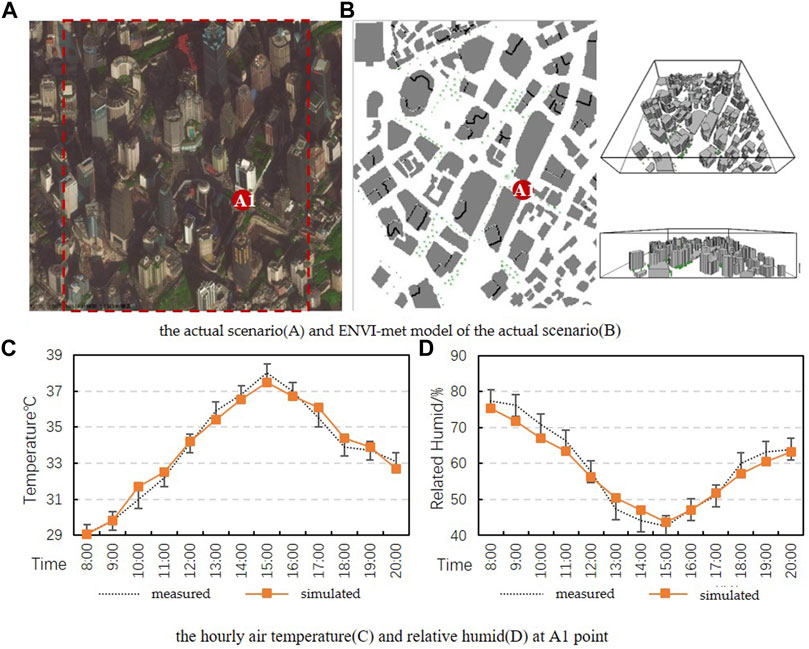
FIGURE 5. The actual scenario (A) and ENVI-met model of the actual scenario (B), the hourly air temperature (C) and the relative humidity (D) at A1.
Referring to the Typical Meteorological Database Handbook for Buildings (Zhang and Yang, 2012), the solar radiation in Chongqing is hottest in July, which is the hottest month of the year. According to its definition in Design Standard for Thermal Environment of Urban Residential Areas, the typical meteorological day is a day selected in typical meteorological years to represent the seasonal climate characteristics. Therefore, July was chosen as the representative month of summer; then, compared with the calculated monthly average of meteorological data (data source from Chinese standard Weather Data [CSWD]), 20th was selected as a typical meteorological day, being the day closest to that month’s average. The hourly meteorological data on July 20th were simulated as the initial meteorological conditions, which lasted for 48 h and were recorded once every hour. Because the dynamic wind speed and direction could not be inputted, the average wind speed in July was calculated to be 1.63 m/s, and the wind direction with the highest frequency in July was selected as the boundary condition of the wind environment. In addition, according to the relative humidity of the soil in Chongqing in the summer—obtained from the website of the Central Weather Bureau, China—the specific parameters for the initial simulation conditions of ENVI-met were derived (Table 3).
Orthogonal Design of experiments
ODOE is a branch of factorial design of experiments (FDOE) (Cox and Reid, 2000). It is used to acquire test results from only a small group of original experiments, when compared with other design of experiment (DOE) methods (Condra, 2018). Unlike some other traditional research methods, it can assign a weight to all non-numerical comparisons by statistical calculation. In an ODOE, we call the distinct settings in each factor “levels.” The original number of cases equals the product of the numbers of levels. Based on a suitable orthogonal table, representative cases with the characteristics of “uniform dispersion, neatness, and comparability,” can be selected from the original cases so that researchers only need to test these typical ones to obtain a final result. ODOE has been widely used in various scientific fields for its high efficiency (Yang et al., 2020; Zheng G. et al., 2021, Zheng et al., 2021 W.). ODOE helped Lv et al. (2020) to reduce the number of tests from 1,458 to 18 in their research on the impact of individual factors on the thermal environment in subway stations. Using ODOE, Yang et al. (2016) completed a multi-factor study on the allowable fluctuation ranges of the individual metabolic rate based on thermal comfort from 25 experiments.
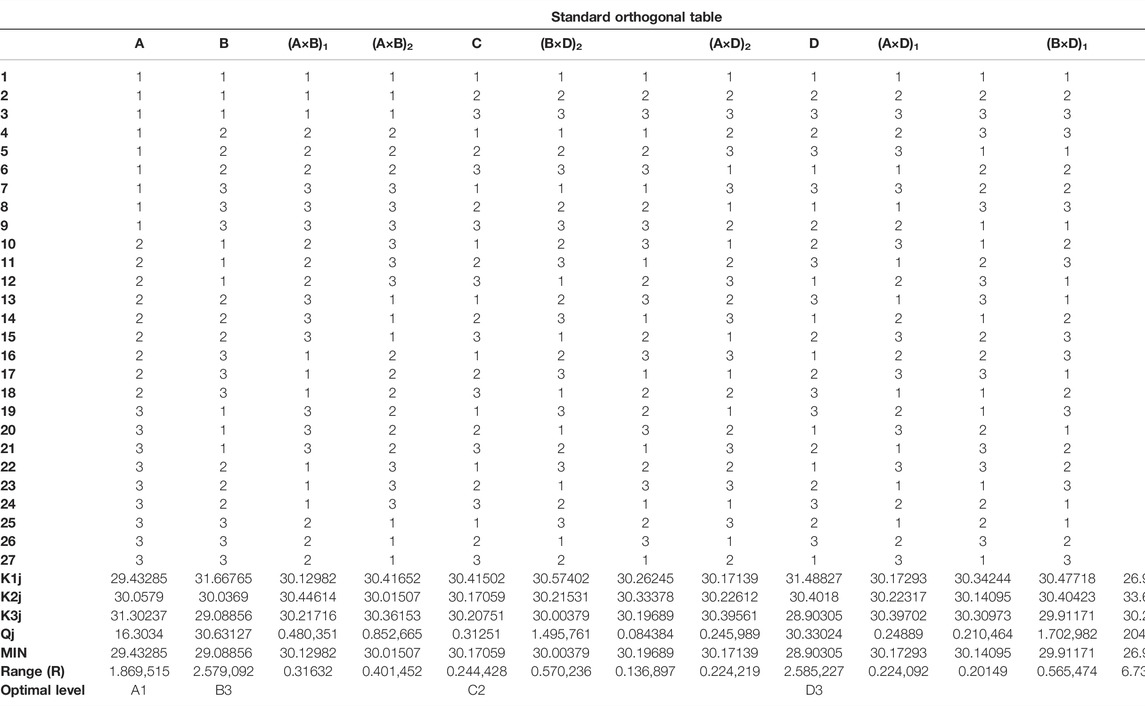
To improve the efficiency of simulation, ODOE was incorporated into this study, to effectively reduce the number of studied cases (i.e., the effects caused by factors including interactions can be obtained from fewer combinations of various factors). Here, PET was used to evaluate the four parameters: street orientation (AO), street aspect ratio (HW), LAD, and ART. As shown in Table 5, the levels of AO were listed as A1, A2, and A3 successively, and the same rule applied to the factor levels of HW, LAD, and ART. Then, the orthogonal table of L_27 (313) (Table 6) was chosen to conduct experiments with four factors (HW, AO, LAD, and ART), with each factor comprising three levels. In addition, because of the interactions uniformly distributed in each factor, the main effects’ ranking can be decided without the influence of their interactions. The 27 tested cases are shown in Table 6.
Thermal Comfort Index and the Range of Thermal Perception
PET was used here as the thermal comfort index, and Biomet V5.1 (Bruse et al., 2019), a post-processing tool of ENVI-met, was selected for dealing with the simulation results from 6:00 to 18:00 (outdoor activity time during the day) at a vertical height of 1.5 m from the ground. Regarding the human body model, all PET values in this article are calculated for a 35-year-old man, 1.75 m in height, and weighing 75 kg, with clothing insulation of 0.9 m2 k/w. According to the prior research findings of the National Social Science project, the thermal comfort temperature is 20.35°C ≤ PET≤31.07°C in the Jiefangbei area, which was adopted as the evaluation value in the analysis of the following results.
Results
Parametric Simulation Results
Aspect Ratio (HW)
According to the microclimate simulation results for the canyon aspect ratio (HW), illustrated in Figure 6A, the maximum Ta ranges from 32.23°C in the deep street canyon (HW = 3) up to 36.1°C in the shallow street canyon (HW = 0.5), as the street aspect ratio shifts from high to low. However, only slight differences can be found between the street canyons having aspect ratios of 2 and 3. The changes to Tmrt in the street canyon are similar to those of Ta (Figure 6B). The possible reason for this behavior is that solar radiation plays a key role in Tmrt formula together with Ta, and buildings along the deeper street canyons cast more of shadow (“shadow-cast”), leaving less solar reaching into the canyons; consequently, the trends of Tmrt and Ta are similar. But the effect of deep street canyons on shading and cooling is limited by the width of the street. When the shadow-cast of buildings on street sides completely covers the street surface, any further increase in the height of buildings and improving the HW will not enhance the cooling effect. Figure 6C shows the results of wind velocity, which revealed that a higher HW leads to a greater average wind speed in street canyons, because a narrow, deep canyon accelerates the airflow into the canyon. This brings more heat out, and thus cools the canyon.
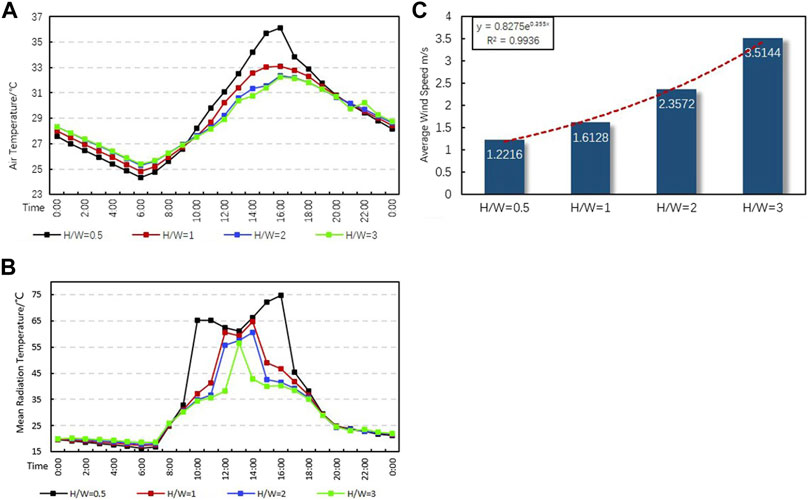
FIGURE 6. Profiles of meteorological parameters in canyons with different aspect ratios-air temperature (A), average wind speed (B) and mean radiation temperature (C).
Figure 7 shows the detailed temporal and spatial distributions of PET within the street canyons during the daytime (i.e., 6:00–18:00). Evidently, the shallowest canyons experience the longest duration of highly uncomfortable conditions, lasting from 9:00 to 18:00 (Figure 7). However, the extreme discomfort conditions are located on one side after 10:00 when the HW is 1 and after 12:00 when the HW is 2, but then gradually shift to the other side until 16:00 and 15:00, respectively. When the HW is 3, the PET value exceeds 31°C at 13:00, and drops below 33°C in less than 2 h in the middle of the street. By 18:00, the PET value is between 30 and 31°C.
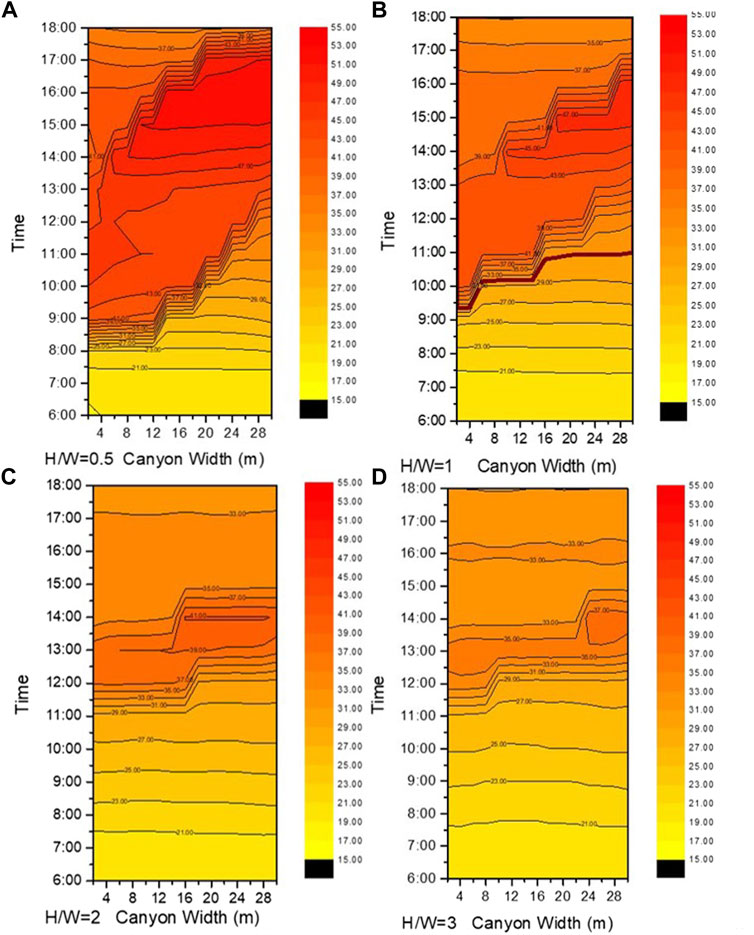
FIGURE 7. Temporal and spacial variations in PET at the pedestrian level within the street canyons in different aspect ratio-H/W = 0.5 (A), H/W = 1 (B), H/W = 2 (C) and H/W = 1 (D).
Street Orientation (Axis Orientation)
According to the meteorological simulation results for the four different street orientations, there was only a slight difference among them in their mean Ta (Figure 8A). Conversely, the maximum Ta is 1.6° C higher in the W–E street than that in the N–S street. The Tmrt results showed more significant variation between the different orientations (Figure 8B). The other orientations (N–S, NE–SW, and NW–SE) had lower Tmrt values and longer durations of shading than the W–E street. The W–E street experiences two peaks in Tmrt, at 10:00 and 16:00. This is reversed in the NE–SW and NW–SE streets because these lie at opposite angles incident to the Sun. The NE–SW street absorbed solar radiation in afternoon, while the NW–SE street did so mainly in the morning.
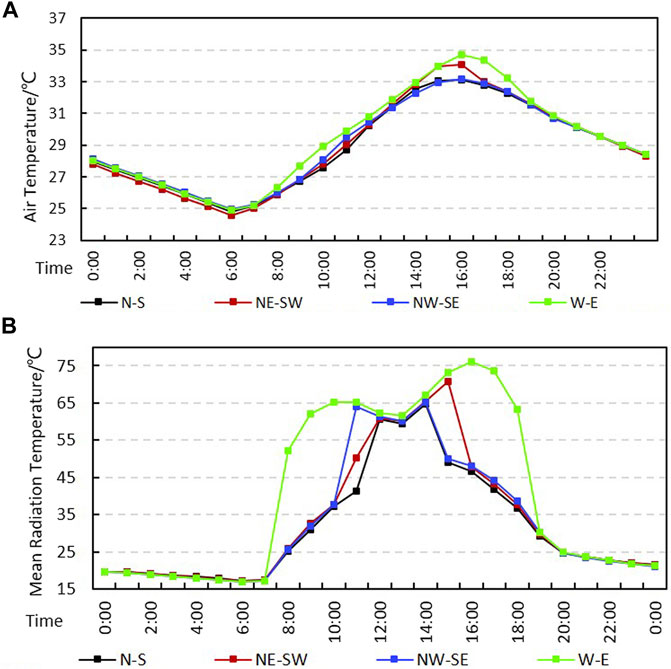
FIGURE 8. Profiles of meteorological parameters in canyons with different orientations-air temperature (A) and mean radiation temperature (B).
According to the temporal and spatial distributions of PET shown in Figure 9, the average PET value in the NE–SW street (34.23°C) is slightly smaller than that in the NW–SE street (35.58°C). A possible explanation is that the average wind speed is higher in the street canyon with a NE–SW direction (Figure 9), making the conditions more comfortable, and this reduces its PET values. The temporal and spatial evolution of PET in the NE–SW street is similar to that of N–S streets, but the duration of discomfort is slightly longer in the NE–SW street than in the N–S street. The PET value of the NE–SW street exceeds 31°C at 9:00, yet this phenomenon did not appear until 10:00 in N–S streets. Their mean PET values are 32.99 and 34.23°C, respectively, with a difference of 1.34°C.
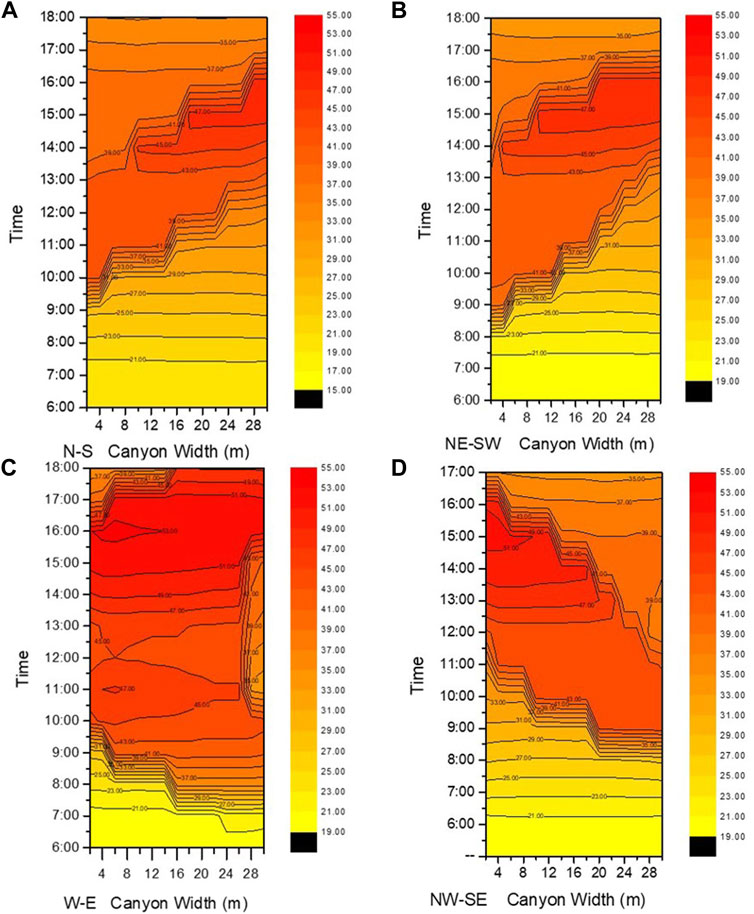
FIGURE 9. Temporal and spacial variations in PET at the pedestrian level within the street canyons in different orientation-N–S (A), NE–SW (B), W–E (C) and NW–SE (D).
The temporal and spatial evolution of the W–E street differs from other street orientations. The extreme discomfort conditions are located in the center of streets after 13:00 and gradually extend outward to the two sides. As the W–E street experienced the largest area of discomfort conditions, its maximum and average PET values surpassed those of other orientations, with an average PET value reaching 40.79°C and the maximum PET value reaching 53.40°C.
Leaf Area Density
From the Tmrt results obtained for different LAD values (Figure 10A), we can see that the effect of a cooling and humidifying surrounding environment was slightly influenced by the variation of LAD. Compared with the street canyons without vegetation, in which the Tmrt reached 65°C, the outdoor thermal comfort of the street canyons with trees has been significantly improved. The results of latent and sensible heat flux obtained from street canyons with a different LAD (Figures 10B,C) showed that the specific mechanisms differed. Considering the lower LAD value, the large gaps between leaves facilitate respiration and transpiration, and the surrounding microclimate is chiefly cooled by leaf evaporation; when the LAD value is higher, there are more leaves in the same horizontal unit area, leaving fewer and smaller gaps between leaves, which leads to greater stomatal resistance of their pores on the leaf surface, and this limits their evapotranspiration (Figure 10D). Consequently, the same cooling effect is achieved mainly by directly shielding the solar radiation.
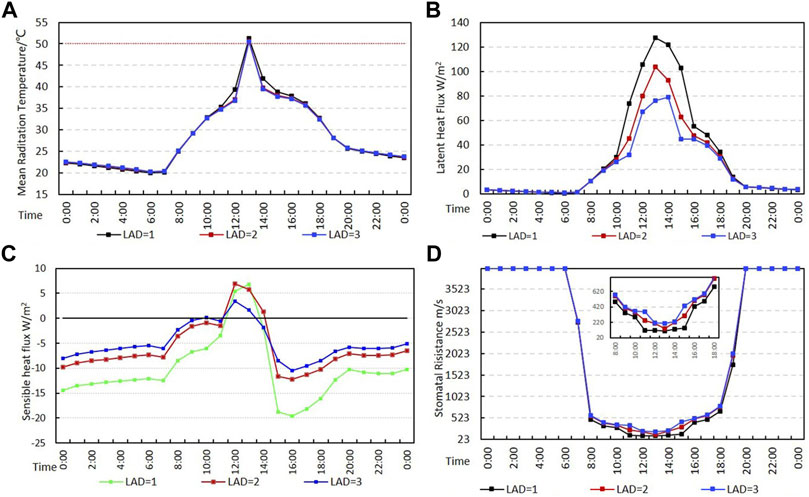
FIGURE 10. Profiles of meteorological parameters in canyons with different LAD-mean radiation temperature (A), latent heat flux (B), sensible heat flux (C) and stomatal risistance (D).
Figure 11 shows the temporal and spatial evolution of PET obtained from street canyons whose LAD differs. The overall distribution is even, and there is no lag in the peak in the canyon. For a street canyon with LAD = 1, the PET exceeds 31°C at 11:00, and the maximum PET value is 35.4°C at 15:00. However, the extreme discomfort conditions occur after 12:00 for LAD = 2 and LAD = 3 streets, whose maximum PET values appear at 16:00, being 33.8 and 33.6°C, respectively. For the three LAD values of streets, the duration of uncomfortable conditions lasted until 18:00, and their difference in total discomfort duration was not more than1 h.
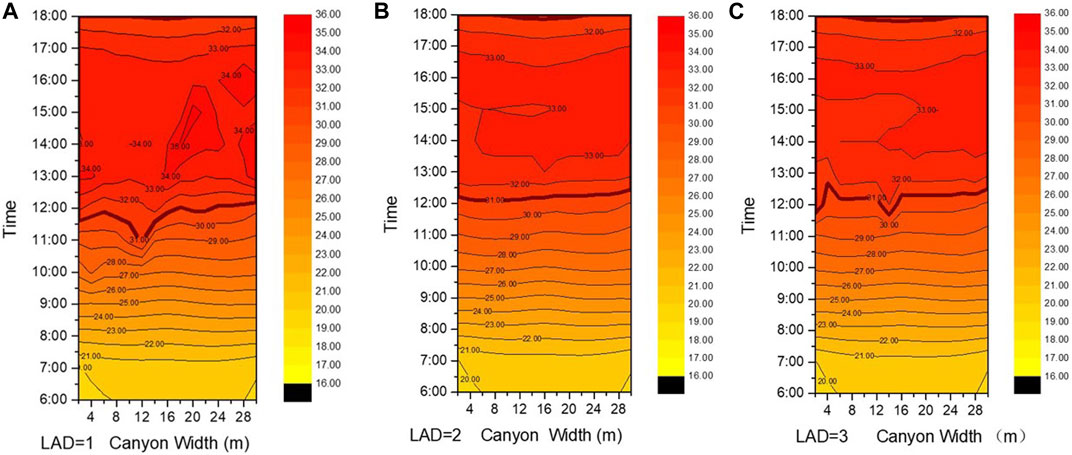
FIGURE 11. Temporal and spacial variations in PET at the pedestrian level within the street canyons in different LAD-LAD = 1 (A), LAD = 2 (B) and LAD = 3 (C).
Generally, compared with its absence, the outdoor thermal comfort obtained with vegetation present is arguably, having maximum PET values all below 40°C for the three different LAD levels. The higher the LAD is, the later in the day the uncomfortable conditions appear, and the shorter the duration of discomfort. Yet the results of PET exhibited less significant variation under different LAD levels than among the four street canyon orientations.
Aspect Ratio of Street Trees
Figure 12 shows that the Ta and Tmrt in street canyons vary significantly with changes in the aspect ratio of street trees (ART). The cooling effect of trees at the pedestrian level in the street canyon is likely achieved by their canopy shading against direct solar radiation combined with the evapotranspiration of leaves. According to correlations with meteorological parameters (Figure 12), the ART has a linear negative correlation with both Ta and Tmrt, but a positive correlation with air relative humidity and average wind speed. When the ART increases, the distance between street trees is shortened, and the quantities of street trees in the same street canyon are increased. Therefore, at the pedestrian level, the space area blocked by the canopy of trees was augmented, and the evapotranspiration of canopy leaves effectively reduced the Ta and Tmrt in the surrounding environment. When the ART = 1 and 2, the Tmrt is always lower than 50°C. When the ART value is high, a narrowing effect occurs between the densely arranged tree canopies and the ground (Figure 12D), which increases the average wind speed in the street canyons and the intake volume of air, consequently improving the outdoor thermal comfort.
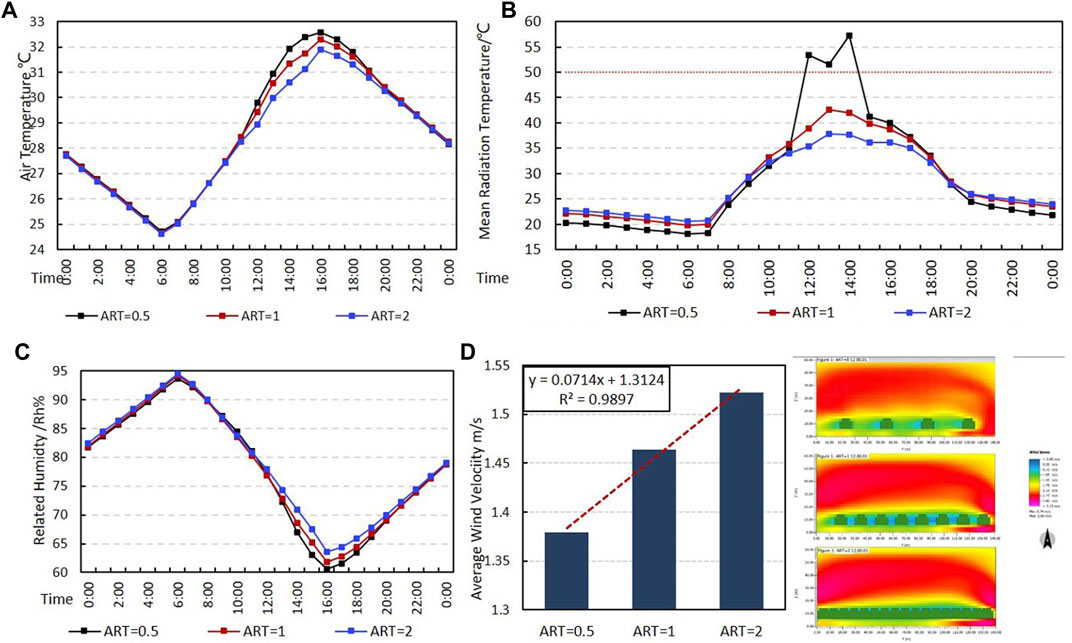
FIGURE 12. Profiles of meteorological parameters in canyons with different ART-air temperature (A), mean radiation temperature (B), relative humidity (C) and average wind velocity (D).
As evinced in Figure 13, PET values decrease gradually as the ART increases. For the streets with an ART = 0.5, the discomfort conditions, where PET exceeds 31°C, are located on one side after 10:00, and the maximum value of PET reaches 47.94°C, and the discomfort duration lasts nearly 9 h. By contrast, the uncomfortable conditions appear at 12:00 for streets with ART = 1, and at 13:00 for streets with ART = 2, for which the discomfort duration is only 6 h; this is reduced by 3 h in comparison with the ART = 0.5 street. Maximum PET values obtained from streets with an ART = 1 and ART = 2 were 41.4 and 35.6°C, respectively; hence, the maximum difference between them was 12.34°C. Furthermore, with a greater ART, the time at which uncomfortable conditions appeared was gradually delayed.
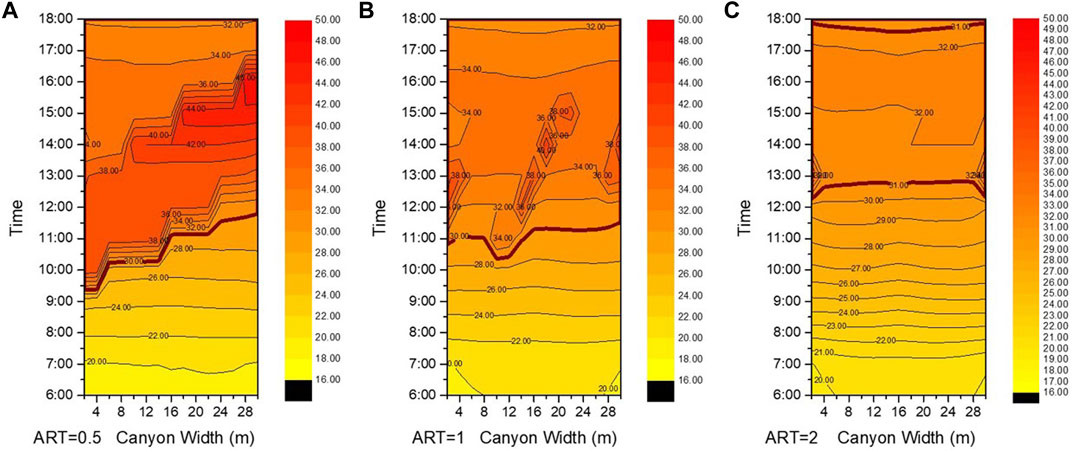
FIGURE 13. Temporal and spacial variations in PET at the pedestrian level within the street canyons in different ART-ART = 0.5 (A), ART = 1 (B) and ART = 2 (C).
Synergistic Simulation Results
After the parametrical simulation, the orthogonal method was used to investigate the synergistic effect on the thermal environment of urban street canyons.
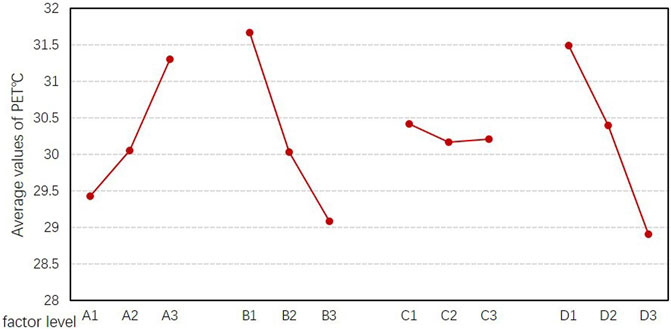
The simulation results of 27 tested cases are presented in Table 6. Comparing the PET of each factor level with K1j, K2j, and K3j, the optimal level ranking of each factor can be achieved as follows (Table 6 and Figure 14): street aspect ratio and ART are negatively correlated with PET in the street canyon such that the higher the values of ART and aspect ratio is, the lower the PET is; the optimal level of street aspect ratio is 3, in which the PET value is the lowest; the optimum level of ART is 2; concerning the street orientation, the N–S street performed the best, and the NW–SE street the worst. The results of the aspect ratio and orientation are consistent with the conclusion of previous reported simulations. Under the synergistic effect of multiple parameters, the trend of a single-factor influence on the thermal environment is consistent, but the degree of its effect was changed. In the multi-parameter situation, the optimal value of ART was valuable for promoting the thermal comfort of street canyons with a lower aspect ratio or having an E–W orientation. However, the optimal level of LAD is 2, unlike results from previously reported simulations. Because the LAD simulation displayed only slight differences, LAD = 2 was deemed the most economical choice here.
To determine the specific impact of factors and their interactions with PET, the contribution rate was adopted. Through it, the specific influence of a given factor (or interaction) was measured as proportion: the sum of squares of column deviations of each factor (or interaction) relative to the sum of squares of total deviations, which is calculated in this way:
where ρj is the contribution rate; Q is the sum of squares of the total deviation; Qj is the sum of squares of the column deviations; and j is the column number.
According to that formula, the contribution rate of each factor and their interaction with the street canyon models were calculated (Figure 15). These results could be ranked as follows: street aspect ratio > ART > street orientation > interaction between street aspect ratio and ART > interaction between street orientation and ART > LAD. Among them, the contribution rates of the street aspect ratio and ART were similar and the highest among them, being 11.32 and 11.21%, respectively. The contribution rate of the LAD and the interactions between street orientation and ART were the lowest, respectively, just 0.12 and 0.18%; this indicated few effects on the outdoor thermal environment when various changes occurred. Furthermore, the low contribution rates of the interaction between the street aspect ratio and ART (1.18%), as well as the interaction between street orientation and the street aspect ratio (0.49%), implied their limited effects on the thermal environment. Overall, both ART and HW are the paramount parameters to govern the outdoor thermal environment of street canyons, followed by the street orientation.
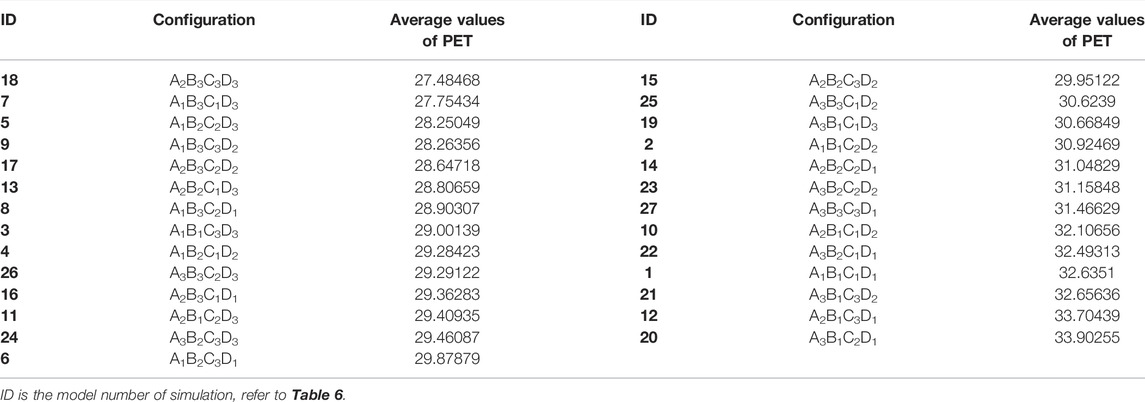
Searching for the optimal composition of factors with significant interaction (A and B, B and D) could serve as a useful reference when choosing the appropriate levels of factors in urban planning and design. According to the average value of PET during the daytime, the interactions are summarized in Table 7. The PET values of each row and column in the table indicate the average effect of the combination of these factors on the outdoor thermal environment. For example, A1B1 represents the average PET value of all test results of the N–S street with a street aspect ratio of 1. Comparing these results, the optimal combination of street orientation (factor A) and the street aspect ratio (factor B) is A1B3, and the worst combination is A3B1. Furthermore, the combination of A1B3 and A1Bi (i = 1, 2, and 3) outperformed other combinations. The optimal combination of the street aspect ratio (factor B) and ART (factor D) is B3D3, and the worst combination is B1D1. Meanwhile, the combinations, namely, B3Di and BiD3 (I = 1, 2, and 3), are evidently better than the other combinations.

TABLE 7. Calculation of interaction between factors A and B, and factors B and D in the street canyon model.
To search the optimal configuration of parameters, PET was ranked from low to high as shown in Table 8. According to this list, the optimal configuration of the street canyon model is A2B3C3D3 (model No.18), the optimal configuration of factors is “NW–SE street with a street aspect ratio of 3 and street trees with an LAD of 3 and ART of 2”; the worst configuration is A3B1C2D1 (model No.20), with this corresponding to “NE–SW street with a street aspect ratio of 1 and street trees with an LAD of 2 and ART of 0.5.” Generally, combining with the optimal composition of factors with significant interaction yielded the best configuration (A1B3CiD3) for a street canyon.
Furthermore, the difference in the average value of PET between No.18 (the best configuration) and No.7 (ranked second) model was only 0.27°C. In addition, there are 19 simulation models whose average PET values are within the thermal comfort zone; for five of them, PET was about 28°C, while for another eight models it was about 29°C. Among these 19 models, their street orientations were mostly N–S and NW–SE, their prevailing street aspect ratio is 2 and 3, and the ART is most often 1 or 2, whereas their factor levels of LAD are evenly distributed.
Discussion
Parametric and Synergistic Effect Analyses
After a description and analysis of the thermal performance of the four parameters, the results showed that deeper canyons generated a more comfortable pedestrian-level thermal environment. HW, as the most common variation in urban design, has been reported on in many studies (Bourbia and Awbi, 2004; Chatzidimitriou and Yannas, 2016; Chatzidimitriou and Yannas, 2017); higher HW results in lower thermal stress, which is in line with our study. However, we found some differences in the wind velocity results. In other research, the higher HW leads to a greater wind velocity in street canyons, due to the channeling phenomenon of a deep canyon. As clarified by Deng and Wong (2020), due to the bottleneck in wind caused by the deep streets (i.e., those with an HW = 3 and 4), wind speeds in the streets are nearly identical, and the maximum wind speed is within the deepest canyon, whereas the minimum wind speed is in a shallower canyon. While this situation stems from the fact that the dominant wind in the model runs parallel with the orientation of the street canyon, in other situations, when the canyons are diagonal to the prevailing wind, such as in the findings by Yin et al. (2019), the wind speed in a canyon decreases as its HW value increases due to wind blocked by high buildings on either side of the canyons.
The same situation for wind velocity also appears in the parametric simulation of ART. When the ART is high, channeling is formed between the dense tree canopy and the ground, which increases the wind speed along the street canyons, consequently improving the level of outdoor thermal comfort. However, in a real urban case, the loss of pressure due to the lack of flatness of the area and the supply of wind from the upper part of the street prevent it. The reality is that the denser the foliage, the lower the wind speed. This is likely because the ENVI-met model tends to overestimate the wind speed with significantly higher deviations for an initialized wind speed above 2 m/s (Tsoka et al., 2018). In addition, the wind speed was calculated using the simulated data at the pedestrian level (1.5 m above ground); this, together with the influence of the boundary grid, could explain this result.
The findings for the street canyon orientation are consistent with related studies. Ali-Toudert and Mayer (2007) mentioned that the thermal environment of E–W oriented streets is the most stressful, which we also found in our parametric simulation; in contrast, the N–S orientation provided the greatest thermal comfort. Only slight differences were obtained in results by varying LAD because the same cooling effects are achieved via different ways across a range of LAD values. When the LAD value is higher, this is via direct shielding of the solar radiation; when the LAD is lower, this is via leaf evaporation.
In this study, the synergistic simulation of multiple parameters by applying the ODOE is an innovation. These results show that the effects of HW and ART are the most significant, followed by AO. However, the effect of LAD is attenuated. In the optimal configuration, LAD = 2 is a more cost-effective option. Above all, a single parameter yields varying performance effects upon pedestrian-level thermal comfort in different ways related to the combination of other parameters. It is therefore meaningful to study the synergistic phenomenon, which can help urban designers better understand the correlation between variables and then fulfill their final objective.
Urban Design Implications
On the basis of the previous analysis of parametric and synergistic simulations, some implications for urban design in the central business area can be summarized as follows:
Street Canyon Design
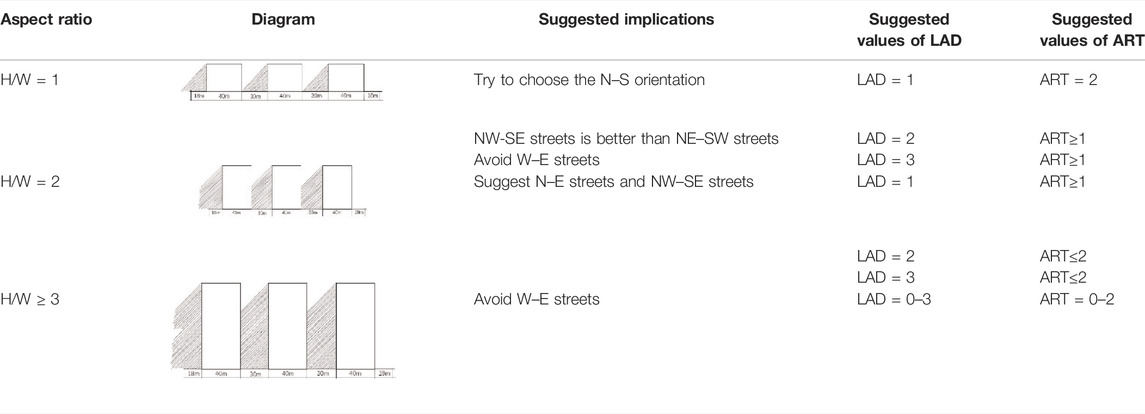
The suggested parameters suited for different street conditions are shown in Table 9. In a street canyon, HW and ART exert the greatest influence on the outdoor thermal environment. Combined with the synergistic effect of multiple parameters vis-a-vis each parameter, the most ideal design is that of N–S streets whose street aspect ratio is 3, coupled with a distance between street trees that is half of their height, namely, ART = 2. But prerequisite must be met: the prevailing wind direction is the same as the street orientation. However, when the street orientation cannot meet these ideal conditions, the thermal comfort of pedestrians can nonetheless be improved by increasing the heights of buildings on both sides of the street or the amount of street trees. Likewise, when the street aspect ratio is low, the same effect can be achieved by increasing the values of the three other parameters.
Greenery Design
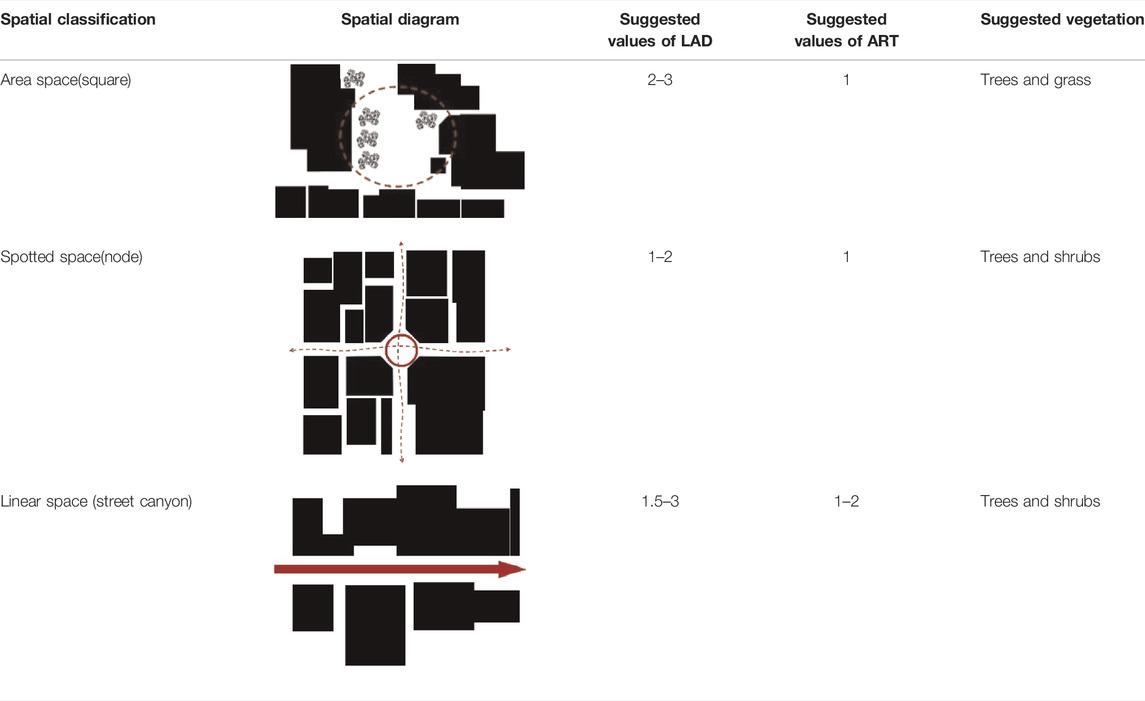
Through field measurements and a simulation study, we found that trees in the form of LAD and ART are the main factors affecting the cooling and ventilation effects. An ART<2 can provide a comfortable outdoor microclimate. According to different types of space, different tree layouts may be adopted (Table 10). As an important space for people’s outdoor activities, the central square (area space) should be relatively loosely arranged for greenery, such as under ART = 1; this should not only provide enough shading for people to reduce solar radiation but also not affect outdoor activities. On both sides of the road (linear space), street trees should be arranged according to an ART = 1–2 to improve the efficacy of greenery.
Limitations
Bearing in mind that there are a wide range of parameters that together may affect the thermal comfort and urban thermal environment, some other essential urban design parameters not considered in this research included wind direction, the materials of buildings and pavements (Chatzidimitriou and Yannas, 2016), and vegetation types (Arghavani et al., 2020). In addition, the quantities and intervals of some parameters selected in this research were insufficient to fully describe their precise influence, such as the aspect ratio, due to the limited grid resolution in the simulations. Therefore, more detailed research on the previously mentioned parameters will be pursued in future works. Another element of this study that limits its scope of inference is that it only considered urban forms under a certain uniform organization having the same plot size. Although the diversity of canyons and urban forms could affect the air temperature, it is difficult to describe this characteristic and compare its impacts via parametric research approaches. Furthermore, it may be useful to conduct simulation studies during winter conditions. It would be useful to determine the thermal conditions during this time for the same building parameters as summer time building and the winter climatic conditions in the simulations, which would create extra depth in the findings, and we will also conduct the winter simulation in future works.
Some limitations in ENVI-met used must be mentioned here as well because they can impact the accuracy of the simulations. For instance, in the overall calculation of radiation fluxes, there is some error in them for estimating Tmrt (Huttner, 2012), and the applied turbulence model Yamada and Mellor E-ε, tending to overestimate the turbulent production in high acceleration areas such that the proficiency decreased at wind speeds over 2 m/s (Acero and Arrizabalaga, 2018). Even though representative data from the actual site were applied in our study, the simulation error is still difficult to be avoided entirely, especially with respect to wind speed and Tmrt, because only the hourly air temperature and relative humidity can be imputed as boundary conditions.
Conclusion
Urban geometry and greenery play important roles in improving the microclimate and thermal comfort at the pedestrian level. The proper configuration of parameters is a highly valuable tool for current urban planning and design. This research investigated the impact of urban geometry and greenery parameters in the central business district on pedestrian-level thermal comfort under the local climate of Chongqing city, covering the synergistic effect of multiple parameters from a holistic and design perspective.
Based on the aforementioned results and discussion, our major findings are as follows:
The street aspect ratio, street orientation, and ART of urban canyons all play a significant role in affecting the microclimate variables at the pedestrian level. The street aspect ratio and ART contribute the most to urban canyon’s thermal microclimate. There is an inverse relationship between the street aspect ratio and Tmrt, and the same phenomenon can be found in the results of ART. This is because increasing the street aspect ratio and ART could result in less solar access and better shading conditions in urban canyons, consequently leading to lower Tmrt and Ta. Furthermore, deep canyons experience the highest wind velocity, which fosters the narrowing (channeling) effect of air. But there is a prerequisite: the domain wind direction must match the streets’ orientation. In terms of PET, the E–W street and shallow canyons incur the warmest thermal conditions and longest duration of extreme discomfort to pedestrians. The PET and meteorological parameters showed less significant variation across different values of LAD than that observed in the other three parameters. Considering the optimal composition of factors with significant interactions, A1B3CiD3 is the best configuration for the street canyon. This means “NW-SE street with a street aspect ratio of 3 and street trees with an LAD and ART of 2” performs the best providing outdoor thermal comfort in urban canyons.
Based on the aforementioned conclusions, a few optimization methods and strategies for urban designers in similar conditions are presented. By understanding the correlation and sensitivity of different parameters, as well as the synergistic effect of multiple parameters, for street canyons, it should be easier for urban designers to find a balance between high performing street canyons vis-a-vis other crucial factors in seeking to improve the design of urban morphology.
Data Availability Statement
The original contributions presented in the study are included in the article/Supplementary Material, further inquiries can be directed to the corresponding author.
Author Contributions
Conceptualization, HH and MP; methodology, MP; software, MP; validation, MP; formal analysis, MP; investigation, MP; resources, MP; data curation, MP; writing—original draft preparation, MP; writing—review and editing, HH; visualization, MP; supervision, HH; project administration, HH; funding acquisition, HH. All authors have read and agreed to the published version of the manuscript.
Funding
This project was financially supported by the National Social Science Foundation of China (No. 19BGL004) and the Fundamental Research Funds for the Central Universities (No. 2018CDQYJZ0032).
Conflict of Interest
The authors declare that the research was conducted in the absence of any commercial or financial relationships that could be construed as a potential conflict of interest.
Publisher’s Note
All claims expressed in this article are solely those of the authors and do not necessarily represent those of their affiliated organizations, or those of the publisher, the editors, and the reviewers. Any product that may be evaluated in this article, or claim that may be made by its manufacturer, is not guaranteed or endorsed by the publisher.
References
Acero, J. A., and Arrizabalaga, J. (2018). Evaluating the Performance of ENVI-Met Model in Diurnal Cycles for Different Meteorological Conditions. Theor. Appl. Climatol. 131, 455–469. doi:10.1007/s00704-016-1971-y
Ahmad, K., Khare, M., and Chaudhry, K. K. (2005). Wind Tunnel Simulation Studies on Dispersion at Urban Street Canyons and Intersections-A Review. J. Wind Eng. Ind. Aerodynamics 93, 697–717. doi:10.1016/j.jweia.2005.04.002
Akbari, H., Davis, S., Dorsano, S., Huang, J., and Winert, S. (1992). Cooling Our Communities: A Guidebook on Tree Planting and Light-Colored Surfacing. Epa, 217, Available at: http://escholarship.org/uc/item/98z8p10x#page-2.
Ali-Toudert, F., and Mayer, H. (2007). Effects of Asymmetry, Galleries, Overhanging Façades and Vegetation on thermal comfort in Urban Street Canyons. Solar Energy 81, 742–754. doi:10.1016/j.solener.2006.10.007
Ali-Toudert, F., and Mayer, H. (2006). Numerical Study on the Effects of Aspect Ratio and Orientation of an Urban Street canyon on Outdoor thermal comfort in Hot and Dry Climate. Building Environ. 41, 94–108. doi:10.1016/j.buildenv.2005.01.013
Andreou, E. (2014). The Effect of Urban Layout, Street Geometry and Orientation on Shading Conditions in Urban Canyons in the Mediterranean. Renew. Energ. 63, 587–596. doi:10.1016/j.renene.2013.09.051
Arghavani, S., Malakooti, H., and Ali Akbari Bidokhti, A.-A. (2020). Numerical Assessment of the Urban green Space Scenarios on Urban Heat Island and thermal comfort Level in Tehran Metropolis. J. Clean. Prod. 261, 121183. doi:10.1016/j.jclepro.2020.121183
Bartesaghi-Koc, C., Haddad, S., Pignatta, G., Paolini, R., Prasad, D., and Santamouris, M. (2021). Can Urban Heat Be Mitigated in a Single Urban Street? Monitoring, Strategies, and Performance Results from a Real Scale Redevelopment Project. Solar Energy 216, 564–588. doi:10.1016/J.SOLENER.2020.12.043
Bo-Ot, L. M., Wang, Y.-H., Chiang, C.-M., and Lai, C.-M. (2012). Effects of a green Space Layout on the Outdoor thermal Environment at the Neighborhood Level. Energies 5, 3723–3735. doi:10.3390/en5103723
Bourbia, F., and Awbi, H. B. (2004). Building Cluster and Shading in Urban canyon for Hot Dry Climate. Renew. Energ. 29, 291–301. doi:10.1016/S0960-1481(03)00171-X
Bröde, P., Fiala, D., Błażejczyk, K., Holmér, I., Jendritzky, G., Kampmann, B., et al. (2012). Deriving the Operational Procedure for the Universal Thermal Climate Index (UTCI). Int. J. Biometeorol. 56, 481–494. doi:10.1007/s00484-011-0454-1
Bruse, M. (2004). ENVI-met Website, Retrived from. Available at: http//www.envimet.com.
Bruse, M., and Fleer, H. (1998). Simulating Surface-Plant-Air Interactions inside Urban Environments with a Three Dimensional Numerical Model. Environ. Model. Softw. 13, 373–384. doi:10.1016/S1364-8152(98)00042-5
Bruse, M., Huttner, S., Hofmeyer, J., Seeger, D., and Simon, H. (2019). ENVI-met 5.1: A Holistic Microclimate Modelling System. retrieved from, https//envi-met.info/doku.php, Available at: http://www.envi-met.info/documents/onlinehelpv3/helpindex.htm.
Cao, X., and Wang, C. (2017). The Planning Strategy of the High-Rise Buildings Layout in Xi’an City Based on the Wind Environment Improvement: A Case of Qujiang New District Urban Dev. Stud.
Chatzidimitriou, A., and Yannas, S. (2016). Microclimate Design for Open Spaces: Ranking Urban Design Effects on Pedestrian thermal comfort in Summer. Sustain. Cities Soc. 26, 27–47. doi:10.1016/j.scs.2016.05.004
Chatzidimitriou, A., and Yannas, S. (2017). Street canyon Design and Improvement Potential for Urban Open Spaces; the Influence of canyon Aspect Ratio and Orientation on Microclimate and Outdoor comfort. Sustain. Cities Soc. 33, 85–101. doi:10.1016/j.scs.2017.05.019
Chow, D. H. C., Li, Z., and Darkwa, J. (2013). The Effectiveness of Retrofitting Existing Public Buildings in Face of Future Climate Change in the Hot Summer Cold winter Region of China. Energy and Buildings 57, 176–186. doi:10.1016/j.enbuild.2012.11.012
Deng, J.-Y., and Wong, N. H. (2020). Impact of Urban canyon Geometries on Outdoor thermal comfort in central Business Districts. Sustain. Cities Soc. 53, 101966. doi:10.1016/j.scs.2019.101966
Fahed, J., Kinab, E., Ginestet, S., and Adolphe, L. (2020). Impact of Urban Heat Island Mitigation Measures on Microclimate and Pedestrian comfort in a Dense Urban District of Lebanon. Sustain. Cities Soc. 61, 102375. doi:10.1016/j.scs.2020.102375
Fahmy, M., Sharples, S., and Yahiya, M. (2010). LAI Based Trees Selection for Mid Latitude Urban Developments: A Microclimatic Study in Cairo, Egypt. Building Environ. 45, 345–357. doi:10.1016/j.buildenv.2009.06.014
Fanger, P. O. (1972). Thermal comfort: Analysis and Applications in Environmental Engineering. Appl. Ergon. 3, 181. doi:10.1016/s0003-6870(72)80074-7
Franke, J., Hellsten, A., Schlünzen, H., and Carissimo, B. (2007). Best Practice Guideline for the CFD Simulation of Flows in the Urban Environment. Available at: http://cat.inist.fr/?aModele=afficheN&cpsidt=23892111%5Cnhttp://scholar.google.com/scholar?hl=en&btnG=Search&q=intitle:Best+practice+guideline+for+the+CFD+simulation+of+flows+in+the+urban+environment#0.
Golden, J. S. (2004). The Built Environment Induced Urban Heat Island Effect in Rapidly Urbanizing Arid Regions - A Sustainable Urban Engineering Complexity. Environ. Sci. 1, 321–349. doi:10.1080/15693430412331291698
Guhathakurta, S., and Gober, P. (2007). The Impact of the Phoenix Urban Heat Island on Residential Water Use. J. Am. Plann. Assoc. 73, 317–329. doi:10.1080/01944360708977980
Haddad, S., Paolini, R., Ulpiani, G., Synnefa, A., Hatvani-Kovacs, G., Garshasbi, S., et al. (2020a). Holistic Approach to Assess Co-benefits of Local Climate Mitigation in a Hot Humid Region of Australia. Sci. Rep. 10, 1–17. doi:10.1038/s41598-020-71148-x
Haddad, S., Ulpiani, G., Paolini, R., Synnefa, A., and Santamouris, M. (2020b). Experimental and Theoretical Analysis of the Urban Overheating and its Mitigation Potential in a Hot Arid City - Alice Springs. Architectural Sci. Rev. 63, 425–440. doi:10.1080/00038628.2019.1674128
Harlan, S. L., Brazel, A. J., Prashad, L., Stefanov, W. L., and Larsen, L. (2006). Neighborhood Microclimates and Vulnerability to Heat Stress. Soc. Sci. Med. 63, 2847–2863. doi:10.1016/j.socscimed.2006.07.030
Höppe, P. (1999). The Physiological Equivalent Temperature - A Universal index for the Biometeorological Assessment of the thermal Environment. Int. J. Biometeorology 43, 71–75. doi:10.1007/s004840050118
Hou, T., and Ming, L. U. (2018). Wind Sensation Prediction and Spatial Optimization of Commercial Street in Severe Cold Cities. Archit. J.
Huttner, S. (2012). Further Development and Application of the 3D Microclimate Simulation ENVI-Met. Mainz: Johannes Gutenberg-Universitat in Mainz.
IPPC (2014). IPCC, 2014: Climate Change 2014: Mitigation of Climate Change. Contribution of Working Group III to the Fifth Assessment Report of the Intergovernmental Panel on Climate Change. Available at: http://www.ipcc.ch/pdf/assessment-report/ar5/wg3/ipcc_wg3_ar5_full.pdf.
Jamei, E., Rajagopalan, P., Seyedmahmoudian, M., and Jamei, Y. (2016). Review on the Impact of Urban Geometry and Pedestrian Level Greening on Outdoor thermal comfort. Renew. Sustain. Energ. Rev. 54, 1002–1017. doi:10.1016/j.rser.2015.10.104
Kottek, M., Grieser, J., Beck, C., Rudolf, B., and Rubel, F. (2006). World Map of the Köppen-Geiger Climate Classification Updated. metz 15, 259–263. doi:10.1127/0941-2948/2006/0130
Li, L., Hu, F., and Liu, J. (2015). Application of CFD Technique on Micro⁃scale Issues in Urban Climatic Environment Researches in China.(In Chinese). Adv. Meteorol. Sci. Technol. 5, 23–30.
Lindberg, F., Holmer, B., and Thorsson, S. (2008). SOLWEIG 1.0 - Modelling Spatial Variations of 3D Radiant Fluxes and Mean Radiant Temperature in Complex Urban Settings. Int. J. Biometeorol. 52, 697–713. doi:10.1007/s00484-008-0162-7
Littlefair, P. J., Santamouris, M., Alvarez, S., Dupagne, A., Hall, D., Teller, J., et al. (2000). Environmental Site Layout Planning: Solar Access, Microclimate and Passive Cooling in Urban Areas.
Luber, G., and McGeehin, M. (2008). Climate Change and Extreme Heat Events. Am. J. Prev. Med. 35, 429–435. doi:10.1016/j.amepre.2008.08.021
Lv, W., Ma, J., Cui, H., Zhang, X., Zhang, W., Guo, Y., et al. (2020). Relative Importance of Certain Factors Affecting the thermal Environment in Subway Stations Based on Field and Orthogonal Experiments. Sustain. Cities Soc. 56, 102107. doi:10.1016/j.scs.2020.102107
Matzarakis, A., Mayer, H., and Iziomon, M. G. (1999). Applications of a Universal thermal index: Physiological Equivalent Temperature. Int. J. Biometeorology 43, 76–84. doi:10.1007/s004840050119
Matzarakis, A., Rutz, F., and Mayer, H. (2007). Modelling Radiation Fluxes in Simple and Complex Environments-Application of the RayMan Model. Int. J. Biometeorol. 51, 323–334. doi:10.1007/s00484-006-0061-8
Matzarakis, A., Rutz, F., and Mayer, H. (2010). Modelling Radiation Fluxes in Simple and Complex Environments: Basics of the RayMan Model. Int. J. Biometeorol. 54, 131–139. doi:10.1007/s00484-009-0261-0
Morakinyo, T. E., Kong, L., Lau, K. K.-L., Yuan, C., and Ng, E. (2017). A Study on the Impact of Shadow-Cast and Tree Species on in-canyon and Neighborhood's thermal comfort. Building Environ. 115, 1–17. doi:10.1016/j.buildenv.2017.01.005
Morakinyo, T. E., and Lam, Y. F. (2016). Simulation Study on the Impact of Tree-Configuration, Planting Pattern and Wind Condition on street-canyon's Micro-climate and thermal comfort. Building Environ. 103, 262–275. doi:10.1016/j.buildenv.2016.04.025
Morakinyo, T. E., Ouyang, W., Lau, K. K.-L., Ren, C., and Ng, E. (2020). Right Tree, Right Place (Urban canyon): Tree Species Selection Approach for Optimum Urban Heat Mitigation - Development and Evaluation. Sci. Total Environ. 719, 137461. doi:10.1016/j.scitotenv.2020.137461
Oke, T. R. (1988). Street Design and Urban Canopy Layer Climate. Energy and Buildings 11, 103–113. doi:10.1016/0378-7788(88)90026-6
Oke, T. R. (1982). The Energetic Basis of the Urban Heat Island. Q.J R. Met. Soc. 108, 1–24. doi:10.1002/qj.49710845502
Pearlmutter, D., Berliner, P., and Shaviv, E. (2007). Integrated Modeling of Pedestrian Energy Exchange and thermal comfort in Urban Street Canyons. Building Environ. 42, 2396–2409. doi:10.1016/j.buildenv.2006.06.006
Perini, K., and Magliocco, A. (2014). Effects of Vegetation, Urban Density, Building Height, and Atmospheric Conditions on Local Temperatures and thermal comfort. Urban For. Urban Green. 13, 495–506. doi:10.1016/j.ufug.2014.03.003
Qaid, A., and Ossen, D. R. (2015). Effect of Asymmetrical Street Aspect Ratios on Microclimates in Hot, Humid Regions. Int. J. Biometeorol. 59, 657–677. doi:10.1007/s00484-014-0878-5
Rayner, D., Lindberg, F., Thorsson, S., and Holmer, B. (2015). A Statistical Downscaling Algorithm for thermal comfort Applications. Theor. Appl. Climatol. 122, 729–742. doi:10.1007/s00704-014-1329-2
Salata, F., Golasi, I., de Lieto Vollaro, R., and de Lieto Vollaro, A. (2016). Urban Microclimate and Outdoor thermal comfort. A Proper Procedure to Fit ENVI-Met Simulation Outputs to Experimental Data. Sustain. Cities Soc. 26, 318–343. doi:10.1016/j.scs.2016.07.005
Spagnolo, J., and de Dear, R. (2003). A Field Study of thermal comfort in Outdoor and Semi-outdoor Environments in Subtropical Sydney Australia. Building Environ. 38, 721–738. doi:10.1016/S0360-1323(02)00209-3
Spangenberg, J., Shinzato, P., Johansson, E., and Duarte, D. (2019). Simulation of the Influence of Vegetation on Microclimate and Thermal Comfort in the City of São Paulo. revsbau 3, 1. doi:10.5380/revsbau.v3i2.66265
Taleghani, M., Kleerekoper, L., Tenpierik, M., and Van Den Dobbelsteen, A. (2015). Outdoor thermal comfort within Five Different Urban Forms in the Netherlands. Building Environ. 83, 65–78. doi:10.1016/j.buildenv.2014.03.014
Tominaga, Y., Mochida, A., Yoshie, R., Kataoka, H., Nozu, T., Yoshikawa, M., et al. (2008). AIJ Guidelines for Practical Applications of CFD to Pedestrian Wind Environment Around Buildings. J. Wind Eng. Ind. Aerodynamics 96, 1749–1761. doi:10.1016/j.jweia.2008.02.058
Tsoka, S., Tsikaloudaki, A., and Theodosiou, T. (2018). Analyzing the ENVI-Met Microclimate Model's Performance and Assessing Cool Materials and Urban Vegetation Applications-A Review. Sustain. Cities Soc. 43, 55–76. doi:10.1016/j.scs.2018.08.009
Wang, Q., and Wang, L. (2018). Design Strategy of Residential Quarters Based on CFD Simulation of Outdoor Wind Environment. New Archit.
Yang, C., Yin, T., and Fu, M. (2016). Study on the Allowable Fluctuation Ranges of Human Metabolic Rate and thermal Environment Parameters under the Condition of thermal comfort. Building Environ. 103, 155–164. doi:10.1016/j.buildenv.2016.04.008
Yang, S., Zhou, D., Wang, Y., and Li, P. (2020). Comparing Impact of Multi-Factor Planning Layouts in Residential Areas on Summer thermal comfort Based on Orthogonal Design of Experiments (ODOE). Building Environ. 182, 107145. doi:10.1016/j.buildenv.2020.107145
Yilmaz, S., Mutlu, B. E., Aksu, A., Mutlu, E., and Qaid, A. (2021). Street Design Scenarios Using Vegetation for Sustainable thermal comfort in Erzurum, Turkey. Environ. Sci. Pollut. Res. 28, 3672–3693. doi:10.1007/s11356-020-10555-z
Yin, S., Lang, W., and Xiao, Y. (2019). The Synergistic Effect of Street Canyons and Neighbourhood Layout Design on Pedestrian-Level thermal comfort in Hot-Humid Area of China. Sustain. Cities Soc. 49, 101571. doi:10.1016/j.scs.2019.101571
Yuan, S., Ren, C., and Edward, N. G. (2012). Analysis of Urban Design Strategies Based on the Outdoor Wind Environment and Thermal Comfort: A Case Study of Beijing Xidan Commercial District. Forum: Urban Plan.
Zhang, L., Zhan, Q., and Lan, Y. (2018). Effects of the Tree Distribution and Species on Outdoor Environment Conditions in a Hot Summer and Cold winter Zone: A Case Study in Wuhan Residential Quarters. Building Environ. 130, 27–39. doi:10.1016/j.buildenv.2017.12.014
Zhang, Q., and Yang, H. (2012). The Typical Meteorological Database Handbook for Buildings. beijing: China Architecture & Building Press.
Zheng, G., Huang, J., Diao, Y., Ma, A., Su, Y., and Chen, H. (2021a). Formulation and Performance of Slow-Setting Cement-Based Grouting Paste (SCGP) for Capsule Grouting Technology Using Orthogonal Test. Construction Building Mater. 302, 124204. doi:10.1016/j.conbuildmat.2021.124204
Keywords: urban canyon geometries, street greenery, outdoor thermal comfort, parametric simulation, synergistic effect
Citation: Peng M and Huang H (2022) The Synergistic Effect of Urban Canyon Geometries and Greenery on Outdoor Thermal Comfort in Humid Subtropical Climates. Front. Environ. Sci. 10:851810. doi: 10.3389/fenvs.2022.851810
Received: 12 January 2022; Accepted: 15 March 2022;
Published: 14 April 2022.
Edited by:
Zhiwen Luo, University of Reading, United KingdomReviewed by:
Giulia Ulpiani, Joint Research Centre, ItalySevgi Yilmaz, Atatürk University, Turkey
Azni Zain Ahmed, Universiti Teknologi Mara, Malaysia
Copyright © 2022 Peng and Huang. This is an open-access article distributed under the terms of the Creative Commons Attribution License (CC BY). The use, distribution or reproduction in other forums is permitted, provided the original author(s) and the copyright owner(s) are credited and that the original publication in this journal is cited, in accordance with accepted academic practice. No use, distribution or reproduction is permitted which does not comply with these terms.
*Correspondence: Haijing Huang, Y3FoaGpAMTI2LmNvbQ==
 Mingxi Peng
 Haijing Huang1,2*