 Chengcheng Wang
 Shaohua Wu1
 Wei Yang
94% of researchers rate our articles as excellent or good
Learn more about the work of our research integrity team to safeguard the quality of each article we publish.
Find out more
ORIGINAL RESEARCH article
Front. Environ. Sci., 17 May 2022
Sec. Environmental Informatics and Remote Sensing
Volume 10 - 2022 | https://doi.org/10.3389/fenvs.2022.851321
This article is part of the Research TopicTowards Sustainable Urban Development: Use of Geographic Big Data for Spatial PlanningView all 25 articles
Leisure agriculture can meet the leisure needs of residents and promote farmers’ income, which is an important way to achieve rural revitalization. However, the unreasonable spatial patterns and weak competitiveness of leisure agriculture seriously restrict its sustainable development. This paper proposes a framework for optimizing leisure agriculture development, including spatial patterns analysis of leisure agriculture based on big data, quality analysis of leisure agriculture based on tourists’ perceptions, and strategies for optimizing leisure agriculture based on spatial patterns and tourists’ perceptions. Taking Wuhan city as an example, the results show that: 1) the main types of leisure agriculture are leisure farms, fishing, and picking gardens, showing an agglomerative distribution pattern; 2) considering tourists’ emotional perceptions, most comments are positive, and leisure farms should enhance the tourist experience; 3) tourists’ dissatisfaction mainly involves the environment, price, and travel, while product and service factors are relatively satisfactory; and 4) moderate agglomeration is beneficial to the quality of leisure agriculture, while excessive agglomeration has adverse effects. This study explores the development law of regional leisure agriculture, improves the relevant theoretical research system and methods, and provides decision-making references for promoting the development of leisure agriculture.
In recent years, with the rapid development of industrialization and urbanization, urban residents’ demands to live close to and access nature have been gradually increasing (Jing et al., 2018; Qiu et al., 2019). In the suburbs of some large cities, leisure agriculture has become a regular pastime for urban residents (Barbieri, 2020; Chase et al., 2018). Additionally, traditional agriculture is no longer the only economic force in most rural areas (Wu, 2018). The quality of rural areas attracts visitors and leads people to prefer a natural and harmonious lifestyle (Jacobsen and Tommervik, 2016). In places with rich natural resources and beautiful scenery, the development of tourism and the service industry is also very important.
The growing popularity of leisure agriculture has many positive effects. On one hand, it promotes the development of the agricultural and rural economy, including increasing the household incomes of farmers, expanding employment capacity, and increasing tax revenue (Giaccio et al., 2018). On the other hand, leisure agriculture also provides an environment where urban residents can have a pleasant leisure experience and promotes people’s physical and emotional health (Sgroi et al., 2018). More importantly, it promotes the development of agriculture from traditional to diversified models and creates new possibilities for the local economy (Su et al., 2019), which is an important path to realizing rural revitalization (Tao, 2019).
Driven by market demand, leisure agriculture in China is developing rapidly, showing strong vitality and growth prospects. However, such rapid development can create many problems related to the spatial patterns and quality of leisure agriculture in mainland China (Ren and Dong, 2016). In terms of spatial patterns, most businesses are small-scale operations and have poor planning practices. Industrial agglomeration of leisure agriculture can guide production factors to flow to rural areas, form agglomeration effects, and improve overall competitiveness, but excessive agglomeration can lead to vicious competition (Kim et al., 2021; Pejanović et al., 2017). Therefore, we need to scientifically measure the spatial patterns of leisure agriculture, explore the relationship between spatial patterns and quality and engage in detailed planning. Similarly, many leisure agriculture businesses are low quality and have single brands, weak core competitiveness, and other factors that prevent them from meeting the gradually diversifying and personalized tourism consumption needs, resulting in a decline in the number of tourists who visit the area (Guo and Lv, 2008). To date, the overall integration of leisure agriculture has not been accomplished, and there are no large-scale companies with high-quality multifunctional services. Therefore, it is important to optimize the development of leisure agriculture by combining the spatial patterns and quality improvement of leisure agriculture.
Scholars mostly use GIS spatial analysis to study patterns of leisure agriculture (Bajgier-Kowalska et al., 2017; Baležentis et al., 2012; Walford, 2001), and measurement indicators include the nearest-neighbor index, the geographic concentration index, the coefficient of variation, kernel density estimation, the spatial dispersion index, and the spatial distribution curve, among others (Chang et al., 2018; Liu et al., 2017; Xu et al., 2021). The measurement of leisure agriculture quality is based on the tourist satisfaction model and focuses on the evaluation of service quality (Liu and Yen, 2010; Reichel et al., 2000). The measurement index covers the product, environment, service, price, travel, and other aspects (Goossen and Langers, 2000; Zhao and Chang, 2014). A questionnaire is the most common method to obtain tourists’ perceptions data (Dubois et al., 2017; Tew and Barbieri, 2012). The analyses in this field mainly adopt fuzzy comprehensive evaluation and factor analysis (Rozman et al., 2009). Development strategies of leisure agriculture have been offered from the perspectives of spatial distribution, tourists’ motivation, and tourism development (Yang et al., 2016). The development of leisure agriculture should rely on the regional resource endowment, reasonably optimize the layout (Wu and Cai, 2006), enhance the tourism image (Ohe and Kurihara, 2013), improve tourist satisfaction (Choo and Petrick, 2014; Lee, 2012), focus on rural characteristics and rural value (Shen et al., 2019) and increase the participation of local residents (Xue and Kerstetter, 2019).
The existing research has the following shortcomings. First, evaluations of the tourist experience of leisure agriculture mostly draw on the evaluation tourists’ experiences in scenic spots rather than their experiences with the specific characteristics of leisure agriculture. A scientific and reasonable quality evaluation model for leisure agriculture has not been formed. Second, most studies rely on statistical data from government departments or surveys with small samples, resulting in unrepresentative suggestions (Wu and Cheng, 2017). In contrast, multisource, large-sample, and multidimensional big data with geographical locations obtained from social media platforms provide new research means and observation perspectives to understand urban socioeconomic perceptions (Liu et al., 2015; Zhang et al., 2019). Using big data ensures that researchers possess a sufficient amount of data, reduces the cost of data collection, and can help scholars analyze people’s perceptions (Li et al., 2018). Tourist evaluation data come from active volunteers, and this format more effectively captures participants’ emotions. Analyzing these data facilitates large-scale regional, multi-perspective qualitative and quantitative research and aids in decision-making in resource allocation, planning, and quality improvement of leisure agriculture.
This paper aims to propose a quality assessment model for leisure agriculture and further explores optimization strategies for the development of leisure agriculture. The main contribution of the paper is to explore the optimization strategies of leisure agriculture by combining spatial patterns and tourists’ perceptions. Through this approach, we can obtain a comprehensive understanding of the role of spatial patterns in the development of leisure agriculture and explore the sustainable development model of leisure agriculture. Furthermore, this study sheds light on the analysis of big data. China’s experiences with leisure agriculture could provide valuable references for other developing countries. This study is structured as follows: (1) a spatial patterns analysis of leisure agriculture based on big data; (2) evaluations of leisure agriculture based on tourists’ perceptions; (3) quality evaluation of leisure agriculture based on tourists’ perceptions; and (4) optimization strategies for the development of leisure agriculture that combine spatial patterns and tourists’ perceptions.
The rapid development of the tourism industry has created an obvious industrial agglomeration phenomenon and trend in some regions (Chhetri et al., 2017). The concept of tourism agglomeration originated from economic geography and was introduced by Alfred Marshall. Tourism industry agglomeration is the concentration of tourism enterprises based on rich tourism resources in a certain geographical space (Estevão and Ferreira, 2012). Spatial agglomeration has two sides in tourism development (Lee et al., 2020; Novelli et al., 2006). On one hand, spatial agglomeration can enhance the competitiveness of enterprises (Chen et al., 2021), produce multiplier and external effects, promote the interaction and synergy between enterprises (Hawkins, 2004), and promote the sustainable development of tourism destinations (Benur and Bramwell, 2015). On the other hand, spatial agglomeration easily produces a substitution effect and vicious competition (Weidenfeld et al., 2011). The evaluation index of the quality of leisure agriculture usually comes from tourists’ perceptions. Tourists’ perceptions are tourists’ understanding of tourism products and services. Leisure agriculture is an industry in which tourists are the main consumers, thus, their experiences are very important (Kastenholz et al., 2018; Volo, 2021). Regions with high tourists’ evaluation can attract more visitors (Da Liang et al., 2020; Nazariadli et al., 2018).
At present, there is no consensus about the role of spatial agglomeration in the development of leisure agriculture. In other words, it is not clear whether the agglomeration pattern or the dispersion pattern is conducive to industrial development. Figure 1 presents a theoretical framework for understanding spatial patterns and the quality of leisure agriculture. The framework helps identify strategies for leisure agriculture development. It is based on the two features of leisure agriculture products: the spatial patterns of leisure agriculture (from dispersion to agglomeration) and the quality of leisure agriculture (from low quality to high quality). As the spatial patterns of leisure agriculture change from dispersion to agglomeration, its quality also changes. There are four typical states, among which there are different transition states: low quality and high dispersion, high quality and high dispersion, high quality and high agglomeration, and low quality and high agglomeration. The category of low quality and high dispersion is usually the primary stage of leisure agriculture development, characterized by low quality and small scale. The category of high quality and high dispersion indicates that regional leisure agriculture presents a single point development mode, and the spatial distribution is dispersed. In this state, the leisure agriculture spots have no influence on each other, and the existence of high-quality leisure agriculture spots has not driven the development of other leisure agriculture in the region. The high-quality and high-agglomeration group is the “ideal type”, which gives full play to the advantages of industrial agglomeration and spatial synergy, and forms a high-quality leisure agriculture agglomeration area with a scale effect within the region. Low quality and high agglomeration indicate that the agglomeration distribution of regional leisure agriculture does not promote high-quality development of the practice. This type of leisure agriculture may produce vicious competition and is considered to be large scale and of low quality.
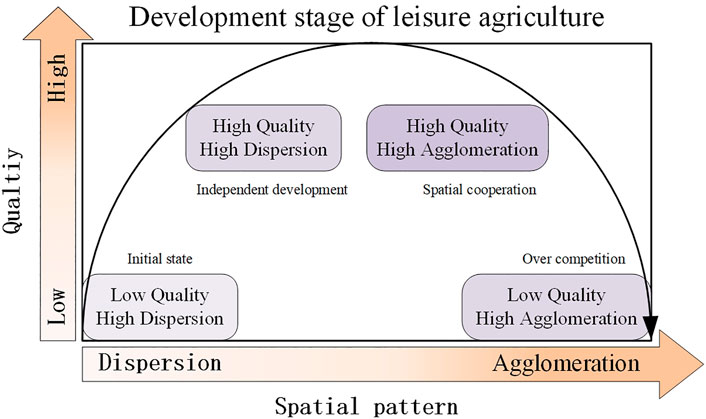
FIGURE 1. Theoretical framework.
Wuhan is the central city in central China. In 2019, the city governed 13 districts with a permanent resident population of 11.212 million and an urbanization rate of 80.49%. Wuhan has the advantage of possessing agricultural resources, with 2,938.6 km2 of cultivated land; it is known as a “land of fish and rice”. Bodies of water occupy approximately one-quarter of the city’s area, ranking Wuhan first in the country. Rich agricultural and water resources provide good opportunities for the development of leisure agriculture, including picking, fishing, recreation, and other practices. Furthermore, Wuhan is a national historical and cultural city. In 2019, there were 44 A-level scenic spots in Wuhan, and the tourism industry developed rapidly. The total number of tourists who visited the area during the year reached 318.98 million, and the total tourism income was 357.08 billion yuan. The rapid rise of the tourism industry has driven the development of the leisure agriculture market.
The data for this study include the leisure agriculture database of user-generated content (UGC) and the administrative division data of Wuhan in 2018. The leisure agriculture data were obtained from Dianping.com using a web crawler tool. These data include the latitude and longitude of leisure agriculture sites, comment information (comment text, comment time), basic information about the reviewers (gender, community level), and other factors. Dianping.com is a leading third-party consumer comment platform in China that began operating in April 2003 (Wu et al., 2015). Members can freely express their opinions about businesses and consumption experiences through the website, providing information for potential consumers. Public comment data identify the spatial location and attribute information of leisure agriculture businesses, with large coverage, high accuracy, and representativeness. ArcGIS was used for the spatial processing of information and to build a leisure agriculture database based on big data.
This paper constructs an optimization framework for the development of leisure agriculture using big data (Figure 2). First, we analyzed the spatial patterns characteristics of different types of leisure agriculture, which is an objective analysis. The types of leisure agriculture are divided according to differences in their function and scale (Busby and Rendle, 2000). The spatial characteristics need to identify the spatial patterns and density. GIS spatial analysis was used to analyze the agglomeration or dispersion characteristics of leisure agriculture. Second, this paper evaluates leisure agriculture tourists’ perceptions from two perspectives: emotional perception and theme perception. The emotional tendency analysis module of the Baidu Ai platform was used to analyze the positive and negative emotions of tourists, and word segmentation analysis helped us explore the core issues of tourists’ concerns (Wu, 2019). Then, we constructed a quality evaluation method for leisure agriculture based on tourists’ perceptions, focusing on the product, environment, service, price, travel, and other factors. Finally, we explore the optimization strategies for leisure agriculture by combining spatial patterns and tourists’ perceptions.
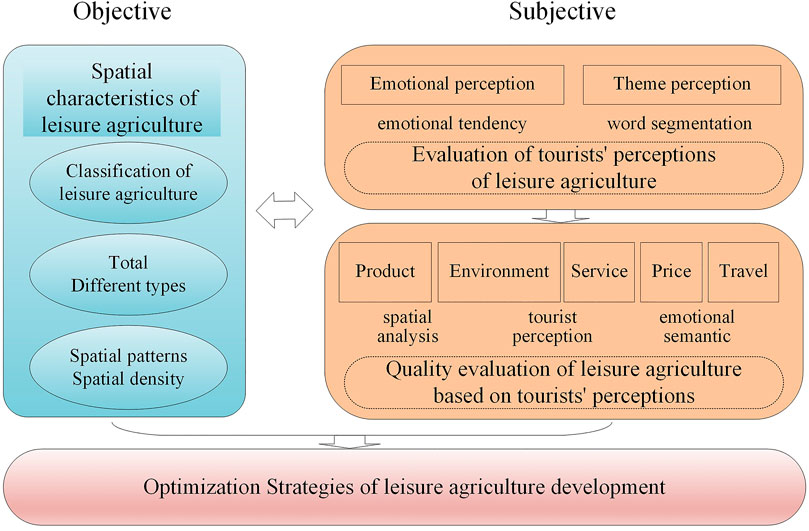
FIGURE 2. Research process.
The spatial characteristics of leisure agriculture were measured in terms of the spatial pattern and density. Each measure is described here.
Average nearest neighbor
The average nearest neighbor index was used to analyze the spatial distribution of leisure agriculture after measuring the distance between each leisure agriculture as follows:
where
Kernel density
A kernel density was used to measure the spatial density of leisure agriculture. The kernel density estimation calculation formula is:
where
This paper uses emotional tendency analysis to analyze the positive and negative emotions of tourists. We applied the emotional tendency analysis module of the Baidu Ai platform. The method automatically judges the emotional polarity category of the tourists’ comments, and the corresponding confidence level is given. Emotional polarity is divided into positive, negative, and neutral. Emotional tendency analysis estimates the emotional tendency of text that contains subjective information, which helps users make decisions. Based on deep learning training, the system automatically learns deep semantic and syntactic features and has high generalization ability, which is highly effective, even for relatively long sentences (Yan et al., 2018).
Using word segmentation analysis, this paper explores the core issues of tourists’ concerns and the advantages and disadvantages of current leisure agricultural products. It then analyzes the concerns of leisure agriculture tourists with different emotional tendencies. We use the Python Jieba cut to segment the tourists’ comments. After excluding common pause words, we calculate statistics for the common words in the comment text and uncover the most important concerns of tourists about leisure agriculture. Then, based on emotional analysis, this paper uses word segmentation analysis to mine the advantages and dissatisfaction factors expressed by tourists.
We searched the comments offered by leisure agriculture tourists from the public comment websites. According to existing research and data availability (Rozman et al., 2009), the quality characteristics of leisure agriculture are divided into five dimensions: product (quality and facilities), environment (scenery, health, and space), service (attitude and feelings), price, and travel (traffic and location), as shown in Table 1. The emotional semantic dimensions of leisure agriculture were classified and scored to evaluate tourists’ experiences of these different dimensions of leisure agriculture; on this basis, the weights of the dimensions were determined to comprehensively evaluate the quality of leisure agriculture. The specific steps were as follows:
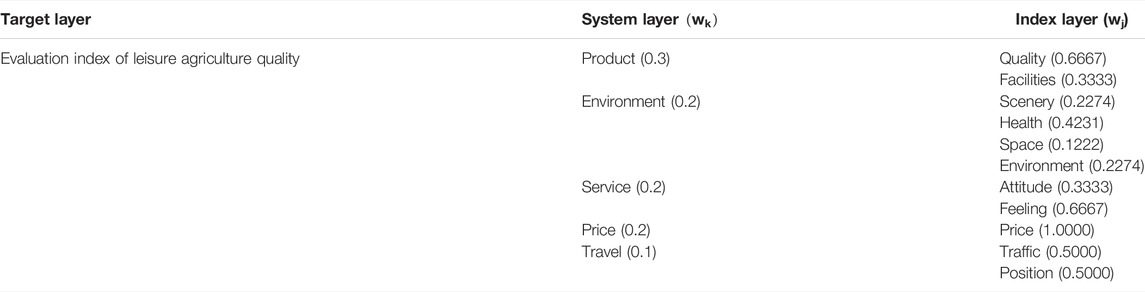
TABLE 1. Evaluation index of leisure agriculture quality.
Text preprocessing: This step involved sentence segmentation, tokenization, and removing stop words.
Extracting feature–opinion pairs: The assumption was that each sentence evaluated a dimension of the feature object, with direct links between opinion words (sentiment) and noun words (feature) in a clause.
Weight determination: The analytic hierarchy process was used to determine the weight.
Emotional score calculation: The emotional score was calculated using the polarity and degree of the emotion (Yang and Ai, 2018) as follows:
where
Score calculation by dimension: Considering that different sentences may evaluate the same features of leisure agriculture, feature sentences were combined according to the previously defined dimension feature dictionary. Through the calculation of each dimension score, all dimensions of leisure agriculture businesses were evaluated:
where
Total quality score calculation:
where
Based on the multidimensional experience evaluations of tourists, this paper offers suggestions for the development of leisure agriculture in terms of products, environment, service, price, and travel, among others.
Based on the leisure agriculture data, using the method of text recognition, and combining the characteristics of the scale and function (Guo and Lv, 2008; Ren and Dong, 2016) of leisure agriculture businesses, the leisure agriculture activities were divided into six types (Table 2): picking garden, fishing, leisure farm, agritainment, planting and breeding, and agricultural technology.
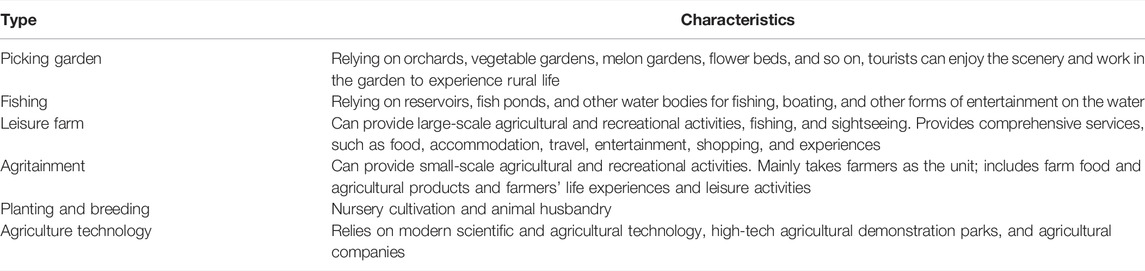
TABLE 2. Types and characteristics of leisure agriculture.
The distribution of leisure agriculture (Figure 3) is found more in the outer suburbs than in the central city. Huangpi District accounts for the highest proportion (20.94%), followed by Jiangxia District (19.76%), Dongxihu District (16.94%), and Hongshan District, Caidian District, and Xinzhou District (each accounting for approximately 10%). Other districts have lower proportions. As shown in Figure 4, among the leisure agriculture businesses in Wuhan, the proportion of leisure farms is the highest (30.52%). Furthermore, the types of leisure agriculture are ranked in the following order: leisure farm, fishing, picking garden, agritainment, planting and breeding, and agricultural technology. This finding indicates that leisure farms and fishing are the most popular types of leisure agriculture among tourists in Wuhan.
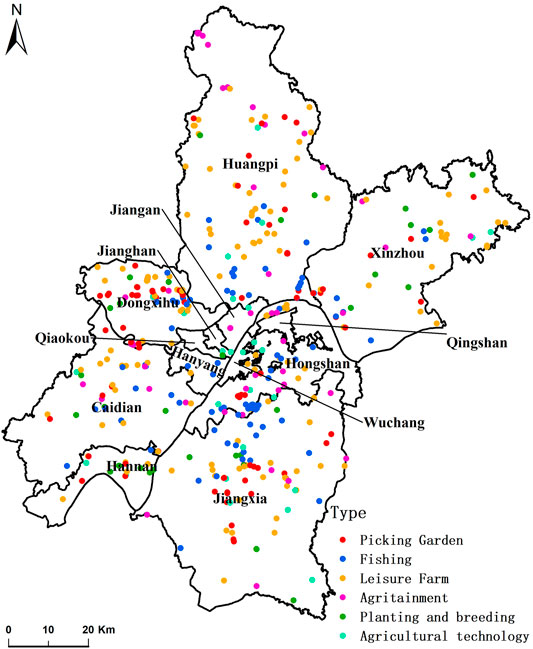
FIGURE 3. Spatial distribution of leisure agriculture in Wuhan.
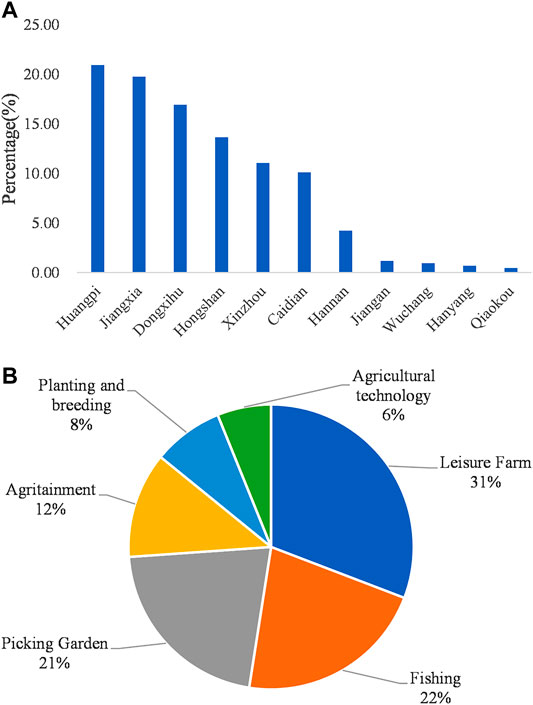
FIGURE 4. The proportion of leisure agriculture in Wuhan: (A) different regions; (B) different types.
The results of the nearest-neighbor index analysis of the types of leisure agriculture in Wuhan are shown in Table 3. The leisure agriculture in Wuhan is generally in the form of agglomeration. Specifically, picking gardens, fishing, and leisure farms have clustered distributions. Agritainment, planting and breeding, and agricultural technology show random distribution patterns.
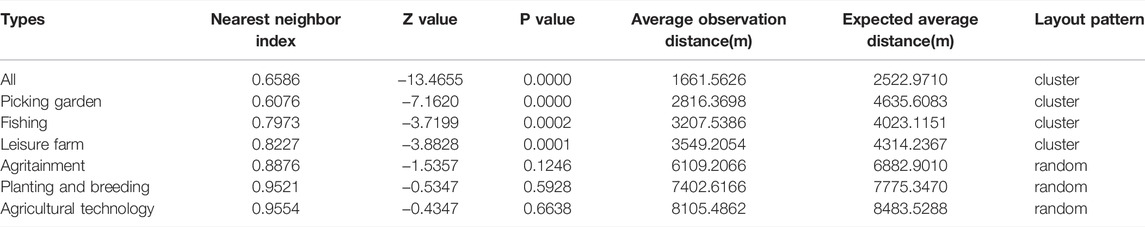
TABLE 3. Nearest-neighbor index of different types of leisure agriculture in Wuhan.
There are obvious regional differences in the spatial distribution density of leisure agriculture in Wuhan (Figure 5). The areas with higher leisure agriculture density are mainly concentrated in central and southern Wuhan. The picking garden distribution is similar to that of leisure agriculture. Fishing is mainly distributed around the main urban area of Wuhan city, among which Liangzi Lake is the center of fishing activities. Leisure farms are distributed in almost all districts. Agritainment is mainly distributed in central and northern Wuhan, while the type of planting and breeding is concentrated in the outer suburbs. The distribution of agricultural technology is highly dependent on cities.
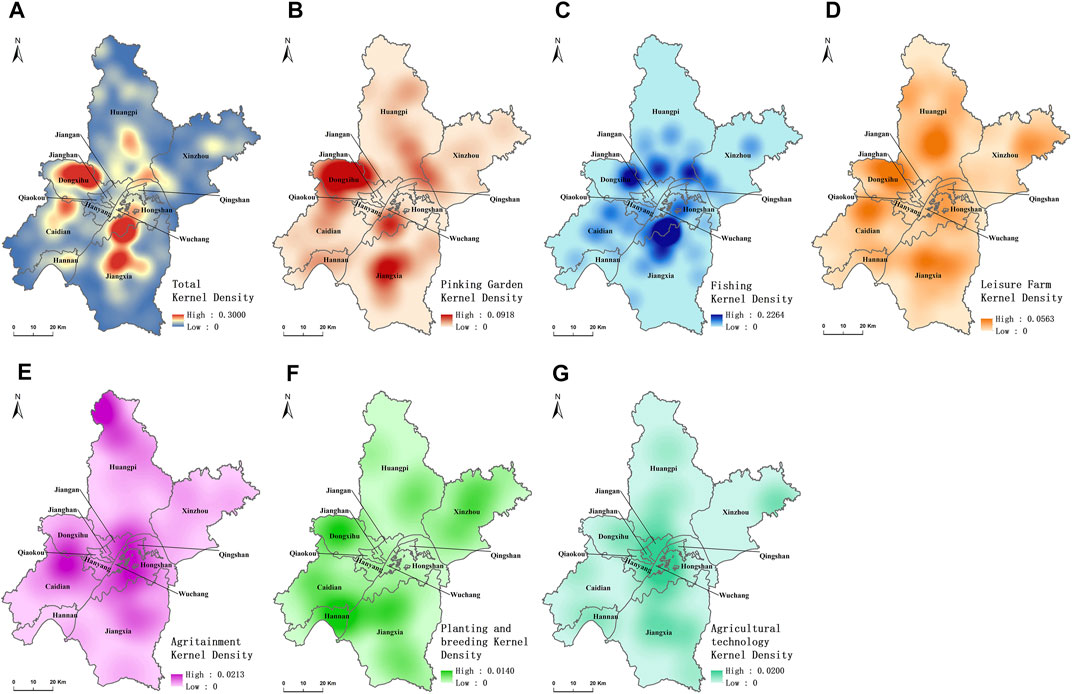
FIGURE 5. The kernel density of leisure agriculture in Wuhan: (A) All types; (B) Picking Garden; (C) Fishing; (D) Leisure Farm; (E) Agritainment; (F) Planting and breeding; (G) Agricultural Technology.
The results (Figure 6) show that the overall comments on leisure agriculture in Wuhan are positive, with a positive comment rate of 79.60%, a neutral comment rate of 1.51%, and a negative comment rate of 18.89%. However, since the numbers of comments on agricultural technology and planting and breeding are small, the analyses of these categories are unreliable, so they are not considered. Evaluations of all types of leisure agriculture in Wuhan are positive. Specifically, fishing received the most positive feedback, and picking gardens received the fewest positive reactions. Likewise, in terms of negative evaluations, picking gardens had the highest number, while fishing had the lowest number. In the future, we should focus on the development of picking gardens as a form of leisure agriculture.
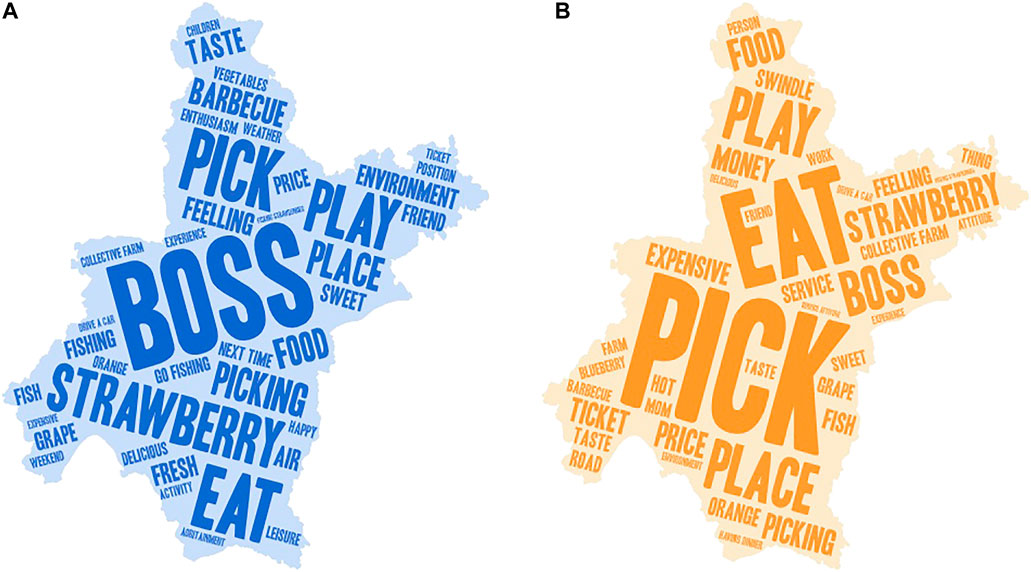
FIGURE 6. Keyword cloud of tourist comments on leisure agriculture in Wuhan: (A) Negative comments; (B) Positive comments.
Through the word segmentation analysis, it can be seen that leisure agriculture tourists in Wuhan mainly focus on products, environment, service, price, and travel. In terms of “products”, leisure agriculture activities mainly involve picking gardens and fishing, with “barbecue” and “vegetables” as the main characteristics. “Strawberry”, “grape” and “orange” are the most frequently picked foods, and “taste”, “sweet” and “fresh” are the important evaluation criteria. In terms of the “environment”, tourists pay attention to the quality of “weather” and “air”. “Farm” and “farmhouse” are the main locations for leisure agriculture in Wuhan. In terms of “service”, the main factors that tourists pay attention to are “boss”, “feeling” and “enthusiasm”. Furthermore, “price”, “ticket” and “expensive” are high-frequency words. Finally, in terms of “travel”, location is the main concern for tourists.
Wuhan, as the capital of Hubei Province, has the leading economy in the province, and it features many scenic spots. Its leisure agriculture has garnered praise from users based on services, products, and the environment. However, it still has some problems. Tourists have mixed evaluations of products, prices, services, the environment, or travel experiences. Among them, “expensive”, “ticket”, “money”, “buy”, “price” and other words frequently appear in negative comments, which shows that the cost of visiting has affected the development of regional leisure agriculture and needs to be improved. In addition, the quality of services is also an important factor.
The spatial distribution of the leisure agriculture quality evaluation scores in Wuhan is shown in Figure 7. The score range is −3.00 to +3.00, and the scores are divided into four levels: level I [1.50 to 3.00], level II [0.00 to 1.50), level III [−1.50 to 0.00), and level IV (−3.00 to −1.50]. Among the 425 businesses, 126 have received comments. The total score is concentrated between −1.50 and +1.74, and most of the businesses are located in level II or level I. Among them, 18 businesses have ratings below 0, which is poor. In addition, high-quality leisure agriculture businesses are distributed in almost all districts, while low-quality leisure agriculture businesses are mainly located in central Wuhan. As shown in Figure 7, tourists’ dissatisfaction is mainly due to environment, price, and travel factors, while product and service are relatively good.

FIGURE 7. Spatial distribution of the quality evaluation of leisure agriculture in Wuhan: (A) Overall quality; (B) Product level; (C) Environment level; (D) Service level; (E) Price level; (F) Travel level.
The numbers of leisure agriculture businesses in product levels I–IV is 60, 38, 6, and 3, respectively. Product scores are concentrated in levels I and II. Businesses with higher scores are distributed in almost all districts, and the businesses with lower scores are mainly distributed in Dongxihu and Jiangxia District, which are located in central and southern Wuhan, respectively. The environmental scores are concentrated in level II, and the scores of most businesses are low. The numbers of leisure agriculture businesses with service scores in levels I–IV are 51, 45, 9, and 2, respectively, showing a concentration of scores in levels I and II. The spatial distribution characteristics of service scores are similar to those of product scores. The numbers of leisure agriculture businesses with price scores in levels I–IV are 32, 8, 7, and 17, respectively. The price scores are concentrated in levels I and IV, with serious differentiation. Businesses with lower scores are mainly distributed in central and southern Wuhan. Finally, the travel scores are distributed in levels II-IV. Businesses with lower scores are mainly distributed in Hongshan District and Jiangxia District, which are located in central and southern Wuhan, respectively.
Considering the spatial patterns and quality of leisure agriculture, this paper proposes an optimization strategy for the sustainable development of leisure agriculture. Taking Wuhan as an example, the kernel density of 126 leisure agriculture businesses with review data were overlaid with the quality of these businesses for analysis, and the results are shown in Figure 8. The findings indicate that overall leisure agriculture in Wuhan is in the form of agglomeration. The average leisure agriculture quality score is 0.6591, and most of the businesses are located in levels I and II. On the whole, leisure agriculture in Wuhan is characterized by high agglomeration and high quality. Moreover, using the natural breaks method, the core density of leisure agriculture can be divided into two types. The type with high core density is high agglomeration, and the other type is low agglomeration. The results show that the average quality score for the high-agglomeration group is 0.6285, which is lower than the average value for businesses in the whole city. This finding indicates that excessive agglomeration has a negative impact on the quality of leisure agriculture. One possible reason is the competition among the homogeneous leisure agriculture businesses. The average quality score of low-concentration businesses is 0.7072, which is higher than the average quality of businesses in the whole city. This finding suggests that the low-agglomeration pattern promotes the development of local leisure agriculture. Scientific planning is beneficial to the development of the leisure agriculture industry. It is necessary to improve the quality of leisure agriculture in highly clustered areas, avoid excessive competition among businesses in the same industry, promote the coordinated development of industries, and promote the industrial agglomeration effect.
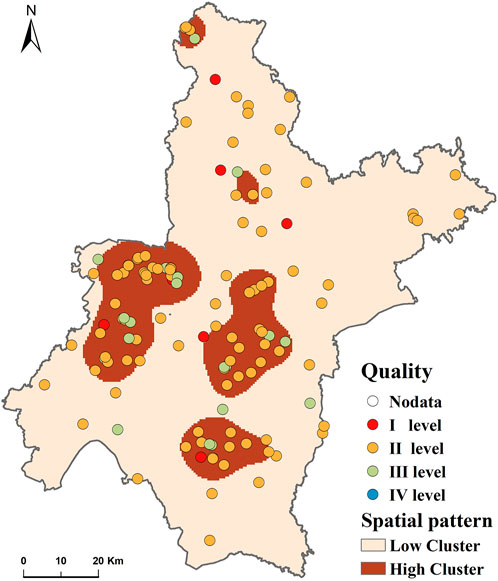
FIGURE 8. Quality score and spatial kernel density distribution of leisure agriculture.
From the perspective of development type, leisure farms are the most popular in Wuhan, followed by fishing, picking gardens, and agritainment. However, the activity that received the best tourist evaluations was fishing, followed by agritainment, leisure farms, and picking gardens. As the most widely distributed type of leisure agriculture in Wuhan, leisure farms should further improve the quality of businesses and enhance the experiences of tourists.
From the perspective of quality improvement suggestions, tourists’ dissatisfaction mainly involves environment, price, and travel factors. Based on the analysis of the text of tourists’ comments, the main environmental problems are poor scenery, small sites, and excessive dust, among others. We should pay attention to improving the environment of leisure agriculture businesses, selecting scenic areas when adding new businesses, and expanding business sites. The main price problems are high ticket prices and false advertising. Improvements include providing free tickets, allowing group purchases on websites, and offering discounts, among others. Travel problems mainly include inconvenient transportation, remote locations, and difficulty in finding the location. Attention should be given to increasing shop signage and offering timely telephone communication. The results suggest that the government should build roads to tourist destinations and establish public transportation or finance construction through other means. In addition, when planning new businesses, it is important to pay attention to factors such as traffic convenience and improve the comprehensive transportation system.
Leisure agriculture has become one way to promote agricultural diversification and enhance urban-rural integration. Therefore, leisure agriculture is promoted by the Chinese government (Cui et al., 2021). This study explores the optimization strategies of leisure agriculture that combine spatial patterns and tourists’ perceptions. Leisure agriculture is mostly distributed in peri-urban areas (Chang et al., 2018), which are exposed to urban pressures and land-use changes (Gao and Cheng, 2020; Zasada, 2011). Scientific spatial planning of leisure agriculture is conducive to considering the relationship between urban and rural areas. Leisure agriculture planning is mainly reflected in spatial patterns. The findings of this study regarding the agglomeration spatial patterns of leisure agriculture are consistent with multiple studies (Cui et al., 2021; Fanelli and Romagnoli, 2021; Van Sandt et al., 2018; Xiang et al., 2019), in which the authors suggest promoting the agglomeration of leisure agriculture. Our analysis has confirmed the generalizability of this view across Chinese cities. In addition, the matching relationship between the spatial patterns and the quality of leisure agriculture was analyzed. The results show that moderate agglomeration is beneficial to the quality of leisure agriculture, while excessive agglomeration has adverse effects. Leisure agriculture originated in developed countries, and gradually expanded from Europe to Japan, South Korea, Singapore, and other countries and regions in Asia. We suggest that this method be applied to the study of other cities to explore the relationship between the spatial patterns and quality of leisure agriculture and to optimize the development of regional leisure agriculture. Through extensive empirical analysis, it will be possible to determine the best spatial pattern of leisure agriculture according to local conditions.
The improvement of leisure agriculture depends on the understanding of the roles of consumers, which takes consumers’ preferences into consideration (Zasada, 2011). This study analyzes tourists’ perceptions using big data, which helps to explore the core issues of tourists’ concerns. A previous study found that leisure agriculture users pay attention to the requirements of diet, accommodation, and travel (Wu, 2019). We find that in addition to products and travel, the environment, service, and price are also important factors for leisure agriculture tourists in Wuhan. In addition, we evaluate the quality of leisure agriculture based on tourists’ perceptions; this approach clearly identifies the characteristics of leisure agriculture quality and its spatial patterns. The research shows that tourists’ dissatisfaction about leisure agriculture in Wuhan mainly results from the environment, price, and travel. This finding helps clarify the development focus of leisure agriculture in different regions and how scientific planning and management can be carried out. Moreover, these beneficial findings and discussions offer feasible suggestions for leisure agriculture development. In future development, on one hand, operators should ensure the richness of products, improve product quality, regularly maintain infrastructure, improve health and environmental conditions and service levels, and set reasonable consumer prices (Tsaur et al., 2016). On the other hand, the government and market should conduct reasonable layout planning for leisure agriculture while also scientifically managing customer complaints and improving comprehensive transportation (Liu et al., 2020).
The study helps to provide recommendations for sustainable leisure agriculture: (1) The spatial disparity of leisure agriculture needs to be emphasized, and development guidance should consider local situations. Spatial analysis is recommended for integration into leisure agriculture policy-making. (2) Spatial planning needs to combine the spatial distributions and quality of leisure agriculture to promote agglomeration and avoid excessive competition. (3) The quality improvement of leisure agriculture should be guided by market demand, especially consumer demand. It is important to conduct quality evaluations of leisure agriculture, build high-quality brands and avoid homogeneous competitiveness. (4) Effective measures should be taken to strengthen the supporting facilities of public services and provide professional training for leisure agriculture practitioners.
First, due to limitations of the data collection, this study does not analyze the evolution of leisure agriculture from the perspective of spatiotemporal dynamic patterns. In the future, we will explore the spatiotemporal evolution of leisure agriculture to understand development trends and to offer development suggestions. Second, because of the low accuracy of the existing classification methods, this paper uses manual interpretation to judge the characteristics of leisure agriculture reviews. In later work, we plan to use natural language processing and machine learning to characterize tourists’ experience evaluations and to improve the efficiency of these characterizations and the scientific rigor and accuracy of the method in later batch processing and comparative analyses between different cities.
This paper has constructed a framework for optimizing leisure agriculture using big data, taking Wuhan city as the case study for the analysis. The results show that the main types of leisure agriculture in Wuhan are leisure farms, fishing, and picking gardens, and the spatial pattern shows an agglomeration distribution. In planning the spatial distribution of leisure agriculture, attention should be given to appropriate agglomeration. As the most widely distributed type in Wuhan, leisure farms receive low tourist evaluation, so it is necessary to improve the quality of businesses and enhance tourists’ experiences.
High-quality leisure agriculture businesses are distributed in almost all districts in Wuhan, while low-quality sources are mainly located in the central part of the city. Tourists’ dissatisfaction with leisure agriculture mainly includes the environment, price, and travel factors, while products and services are relatively satisfactory. The sustainable development of leisure agriculture needs to take quality-building as the core, deeply tap into the regional industrial characteristics, and cultivate the competitiveness of leisure agriculture development. The purpose of this study was not only to guide the development of leisure agriculture in Wuhan, but also to explore tourist experiences and identify a suitable way forward for the development of leisure agriculture on a wider scale.
The original contributions presented in the study are included in the article/supplementary material, further inquiries can be directed to the corresponding author.
CW: Conceptualization, Methodology, Writing–original draft. SW: Methodology, Writing–review and editing. WY: Methodology, Software, Data curation. HB: Conceptualization, Writing–review and editing. JZ: Investigation, Data curation. XW: Writing–review and editing.
This work was supported by the Soft Science Program of Zhejiang Province (2022C35073), A Project supported by Scientific Research Fund of Zhejiang Provincial Education Department (Y202148202), Fundamental Research Funds for the Central Universities (2020CDJSK03XK06), and Natural science foundation of Zhejiang Province (LY20D010007).
The authors declare that the research was conducted in the absence of any commercial or financial relationships that could be construed as a potential conflict of interest.
All claims expressed in this article are solely those of the authors and do not necessarily represent those of their affiliated organizations, or those of the publisher, the editors and the reviewers. Any product that may be evaluated in this article, or claim that may be made by its manufacturer, is not guaranteed or endorsed by the publisher.
Bajgier-Kowalska, M., Tracz, M., and Uliszak, R. (2017). Modeling the State of Agritourism in the Malopolska Region of Poland. Tour. Geogr. 19 (3), 502–524. doi:10.1080/14616688.2017.1300935
Baležentis, T., Kriščiukaitienė, I., Baležentis, A., and Garland, R. (2012). Rural Tourism Development in Lithuania (2003-2010) - a Quantitative Analysis. Tour. Manag. Perspect. 2-3, 1–6. doi:10.1016/j.tmp.2012.01.001
Barbieri, C. (2020). Agritourism Research: A Perspective Article. Tour. Rev. 75 (1), 149–152. doi:10.1108/Tr-05-2019-0152
Benur, A. M., and Bramwell, B. (2015). Tourism Product Development and Product Diversification in Destinations. Tour. Manag. 50, 213–224. doi:10.1016/j.tourman.2015.02.005
Busby, G., and Rendle, S. (2000). The Transition from Tourism on Farms to Farm Tourism. Tour. Manag. 21 (6), 635–642. doi:10.1016/s0261-5177(00)00011-x
Chang, J., He, P., Gao, W. B., Guo, Y. H., Li, X., and Xi, X. D. (2018). Study on Spatial Distribution Characteristics of Leisure Agriculture in Chengdu. Chin. J. Agric. Resour. Regional Plan. 39, 206–214. (in Chinese). doi:10.7621/cjarrp.1005-9121.20180429
Chase, L. C., Stewart, M., Schilling, B., Smith, B., and Walk, M. (2018). Agritourism: Toward a Conceptual Framework for Industry Analysis. J. Agric. Food Syst. Community Dev. 8 (1), 13–19. doi:10.5304/jafscd.2018.081.016
Chen, Q. Y., Guan, X. H., and Huan, T.-C. (2021). The Spatial Agglomeration Productivity Premium of Hotel and Catering Enterprises. Cities 112. doi:10.1016/j.cities.2021.103113
Chhetri, A., Chhetri, P., Arrowsmith, C., and Corcoran, J. (2017). Modelling Tourism and Hospitality Employment Clusters: A Spatial Econometric Approach. Tour. Geogr. 19 (3), 398–424. doi:10.1080/14616688.2016.1253765
Choo, H., and Petrick, J. F. (2014). Social Interactions and Intentions to Revisit for Agritourism Service Encounters. Tour. Manag. 40, 372–381. doi:10.1016/j.tourman.2013.07.011
Cui, J. X., Li, R. H., Zhang, L. Y., and Jing, Y. (2021). Spatially Illustrating Leisure Agriculture: Empirical Evidence from Picking Orchards in China. Land 10 (6). doi:10.3390/land10060631
Da Liang, A. R., Nie, Y. Y., Chen, D. J., and Chen, P.-J. (2020). Case Studies on Co-branding and Farm Tourism: Best Match between Farm Image and Experience Activities. J. Hosp. Tour. Manag. 42, 107–118. doi:10.1016/j.jhtm.2019.11.009
Dubois, C., Cawley, M., and Schmitz, S. (2017). The Tourist on the Farm: A 'muddled' Image. Tour. Manag. 59, 298–311. doi:10.1016/j.tourman.2016.08.016
Estevão, C., and Ferreira, J. J. (2012). Tourism Cluster Positioning and Performance Evaluation: The Case of Portugal. Tour. Econ. 18 (4), 711–730. doi:10.5367/te.2012.0137
Fanelli, R. M., and Romagnoli, L. (2021). The Spatial Agglomeration of Italian Agritourism Farms. Reg. Stud. doi:10.1080/00343404.2021.1980523
Gao, C. L., and Cheng, L. (2020). Tourism-Driven Rural Spatial Restructuring in the Metropolitan Fringe: An Empirical Observation. Land Use Policy 95. doi:10.1016/j.landusepol.2020.104609
Giaccio, V., Giannelli, A., and Mastronardi, L. (2018). Explaining Determinants of Agri-Tourism Income: Evidence from Italy. Tour. Rev. 73 (2), 216–229. doi:10.1108/Tr-05-2017-0089
Goossen, M., and Langers, F. (2000). Assessing Quality of Rural Areas in the Netherlands: Finding the Most Important Indicators for Recreation. Landsc. Urban Plan. 46 (4), 241–251. doi:10.1016/S0169-2046(99)00058-4
Guo, H. C., and Lv, M. W. (2008). The Status Quo and Counter Measures of the Leisure Agriculture in China. Econ. Geogr. 28 (4). (in Chinese). doi:10.15957/j.cnki.jjdl.2008.04.032
Hawkins, D. E. (2004). A Protected Areas Ecotourism Competitive Cluster Approach to Catalyse Biodiversity Conservation and Economic Growth in Bulgaria. J. Sustain. Tour. 12 (3), 219–244. doi:10.1080/09669580408667235
Jacobsen, J. K. S., and Tømmervik, H. (2016). Leisure Traveller Perceptions of Iconic Coastal and Fjord Countryside Areas: Lush Naturalness or Remembrance of Agricultural Times Past? Land Use Policy 54, 38–46. doi:10.1016/j.landusepol.2016.01.013
Jing, Y., Liu, Y. L., Cai, E. X., Liu, Y., and Zhang, Y. (2018). Quantifying the Spatiality of Urban Leisure Venues in Wuhan, Central China - GIS-Based Spatial Pattern Metrics. Sustain. Cities Soc. 40, 638–647. doi:10.1016/j.scs.2018.05.015
Kastenholz, E., Carneiro, M. J., Marques, C. P., and Loureiro, S. M. C. (2018). The Dimensions of Rural Tourism Experience: Impacts on Arousal, Memory, and Satisfaction. J. Travel & Tour. Mark. 35 (2), 189–201. doi:10.1080/10548408.2017.1350617
Kim, Y. R., Williams, A. M., Park, S., and Chen, J. L. (2021). Spatial Spillovers of Agglomeration Economies and Productivity in the Tourism Industry: The Case of the Uk. Tour. Manag. 82. doi:10.1016/j.tourman.2020.104201
Lee, M.-S. (2012). An Analysis of the Critical Factors that Affect the Competitive Advantages and Developmental Strategies of Leisure Farms in Taiwan. Agric. Econ. - Czech 58 (10), 467–481. doi:10.17221/128/2011-AGRICECON
Lee, Y.-J. A., Jang, S., and Kim, J. (2020). Tourism Clusters and Peer-To-Peer Accommodation. Ann. Tour. Res. 83. doi:10.1016/j.annals.2020.102960
Li, J. J., Xu, L. Z., Tang, L., Wang, S. Y., and Li, L. (2018). Big Data in Tourism Research: A Literature Review. Tour. Manag. 68, 301–323. doi:10.1016/j.tourman.2018.03.009
Liu, C.-H., and Yen, L.-C. (2010). The Effects of Service Quality, Tourism Impact, and Tourist Satisfaction on Tourist Choice of Leisure Farming Types. Afr. J. Bus. Manag. 4 (8), 1529–1545. doi:10.5897/AJBM.9000578
Liu, C. Y., Dou, X. T., Li, J. F., and Cai, L. A. (2020). Analyzing Government Role in Rural Tourism Development: An Empirical Investigation from China. J. Rural Stud. 79, 177–188. doi:10.1016/j.jrurstud.2020.08.046
Liu, Y., Liu, X., Gao, S., Gong, L., Kang, C. G, Zhi, Y., et al. (2015). Social Sensing: A New Approach to Understanding Our Socioeconomic Environments. Ann. Assoc. Am. Geogr. 105 (3), 512–530. doi:10.1080/00045608.2015.1018773
Liu, Y. L., Jing, Y., Cai, E. X., Cui, J. X., Zhang, Y., and Chen, Y. Y. (2017). How Leisure Venues Are and Why? A Geospatial Perspective in Wuhan, Central China. Sustainability 9 (10), 1865. doi:10.3390/su9101865
Nazariadli, S., Morais, D. B., Barbieri, C., and Smith, J. W. (2018). Does Perception of Authenticity Attract Visitors to Agricultural Settings? Tour. Recreat. Res. 43 (1), 91–104. doi:10.1080/02508281.2017.1380144
Novelli, M., Schmitz, B., and Spencer, T. (2006). Networks, Clusters and Innovation in Tourism: A Uk Experience. Tour. Manag. 27 (6), 1141–1152. doi:10.1016/j.tourman.2005.11.011
Ohe, Y., and Kurihara, S. (2013). Evaluating the Complementary Relationship between Local Brand Farm Products and Rural Tourism: Evidence from Japan. Tour. Manag. 35, 278–283. doi:10.1016/j.tourman.2012.07.003
Pejanović, R., Demirović, D., Glavaš-Trbić, D., Maksimović, G., and Tomaš-Simin, M. (2017). Clusters as a Factor of Competitiveness of Rural Tourism Destinations in the Danube Region of the Republic of Serbia. Tour. Econ. 23 (2), 475–482. doi:10.5367/te.2015.0509
Qiu, S. C., Cai, L. P., Lehto, X. R., Huang, Z. J., Gordon, S., and Gartner, W. (2019). Reliving Self-Presentational Concerns in Rural Tourism. Ann. Tour. Res. 74, 56–67. doi:10.1016/j.annals.2018.10.005
Reichel, A., Lowengart, O., and Milman, A. (2000). Rural Tourism in Israel: Service Quality and Orientation. Tour. Manag. 21 (5), 451–459. doi:10.1016/s0261-5177(99)00099-0
Ren, K. R., and Dong, J. G. (2016). A Review of Leisure Agriculture. Chin. J. Agric. Resour. Regional Plan. 37 (3), 195–203. (in Chinese). doi:10.7621/cjarrp.1005-9121.20160334
Rozman, Č., Potočnik, M., Pažek, K., Borec, A., Majkovič, D., and Bohanec, M. (2009). A Multi-Criteria Assessment of Tourist Farm Service Quality. Tour. Manag. 30 (5), 629–637. doi:10.1016/j.tourman.2008.11.008
Sgroi, F., Donia, E., and Mineo, A. M. (2018). Agritourism and Local Development: A Methodology for Assessing the Role of Public Contributions in the Creation of Competitive Advantage. Land Use Policy 77, 676–682. doi:10.1016/j.landusepol.2018.06.021
Shen, S. Y., Wang, H., Quan, Q. H., and Xu, J. (2019). Rurality and Rural Tourism Development in China. Tour. Manag. Perspect. 30, 98–106. doi:10.1016/j.tmp.2019.02.006
Su, M. M., Wall, G., Wang, Y. A., and Jin, M. (2019). Livelihood Sustainability in a Rural Tourism Destination - Hetu Town, Anhui Province, China. Tour. Manag. 71, 272–281. doi:10.1016/j.tourman.2018.10.019
Tao, C. J. (2019). Development Efficiency of Leisure Agriculture Based on Dea Model in the Background of Rural Revitalization. Rev. Cercet. Interv. Soc. 67, 169–187. doi:10.33788/rcis.67.11
Tew, C., and Barbieri, C. (2012). The Perceived Benefits of Agritourism: The Provider's Perspective. Tour. Manag. 33 (1), 215–224. doi:10.1016/j.tourman.2011.02.005
Tsaur, S.-H., Yen, C.-H., and Ku, P.-S. (2016). An Evaluation Framework for the Sustainable Operation of Leisure Farms. Leis. Stud. 36 (6), 739–751. doi:10.1080/02614367.2016.1246589
Van Sandt, A., Low, S. A., and Thilmany, D. (2018). Exploring Regional Patterns of Agritourism in the U.S.: What's Driving Clusters of Enterprises? Agric. Resour. Econom. Rev. 47 (3), 592–609. doi:10.1017/age.2017.36
Volo, S. (2021). The Experience of Emotion: Directions for Tourism Design. Ann. Tour. Res. 86. doi:10.1016/j.annals.2020.103097
Walford, N. (2001). Patterns of Development in Tourist Accommodation Enterprises on Farms in England and Wales. Appl. Geogr. 21 (4), 331–345. doi:10.1016/S0143-6228(01)00010-8
Weidenfeld, A., Butler, R., and Williams, A. W. (2011). The Role of Clustering, Cooperation and Complementarities in the Visitor Attraction Sector. Curr. Issues Tour. 14 (7), 595–629. doi:10.1080/13683500.2010.517312
Wu, B. H., and Cai, L. P. A. (2006). Spatial Modeling Suburban Leisure in Shanghai. Ann. Tour. Res. 33 (1), 179–198. doi:10.1016/j.annals.2005.10.013
Wu, B. W. (2019). A Study of Leisure Agricultural Districts and Development Strategy in Zhejiang Province Based on Big Data. Hangzhou: Zhejiang University. (in Chinese).
Wu, C. H., Che, H., Chan, T. Y., and Lu, X. H. (2015). The Economic Value of Online Reviews. Mark. Sci. 34 (5), 739–754. doi:10.1287/mksc.2015.0926
Wu, H.-C., and Cheng, C.-C. (2017). What Drives Green Advocacy? A Case Study of Leisure Farms in Taiwan. J. Hosp. Tour. Manag. 33, 103–112. doi:10.1016/j.jhtm.2017.10.008
Wu, T.-c. (2018). Agriculture Tourism and the Transformation of Rural Countryside. Tour. Geogr. 20 (2), 354–357. doi:10.1080/14616688.2018.1434819
Xiang, Y., Chen, Y. J., Hou, Y. L., and Qu, B. X. (2019). Spatial Distribution and Influencing Factors of Leisure Agriculture: A Case from Hebei Province. Sci. Geogr. Sin. 39, 1806–1813. (in Chinese). doi:10.13249/j.cnki.sgs.2019.11.015
Xu, J., Yang, M. S., Hou, C. P., Lu, Z. L., and Liu, D. (2021). Distribution of Rural Tourism Development in Geographical Space: A Case Study of 323 Traditional Villages in Shaanxi, China. Eur. J. Remote Sens. 54, 318–333. doi:10.1080/22797254.2020.1788993
Xue, L., and Kerstetter, D. (2019). Rural Tourism and Livelihood Change: An Emic Perspective. J. Hosp. Tour. Res. 43 (3), 416–437. doi:10.1177/1096348018807289
Yan, Q., Zhou, S. M., and Wu, S. P. (2018). The Influences of Tourists' Emotions on the Selection of Electronic Word of Mouth Platforms. Tour. Manag. 66, 348–363. doi:10.1016/j.tourman.2017.12.015
Yang, W., and Ai, T. H. (2018). Poi Information Enhancement Using Crowdsourcing Vehicle Trace Data and Social Media Data: A Case Study of Gas Station. ISPRS Int. J. Geo-Information 7 (5), 178. doi:10.3390/ijgi7050178
Yang, Z. S., Hao, P., Liu, W. D., and Cai, J. M. (2016). Peri-Urban Agricultural Development in Beijing: Varied Forms, Innovative Practices and Policy Implications. Habitat Int. 56, 222–234. doi:10.1016/j.habitatint.2016.06.004
Zasada, I. (2011). Multifunctional Peri-Urban Agriculture-A Review of Societal Demands and the Provision of Goods and Services by Farming. Land Use Policy 28 (4), 639–648. doi:10.1016/j.landusepol.2011.01.008
Zhang, K., Chen, Y., and Li, C. L. (2019). Discovering the Tourists' Behaviors and Perceptions in a Tourism Destination by Analyzing Photos' Visual Content with a Computer Deep Learning Model: The Case of Beijing. Tour. Manag. 75, 595–608. doi:10.1016/j.tourman.2019.07.002
Keywords: leisure agriculture, spatial patterns, tourists' perceptions, quality evaluation, optimization strategy
Citation: Wang C, Wu S, Yang W, Bao H, Zhu J and Wang X (2022) Optimizing Leisure Agriculture by Analyzing Spatial Patterns and Tourists’ Perceptions: Evidence From Wuhan, China. Front. Environ. Sci. 10:851321. doi: 10.3389/fenvs.2022.851321
Received: 09 January 2022; Accepted: 11 March 2022;
Published: 17 May 2022.
Edited by:
Ding Ma, Shenzhen University, ChinaReviewed by:
Jun Yang, Northeastern University, ChinaCopyright © 2022 Wang, Wu, Yang, Bao, Zhu and Wang. This is an open-access article distributed under the terms of the Creative Commons Attribution License (CC BY). The use, distribution or reproduction in other forums is permitted, provided the original author(s) and the copyright owner(s) are credited and that the original publication in this journal is cited, in accordance with accepted academic practice. No use, distribution or reproduction is permitted which does not comply with these terms.
*Correspondence: Haijun Bao, aGFpanVuX2Jhb0AxMjYuY29t
Disclaimer: All claims expressed in this article are solely those of the authors and do not necessarily represent those of their affiliated organizations, or those of the publisher, the editors and the reviewers. Any product that may be evaluated in this article or claim that may be made by its manufacturer is not guaranteed or endorsed by the publisher.
Research integrity at Frontiers
Learn more about the work of our research integrity team to safeguard the quality of each article we publish.