 Ziheng Jiao
 Zhencheng Xing
 Guofeng Zhang1
 Haikun Wang
- 1State Key Laboratory of Pollution Control and Resource Reuse, School of the Environment, Nanjing University, Nanjing, China
- 2Joint International Research Laboratory of Atmospheric and Earth System Sciences, School of Atmospheric Sciences, Nanjing University, Nanjing, China
- 3Collaborative Innovation Center of Climate Change, Nanjing, China
- 4Frontiers Science Center for Critical Earth Material Cycling, Nanjing University, Nanjing, China
As the two largest developing countries globally, China and India have become the top 1 and 3 carbon emitters, respectively. Quantitating their CO2 emissions in terms of the characteristics and driving factors is highly significant to mitigating global climate change. This study compiled the CO2 emission inventories from 1990 to 2017 in China and India. The Tapio model and index decomposition analysis were used to analyze the impact of socio-economic factors on CO2 emissions. We found that 1) CO2 emissions of China and India reached 9526 and 2242 Mt, respectively, in 2017. CO2 emissions increased during 1990–2017 with an average annual growth rate of 5% in both countries. 2) In China, the economic development has remained weakly decoupling from emissions since 2012, reaching a strong decoupling (-0.2) in 2017. In contrast, the contribution of India’s economy to emissions continued to increase, and the decoupling status showed continuous fluctuations. 3) Economic development and population explosion were the dominant factors driving CO2 emissions in the countries. The effect of energy intensity inhibited India’s emissions growth after 2008 with an impact degree lower than China. Overall, our findings on the impact of the economy and emission development may provide references for other developing countries at different stages to achieve low-carbon development.
Introduction
As anthropogenic emissions increase from economic growth (Fu et al., 2021), developing countries may largely determine the future of global emissions in this century (Boyd and Green, 2015). China and India are the top two largest developing nations in the world. China became the biggest CO2 emitter in 2006 (European Commission, 2016), accounting for 28% of global CO2 emissions from anthropogenic sources in 2019 (Friedlingstein et al., 2020); whereas, India became the third-largest emitter in 2009 (behind China and the United States), contributing 7% of global fossil CO2 emissions in 2019 (Friedlingstein et al., 2020). Moreover, China and India rank second and sixth in the world economy, respectively; they accounted for 20.5% of the world’s total gross domestic product (GDP) (The World Bank, 2020) in 2019. To seek low-carbon economic development and mitigate global climate change, China has pledged to decrease carbon emissions per unit of GDP (i.e., emission intensity) by more than 65% compared with 2005 by 2030, toward achieving carbon neutrality by 2060 (The Chinese Government, 2020). On the other hand, India has designed Nationally Determined Contributions (NDCs) to reduce the emission intensity by 33%–35% (compared to the 2005 values) by 2030 (The Carbon Brief, 2020). In this context, accurate accounting of carbon emissions and quantitatively analyzing the driving effects of socio-economic factors influencing the emissions can provide a scientific basis to formulate energy conservation and emission reduction policies, and promote low-carbon actions in China and India. It can also provide an essential reference for developing countries to achieve low-carbon development, significant for mitigating global climate change.
With the adequate accounting of CO2 emissions, some studies have explored CO2 emission characteristics at a national scale for China and India. For example, in 2015 Liu et al. (2015b) used localized emission factors to calculate China’s CO2 emissions and establish China Emission Accounts and Datasets (CEADs), a published emission inventories of China from 2000 to 2018. From production and consumption perspectives, Wang et al. (2020) analyzed the temporal evolution and the key driving factors of India’s emissions. Elsewhere, Lee et al. (2021) calculated household carbon footprints in India and explained their variation between districts by socio-economic factors. Some studies also estimated and compared the CO2 emissions of various countries. Raghutla and Chittedi’s study focused on BRICS countries (Raghutla and Chittedi, 2020) while Hu et al. (2020) studied other Belt and Road countries. However, only a few studies have reported detailed comparisons on emission characteristics and evolution in China and India, the top two developing countries in economic development and human population.
VonWeizsacker used “decoupling” in 1989 to describe the relationship between economic growth and environmental impact (Weizsacker, 1989). In 2005, Tapio developed the “Tapio Decoupling Model” to subdivide the decoupling status into eight types (Tapio, 2005). Since then, the Tapio model has been widely used to analyze the dependence of energy consumption or CO2 emissions on economic development. Wu et al. (2018) used the Tapio model to analyze the decoupling trend of CO2 emissions from economic development in various countries from 1965 to 2015. They found that the decoupling trend of developing countries was generally weaker than that of developed countries, with China’s decoupling state superior to that of India. Chen et al. (2022) applied the decoupling analysis to the sector level, examining the robustness of the carbon Kuznets curve in China’s building sector. Elsewhere, Wang et al. (2019) analyzed the decoupling relationship between economic growth and energy consumption in China and India. They reported that China has initially achieved the decoupling of economy and energy consumption, while India’s decoupling status evinced irregular fluctuations. Accompanying the rapid industrialization and urbanization in China and India are various environmental problems. By comparing emission trends and characteristics between the two countries, decoupling analysis between CO2 emissions and economic development help to achieve stable economic growth while reducing environmental emissions.
Moreover, decomposition analysis has been widely used to analyze factors driving CO2 emissions. Likewise, the logarithmic mean Divisia index (LMDI), based on the Kaya identity, has been widely used to evaluate the impact of various factors on changes in CO2 emissions (Kaya, 1990) due to the index’s simplicity and lack of residual error. Many previous studies applied the LMDI at different scales, such as national scale (Li and Qin, 2019), and city scale (Kang et al., 2014). Also, it has been applied to various sectors, such as building sectors (Li et al., 2022) in China, while others analyzed the drivers of CO2 emissions in individual or multiple countries, such as Xu et al. (2016). In a survey of China and India, Wang et al. (2018) analyzed the driving factors of decoupling the relationship between economic growth and CO2 emissions during 1980–2014. Therein, an input-output model and structural decomposition analysis method analyzed the factors driving CO2 emissions in China and India during 2000–2014 (Wang and Zhou, 2020). However, few studies compared the emission driving factors in China and India in a long-time series using the LMDI method. By comparing the two largest developing countries globally, we can identify the common factors driving the CO2 emissions and propose the direction of efforts to realize the emission pledges.
In summary, few studies have adopted localized emission factors and updated data for emission accounting. Although many studies have established CO2 emission inventories in China, there are relatively few studies on India’s long-term CO2 emissions. Comparative studies between China and India regarding the characteristics and driving factors of CO2 emissions are even scarcer. To this end, this study compiled CO2 emission inventory of fossil fuel consumption and industrial process in China and India from 1990 to 2017 based on the Intergovernmental Panel on Climate Change (IPCC) emission accounting approach (Institute for Global Environmental Strategies, 2006) and nation-level emission factors. Then, we used the Tapio decoupling model with the socio-economic data from the World Bank to characterize the economic development and CO2 emissions, comparing the decoupling status in China and India from 1990 to 2017. We decomposed the driving factors of CO2 emissions into population effect, economy effect, energy intensity effect, and emission intensity effect to analyze the contributions of the driving factors for each period. This study aims to identify problems from the commonalities and learn from the differences by comparing the similarities and differences of the driving forces of the two countries’ socio-economic factors on CO2 emissions. The findings are valuable for achieving emission reduction targets during the current, rapid economic development. It also provides references for developing countries at different stages to formulate and effectively execute carbon emission reduction policies.
Materials and Methods
Estimation of CO2 Emissions
China’s CO2 Emissions
According to the Guidelines for Preparing Provincial Greenhouse Gas Inventory and our previous study (Liu et al., 2013), we developed China’s provincial CO2 emission inventories for 31 provinces from 2000 to 2017 based on a sectoral approach, including fossil fuel consumption sectors and industrial process sectors. Energy consumption emissions were calculated by multiplying activity data of sub-sectors with emission factors, including three sub-sectors of industrial energy consumption, transportation energy consumption, and other energy consumption (primary industrial, commercial and residential, etc.) sectors. The CO2 emissions from industrial energy consumption can be calculated as follows:
where CI is the CO2 emissions from industrial energy consumption, t-CO2; i represents the subsectors in the industrial sector; j is the various types of energy consumed; E is the energy consumption, the units correspond to various energy type, e.g., tons for coal, m3 for the natural gas; EF is the emission factors, t-CO2/unit energy consumption. Summing up the emissions of industrial sub-sectors obtains the CO2 emissions from industrial energy consumption. To avoid double counting, the energy consumption caused by the energy processing and conversion (such as washing coal, coking, etc.) were eliminated.
The energy-related CO2 emissions from the transportation sector based on the motor vehicle population can be estimated as follows:
where CT is CO2 emissions from transportation energy consumption, t-CO2; i represents the different types of vehicles (e.g., passenger cars, heavy duty trucks, buses, etc.); VP is the motor vehicle population; VMT is the vehicle miles traveled, km/vehicle; FE is fuel economy referring to the fuel consumption per unit mileage, L/km; EF is the CO2 emission factors, t-CO2/L; g represents gasoline; d represents diesel. Summing up the emissions of various vehicular type obtains the CO2 emissions from transportation energy consumption. We adopted the above method to calculate CO2 emissions from the transportation sector while eliminating the energy consumption of the transportation sub-sector from the industrial sectors to avoid double accounting.
The accounting method of other energy consumption sectors is similar to that of the industrial sectors, including primary industry, commercial sectors, and residential sectors, using the following equation:
where CO is the CO2 emissions from other energy consumption sectors, t-CO2; i represents different sectors; j is the various types of energy consumed; E is the energy consumption; EF is the CO2 emission factors, t-CO2/unit energy consumption. Adding up the emissions of various sectors results in the CO2 emissions from other energy consumption sectors.
The CO2 emissions from industrial process sectors (i.e., non-energy consumption emissions) refer to emissions during non-combustion industrial processes. Here, only the cement production process, which accounts for more than 75% of China’s industrial process emissions, was considered as follows:
where CC is the CO2 emissions emitted from the cement production process, t-CO2; M is the weight of the cement production, tons; R is the clinker ratio; I is the clinker import volume, tons; E is the clinker export volume, tons; EF is the CO2 emission factor, t-CO2/tons.
India’s CO2 Emissions
Compared with China’s highly uniform statistical data, India’s energy data are sometimes contradictory at different statistical levels. Therefore, we obtained unified energy consumption data from International Energy Agency (IEA) and adopted the IPCC apparent energy consumption approach (Liu et al., 2015), i.e., a top-down accounting approach to calculate CO2 emissions from the combustion of fossil fuels:
where C is the CO2 emissions from fossil fuels consumption; i represents different fuel types; E is the consumption of energy; EF is the emission factors.
Based on the apparent energy approach, primary and secondary energy consumptions were calculated from a production perspective as follows:
where Epe is primary energy consumption; EP is energy production; EE is energy exports; EI is energy imports; EIB is international fuel bunker; ESC is stock change; EN is non-energy use; Ese is secondary energy consumption.
Then, we used a similar approach with China to calculate India’s CO2 emissions from cement production:
where Cc is the CO2 emissions of the cement production process, t-CO2; M is the weight of the cement production, tons; R is the clinker ratio; EF is the CO2 emission factor, t-CO2/tons.
Uncertainty of Emissions
In this study, we quantified the uncertainties of CO2 emissions in China and India by using the method recommended in Guidelines for Preparing Provincial Greenhouse Gas Inventory (Liu et al., 2013). By comparing the results of this study with other global CO2 emission databases, we calculated the sample mean,
where
Tapio Decoupling Index
In general, there are two main methods of decoupling analysis: OECD decoupling factor model and Tapio decoupling model. The Tapio model effectively alleviates the high sensitivity of the OECD decoupling factor to the value at the beginning and end of the period. It further improves the objectivity and accuracy of the measurement of the decoupling relationship. In this study, we used the Tapio decoupling model to quantify the relationship between CO2 emissions and economic development, as expressed in the following equation:
where DI refers to the decoupling index; %∆C refers to the rate of the change in CO2 emissions from the baseline year to the target year; %∆G refers to the rate of the change in GDP from the baseline year to the target year; ∆C and ∆G represent the changes in CO2 emissions and GDP from the baseline year to the target year, respectively; C0 and G0 refer to the CO2 emissions and GDP in the baseline year, respectively; Ct and Gt refer to the CO2 emissions and GDP in the target year, respectively.
As the GDP of China and India maintained year-on-year growth (∆G > 0) from 1990 to 2017, four decoupling types were defined based on the decoupling index: DI < 0 is strong decoupling, indicating that the country’s economy is growing while CO2 emissions are decreasing; 0 < DI < 0.8 is weak decoupling, indicating that the growth rate of emissions is lower than the economic growth rate; 0.8 < DI < 1.2 is expansive coupling, indicating that the emissions are growing at roughly the same rate as the economy; DI > 1.2 is negative decoupling, indicating that the emissions are growing at a higher rate than the economy.
LMDI Decomposition Analysis
Based on the Kaya identity, we decomposed CO2 emissions (C) into the following driving factors: population (P), GDP per capita (g), energy intensity (energy consumption per unit of GDP, e), and emission intensity (CO2 emissions per unit energy consumption, f). Their relationship is expressed as follows:
As already mentioned, changes in CO2 emissions can be decomposed into the contribution of each driving factor, and the changes (ΔC) in CO2 emissions from the base year to year t can be expressed as follows:
where Ct and C0 are CO2 emissions at time t and 0;
Data Source
We obtained China’s activity data from the national or subnational statistics department (National Bureau of Statistics, 2019), and used the emission factors in the Guidelines for Preparing Provincial Greenhouse Gas Inventory (Liu et al., 2013) to account for the CO2 emissions of provinces from 2000 to 2017. Also, China’s 1990–1999 CO2 emissions were supplied by the Global Carbon Project (GCP) (The Global Carbon Projevt, 2020) to maintain the same time scale of data for China and India. India’s primary energy and secondary energy consumption data were derived from the IEA’s energy balance sheet for 1990–2017 (IEA, 2019), and the emission factors were measured by The Ministry of Environment and Forests of India (2010). Due to the lack of data from Indian statistics department in earlier years, India’s cement production and clinker ratio data were based on GCP for 1990–2017. And the clinker emission factors were based on the data from the Indian Cement Association (Cement Corporation of India Limited, 2017). For the analysis of socio-economic development and the decoupling status from CO2 emissions, population and GDP (the purchasing power parity in 2010) data of China and India were obtained from the World Bank (2020).
Results
Emission Accounting for China and India
China’s CO2 emissions from fossil fuel consumption and cement production were 2,420 Mt in 1990. It rapidly increased to 9,526 Mt in 2017, with an average annual growth rate of 5.2%. Similarly, India’s CO2 emissions from fossil fuel consumption and cement production also grew significantly from 588 Mt in 1990 to 2,242 Mt in 2017, at a similar average annual growth rate of 5.1%. In terms of total emissions, India’s CO2 emissions are consistently lower than China’s. The total emissions in 2017 were about 23.5% of China’s values over the same period, approximately equivalent to China’s 1990 emission level. As for emission trends both countries have experienced rapid growth. Since 2012, China’s CO2 emissions have remained relatively stable or with some slight decline, having an average annual growth rate of only 0.1% in 2017. However, India’s CO2 emissions still maintain an average annual growth rate of 3.4%, much higher than China’s.
The energy consumption of industries was consistently the primary source of CO2 emissions in China (Figure 1A). With the accession to the World Trade Organization after the 21st century, China’s heavy industry developed significantly that the CO2 emissions increased by 117% from 200 to 2008, with an average annual growth rate of >10.0%. Simultaneously, the industries’ energy consumption became a larger contributor than other sectors by accounting for >70% of total emissions in China. In 2007, the State Council of China promulgated the Comprehensive Work Plan for Energy Conservation and Emission Reduction, which controlled the rapid growth of high energy consumption. This initiative increased efforts to shut down outdated production facilities in power, steel, and other industries, resulting in a significant reduction in emissions from industrial energy consumption, thus slowing down the rate of CO2 emissions. Thus, from 2008 to 2012, the average annual growth rate of China’s CO2 emissions slowed to 7.0%, and the contribution of industrial energy consumption decreased yearly.

FIGURE 1. Emission trends and structure. (A) CO2 emissions of China, (B) CO2 emissions of India.
On the other hand, as China’s economy developed, residents’ living standards have also improved. After 2012 transportation energy consumption replaced industry energy consumption as the sector with the fastest growth in CO2 emissions in China. From 2000 to 2017, the motor vehicle population increased from 16.08 million to 217 million, and the CO2 emissions from transportation energy consumption increased from 328 to 1,466 Mt, with an average annual growth rate of 9.2%. In addition, CO2 emissions from other energy consumption (primary industrial, commercial, and residential sectors) increased at an average annual growth rate of 4.3% to reach 655 Mt CO2 by 2017. As a major cement producer, China’s CO2 emissions from cement production are growing; in 2017, this part of CO2 emissions was 809 Mt, 3.4 times the value in 2000. In 2017, CO2 emissions from industry energy consumption, transportation energy consumption, other energy consumption, and industrial process sectors were 69.2%, 15.4%, 6.9%, and 8.5%, respectively.
Although India’s CO2 emissions are not as large as China’s, the former exhibits an overall upward trend, with a growth rate that exceeds China’s (Figure 1B). From 2000 to 2004, India’s average annual growth rate of CO2 emissions was 4.4%, compared with China’s rate (10.0%). Since 2004, the Indian manufacturing sector has steadily improved the nation’s economy. Meanwhile, the CO2 emissions increased proportionately, with an average annual growth rate of 6.8% during 2004–2008, albeit lower than China’s level (10.4%). From 2008 to 2012, India’s total CO2 emissions maintained a rapid growth of >6%, basically at par with China’s 7.0%. After, the overall growth rate of India’s CO2 emissions decreased, recording 3.8% from 2012 to 2017. However, due to the significant decline in China’s CO2 emissions growth, India’s rose higher than China’s level (0.1%). During our study period, the contribution of the various sources to India’s CO2 emissions changed slightly: coal was usually the primary source of CO2 emissions that accounted for 70%, followed by oil (20%), natural gas (5%), and cement production (5%). The growth rate of emissions from natural gas consumption was 6.6%, higher than those from coal and oil (both 5.0%), probably because natural gas in India had the dual advantages of cleanliness and cheapness over liquid fuels (such as diesel and furnace fuel oil). Thus, the production and importation of natural gas increased substantially. Furthermore, due to the considerable increase in India’s cement production, CO2 was produced in large quantities from cement production, averaging an annual growth rate of 5.5%.
We compared the CO2 emissions in China and India with other databases (Shan et al., 2018, Shan et al., 2020) to quantify the uncertainty. During our study, the uncertainties of China’s CO2 emissions were within ±10%, and the uncertainties of India’s estimation was generally higher than that of China, within ±15% (see more details in Supplementary Materials).
Emission Characteristics for China and India
We compared the socio-economic status (population, GDP, and industrial structure) and emissions per unit (per capita CO2 emissions and per GDP CO2 emissions) of China and India (Figure 2). In 1990, China’s population exceeded a billion and increased by 22.1% to 1.39 billion in 2017. In the same period, India’s population had grown from 0.87 to 1.34 billion at a rate more than twice China’s (Figure 2A). In the early 1990s, the GDP gross of China and India were both below US$1 trillion (i.e., the purchasing power parity (PPP) in 2010), as shown in Figure 2B. From 1990 to 2017, China’s GDP increased to US$10.2 trillion (2010 PPP) at an average annual growth rate of 9.7%, while India’s GDP increased to US$2.7 trillion (2010 PPP) at a growth rate of 6.3%, ≈26.3% of China’s GDP in 2017 and equivalent to China’s GDP 2002 level.
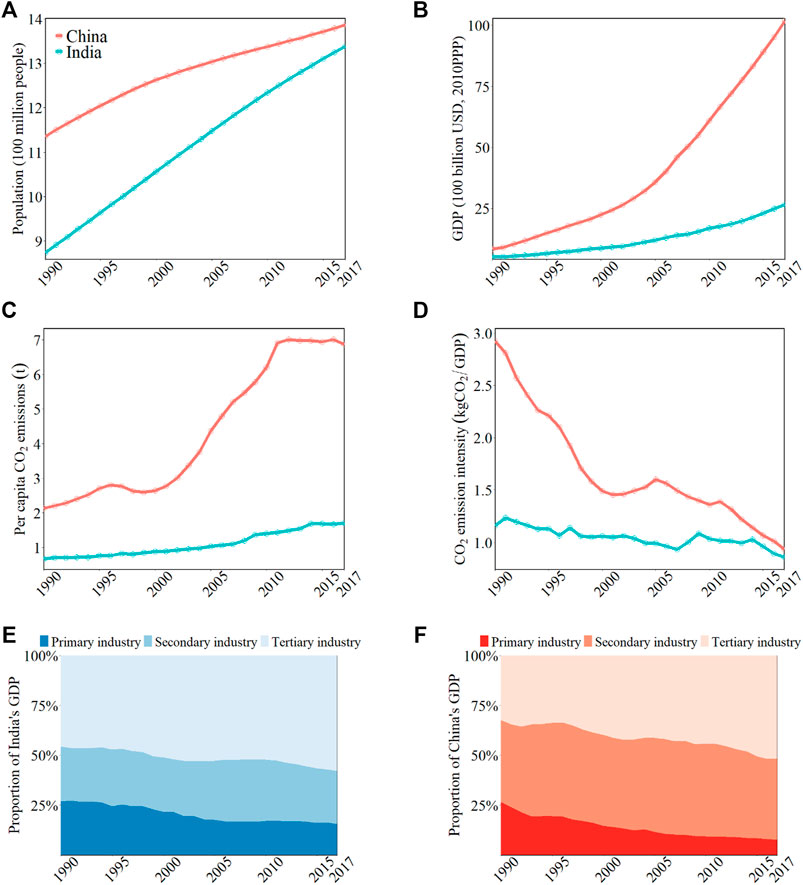
FIGURE 2. Emission and socio-economic characteristics of China and India. (A) Population, (B) gross domestic product (GDP), (C) per capita CO2 emissions, (D) CO2 emission intensity, (E) proportion of Chinese GDP, (F) proportion of India GDP. The red line represents China in (A–D), and the blue line represents India. The colors from dark to light represent the proportion of primary, industrial, and tertiary industry added value to GDP, respectively in (E,F).
Figure 2C depicts that India’s per capita CO2 emission in 2017 was 21.4% lower than China’s per capita CO2 emissions in 1990. Since 1990, the CO2 emission intensity declined with fluctuation in both nations (Figure 2D). During 1990–2017, China’s CO2 emission intensity fell at an average annual rate of 4.1%, indicating that the economy had gradually entered a stage of high-quality development. India’s CO2 emission intensity reduced at an annual rate of 1.2%, much below China’s rate of decline over the same period. Figure 2D informs that China’s CO2 emission intensity has always been higher than India’s. However, compared to 2.5 times in 1990, it has reduced to only 8.7% difference in 2017, attributed to the changes in the industrial structure in the two countries (Figures 2E,F). As the proportion of industrial sectors declined with fluctuation, and the tertiary industry steadily increased after 2012, the tertiary industry became a new driving force for economic growth, contributing more to China’s GDP than the secondary industry. Although the proportion of the tertiary industry in India was higher than China’s, the rate of development of India’s industry and service industry were lower, as the economic structure changed more slowly than in China. Therefore, China’s CO2 emission intensity declined faster, resulting in the convergence of the two countries’ levels in 2017.
Decoupling of CO2 Emissions From Economic Development
To further quantify the relationship between CO2 emissions and economic development, we used the Tapio decoupling model to analyze the decoupling status of CO2 emissions from economic development viewpoint between China and India (Figure 3). During our study, China’s CO2 emissions developed from a steadily weak decoupling (0 < DI < 0.8) to a negative decoupling (DI > 1.2), and then to a strong decoupling (DI < 0) from national economic growth. From 1991 to 1999, China’s decoupling index was between 0 and 0.8, in a weak decoupling state. In 1998, it reached a strong decoupling state (−0.56), indicating that China’s CO2 emissions grew roughly in line with the economy, and the decoupling state was ideal. After 2000, China’s decoupling index continued to rise, reaching 1.5 in 2005, and declined slightly but still between weak decoupling and negative decoupling from 2006 to 2011. After the 12th Five-Year Plan, China’s decoupling index declined and fluctuated with strong decoupling in 2016–2017. This scenario suggested that China’s economic development was, gradually, no longer attributed to high energy consumption and high CO2 emissions.
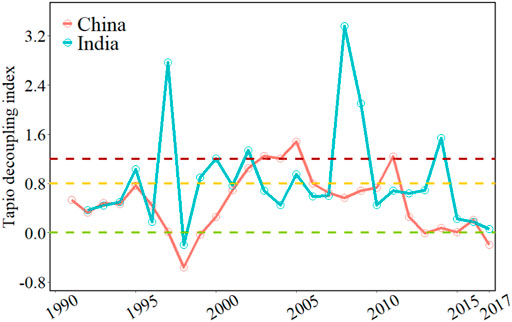
FIGURE 3. Decoupling index of China and India, 1991–2017.
Until 2017, India has not shown strong decoupling, and in more years shown weak decoupling and negative decoupling alternately. During 1990–1999, India’s decoupling status was weak (0.8 < DI < 1.2) and negative. From 2000 to 2009, India’s decoupling state did not change much, mainly weak decoupling and negative decoupling. For example, in 2008, when its decoupling index was as high as 3.4 due to the impact of the international financial crisis, the growth rate of CO2 emissions (10.4%) was much higher than its economic growth rate (3.1%). Then until 2017, India’s decoupling was mostly weak and occasionally negative. In the same period, China’s decoupling of CO2 emissions from economic development has been stably weak and shown a trend of strong decoupling.
Factors Driving CO2 Emissions
We segmented our study (1990–2017) into six periods. Then we quantified the impact of four driving factors (population, GDP per capita, energy intensity, and emission intensity) on the CO2 emissions in China and India. As shown in Figures 4A,B, the economic effects in the countries are the major factor that promoted CO2 emissions, with different changes in impact.
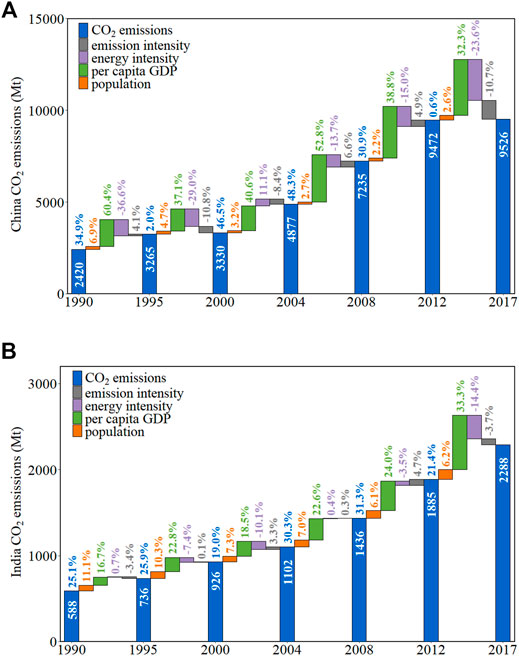
FIGURE 4. Impact of four driving factors. (A) CO2 emissions of China, (B) CO2 emissions of India.
From 1990 to 1995, the growth in GDP per capita contributed to a 1463 Mt increase in China’s CO2 emissions, evincing as the most significant driver of the total CO2 emissions. During this period, China was in a critical transition to a socialist market economy, with per capita GDP rapidly increasing by 68.0%. India’s GDP per capita change also caused the highest CO2 emissions in the same period. Moreover, population growth was the second-largest driver of emissions in both countries, contributing 168.1 and 65.1 Mt of CO2 emissions in China and India, respectively. The difference was that energy intensity and emission intensity predetermined China’s and India’s inhibition effects, respectively.
From 1995 to 2000, China’s and India’s emissions increased by 2.0% and 25.9%, respectively. During this period, economic and population growth were still the driving factors for the China’s CO2 emissions, while energy intensity and emission intensity showed significant inhibition, causing 947.5 and 352.2 Mt negative CO2 emissions in China and India, respectively. At the same time, India’s energy intensity reduced CO2 emissions, while the emission intensity during this period reduced.
From 2000 to 2004, China’s CO2 emission growth rate accelerated significantly, and the economy was the most crucial factor in the growth of emissions. Emission intensity became the only factor that reduced China’s CO2 emissions. During this period, the growth rate of India’s emissions decreased slightly, with the economy remaining the main driving. The impact of energy intensity was similar to that of the previous period. Compared with China, India’s energy intensity and emission intensity exhibited contrasting impacts related to the difference in industrial structure in the two countries. China’s industrial sectors have been thriving since 2000, while India has shown rapid growth of the service industry and slow development of the industrial sector (Figures 2E,F).
Overall, China’s CO2 emissions increased by 48.3% from 2004 to 2008. The economic effect was still the main driving factor, seconded by the emission intensity. The increase of emission intensity was due to the rapid development in China’s heavy industry (e.g., the added value of China’s industrial GDP in 2008 reached 2.3 times that in 2004), resulting in the massive demand for coal leading to higher emission intensity. Meanwhile, India’s emissions proliferated, with an overall growth rate of 30.3%. During this period, the four driving factors all positively influenced India’s CO2 emissions growth, in order of economy effect, population effect, energy intensity effect and emission intensity effect. However, China’s energy intensity effect has shown an inhibition effect in this period, implying the lag in India’s upgrading of industrial technology.
From 2008 to 2012, China’s CO2 emissions growth began to depreciate, with an overall increase of 30.9%, while the contribution of economic effect dropped. On the other hand, the growth of India’s emissions did not change significantly, with a 29.3% increase between 2008 and 2012. The inhibition effect of energy intensity in China was more prominent. Such observation indicated that with economic structure optimization and technological improvement, China’s energy consumption per unit of economic output decreased more rapidly than India’s.
From 2012 to 2017, China’s CO2 emissions remained stable, with an overall increase of only 0.6%. Both the energy intensity and the emission intensity had begun to inhibit emission growth. During this period, India’s emissions began to grow faster than China’s, with 20.7% overall increase. Energy intensity and emission intensity also became the negative driving factors in India. But unlike China, the contribution of economy effect on India’s emissions gradually increased with time, while it started to show a decreasing effect in China.
In summary, from 1990 to 2017, the economic effect was the main driving factor behind the growth of CO2 emissions in China and India. In addition, the energy intensity was the main driving factor for restraining the growth of CO2 emissions, and the restrain was more impactful in China because of different industrial structures between the nations. As the second major factor promoting the emissions, the population effect had gradually decreased in China while remaining stable in India. In addition, both the positive and negative effects of emission intensity on India’s emissions were relatively small.
Discussion
China and India have experienced some increase in CO2 emissions, with similar annual growth rates. From investigating the role of driving factors, we inferred that economic development, represented by per capita GDP, is the main driver of emission growth in both countries. This deduction is similar to the results of the structural decomposition analysis by Wang et al. (2020). But as China’s economy gradually entered the New Normal after 2012, China got rid of extensive and expansionary economic development. The growth rate of CO2 emissions in China has also slowed down significantly. And macroscopically, it has shown a strong decoupling from economic development. This occurrence also reflects a further decline in the economic contribution to emissions, which can be offset by the inhibition effect of emissions efficiency. On the one hand, the improvement of the industrial structure promotes the reduction of energy intensity. The added value of the secondary industry, i.e., relatively energy-intensive, has steadily decreased in its share of the nation’s GDP, enabling a low growth rate of energy consumption to support medium-high speed economic development. This deduction was also confirmed in the study of energy and economic decoupling by Li et al. (2021). Moreover, China’s energy consumption has become cleaner. Since 2012, the proportion of clean energy generation (such as wind energy, hydro energy, nuclear energy, and photovoltaic power) has been increasing. And under the guidance of carbon peaking and carbon neutrality goals, the industrial structure and energy structure will be further optimized, and the inhibition effect on emissions is expected to improve.
Likewise, economic growth has inevitably come at the expense of rising CO2 emissions for India. Because the decoupling state is fluctuating, it has not yet shown a strong decoupling trend. Besides, India’s population growth has always been a stronger driver of CO2 emissions than in China. Household consumption is also confirmed to be the largest contributor to emissions in Indian states in the analysis of consumption-based emissions in India (Huang et al., 2021). In view of the further growth of the Indian population, a low-carbon lifestyle is sacrosanct. India’s energy and emission intensities have also played an essential role in curbing the growth of CO2 emissions. But on current trends, to offset the pressure on CO2 emissions from future population and economic growth, India needs to intensify efforts to improve emission efficiency. Also, it should be acknowledged that, although India is also an emerging developing country, India cannot repeat China’s past CO2 emission path. With the urgent goal of 1.5°C global mitigation, India needs to explore a developmental path that balances economic growth with CO2 emissions. While the nation improves the energy use and emission efficiency, it may bypass carbon-intensive growth in emerging areas through sustainable planning and construction, rather than reproducing the process of linking and then decoupling between the economy and emissions.
Conclusion and Policy Implications
In the study, we first calculated CO2 emissions from fossil fuel consumption and cement production in China and India from 1990 to 2017. Then, we analyzed the characteristics of the emissions during this period and the decoupling of economic development and CO2 emissions between the two countries. Finally, the contribution of four driving factors viz. population, economy, energy intensity, and emission intensity, to CO2 emissions was quantitatively analyzed. The main conclusions are as follows:
1. As the most dominant developing countries and CO2 emitters in the world, the CO2 emissions in China and India increased with an average annual growth rate slightly higher than 5% from 1990 to 2017. It was observed that a convergence existed in the emission intensity between the two countries, due to the more significant decline in China’s emission intensity in recent years.
2. From the perspective of the decoupling status of CO2 emissions from economic development, by 2017, China had shown a strong decoupling, mainly due to a gradual slowdown and even negative in the growth of emissions; whereas, India’s decoupling status has been fluctuating continuously. And since 2012, it has predominantly shown weak decoupling, indicating that India’s emissions growth is slightly slower than its economic growth.
3. During our study period, the economy effect was always the main driving factor for increasing the growth of CO2 emissions in China and India, while the energy intensity was the main driving factor for restraining CO2 emissions. The difference is that the economy effect on China’s emissions has gradually decreased, while it contributed an increasing influence to India’s emissions. Meanwhile, the inhibition of energy intensity on India’s emissions was not as obvious as that of China. As the second major factor driving the growth of CO2 emissions, the population effect has gradually reduced its role in promoting emissions in China, but remained stable at around 7.0% in India. Emission intensity began restraining emissions in China and India after 2012.
Since energy intensity has always been the most prominent factor restraining the growth of CO2 emissions in China and India, the improvement of energy efficiency should be taken as a continuous policy in both countries. China should improve the energy utilization efficiency of key energy-consuming industries (such as electric power and steel) to reach the world’s advanced level. And India, based on solving the energy shortage problem, should further establish a comprehensive and complete energy-saving policy system. China and India are both large energy-consuming countries and have maintained a coal-based energy consumption structure since 1990. It is necessary to reduce coal consumption, promote high-quality energy, such as natural gas, and develop new renewable energy (such as wind energy and biomass energy) to build a low-carbon energy system.
We found that the growth of China’s CO2 emissions from fossil fuel consumption and cement production began to slow down, gradually reducing the contribution of economy effects to the total emissions. Such is reflected as China’s optimization of the industrial structure in the new phase of economic development. In the future, China should promote sustainable economic growth while vigorously developing low-carbon and environmental protection industries to look for novel methods to improve their economy and avoid the growth of CO2 emissions in emerging industries. In contrast, India’s CO2 emissions growth has always been linearly related to economic growth, and the driving role of the economy on emissions is still strengthening. If India imitates China’s economic growth pattern in the past 35 years, India’s energy consumption will increase substantially by 2050. Consequently, to meet domestic energy demand, India can develop renewable energy in the future, especially leveraging its geographical advantages to promote wind and solar forms of energy.
Data Availability Statement
The original contributions presented in the study are included in the article/Supplementary Material, further inquiries can be directed to the corresponding author.
Author Contributions
ZJ (postgraduate student): Data curation, Validation, Writing—original draft. ZX (research assistant): Validation, Writing—review and editing. GZ (postgraduate student): Writing—original draft. XM (postgraduate student): Methodology, Investigation. HW (professor): Conceptualization, Funding acquisition, Writing—review and editing, Supervision.
Funding
This work was supported by Humanities and Social Sciences Foundation of Ministry of Education in China (21YJC790130); National Social Science Foundation of China (20BGL196); the Fundamental Research Funds for the Central Universities, China (0207-14380179).
Conflict of Interest
The authors declare that the research was conducted in the absence of any commercial or financial relationships that could be construed as a potential conflict of interest.
Publisher’s Note
All claims expressed in this article are solely those of the authors and do not necessarily represent those of their affiliated organizations, or those of the publisher, the editors and the reviewers. Any product that may be evaluated in this article, or claim that may be made by its manufacturer, is not guaranteed or endorsed by the publisher
Supplementary Material
The Supplementary Material for this article can be found online at: https://www.frontiersin.org/articles/10.3389/fenvs.2022.847062/full#supplementary-material
References
Cement Corporation Of India Limited (2017). Cement Corporation of India Annual Report 2016-2017. Available at: https://www.cciltd.in/page.php?id=29/(Accessed December 31, 2020).
Chen, M., Ma, M., Lin, Y., Ma, Z., and Li, K. (2022). Carbon Kuznets Curve in china's Building Operations: Retrospective and Prospective Trajectories. Sci. Total Environ. 803, 150104. doi:10.1016/j.scitotenv.2021.150104
European Commission (2016). Emission Database for Global Atmospheric Research (EDGAR v4.3.2). Available at: http://edgar.jrc.ec.europe.eu (Accessed January 18, 2021).
Friedlingstein, P., O'Sullivan, M., Jones, M. W., Andrew, R. M., Hauck, J., Olsen, A., et al. (2020). Global Carbon Budget 2020. Earth Syst. Sci. Data 12, 3269–3340. doi:10.5194/essd-12-3269-2020
Fu, B., Li, B., Gasser, T., Tao, S., Ciais, P., Piao, S., et al. (2021). The Contributions of Individual Countries and Regions to the Global Radiative Forcing. Proc. Natl. Acad. Sci. USA 118, e2018211118. doi:10.1073/pnas.2018211118
Hu, M., Li, R., You, W., Liu, Y., and Lee, C.-C. (2020). Spatiotemporal Evolution of Decoupling and Driving Forces of CO2 Emissions on Economic Growth along the Belt and Road. J. Clean. Prod. 277, 123272. doi:10.1016/j.jclepro.2020.123272
Huang, Q., Zheng, H., Li, J., Meng, J., Liu, Y., Wang, Z., et al. (2021). Heterogeneity of Consumption-Based Carbon Emissions and Driving Forces in Indian States. Adv. Appl. Energ. 4, 100039. doi:10.1016/j.adapen.2021.100039
IEA (2019). World Energy Balances and Statistics. Available at: https://www.iea.org/data-and-statistics/data-tables/(Accessed December 30, 2020).
Institute for Global Environmental Strategies (IGES) (20062006). IPCC Guidelines for National Greenhouse Gas Inventories. Paris: IPCC.
Kang, J., Zhao, T., Liu, N., Zhang, X., Xu, X., and Lin, T. (2014). A Multi-Sectoral Decomposition Analysis of City-Level Greenhouse Gas Emissions: Case Study of Tianjin, China. Energy 68, 562–571. doi:10.1016/j.energy.2014.01.023
Kaya, Y. (1990). Impact of Carbon Dioxide Emission Control on GNP Growth: Interpretation of Proposed Scenarios. Paris: IPCC.
Lee, J., Taherzadeh, O., and Kanemoto, K. (2021). The Scale and Drivers of Carbon Footprints in Households, Cities and Regions across India. Glob. Environ. Change 66, 102205. doi:10.1016/j.gloenvcha.2020.102205
Li, C., Hu, H., Deng, L., Liu, Y., and Wang, Z. (2021). Structural Decoupling the Sectoral Growth from Complete Energy Consumption in china. Energ. Strategy Rev. 34, 100634. doi:10.1016/j.esr.2021.100634
Li, H., and Qin, Q. (2019). Challenges for China's Carbon Emissions Peaking in 2030: A Decomposition and Decoupling Analysis. J. Clean. Prod. 207, 857–865. doi:10.1016/j.jclepro.2018.10.043
Li, K., Ma, M., Xiang, X., Feng, W., Ma, Z., Cai, W., et al. (2022). Carbon Reduction in Commercial Building Operations: A Provincial Retrospection in china. Appl. Energ. 306, 118098. doi:10.1016/j.apenergy.2021.118098
Liu, M., Wang, H., Wang, H., Oda, T., Zhao, Y., Yang, X., et al. (2013). Refined Estimate of China's CO2 Emissions in Spatiotemporal Distributions. Atmos. Chem. Phys. 13, 10873–10882. doi:10.5194/acp-13-10873-2013
Liu, Z., Guan, D., Wei, W., Davis, S. J., Ciais, P., Bai, J., et al. (2015). Reduced Carbon Emission Estimates from Fossil Fuel Combustion and Cement Production in China. Nature 524, 335–338. doi:10.1038/nature14677
National Bureau of Statistics (2019). China Energy Statistical Yearbook. Beijing: China Statistical Publishing House.
Raghutla, C., and Chittedi, K. R. (2020). Financial Development, Energy Consumption, Technology, Urbanization, Economic Output and Carbon Emissions Nexus in BRICS Countries: an Empirical Analysis. Meq 32, 290–307. doi:10.1108/meq-02-2020-0035
Shan, Y., Guan, D., Zheng, H., Ou, J., Li, Y., Meng, J., et al. (2018). China CO2 Emission Accounts 1997-2015. Sci. Data 5, 170201–201. doi:10.1038/sdata.2017.201
Shan, Y., Huang, Q., Guan, D., and Hubacek, K. (2020). China CO2 Emission Accounts 2016-2017. Sci. Data 7, 54. doi:10.1038/s41597-020-0393-y
Tapio, P. (2005). Towards a Theory of Decoupling: Degrees of Decoupling in the EU and the Case of Road Traffic in Finland between 1970 and 2001. Transport Policy 12, 137–151. doi:10.1016/j.tranpol.2005.01.001
The Carbon Brief (2020). The Carbon Brief Profile: India. Available at: https://www.carbonbrief.org/.
The Chinese Government (2020). Speech at the General Debate of the 75th Session of the United Nations General Assembly. Beijing, China: The Xinhua News Agency.
The Global Carbon Project (2020). Global Carbon Atlas. http://www.globalcarbonatlas.org/(Accessed January 20, 2021).
The Ministry of Environment and Forests of India (2010). India: Greenhouse Gas Emissions 2007. Available at: http://indiaenvironmentportal.org.in/content/305562/india-greenhouse-gas-emissions-2007/(Accessed December 30, 2020).
The World Bank (2020). World Bank Open Data. Available at: https://www.worldbank.org/(Accessed December 28, 2020).
Wang, Q., Jiang, R., and Zhan, L. (2019). Is Decoupling Economic Growth from Fuel Consumption Possible in Developing Countries? - A Comparison of China and India. J. Clean. Prod. 229, 806–817. doi:10.1016/j.jclepro.2019.04.403
Wang, Q., Su, M., and Li, R. (2018). Toward to Economic Growth without Emission Growth: The Role of Urbanization and Industrialization in China and India. J. Clean. Prod. 205, 499–511. doi:10.1016/j.jclepro.2018.09.034
Wang, Q., and Zhou, Y. (2020). Evolution and Drivers of Production-Based Carbon Emissions in China and India: Differences and Similarities. J. Clean. Prod. 277, 123958. doi:10.1016/j.jclepro.2020.123958
Wang, Z., Meng, J., and Guan, D. (2020). Dynamic Driving Forces of India's Emissions from Production and Consumption Perspectives. Earth's Future 8, e2020EF001485. doi:10.1029/2020ef001485
Weizsacker, V. (1989). Earth Policy: Ecological Realpolitik on the Threshold of the Century of the Environment. Darmstadt: Scientific Book Society.
Wu, Y., Zhu, Q., and Zhu, B. (2018). Decoupling Analysis of World Economic Growth and CO2 Emissions: A Study Comparing Developed and Developing Countries. J. Clean. Prod. 190, 94–103. doi:10.1016/j.jclepro.2018.04.139
Keywords: carbon emissions, decoupling, driving factors, China, India
Citation: Jiao Z, Xing Z, Zhang G, Ma X and Wang H (2022) Comparing Decoupling and Driving Forces of CO2 Emissions in China and India. Front. Environ. Sci. 10:847062. doi: 10.3389/fenvs.2022.847062
Received: 01 January 2022; Accepted: 03 March 2022;
Published: 14 April 2022.
Edited by:
Zhen Wang, Huazhong Agricultural University, ChinaCopyright © 2022 Jiao, Xing, Zhang, Ma and Wang. This is an open-access article distributed under the terms of the Creative Commons Attribution License (CC BY). The use, distribution or reproduction in other forums is permitted, provided the original author(s) and the copyright owner(s) are credited and that the original publication in this journal is cited, in accordance with accepted academic practice. No use, distribution or reproduction is permitted which does not comply with these terms.
*Correspondence: Haikun Wang, d2FuZ2hrQG5qdS5lZHUuY24=
†These authors have contributed equally to this work and share first authorship