 Jia Du
 Jingfeng Liu
 Mingjun Zhang
95% of researchers rate our articles as excellent or good
Learn more about the work of our research integrity team to safeguard the quality of each article we publish.
Find out more
ORIGINAL RESEARCH article
Front. Environ. Sci. , 18 March 2022
Sec. Atmosphere and Climate
Volume 10 - 2022 | https://doi.org/10.3389/fenvs.2022.843948
This article is part of the Research Topic The Impacts of Atmospheric and Environmental Changes of Urban Cities and Suburbs on The Tibetan Plateau and other northern Hemispheric Cryosphere View all 7 articles
Because of global warming, the water cycle has intensified and precipitation has changed, with monsoons evolving to become more complex, particularly in monsoon fringe areas. Therefore, it is important to use stable isotopes to trace moisture sources in monsoon fringe areas, such as semiarid areas. In this study, in situ measurements of water vapor isotopes were obtained in the monsoon fringe areas of Lanzhou (36.1° N, 103.7° E), between May and November 2019 with the aim of analyzing the stable isotope composition and atmospheric water vapor variation to improve our understanding of moisture transport. The following results were obtained: stable isotopic variation of atmospheric water vapor shows an alternation between west and southwest moisture with wind directions and sources of water vapor, with δ18O and δ2H varying from high to low. In the Lanzhou valley, water vapor isotopes show a distinct daily cycle of δ17O, δ18O, and δ2H and are consistent with temperature changes. Water vapor isotopes, particularly d-excess, are correlated with temperature and absolute humidity. With regard to the local atmospheric water vapor line (LAVL), we show that the slope and intercept of the LAVL are affected by sub-cloud secondary evaporation and topography.
Due to differences in water quality and combination (H216O, HDO, H218O, and H217O), isotope fractionation occurs in phase transformation under different meteorological conditions. Therefore, differences in the content of hydrogen and oxygen stable isotopes in a water body reflect its physical characteristics, such as water evaporation and transmission during the water cycle. Water isotopes are widely used as tracking indicators in paleoclimate reconstruction and water cycle research (Bolin, 1959; Ren et al., 2016). Recorded historical details concerning changes in the water cycle process can track the migration and condensation process of water vapor by monitoring atmospheric water vapor and precipitation isotopes (Dong et al., 2017; Zhang et al., 2020).
In the past, there have been very few studies related to water vapor-stable isotopes and were based on discrete water vapor samples collected by traditional cryogenic cold trap techniques (Vuille et al., 2005). These instruments limit the ability to observe and collect long-term and high-resolution atmospheric water vapor-stable isotope data. Recent in situ measurements using spectroscopic techniques have made it possible to monitor continuous changes in atmospheric water vapor-stable isotopes on finer timescales. Over the past decade, this new technique has been used to monitor stable isotopes of water vapor in different climate zones around the world. The hydrogen- and oxygen-stable isotopes of atmospheric water vapor research have progressed from early qualitative to the current quantitative and model descriptions. Eriksson (1965) used an isotope model based on the atmospheric water vapor circulation model and found that δ18O and δ2H in atmospheric water vapor decreased exponentially with altitude variation. Recent studies have systematically described the distribution of stable isotopes of atmospheric water vapor on a three-dimensional spatial level in some regions and analyzed the seasonal changes in water vapor isotopes based on a nine-year near-surface atmospheric water vapor isotope data in the eastern Mediterranean (Angert et al., 2008; Rozanski and Sonntag, 2010). Steen-Larsen et al. (2011) found a substantial correlation between the atmospheric water vapor isotopes of Greenland and the relative near-surface humidity. Steen-Larsen et al. (2014) found that the daily changes of atmospheric water vapor isotopes were strongly correlated with the relative humidity, and the seasonal variation is related to weather conditions. COSMOiso is an isotope-enhanced regional model that was used to investigate the influence of continental evapotranspiration, precipitation, and sub-cloud processes on the δ2H of meteoric water vapor and precipitation in Europe. Under warm conditions, continental evapotranspiration, precipitation, and sub-cloud processes at constant temperatures can control the effects of near-surface water vapor (Christner et al., 2018). In Lhasa, water vapors δ18O and δ2H were compared with concurrent daily precipitation isotopes to assess the seasonal control of vapor isotopes and possible correlations with precipitation isotopes. Atmospheric water vapor δ18O has intra-seasonal dependence on a large-scale meteorological regime, and the seasonal variation of vapor d-excess is weak. During the summer monsoon season, high-frequency fluctuations of both δ18O and d-excess persisted for several days, and these fluctuations are in phase with precipitation events, confirming the significant effect of local evaporation on the short-term water cycle (Tian et al., 2019).
Some studies have analyzed the stable isotopes of hydrogen and oxygen in the arid and semiarid regions of China. The temperature effect, which primarily occurs in middle and high latitudes, is from coastal regions to inland continents, and the positive correlation is closer. However, there are many negative correlations in the middle and low latitudes and in the southern Qinghai–Tibet Plateau (Zhang and Yao, 1998; Liu et al., 2002). Moreover, the seasonal variation of δ18O indicates that westerly water vapor, local moisture, and summer monsoon all have a greater impact on the region. Among these, westerly water vapor plays a dominant role (Chen et al., 2013). In the northern monsoon region, precipitation isotope values are primarily affected by secondary evaporation. During the transportation process, leaching action increases the degree of precipitation isotope fractionation, and stalagmite oxygen isotope records from the northern monsoon region can reflect changes in local annual precipitation (Zhao, 2018). Using field observations of δ2H and δ18O in atmospheric water vapor over artificial oasis farmland in the Heihe River Basin, it was found that local evapotranspiration, particularly transpiration, is conducive to the enrichment of heavy isotopes in surface water vapor, and boundary layer entrainment can deplete heavy isotopes in surface water vapor (Huang and Wen, 2015).
Some global climate and hydrological process studies based on 17O and other stable isotopes have achieved various results. The 17O-excess originates from the evaporation of seawater into marine air, and from the transfer of atmospheric vapor to liquid or solid precipitation, and high 17O-excess in meteoric water is indicative of oceanic origin, where air relative humidity is low, and vice versa. A significant decrease in 17O-excess occurs when a reservoir of meteoric water is subjected to excessive evaporation (Luz and Barkan, 2010). In Antarctica, 17O-excess was measured and theoretically calculated using the Rayleigh fractionation model. To explain air quality, it was proposed that the heterogeneity of 17O-excess in precipitation in Antarctica can be explained not only by the temperature at the time of condensation or the relative humidity of the moisture source area but also by the difference in moisture source and the difference in supersaturation along the line. The continuous precipitation process will cause the δ17O value in precipitation to gradually decline, that is, show the leaching effect. The relationship between δ15N, δ18O, and δ17O in nitrates in the snow cannot be explained only by the local post-precipitation process but should be explained in the context of the main atmospheric signals (He et al., 2015; Pang et al., 2015; Shi et al., 2015). In an ice-covered ocean near Syowa Station, the isotopic variation was found to be related to a change in large-scale circulation caused by the trough–ridge–trough pattern. Its range reflects the coastal-inland movement of the front between the warm maritime air mass enriched by the δ2H value and cold glacial air mass depleted by the δ2H value (Kurita et al., 2016).
In previous studies on stable isotopes of hydrogen and oxygen, 17O has been neglected because of its limited applications. More recently, with scientific and technological advancements, research on the effect of isotope fractionation and the high-precision measurement of 17O has evolved (Ma et al., 2010). It also provided more methods for studying the relationship between oxygen isotopes and geographical factors, such as the water cycle and the origination of moisture. However, studies on meteoric water vapor 17O in the arid and semiarid regions of China are scant.
In this study, we conducted a field experiment to collect real-time isotope data on the near-surface atmospheric water vapor from May to November 2019 in Lanzhou, a typical semiarid region. Our objectives were to identify the moisture sources and analyze the influences of regional meteorological conditions on vapor isotope variations at diurnal and seasonal timescales. This will further our understanding of the characteristics of atmospheric water vapor-stable isotope compositions in semiarid regions and provide insights into distinct moisture sources and local atmospheric and hydrological processes.
The on-site observations were conducted in a semiarid valley of the Yellow River in northwest inland China (Figure 1), which is a topography of the valley sandwiched between northern and southern mountains. It is located in the transition zone from the Qinghai–Tibet Plateau to the Loess Plateau. The Lanzhou river valley has a continental semiarid climate, with four distinct seasons. Hot and rainy summers are influenced by the east asian summer monsoon, and cold and dry winters are dominated by the north polar air mass. The average annual temperature is approximately 11.2°C, and the average annual precipitation is 367.9 mm, of which 70% occurs during the summer season of June–September. Lanzhou is located on the fringe of China’s monsoon area (Zhao, 1983) and belongs to the transition area between the westerlies and summer monsoon. The temporal and spatial distribution of atmospheric water vapor and precipitation in the monsoon fringe area is extremely uneven and highly variable. It is an important area reflecting the evolution of the monsoon and its regional influence. The monsoon edge region has typical environmental sensitivity and vulnerability. The study of climate change in the monsoon edge region is of great significance for exploring the monsoon process, evolution mechanism, and global environmental change. Therefore, the meteoric water vapor and precipitation mechanisms in Lanzhou are complex and important.
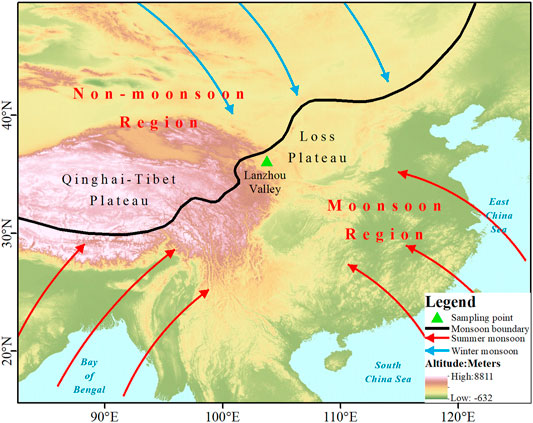
FIGURE 1. Location of the study area (Lanzhou valley) and sampling point feature by monsoon and westerly dual affection. The monsoon boundary was defined according to Zhao (1983).
With the consideration of the continuity and timeliness of the water vapor observations, a site was selected in the Meteorological Park of the new campus of Northwest Normal University, where the influence of plant shrubs and human activities on the samples could be avoided. There were no high trees and shrubs in the vicinity of the sampling point (Figure 2A), and the building was at a substantial distance from the sampling equipment. From May to November 2019, an automatic weather station in the park was used to collect real-time solar radiation, air temperature, air relative humidity, wind speed, wind direction, and precipitation data. To form an effective altitude correspondence, meteorological elements such as air temperature, relative air humidity, wind speed, and wind direction 20 m above the ground at the automatic weather station were selected. Atmospheric water vapor and precipitation were measured in real time.
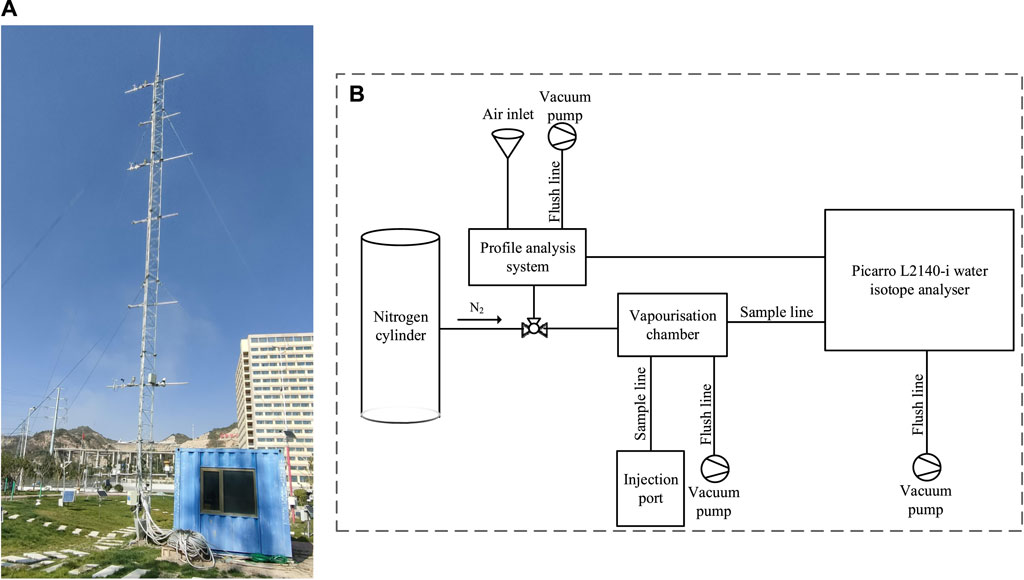
FIGURE 2. Sampling point environment and equipment system with (A) outdoor inlet tube tower and (B) indoor calibration and measuring instrument.
To address the uniqueness of real-time long duration and observation, we designed a water vapor and precipitation isotope observation system containing two parts. The first part was composed of weather towers of 5-m intervals and with four layers. Meteoric water vapor inlets, temperature and humidity monitors, anemometers, and wind direction meters were placed on each layer, with the precipitation measuring cylinder placed 2 m above the ground. The second part was an L2140-i high-precision water isotope analyzer (Picarro, Inc., Santa Clara, United States) that measured δ2H, δ17O, and δ18O and was equipped with wavelength scanned cavity ring-down spectroscopy (WS-CRDS) (Figure 2B). Compared with the traditional continuous-flow isotope ratio mass spectrometry (CFIRMS), WS-CRDS has better accuracy in water isotope analysis and real-time observation. The second part consisted of the following three components:
1) The profile analysis system was the main body (Figure 2A). The air inlet transported atmospheric water vapor from ambient air to the profile analysis system through a copper pipe wrapped in black foam. The profile analysis system was flushed with an air pump and nitrogen.
2) The Picarro L2140-i water isotope analyzer (Figure 2B): In this process, atmospheric water vapor isotopes of hydrogen and oxygen were analyzed in the cavity. Closely following the analysis, the vacuum pump and nitrogen flushed the analyzing chamber to avoid residual moisture affecting the next sample measurement.
3) The vaporization chamber and nitrogen cylinder: The wiring of the vaporization chamber and nitrogen cylinder is shown in Figure 2B. This part was primarily used for standard sample testing. The needle drew a certain amount of standard water sample and injected it into the vaporization chamber. After vaporization, it entered the cavity for testing. After each standard water sample test was completed, nitrogen entered the vaporization chamber and cavity and was flushed with a vacuum pump to reduce experimental error.
The isotope determination from sampling, standard material packaging, storage, sample loading to standard material selection, and sequence setting will affect the measurement results because of the large variation in the abundance of hydrogen and oxygen isotopes in water bodies. This may lead to a large difference between the measured and true values, and therefore, a correction of the measured values before the data analysis is required.
According to different mathematical algorithms, the main standardization and correction of isotope data methods are the reference gas, one-point (using one standard substance), and two-point or multi-point methods (using two or more standard substances). In this study, we used the two-point method recommended by the International Atomic Energy Agency (IAEA) and selected LGR-2E and LGR-5E as standard materials. The measured and true values of the hydrogen and oxygen isotope standard samples are listed in Table 1. The X-coordinate axis was the measured value of the Picarro L2140-i isotope determination standard substance, and the Y-coordinate axis was the true value of the standard substance. A scatter diagram and trend line could then be obtained. By substituting the measured values of atmospheric water vapor and precipitation isotope into the linear equation, the true value of the sample in this experiment was obtained.
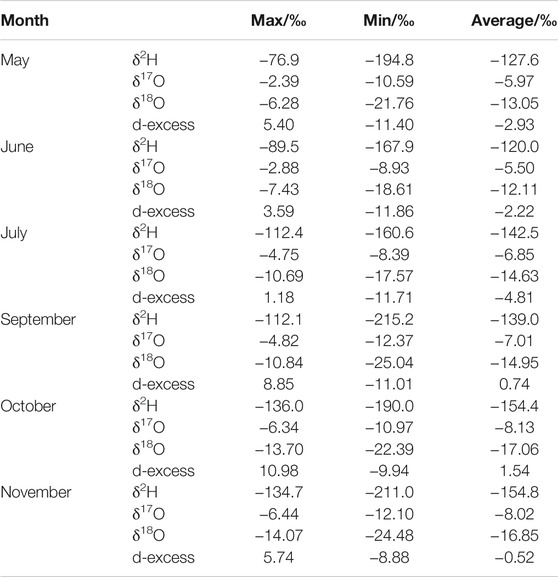
TABLE 1. Summary of the atmospheric water vapor isotope monitoring data in Lanzhou.
The standard samples used were LGR-2E (δ17O = −8.79‰, δ18O = −16.71‰, and δ2H = −123.8‰) and LGR-5E (δ17O = −1.52‰, δ18O = −2.99‰, and δ2H = −9.9‰). A centralized standard sample measurement was established for two months to correct the measured data of meteoric water vapor and precipitation during this time period.
All the samples were inputted into the American Picarro L2140-i water isotope analyzer in real time, which simultaneously measured δ18O, δ17O, and δ2H in liquid and gaseous water. We used the conventional δ notation to report isotope data (Craig, 1961; Merlivat and Jouzel, 1979):
where
In water circulation, the difference in d-excess (Dansgaard, 1953; Dansgaard, 1964) is generated using the following formula:
The calculated d-excess is primarily affected by the temperature, humidity, and wind speed of the place where the water originates from.
Each individual analyzer needs to characterize the measured isotope value as a function of water vapor concentration (Aemisegger et al., 2012; Gu et al., 2019). Some changes are caused by atmospheric isotope signal detection analyzers, for example, because of the temperature or humidity response, and therefore, it is necessary to thoroughly characterize the instrument system (Steen-Larsen et al., 2013). We applied the following calibration process (Bailey et al., 2015; Galewsky et al., 2016):
1) Set the standard samples. The two standard samples used in this study were LGR-2E (δ17O = −8.79‰, δ18O = −16.71‰, and δ2H = −123.8‰) and LGR-5E (δ17O = −1.52‰, δ18O = −2.99‰, and δ2H = −9.9‰).
2) Eliminate the memory effect. Picarro L2140-i data processing software (SDM Data Processor) was used to filter out the isotopic data of the standard samples and atmospheric water vapor and delete the first 3 min of the atmospheric water vapor isotope data after each measurement of LGR-2E and LGR-5E.
3) Calibrate instrument concentration effect. A water vapor concentration of 20,000 ppmv was used as the benchmark, and it is assumed that the effect of the isotope concentration is minimal under this standard. The measured data of the meteorological tower do not contain the ppmv value of the atmospheric water vapor concentration, and therefore, it requires conversion:
where
where
4) Known standard calibration. The isotope measurement value of the standard sample every two months was used to establish a linear relationship with its true value (see Section 2.5.1).
5) Data standardization. Using the equation in step 3, the corrected atmospheric water vapor concentration was used as the independent variable to obtain the water vapor hydrogen and oxygen isotope offset values. The offset value was subtracted from the atmospheric water vapor isotope measurement result, and then, the linear equation in step 4 generated the true value of the atmospheric water vapor hydrogen and oxygen stable isotopes (Steen-Larsen et al., 2014).
The characteristic values of the atmosphere vapor isotopes during 2019 summer including the maximum, minimum, and average values of δ2H, δ17O, δ18O, and d-excess are shown in Table 1. The δ18O values vary from −25.04‰ to −6.28‰, with a mean value of −15.10‰, and 90% of the values range from −21.74‰ to −8.54‰ throughout the survey period (Table 1 and Figure 3). In comparison, the mean δ18O value is more positive than the annual average of −20.7‰ reported in Beijing (40°00′ N, 116°23′ E) (Wen et al., 2010), and it is more negative than the monthly average of -14.85‰ recorded in Zhangye (38°51′ N and 100°22′ E) (Huang and Wen, 2015). When considering the geographical locations of the three stations, the difference between them reflects the influence of geographical factors on the water vapor isotopes to a certain extent, that is, the atmospheric water vapor isotopes gradually enrich from monsoon regions to non-monsoon regions in China. The hydrogen values δ2H vary from −215.2‰ to −76.9‰, with a mean value of −141.4‰, and 87% of the data were distributed between −174.4‰ and −105.4‰ in the survey period. The atmospheric water vapor isotopes generally have a wide range of changes and maintain a downward trend from May to July, with an upward trend with a small range of changes from July to September. They have a small range of changes and enter a stable state from September to November. The d-excess value generally maintains an upward trend, but fluctuates frequently, particularly from May to September.
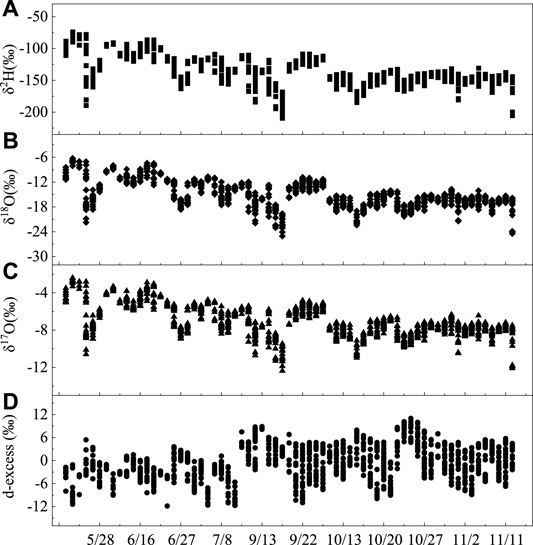
FIGURE 3. Daily mean δ2H (A), δ18O (B), δ17O (C), and d-excess (D) atmospheric water vapor variations near the surface during the entire sampling period in Lanzhou, China.
Figure 4 shows the 24-h ensemble average values of the water vapor isotopes. The dataset was divided into May, June, July, September, October, and November. The peak-to-peak vapor δ18O variations were 15.48, 11.18, 6.88, 14.20, 8.68%, and 10.41‰ in May, June, July, September, October, and November, respectively. The peak-to-peak vapor δ2H variations were 117.9, 78.5, 48.2, 103.1, and 54.0‰ in May, June, July, September, October, and November, respectively.
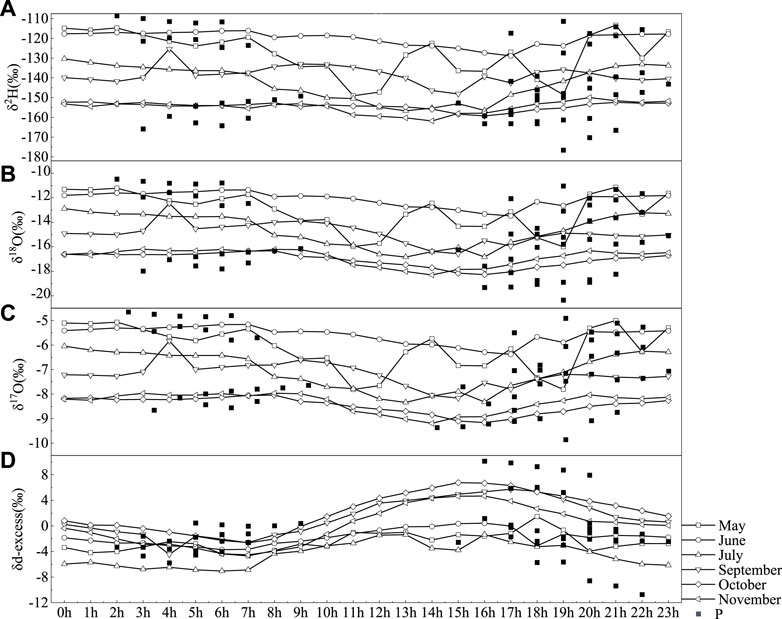
FIGURE 4. Hourly values of δ2H (A), δ18O (B), δ17O (C), and d-excess (D) of the atmospheric water vapor and precipitation (squares) from May to November 2019 in Lanzhou, China, and 76.3‰, respectively. The minimum δ2H and δ18O values occurred in the afternoon (1400–1800 CST, Chinese standard time), and the δ2H and δ18O maximums appeared at midnight. These diurnal variations appeared to be in phase with the vapor mixing ratio variations (Welp et al., 2008).
The d-excess value maintains a diurnal cyclic trend of low–high–low day during the observation period, and the maximum value generally appears between 15 and 18 h (Figure 4). The values of δ17O and δ18O from 0 to 10 h remain basically stable, while the values from 11 to 23 h fluctuate substantially over time.
The isotopes of atmospheric water vapor and precipitation gradually become positive as the temperature increases and show a positive correlation. This phenomenon has a temperature effect (Tian et al., 1997). The changes in temperature, relative humidity, and precipitation (hereafter referred to as T, RH, and P) during the sampling period are shown in Figure 5. The temperature begins to increase gradually in May, and then begins to decrease after reaching its highest value in July. The temperature drops significantly because of discontinuous data. In terms of relative humidity, because of heavy precipitation in June, air humidity rose sharply and then declined in July. Humidity began to increase in September, and then decrease with the onset of winter.
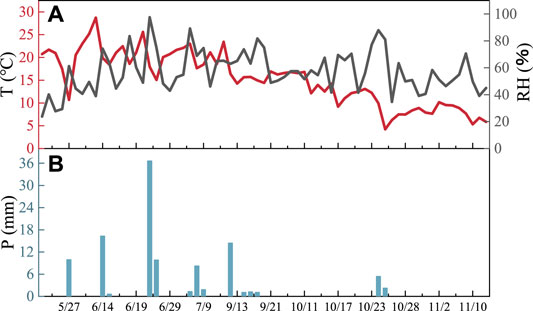
FIGURE 5. Temperature, relative humidity (A), and precipitation (B) during the sampling period.
The temperature effect proposed by Dansgaard (1964) was used to analyze the relationship between water isotopes and temperature. The daily scale correlation between the δ17O of atmospheric water vapor and temperature (Figure 6) is follows:
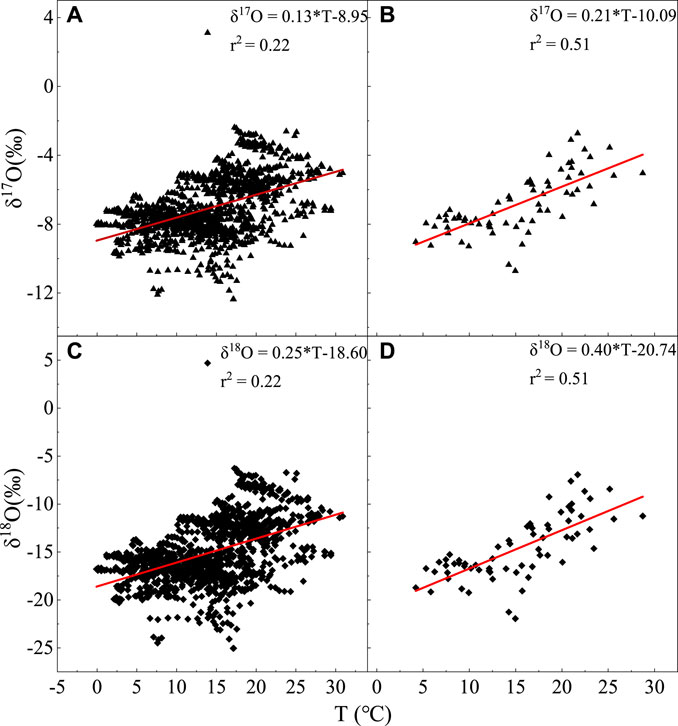
FIGURE 6. Relationship between δ17O and δ18O and temperature changes on daily and monthly scales, with (A) δ17O and daily scale, (B) δ17O and monthly scale, (C) δ18O and daily scale, and (D) δ18O and monthly scale.
The monthly-scale correlation shown in Figure 6B is as follows:
In Figures 6C,D, the correlation between δ18O and temperature on daily and monthly scales is as follows:
and
This concords with the positive correlation of temperature effects, and the correlation is more significant. The temperature effect is because the fractionation of stable isotopes in atmospheric water vapor, and precipitation is primarily governed by the temperature during phase transitions (Dansgaard, 1964; Rozanski et al., 1992; Zhang et al., 2003), and the change in the surface temperature corresponds to a change in the condensation temperature of precipitation cloud over the sky to a certain extent (Craig and Gordon, 1965). The lower the temperature, the greater the fractionation coefficient a of the isotopes in the water vapor and precipitation, and the lower the δ17O and δ18O in water vapor and precipitation.
This feature of daily variation is primarily related to evaporation and atmospheric turbulence in the study area. In the process of evaporation, the stable isotopic fractionation of hydrogen and oxygen will not be produced (Xie et al., 2016). First, because of the absence of trees and shrubs near the experimental area, ground evaporation causes the hydrogen- and oxygen-stable isotope ratios in the atmospheric water vapor near the surface to be relatively high. The water vapor contributed by the underlying surface evaporation to the near-surface layer has a relatively high stable isotope ratio. Second, the strength of the atmospheric turbulence affects the mixing which is between high and low layers of the atmospheric water vapor isotopes. The air exchange between the upper and lower layers was enhanced, and stable isotopes of hydrogen and oxygen in the atmospheric water vapor near the surface decreased when the turbulence increased. The change trend of the stable isotopes of hydrogen and oxygen in the atmospheric water vapor near the surface became smaller when the turbulence became weaker. Therefore, after sunrise on a clear day, the air temperature near the ground increased, the lower layer tended to become unstable, turbulent mixing was strengthened, and evaporation accelerated. After 11:00, the stable isotopes of hydrogen and oxygen in the near-surface water vapor continued to decrease as the water vapor content decreased. As the temperature began to decrease after 17:00, the turbulent effect weakened. At this time, the evaporation effect was greater than the turbulent effect, and the stable isotopes of hydrogen and oxygen in the near-surface water vapor began to increase slowly until 2:00 the next day (Figure 7).
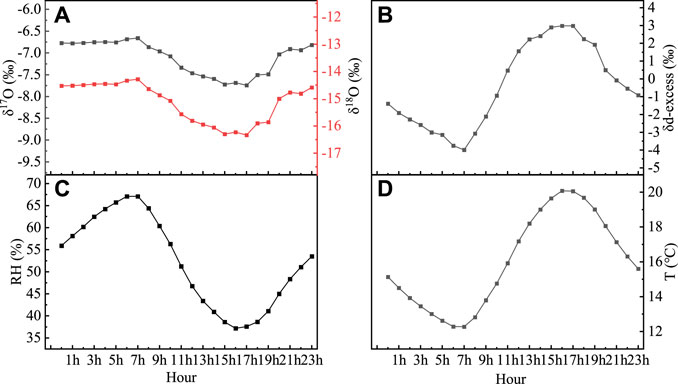
FIGURE 7. Daily cycle of the atmospheric water vapor monthly average δ18O, δ17O (A), d-excess (B), relative humidity (C), and temperature (D).
δ18O, δ17O, and d-excess varied, which is the opposite to temperature changes, and their correlation with humidity (r2 = 0.81, r2 = 0.80, r2 = 0.98, and p < 0.001, respectively) is significantly higher than temperature (r2 = 0.81, r2 = 0.80, r2 = 0.96, and p < 0.001, respectively) (Figure 8).
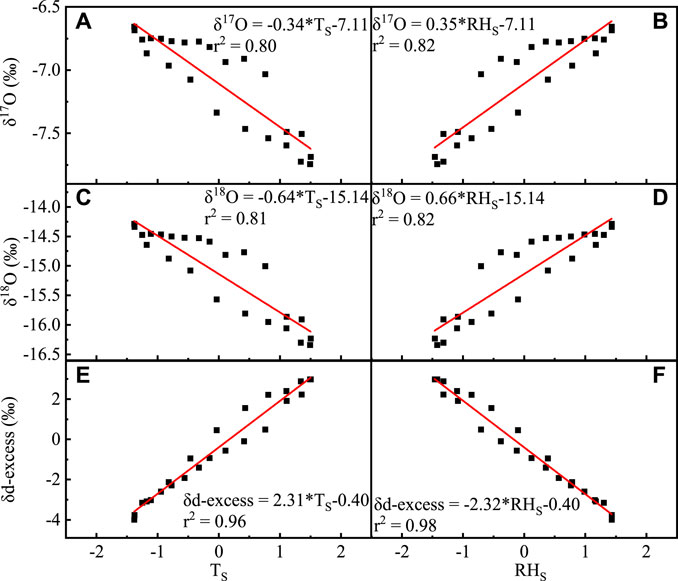
FIGURE 8. Correlation between monthly average δ17O, δ18O, and d-excess of the atmospheric water vapor and temperature (A,C,E), and relative humidity (B,D,1F) (TS stands for dimensionless standard treatment of the atmospheric water vapor temperature and RHS stands for dimensionless standard treatment of relative humidity).
Combined with the measured meteorological data, the atmospheric water vapor hydrogen and oxygen isotopes within 5 h after precipitation were retained and compared with the daily average data for each month. During the observation period, there were five precipitation events (Figure 4). The measured data were derived from the 27 May, 14–15 June, 26–27 June, 7—9 July, 12 September, 16 September, and 24 October time periods. During the precipitation period, δ2H, δ17O, and δ18O were relatively consistent, which is approximately reflected in a downward trend, and its value is lower than that in the period of no precipitation. However, the d-excess value shows an upward trend. This demonstrates that the change in d-excess has a stronger relationship with the change in relative humidity. This is because when a precipitation event occurs, the main source of precipitation is the condensation and decrease in high-level water vapor, and the decreasing water vapor evaporates to the near-surface water vapor, resulting in a relatively low hydrogen-to-oxygen-stable isotope ratio.
The d-excess value in atmospheric water vapor increased, and the δ18O and δ2H values decreased when a precipitation event occurred (Figure 9). In Figures 9B,C, the δ18O and δ2H values have different trends during the two precipitation periods. When comparing the meteorological conditions of API and APII, there is continued precipitation in API, and the change in the mean value of δ18O from PI to API reduced from −3.51‰ to −17.14‰, and the mean value of δ2H decreased from −129.72‰ to −155.87‰. However, no precipitation event occurred in APII, and the change in the mean value of δ18O from PII to APII increased from −17.66‰ to −16.11‰, and the mean value of δ2H dropped from −157.22‰ to −140.18‰. This indicates that the more the precipitation, the lower the stable isotope of atmospheric water vapor, and reflects the effect of precipitation (Zhao et al., 2012).
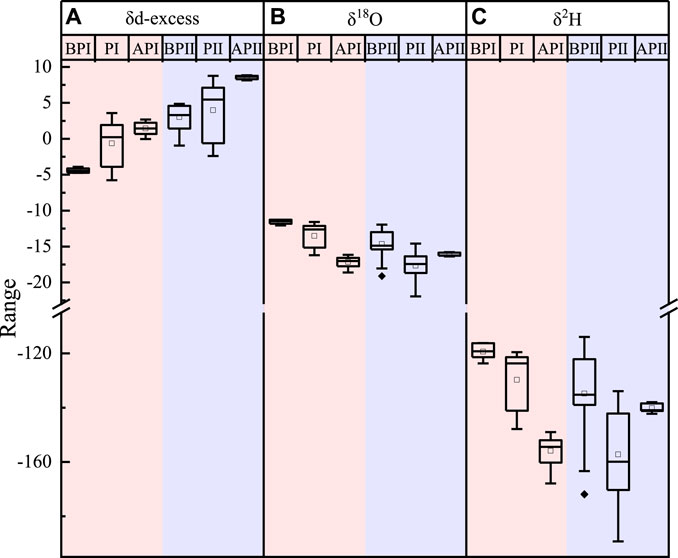
FIGURE 9. Variation trends of d-excess (A), δ18O (B), and δ2H (C) in the atmospheric water vapor before and after the precipitation event. BP represents the atmospheric water vapor isotope of the day before the precipitation event, P represents the time of the main precipitation event, AP represents one day after the precipitation event, I represents the large precipitation event that occurred on 26 June 2019, and II represents the large precipitation event that occurred on 12 September 2019.
Previous studies (Song and Zhang, 2003; Zhao et al., 2020) have shown that compared to that in other regions in China, the distribution of the atmospheric water vapor sources in northwestern arid and semiarid China is more complicated. It can be divided approximately into three parts, namely, the central and western parts of the northwest that primarily affected by the westerly zone, the Tibetan plateau water vapor areas in Qinghai Province and the Qilian Mountains, and the eastern part of the northwest which is affected by the Asian monsoon fringe. The main wind direction in May, October, and November is northeast (36.25, 30.19, and 36.46%, respectively). In June, the wind direction is easterly (23.02%), and a northerly direction (16.92%) accounted for the main influencing factors. The main wind direction in July and September is easterly (29.27 and 27.35%, respectively), and the northeasterly wind (24.88%) has a more marked impact in September (Figure 10). Here, the NCEP/NCAP reanalysis and related datasets were used to analyze the wind field data from May to July 2019 and September to November 2019 (Figure 11). From May to July, the wind direction is primarily northwest and southeast, and from September to November, the main wind direction is southwesterly and southeasterly. The difference between the measured data and the NCEP/NCAP reanalysis data is because of the influence of local fine-scale topography. By comparing the isotope data of different wind directions, it is found that the summer monsoon water vapor isotope changes are more abundant than winter monsoon and local evaporative water vapor isotopes.
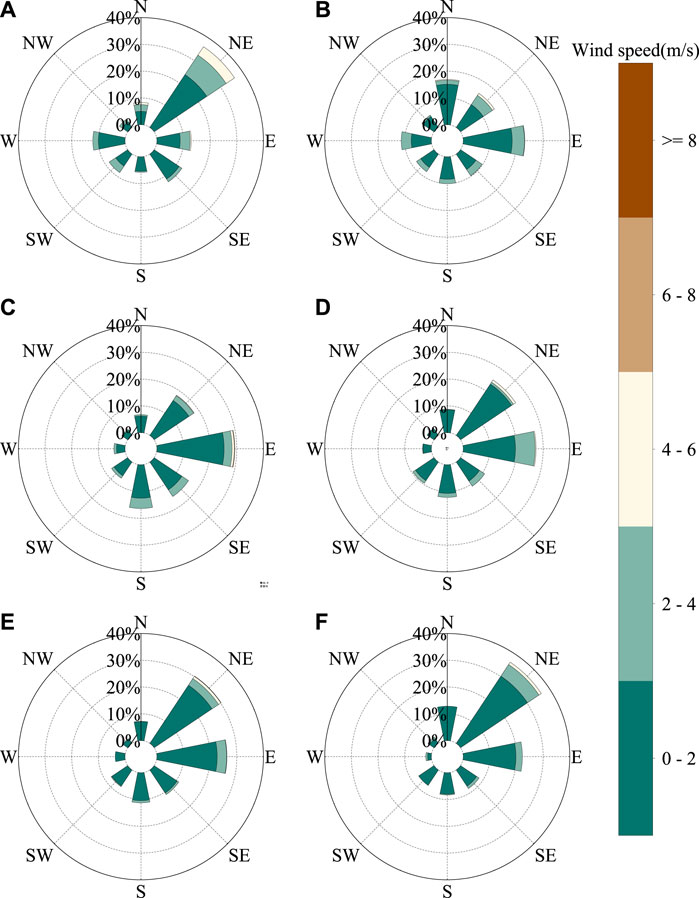
FIGURE 10. Observation site (Lanzhou valley) wind rose in 2019 for (A) May, (B) June, (C) July, (D) September, (E) October, and (F) November.
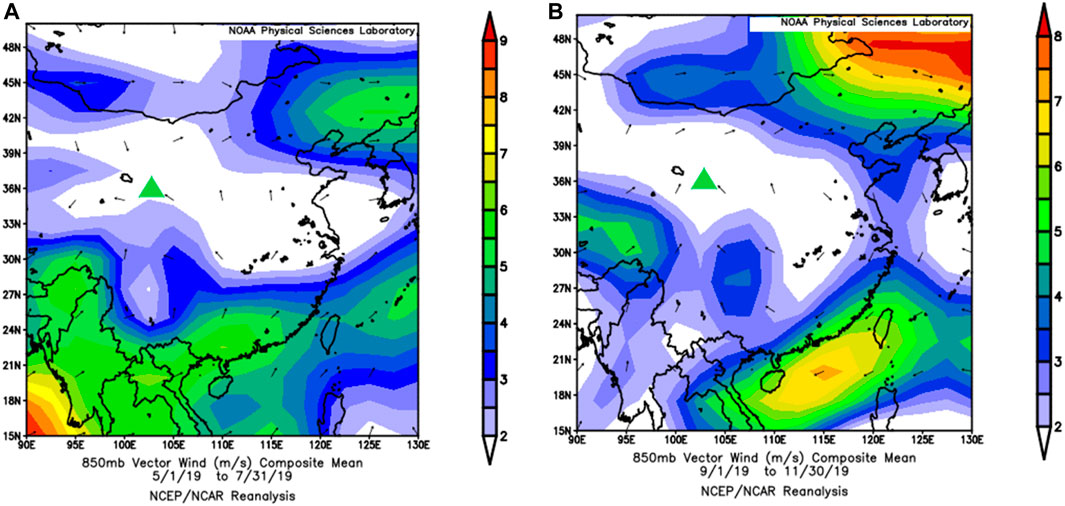
FIGURE 11. NCEP/NCAP 850 hPa wind field reanalysis dataset for (A) May to July and (B) September to November (green triangles represent study sites).
According to the hybrid single-particle Lagrangian integrated trajectory model (HYSPLIT) developed by the Atmospheric Resources Laboratory of the National Oceanic and Atmospheric Administration and GDAS meteorological data, the operating conditions of the atmospheric water vapor during the observation period are reversed. Water vapor can remain in the stratosphere for a maximum period of approximately 10 days, and therefore, the atmospheric water vapor trajectories at different altitudes 10 days before the end of the observation (Gat, 2000) were calculated. Three layers of air masses at 1500 m (850 hPa), 3,000 m (700 hPa), and 5,500 m (500 hPa) were set (Li et al., 2012), and the observation point where the precipitation event occurred was taken as the end point of the atmospheric water vapor mass movement. The 27 May, 15 June, 27 June, 9 July, 12 September, 16 September, 23 October, and 5 November when precipitation events occurred were selected as the start times of the atmospheric water vapor inversion.
From May to July, it was primarily affected by the westerly water vapor. Water vapor from the Indian Ocean affected precipitation events on 27 May and 27 June. The air mass movement of 1500 m is affected by the terrain before reaching the study area, and the trajectory movement changes significantly. The air mass of 3,000 m has a short movement distance. During the movement, the altitude fluctuates frequently, primarily in the interior of the continent. The air mass at 5,500 m has a longer distance, primarily from the Atlantic and Indian oceans (Figures 12A–D). From September to November, 1500 m and 5,500 m are primarily affected by the westerly water vapor. In the precipitation event on 24 October, the movement of the air masses at 3,000 m and 5,500 m was affected by westerly water vapor, whereas the movement of the air mass at 1500 m was more affected by terrain. The water vapor sources 3,000 m are primarily concentrated in the southwest, east, and west (Figures 12E–H).
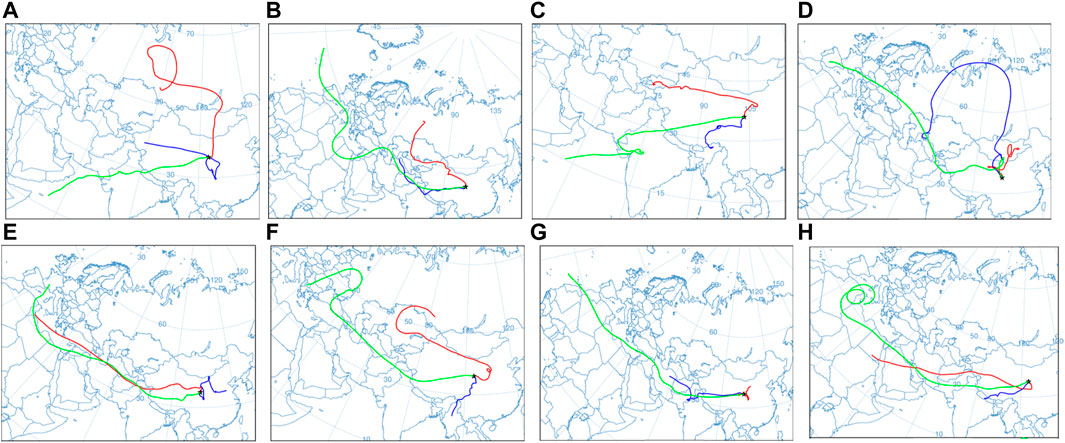
FIGURE 12. Backward trajectory clustering of the water vapor in Lanzhou during the 2019 precipitation period. The black five-pointed stars represent sampling points, the red line represents 1500 m air mass trajectories, the green line represents 3,000 m air mass trajectories, and the blue line represents 3,300 m air mass trajectories. Conditions on (A) 24 May, (B) 15 June, (C) 27 June, (D) 9 July, (E) 12 September, (F) 16 September, (G) 24 October, and (H) 5 November.
The atmospheric water vapor isotope values of Lanzhou and Lhasa [29°39′ N, 91°02′ E (Tian et al., 2019)] were compared (Table 2). Lanzhou has a higher δ18O, δ2H, and d-excess values than Lhasa, except for δ2H in May. Among them, the difference between δ18O and δ2H is the largest in July and September. Lanzhou is primarily affected by the westerly water vapor from the Atlantic Ocean. Lhasa has two sources of water vapor during the monsoon season, namely, water vapor from the Bay of Bengal, and water vapor from the southwest originating from the Arabian Sea, and dominated by the southern water vapor. This caused the difference in the atmospheric water vapor isotopes between Lanzhou and Lhasa.
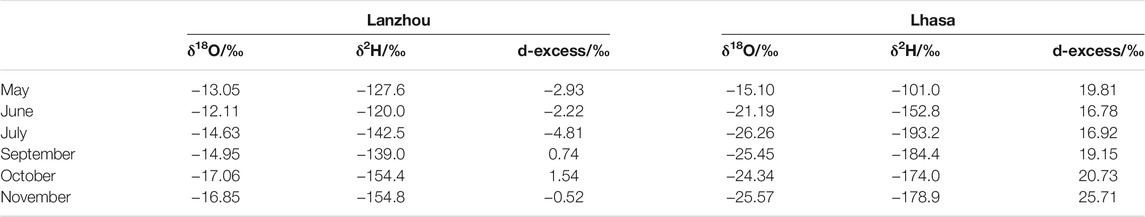
TABLE 2. Comparison of the monthly average atmospheric water vapor isotope values of Lanzhou and Lhasa.
In general, the observation period is primarily affected by the westerly water vapor, supplemented by local water vapor and southwest water vapor. This is consistent with the results of previous studies (Wang et al., 2005; Zhang et al., 2007; Yao et al., 2009; Shi et al., 2015).
Craig (1961) proposed the following global meteoric water line (Craig equation):
This promoted the study of the correlation between stable isotopes of atmospheric precipitation and various meteorological elements. Due to differences in factors affecting stable isotope fractionation from the source of water vapor to the fall of raindrops, local meteoric water lines exhibit different slopes and intercepts (Figure 13). In 1983 Zheng et al. (1983) analyzed the isotope data of the atmospheric precipitation in different locations in China and obtained the following equation for the countrywide atmospheric precipitation line:
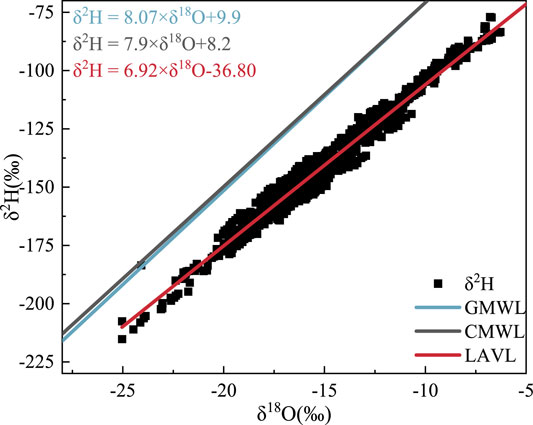
FIGURE 13. Local atmospheric water vapor line of this study. The red line is the atmospheric vapor line fitted by Lanzhou atmospheric water vapor δ18O and δ2H, the black line is Zheng Shuhui’s China meteoric water line, and the blue line is Gourcy’s global meteoric water line.
The LAVL composed of the atmospheric water vapor δ2H and δ18O from May to July and September to November 2019 in Lanzhou city (Figure 13) is as follows:
The slope is less than eight, indicating that the sources of the atmospheric water vapor in this area have different stable oxygen isotope ratios and also reflecting that the water vapor has undergone a certain evaporation process (Liu et al., 2018). In addition, after the water vapor changes from liquid to gas, and the evaporation fractionation rate of light isotopes is faster than that of heavy isotopes. The smaller the slope and intercept, the stronger the evaporation of the atmospheric water vapor, implying that the secondary evaporation of water vapor under clouds in the atmosphere produces a strong isotope dynamic fractionation effect, which makes the slope and intercept of the water vapor (Peng et al., 2010). When combining Figures 11, 12, the air masses arriving in the study area are divided into two scenarios. One is that water vapor from the Atlantic Ocean arrives across the European continent with the westerly circulation, and the other is the local air mass movement. Moreover, the study area was far from the ocean and river valley topography. This caused the water vapor arriving in the study area to develop sub-cloud secondary evaporation, and the slope and intercept of the LAVL were lower than the national level.
In this study, we investigated the temporal variations of δ2H, δ18O, δ17O, and d-excess of the atmospheric water vapor from May to November 2019 in Lanzhou. The major findings are summarized as follows:
1) δ2H, δ17O, δ18O, and d-excess have a daily cycle change trend between the daily hydrogen and oxygen stable isotopes.
2) The δ17O and δ18O of Lanzhou in May–July and September–November 2019 are positively correlated with temperature, and the correlation of δ17O is weaker than that of δ18O, reflecting the temperature effect.
3) During the period of precipitation, δ2H, δ17O, and δ18O in the atmospheric water vapor change uniformly, and the overall trend is downward. Compared with the no precipitation period, the value is lower, and temperature dependence is higher than humidity. There is a generally consistent and significant correlation between d-excess and temperature and absolute humidity.
4) During the observation period, the atmospheric water vapor in Lanzhou was affected by westerly water vapor, southwesterly water vapor, and local water vapor, of which westerly water vapor was the main influence. Affected by local topography, the wind direction is primarily northeast.
5) The LAVL obtained in this study is similar to the atmospheric waterline obtained by Zheng et al. (1983). Due to the sub-cloud secondary evaporation and the influence of topography, the slope and intercept are lower than the national level.
The original contributions presented in the study are included in the article/Supplementary material, further inquiries can be directed to the corresponding author.
JL led the conception and design of the paper, collected, and analyzed data. JL and JD wrote the manuscript. All authors contributed to the development of ideas and manuscript revision and approved the submitted version.
This study is supported by the National Science Foundation of China (41801054 and 42071047).
The authors declare that the research was conducted in the absence of any commercial or financial relationships that could be construed as a potential conflict of interest.
All claims expressed in this article are solely those of the authors and do not necessarily represent those of their affiliated organizations, or those of the publisher, the editors, and the reviewers. Any product that may be evaluated in this article, or claim that may be made by its manufacturer, is not guaranteed or endorsed by the publisher.
Aemisegger, F., Sturm, P., Graf, P., Sodemann, H., Pfahl, S., Knohl, A., et al. (2012). Measuring Variations of δ18O and δ2H in Atmospheric Water Vapour Using Two Commercial Laser-Based Spectrometers: an Instrument Characterisation Study. Atmos. Meas. Tech. 5 (7), 1491–1511. doi:10.5194/amt-5-1491-2012
Angert, A., Lee, J.-E., and Yakir, D. (2008). Seasonal Variations in the Isotopic Composition of Near-Surface Water Vapour in the Eastern Mediterranean. Tellus B 60 (4), 674–684. doi:10.1111/j.1600-0889.2008.00357.x
Bailey, A., Noone, D., Berkelhammer, M., Steen-Larsen, H. C., and Sato, P. (2015). The Stability and Calibration of Water Vapor Isotope Ratio Measurements during Long-Term Deployments. Atmos. Meas. Tech. 8 (10), 5425–5466. doi:10.5194/amt-8-4521-2015
Bolin, B. (1959). “On the Use of Tritium as a Tracer for Water in Nature,” in Proc. 2nd U.N. Conf. Peaceful Uses of Atomic Energy, October 31, 1959.
Chen, F., Zhang, M., Ma, Q., Li, X., Wang, S., and Li, F. (2013). Characteristics of δ18O in Precipitation and Water Vapor Sources in Lanzhou City and its Surrounding Area. Environ. Sci. 34, 3755–3763.
Christner, E., Aemisegger, F., Pfahl, S., Werner, M., Cauquoin, A., Schneider, M., et al. (2018). The Climatological Impacts of Continental Surface Evaporation, Rainout, and Subcloud Processes on δ D of Water Vapor and Precipitation in Europe. J. Geophys. Res. Atmos. 123, 4390–4409. doi:10.1002/2017jd027260
Craig, H., and Gordon, L. I. (1965). "Deuterium and Oxygen 18 Variations in the Ocean and the marine Atmosphere," in Stable Isotopes in Oceanographic Studies and Palaeotemperatures Editor E. Tongiorgi, 9–103.
Craig, H. (1961). Isotopic Variations in Meteoric Waters. Science (New York, N.Y.) 133, 1702–1703. doi:10.1126/science.133.3465.1702
Dansgaard, W. (1964). Stable Isotopes in Precipitation. Tellus 16, 436–468. doi:10.3402/tellusa.v16i4.8993
Dansgaard, W. (1953). The Abundance of O18in Atmospheric Water and Water Vapour. Tellus 5, 461–469. doi:10.3402/tellusa.v5i4.8697
Dong, X., Yang, H., Zhang, L., Zhu, Z., Yang, Y., Zheng, X., et al. (2017). Influence of ENSO Events on the Hydrogen (δ2H) and Oxygen (δ18O) Isotopic Values of Precipitation in Shanghai. Environ. Sci. 38, 4991–5003. doi:10.13227/j.hjkx.201705190
Eriksson, E. (1965). Deuterium and Oxygen–18 in Precipitation and Other Natural Waters Some Theoretical Considerations 1. Tellus 17 (4), 498–512. doi:10.1111/j.2153-3490.1965.tb00212.x
Galewsky, J., Steen-Larsen, H. C., Field, R. D., Worden, J., Risi, C., and Schneider, M. (2016). Stable Isotopes in Atmospheric Water Vapor and Applications to the Hydrologic Cycle. Rev. Geophys. 54, 809–865. doi:10.1002/2015rg000512
Gat, J.R. (2000). Atmospheric Water Balance—The Isotopic Perspective. Hydrol. Process. 14 (8), 1357–1369. doi:10.1002/1099-1085(20000615)14:8<1357::AIDHYP986>3.0.CO;2-7
Gourcy, L. L., Gröning, M., and Aggarwal, P. (2005). Stable Oxygen and Hydrogen Isotopes in Precipitation. Dordrecht: Springer, 39–51. doi:10.1007/1-4020-3023-1_4
Gu, X., Pang, H., Li, Y., Zhang, W., and Wang, J. (2019). Study on Calibration Method for Atmospheric Water Vapor Stable Isotopes Observed by Cavity Ring-Down Spectroscopy. Spectrosc. Spectral Anal. 039, 1700–1705. doi:10.3964/j.issn.1000-0593(2019)06-1700-06
Huang, L., and Wen, X. (2015). Temporal Variations of Atmospheric Water Vapor δD and δ18O above an Arid Artificial Oasis Cropland in the Heihe River Basin. J. Geophys. Res. Atmospheres 119, 11,456–411,476. doi:10.1002/2014JD021891
He, J., Pang, H., and Hou, S. (2015). Progress in the Study of 17O-Excess in Snow and Ice over Polar Regions. Polar Res., 392–401. doi:10.13679/j.jdyj.2015.4.392
Kurita, N., Hirasawa, N., Koga, S., Matsushita, J., Steen-Larsen, H. C., Masson-Delmotte, V., et al. (2016). Influence of Large-Scale Atmospheric Circulation on Marine Air Intrusion Toward the East Antarctic Coast. Geophys. Res. Lett. 43 (17), 9298–9305. doi:10.1002/2016gl070246
Li, J.-l., Li, Z.-r., Yang, J.-c., Shi, Y.-z., and Fu, J. (2012). Analyses on Spatial Distribution and Temporal Variation of Atmosphere Water Vapor Over Northwest China in Summer of Later 10 Years. Plateau Meteorol. 31 (6), 1574–1581.
Liu, J. Y., Zhang, F. P., Feng, Q., Li, Z. X., Zhu, Y. W., Nie, S., et al. (2018). Influence of Below-Cloud Secondary Evaporation on Stable Isotope Composition in Precipitation in Northwest China. Ying Yong Sheng Tai Xue Bao 29, 1479–1488. doi:10.13287/j.1001-9332.201805.028
Liu, X., Qin, D., Shao, X., Ren, J., and Wang, Y. (2002). Stable Carbon Isotope of Abies Spectabibis from Nyingchi County of Tibet Autonomous Region and its Response to Climate Change. J. Glaciology Geocryology 24 (5, 574–578. doi:10.3969/j.issn.1000-0240.2002.05.018
Luz, B., and Barkan, E. (2010). Variations of 17O/16O and 18O/16O in Meteoric Waters - ScienceDirect. Geochimica et Cosmochimica Acta 74, 6276–6286. doi:10.1016/j.gca.2010.08.016
Ma, H., Li, Y., Jiang, S., and An, C. (2010). Advance in the Study of Mass Independent Oxygen Isotope Fractionation. Earth Environ. 38, 91–97. doi:10.3969/j.issn.1672-6561.2010.02.011
Merlivat, L., and Jouzel, J. (1979). Global Climatic Interpretation of the Deuterium-Oxygen 18 Relationship for Precipitation. J. Geophys. Res. 84, 5029–5033. doi:10.1029/jc084ic08p05029
Pang, H., Hou, S., Landais, A., Masson-Delmotte, V., Prie, F., Steen-Larsen, H. C., et al. (2015). Spatial Distribution of 17O-Excess in Surface Snow along a Traverse from Zhongshan Station to Dome A, East Antarctica. Earth Planet. Sci. Lett. 414, 126–133. doi:10.1016/j.epsl.2015.01.014
Peng, H., Mayer, B., Harris, S., and Krouse, H. R. (2010). A 10-yr Record of Stable Isotope Ratios of Hydrogen and Oxygen in Precipitation at Calgary, Alberta, Canada. Tellus 56, 147–159. doi:10.1111/j.1600-0889.2004.00094.x
Ren, W., Yao, T., Xie, S., and He, Y. (2016). Controls on the Stable Isotopes in Precipitation and Surface Waters across the southeastern Tibetan Plateau. J. Hydrol. 545, 276–287. doi:10.1016/j.jhydrol.2016.12.034
Rozanski, K., and Sonntag, C. (1982). Vertical Distribution of Deuterium in Atmospheric Water Vapour. Tellus 34 (2), 135–141. doi:10.3402/tellusa.v34i2.10795
Rozanski, K., Araguás-Araguás, L., and Gonfiantini, R. (1992). Relation between Long-Term Trends of Oxygen-18 Isotope Composition of Precipitation and Climate. Science 258, 981–985. doi:10.1126/science.258.5084.981
Shi, G., Buffen, A. M., Hastings, M. G., Li, C., Ma, H., Li, Y., et al. (2015). Investigation of Post-Depositional Processing of Nitrate in East Antarctic Snow: Isotopic Constraints on Photolytic Loss, Re-oxidation, and Source Inputs. Atmos. Chem. Phys. 15, 9435–9453. doi:10.5194/acp-15-9435-2015
Song, L., and Zhang, C. (2003). Changing Features of Precipitation over Nothwest China during the 20th Century. J. Glaciology Geocryology 25, 143–148. doi:10.3969/j.issn.1000-0240.2003.02.005
Steen-Larsen, H., Masson‐Delmotte, V., Sjolte, J., Johnsen, S., Vinther, B., Bréon, F.M., et al. (2011). Understanding the Climatic Signal in the Water Stable Isotope Records from the NEEM Shallow Firn/Ice Cores in Northwest Greenland. J. Geophys. Res. 116 (D6). doi:10.1029/2010JD014311
Steen-Larsen, H. C., Johnsen, S. J., Masson-Delmotte, V., Stenni, B., and White, J. W. C. (2013). Continuous Monitoring of Summer Surface Water Vapour Isotopic Composition above the Greenland Ice Sheet. Atmos. Chem. Phys. 13 (1), 4815–4828. doi:10.5194/acpd-13-1399-2013
Steen-Larsen, H. C., Sveinbjörnsdottir, A. E., Peters, A. J., Masson-Delmotte, V., Guishard, M. P., Hsiao, G., et al. (2014). Climatic Controls on Water Vapor Deuterium Excess in the marine Boundary Layer of the North Atlantic Based on 500 Days of In Situ, Continuous Measurements. Atmos. Chem. Phys. 14, 7741–7756. doi:10.5194/acp-14-7741-2014
Tian, L., Yao, T., Yang, Z., and Pu, J. (1997). A 4-year's Study of Oxygeo Isotope in Precipitation at Tuotuohe Meteorological Station, Tibetan Plateau. J. Glaciol. Geocryol. 20 (4), 438–443.
Tian, L., Yu, W., Schuster, P. F., Wen, R., Cai, Z., Wang, D., et al. (2019). Control of Seasonal Water Vapor Isotope Variations at Lhasa, Southern Tibetan Plateau. J. Hydrol. 580, 124237. doi:10.1016/j.jhydrol.2019.124237
Vuille, M., Werner, M., Bradley, R. S., and Keimig, F. (2005). Stable Isotopes in Precipitation in the Asian Monsoon Region. J. Geophys. Res. 110 (D23108), 1–15. doi:10.1029/2005JD006022
Wang, K., Jiang, H., and Zhao, H. (2005). Atmospheric Water Vapor Transport from Westerly and Monsoon Over the Northwest China. Adv. Water Sci. 16, 432–438. doi:10.14042/j.cnki.32.1309.2005.03.021
Welp, L. R., Lee, X., Kim, K., Griffis, T. J., Billmark, K. A., and Baker, J. M. (2008). deltaO of Water Vapour, Evapotranspiration and the Sites of Leaf Water Evaporation in a Soybean Canopy. PLANT CELL ENVIRON. 31 (9), 1214–1228. doi:10.1111/j.1365-3040.2008.01826.x
Wen, X. F., Zhang, S. C., Sun, X. M., Yu, G. R., and Lee, X. (2010). Water Vapor and Precipitation Isotope Ratios in Beijing, China. J. Geophys. Res. Atmospheres 115 (D01103), 1–10. doi:10.1029/2009jd012408
Xie, Y. L., Zhang, X. P., Yao, T. C., and Huang, H. (2016). Monitoring and Analysis of Stable Isotopes of the Near Surface Water Vapor in Changsha. Huan Jing Ke Xue 37, 475–481. doi:10.13227/j.hjkx.2016.02.010
Yao, T., Zhou, X., and Yang, X. (2009). Indian Monsoon Influences Altitude Effect of δ 18O in Precipitation/River Water on the Tibetan Plateau. Chin. Sci. Bull. 54, 2124–2130. doi:10.1007/s11434-009-0497-4
Zhang, L., Zhao, Q., Zhang, M., Guo, J., Zheng, J., Chen, Z., et al. (2020). Mg2+ Distribution in Activated Sludge and its Effects on the Nitrifying Activity and the Characteristics of Extracellular Polymeric Substances and Sludge Flocs. Process Biochem. 88, 120–128. doi:10.1016/j.procbio.2019.10.002
Zhang, Q., Zhang, J., Song, G., and Di, X. (2007). Research on Atmospheric Wayer-Vapor Distribution over Qilianshan Mountains. Acta Meteorologica Sinica 65, 633–643. doi:10.3321/j.issn:0577-6619.2007.04.015
Zhang, X., and Yao, T. (1998). Distributional Features of δ18O in Precipitation in China. Acta Geographica Sinica 53, 70–78. doi:10.11821/xb199804008
Zhang, X., Yao, T., Liu, J., Tian, L., and Masayoshi, N. (2003). Simulations of Stable Isotopic Fractionation in Mixed Cloud in Middle Latitudes-Taking the Precipitation at Ürümqi as an Example. Adv. Atmos. Sci. 20, 261–268. doi:10.1007/s00376-003-0012-9
Zhao, L., Xiao, H., Zhou, M., Cheng, G., Wang, L., Yin, L., et al. (2012). Factors Controlling Spatial and Seasonal Distributions of Precipitation δ18O in China. Hydrol. Process. 26, 143–152. doi:10.1002/hyp.8118
Zhao, P. (2018). Stable Isotopic Characteristics and Influencing Factors in Precipitation in the Monsoon Region of Northern China. Xi'an China: Northwest University.
Zhao, Q., Chuancheng, Z., Qin, Y., and Chang, Y. (2020). The Change Features and Future Trend of Snowfall and Extreme Snowfall in the Arid Areas of Northwest China. J. Glaciology Geocryology 42, 81–90. doi:10.7522/j.issn.1000-0240.2020.0025
Zhao, S. (1983). A New Scheme for Comprehensive Physical Regionalization in China. Acta Geographica Sinica 38, 1–10. doi:10.11821/xb198301001
Keywords: atmospheric water vapor, stable isotope of hydrogen and oxygen, monsoon fringe area, moisture transportation, semiarid region
Citation: Du J, Liu J and Zhang M (2022) Monsoon Fringe Area Moisture Transportation Revealed by Water Stable Isotopes: A Lanzhou River Valley Case Study. Front. Environ. Sci. 10:843948. doi: 10.3389/fenvs.2022.843948
Received: 27 December 2021; Accepted: 14 February 2022;
Published: 18 March 2022.
Edited by:
Zhiwen Dong, Chinese Academy of Sciences (CAS), ChinaReviewed by:
Lunche Wang, China University of Geosciences Wuhan, ChinaCopyright © 2022 Du, Liu and Zhang. This is an open-access article distributed under the terms of the Creative Commons Attribution License (CC BY). The use, distribution or reproduction in other forums is permitted, provided the original author(s) and the copyright owner(s) are credited and that the original publication in this journal is cited, in accordance with accepted academic practice. No use, distribution or reproduction is permitted which does not comply with these terms.
*Correspondence: Jingfeng Liu, bGl1amluZ2Zlbmc3NzMyQDEyNi5jb20=
Disclaimer: All claims expressed in this article are solely those of the authors and do not necessarily represent those of their affiliated organizations, or those of the publisher, the editors and the reviewers. Any product that may be evaluated in this article or claim that may be made by its manufacturer is not guaranteed or endorsed by the publisher.
Research integrity at Frontiers
Learn more about the work of our research integrity team to safeguard the quality of each article we publish.