 S. Ramachandran
 Maheswar Rupakheti2
- 1Physical Research Laboratory, Ahmedabad, India
- 2Institute for Advanced Sustainability Studies, Potsdam, Germany
- 3Leipzig Institute for Meteorology, University of Leipzig, Leipzig, Germany
- 4Institute for Environmental Sciences and Geography, University of Potsdam, Potsdam, Germany
The state of air pollution has historically been tightly linked to how we produce and use energy. Air pollutant emissions over Asia are now changing rapidly due to cleaner energy transitions; however, magnitudes of benefits for climate and air quality remain poorly quantified. The associated risks involve adverse health impacts, reduced agricultural yields, reduced freshwater availability, contributions to climate change, and economic costs. We focus particularly on climate benefits of energy transitions by making first-time use of two decades of high quality observations of atmospheric loading of light-absorbing black carbon (BC) over Kanpur (South Asia) and Beijing (East Asia) and relating these observations to changing energy, emissions, and economic trends in India and China. Our analysis reveals that absorption aerosol optical depth (AAOD) due to BC has decreased substantially, by 40% over Kanpur and 60% over Beijing between 2001 and 2017, and thus became decoupled from regional economic growth. Furthermore, the resultant decrease in BC emissions and BC AAOD over Asia is regionally coherent and occurs primarily due to transitions into cleaner energies (both renewables and fossil fuels) and not due to the decrease in primary energy supply or decrease in use of fossil use and biofuels and waste. Model simulations show that BC aerosols alone contribute about half of the surface temperature change (warming) of the total forcing due to greenhouse gases, natural and internal variability, and aerosols, thus clearly revealing the climate benefits due to a reduction in BC emissions, which would significantly reduce global warming. However, this modeling study excludes responses from natural variability, circulation, and sea ice responses, which cause relatively strong temperature fluctuations that may mask signals from BC aerosols. Our findings show additional benefits for climate (beyond benefits of CO2 reduction) and for several other issues of sustainability over South and East Asia, provide motivation for ongoing cleaner energy production, and consumption transitions, especially when they are associated with reduced emissions of air pollutants. Such an analysis connecting the trends in energy transitions and aerosol absorption loading, unavailable so far, is crucial for simulating the aerosol climate impacts over Asia which is quite uncertain.
1 Introduction
The energy sector—especially the components involving the production and use of energy from unregulated, ill-regulated, and inefficient fuel combustion—is the single most important human source of air pollutants and climate forcer emissions (IEA, 2016; Meng et al., 2019; IPCC, 2021). Nearly 85–95% of particulate matter (PM) and oxides of sulfur and nitrogen come from how we produce and use energy (IEA, 2016; Meng et al., 2019). These pollutants and their precursors are emitted by incomplete burning of biomass (wood and other biomass) and fossil fuel combustion. Throughout Asia, incomplete biomass-burning emissions contribute >50% to PM (IEA, 2016; Kurokawa and Ohara, 2020). The combustion of coal and oil in power plants, industries, and vehicles is another major regional source of air pollution (IEA, 2016; Meng et al., 2019). On a global scale, >50% of combustion-related sulfur dioxide (SO2) emissions are from coal combustion, while fossil fuels used in the transport sector, particularly diesel, account for half of global emissions of nitrogen oxides (IEA, 2016; Meng et al., 2019; Kurokawa and Ohara, 2020). It has been shown that the simultaneous reduction in emissions of key air pollutants such as light-absorbing black carbon (BC) aerosols and surface ozone (O3), also known as short-lived climate-forcing pollutants (SLCPs), and long-lived greenhouse gases such as carbon dioxide (CO2), resulting from transitioning to cleaner sources of energy, can have significant co-benefits, contributing both to limiting climate change as well as to reducing negative impacts on human health, cryosphere, agriculture, energy security, economy, and sustainable development goals (e.g., UNEP-WMO, 2011; Shindell et al., 2012; UNEP, 2019).
This cross-topic study contributes to more clearly establishing the links between energy production, air pollution, and climate change (and implicitly public health and agriculture), i.e., key sustainability challenges of our time, focusing specifically on the issue of light-absorbing aerosols, in particular BC and its contribution to atmospheric heating. This is very relevant for Asia as it is already undergoing a significant energy transformation. East Asia [the North China Plain (NCP) to be more precise] and South Asia [notably the Indo-Gangetic Plain (IGP)] are global air pollution hotspots with local, regional, and global implications, for example, to regional and global climate. The implications of the rapidly evolving ongoing energy transition for the climate and air quality over Asia are hard to predict, since the regional climate is governed by several land–ocean-atmospheric processes, especially related to the complex terrain and the monsoon circulation (Hoegh-Guldberg et al., 2018; Samset et al., 2019; IPCC, 2021). Due to its massive population with the very high population densities throughout much of Asia, the region is extremely vulnerable to climate change and air pollution. Aerosol-induced atmospheric heating can modify the regional atmospheric stability and vertical mixing, large scale circulation, and the hydrological cycle and can thus be associated with significant regional climate and its consequent effects (Ramanathan and Carmichael, 2008; Hoegh-Guldberg et al., 2018; IPCC, 2021), including the accelerated ablation of the Himalayan–Tibetan Plateau glaciers, which is primarily attributed to the regional temperature increase, including that due to light-absorbing aerosols (Liu and Chen, 2000; Maurer et al., 2019). The rapid melting of glaciers in this so-called the Third Pole region is expected to negatively affect the water supply within and downstream regions in South and East Asia, with significant consequences for the regional hydrological cycle, and energy and water security in the region (Thompson et al., 2003; Barnett et al., 2005; Xu et al., 2016). The impact on the atmosphere that results from the current spatial patterns of air pollutant emissions is expected to have changed compared to that observed in the late twentieth century (Samset et al., 2019; Ramachandran et al., 2020a). These changes may produce large scale atmospheric responses with wide-ranging impacts on the atmosphere and climate extending well beyond Asia (Samset et al., 2019), which include changes in mean and extreme temperatures and precipitation, the onset and strength of the monsoon, the availability of freshwater, and changes to air quality (Krishnan et al., 2019; Samset et al., 2019).
Aerosols have two main effects on the Earth’s energy balance, and hence, climate—they scatter and absorb sunlight. Sulfate particles are the most important scattering (cooling) aerosols, while BC is the most significant absorbing (warming) component of atmospheric aerosols. BC is currently the second strongest contributor to global warming, after CO2 (IPCC, 2021). As the light-absorbing capacity of BC is five-times stronger than that of mineral dust and brown carbon (BrC), a light-absorbing component of organic carbon often co-emitted with BC, and the atmospheric heating by BC is a significantly larger (than that by dust and BrC) climate forcer (e.g., Ramachandran et al., 2020b). In this study, we contribute to a better understanding of the connections between ongoing energy transitions (cleaner production and consumption), the emissions, and atmospheric amounts of light-absorbing aerosols (and consequent atmospheric heating rate) through a first-time analysis of a high quality, two-decade-long time series of absorption aerosol optical depth (AAOD) and AAOD due to BC over South and East Asia, which we then relate to regional trends in energy transitions and economic growths in South and East Asia.
2 Materials and Methods
2.1 Energy, Economic, and Emission Data
In this study, the annual data of the primary energy supply (PES) from different energy sources (e.g., coal, primary and secondary oil, and natural gas), CO2 emissions, and gross domestic product (GDP) for China and India for the period 2000–2017 (Figure 1) reported by the International Energy Agency (IEA) (https://www.iea.org/countries/) and The World Bank (https://data.worldbank.org), respectively, are used. The BC emissions data (total emissions from power plants, industries, road transport, other transport, and residential and other domestic activities), published in the previous literature (Kurokawa and Ohara, 2020), for India and China for the period 2000–2015 are downloaded from http://www.nies.go.jp/REAS/index.html#data%20sets.
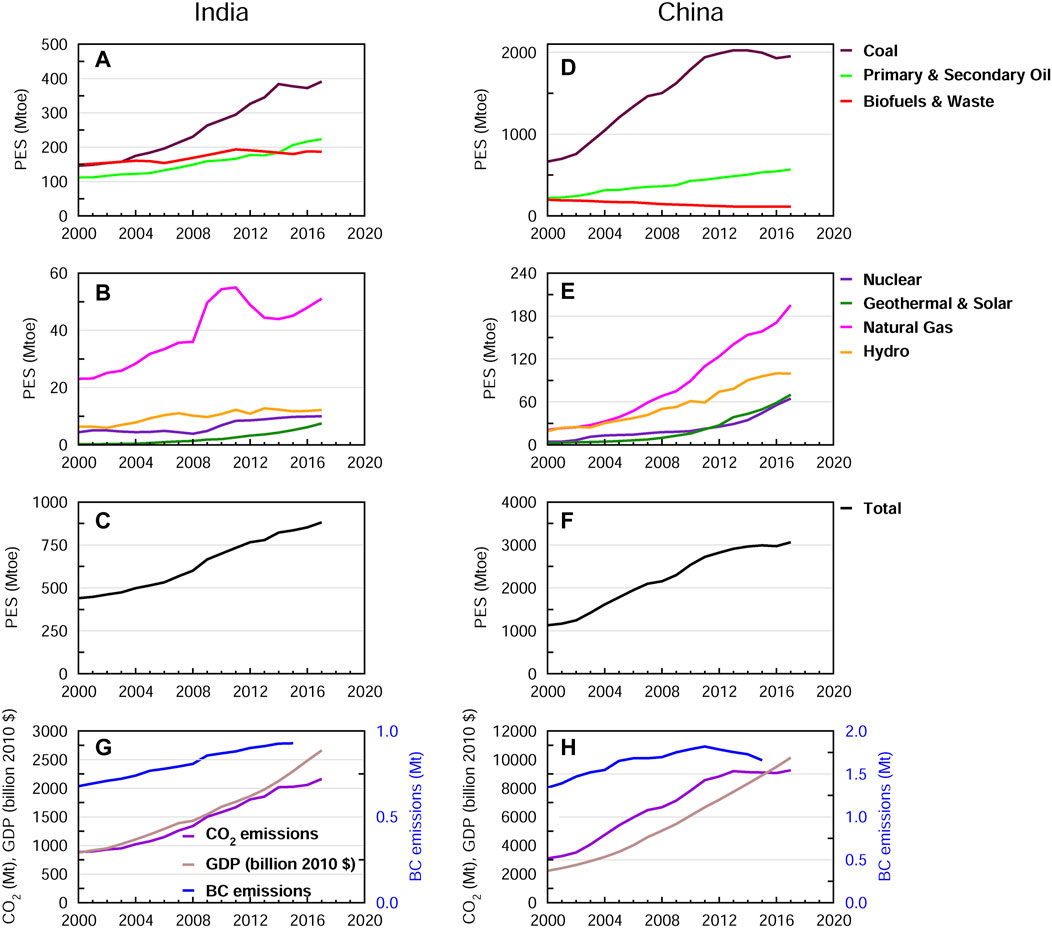
FIGURE 1. Annual primary energy supply (PES), gross domestic product (GDP), and CO2 and BC emissions for India and China during 2000–2017: PES [in megatons oil-equivalent (Mtoe)] from different sources (A,B) and their total [sum of all PES from different sources shown in figures (A,B)] (C) for India and from different sources (D,E) and their total [sum of all PES sources drawn in figures (D,E)] (F) for China, along with GDP and CO2 and BC emissions for (G) India and (H) China.
2.2 Aerosol Data and Analysis
2.2.1 Observation Sites
Kanpur (26.5oN, 80.2oE, 123 m above the mean sea level (asl)), in South Asia, is a densely populated, industrialized, and a heavily polluted location, ca. 500 km to the east (often downwind) of the megacity New Delhi, in the Indo-Gangetic plain (IGP), a global air pollution hotspot. Beijing (39.9oN, 116.4oE, 92 m asl), in East Asia, is also a heavily industrialized and a highly polluted megacity in the North China Plain (NCP), another global air pollution hotspot. The NASA Aerosol Robotic Network (AERONET) sites in Beijing and Kanpur have the longest time series of aerosol observations in the two regions, with observations starting from ca. 2000. The general locale of the sites and aerosol characteristics are quite similar over Beijing and Kanpur. They are large cities with heavy aerosol pollution mainly due to emissions from fossil fuel combustion and biomass burning during all seasons, along with desert dust events that occur primarily in the spring (pre-monsoon) season (March–May) (Eck et al., 2010; Ramachandran et al., 2020a). Thus, both sites are heavily affected also by the regional emissions, in addition to their own local sources. The Beijing site can be considered to be a representative of the region, as the aerosol characteristics observed at the AERONET Xiang He site, which is located at ca. 80 km away to the east–southeast from Beijing in NCP, were reported to be similar to Beijing (Eck et al., 2005). The Kanpur site can be considered as a general representative of the Indo-Gangetic Plain (Ramachandran et al., 2020a).
2.2.2 Observational Aerosol Data
2.2.2.1 Satellite Observations
Data are utilized from the moderate resolution imaging spectroradiometer (MODIS) instrument on board the Terra satellite, using version 6.1 monthly version-3, level 3 aerosol optical depth (AOD) at 0.55 µm, and from the Ozone Monitoring Instrument (OMI), using OMAERUV v003 level 2 absorption AOD (AAOD) at 0.388 µm that are unaffected by the row anomaly throughout the OMI operation (Ramachandran et al., 2020a), and only the best quality retrievals of OMI AAOD data (quality flag = 0) are included. AOD data retrieved using the combined dark target (DT) and deep blue (DB) algorithms for land and ocean are used. The uncertainty in level 2 (10 km) MODIS Terra version 6.1 AOD retrieval is ±0.05 ± 0.15AOD (Levy et al., 2013). Due to some inherent uncertainties in the assumed spectral dependence, which might not represent all aerosol types/conditions globally, it is recommended to use the 0.388 µm AAOD dataset. The root-mean square error for OMI AAOD is estimated to be ∼0.01 (OMI DUG, 2012).
2.2.2.2 Ground-Based Observations
The AERONET data are one of the most trusted and extensively used ground-based aerosol observation data in the world. The AERONET quality assured (level 2, version 3 cloud-screened) daily data on aerosol optical depth (AOD), single scattering albedo (SSA), absorption aerosol optical depth (AAOD), absorption Ångström exponent (AAE), and aerosol radiative forcing (ARF) acquired with the ground-based CIMEL Sun/sky radiometers (Holben et al., 2001) for the period of 2001–2017 over Kanpur and Beijing (excluding 2001 and 2005 over Beijing since only three months of data were available for each of these years) are utilized. Kanpur (since 2001) and Beijing (since 2001) are the only two sites throughout South Asia and East Asia, respectively, with the long, continuous records of AERONET measurements. There are several other AERONET sites in South Asia and East Asia with varying length(s) of data coverage. The main criteria for inclusion of a site in the analysis are the number of years of measurement (both duration and availability of level 2 data), overlap between the sites with the same period of data availability with the data covering all four seasons (winter: December-February, pre-monsoon: March-May, monsoon: June-September, and post-monsoon: October-November) in a year, and is available for ≥9 months in each year. Over the IGP, in Gandhi College (25.9°N, 84.1°E, 60 m asl), quality-assured data are available starting from 2006; however, during 2008, 2010, 2011, and 2013, data were available only for 3 months or less. Similarly, in Karachi (24.9°N, 67.1°E, 49 m asl), Lahore (31.5°N, 74.3°E, 209 m asl), and Pokhara (28.2°N, 83.9°E, 800 m asl), data were only available for 2009–2017, 2010–2016, and 2010–2017, respectively. Over East Asia, in Xiang He (39.8°N, 116.9°E, 36 m asl), data were available during 2005–2016. However, aerosol characteristics over Xiang He, located at ca. 80 km away to the east–southeast from Beijing in NCP, were similar to Beijing (Eck et al., 2005). We have considered in this study only those sites in South and East Asia where all the aerosol parameters including AOD, SSA, and ARF are available continuously. Furthermore, only level 2 AERONET AOD data are available from 2009 to 2017 over Jaipur (26.9°N, 75.8°E, 450 m asl) in the IGP (SSA and ARF are not available), and in other AERONET locations in NCP—Taihu (31.4°N, 120.2°E, 20 m asl), Xinglong (40.4°N, 117.6°E, 899 m asl), and Hong Kong (22.3°N, 114.2°E, 30 m asl)—the SSA and ARF data are not available on a continuous basis to facilitate trend analysis. Other locations in NCP in China, such as Xuzhou (34.2°N, 117.1°E, 59 m asl) and Hefei (31.9°N, 117.2°E, 36 m asl), and a few other locations in South Asia such as Lumbini (27.5°N, 83.3°E, 110 m asl), Kathmandu (27.7°N, 85.4°E, 1297 m asl) in Nepal, and Dhaka (23.7°N, 90.4°E, 34 m asl) and Bhola (22.3°N, 90.8°E, 7 m asl) in Bangladesh in the IGP do not have level 2 AERONET data for more than a year or two, restricting us to not include these locations in this analysis. It may be noted that the AERONET level 2 data which is the quality-assured data with the final calibration (pre- and post-) applied, as well as being cloud-screened and manually inspected is used in the study. In comparison, level 1.5 data are not quality assured and may not have a final calibration applied. Furthermore, since the objective of the study was to connect energy transitions and aerosol absorption and the associated changes in atmospheric heating due to changes in aerosols over a long period (in this case two decades), as compared to a sudden, episodic, abrupt increase or decrease, such as due to the lockdowns associated with the Corona Virus Disease 2019 (COVID-19) pandemic and due to the non-availability of aforementioned quality-controlled level 2 aerosol data beyond the time periods mentioned, the study is restricted to the years 2001–2017, focusing on the data from Kanpur and Beijing.
The details on the AERONET measurements, data processing, and associated uncertainties in solar fluxes and various aerosol parameters are reported in previous studies (Dubovik et al., 2000; Holben et al., 2001; García et al., 2008; Mallet et al., 2013). The only data that pass through all quality checks described in these publications are used in our analysis. The ARF over a given location, which is used in the present study to estimate aerosol-induced atmospheric heating rate (HR), depends on—aerosol properties (AOD, SSA, and asymmetry parameter), geophysical parameters (e.g., surface albedo), and insolation (García et al., 2008; García et al., 2012). Over the locations with surface albedo <0.3, surface albedo has a less significant influence on ARF, whereas for the locations with surface albedo >0.30, it is critical for ARF estimates (García et al., 2012). Furthermore, the ARF at the surface (ARFSFC) is found to be overestimated, and to correct the overestimation the AERONET ARFSFC needs to be multiplied with (1-SA), where SA is the spectral average of surface albedo (García et al., 2012). The SA is 0.23 ± 0.02 for Kanpur and 0.15 ± 0.02 for Beijing; the surface albedo values for both Kanpur and Beijing do not exhibit any noticeable interannual and intra-annual variations. In the present study, only the ARF data retrieved for the column and clear-sky atmosphere and corrected for the effect of surface albedo are utilized. The AAOD is estimated as AAOD = AOD x (1-SSA). The mean of the annual mean SSA values during the study period 2002–17 is 0.91 ± 0.01 (range: 0.89–0.93) over Kanpur and it is 0.93 ± 0.01 (range: 0.91–0.94) over Beijing.
2.2.3 Estimation of BC AAOD
The annual mean AAOD values at 0.44, 0.675, and 0.87 µm wavelengths calculated from daily average data are used to estimate the AAODs first due to carbonaceous aerosol (CA) and dust, and then further BC AAOD and BrC AAOD are estimated from the CA AAODs. The details on this approach are presented in previous publications (Chung et al., 2012; Ramachandran et al., 2020b), and hence it is briefly described here. The AAOD depends on the wavelength of sunlight. It is expressed as AAOD = Kλ−AAE, where λ is the wavelength, AAE is the absorption Ångström exponent, and K is a constant. The AAE values for dust, CA, and BC (AAEDust, AAECA, and AAEBC, respectively) reported in earlier studies (Eck et al., 2005; Bergstrom et al., 2007; Russell et al., 2010; Chung et al., 2012) are used. Chung et al. (2012) derived AAEDust and AAECA values from global observations of AERONET data. The AAEDust values were obtained from the AAE distribution when α (Ångström exponent derived from AODs in the 0.44–0.87 µm wavelength range) values were small (i.e., when the coarse mode particles such as dust and sea salt dominate aerosols) (Chung et al., 2012). Dust particles can be internally mixed with BC, and AAE values are lower for CA than pure dust particles. Therefore, based on this understanding, Chung et al. (2012) used the 95th percentile of AAE values to represent pure dust, and it came out to be 2.4. The observation-based AAEDust reported in previous studies were in the range of 1.9–2.4 (Bergstrom et al., 2007; Eck et al., 2010; Russell et al., 2010), in which the low value of AAEDust was attributed to dust mixed with pollution aerosols (Chung et al., 2012). In case of AAECA, Chung et al. (2012) derived the values from the AERONET data measured over four regions dominated by specific aerosol emissions and found AAECA of 0.84 for fossil fuel-dominated areas (North America, West Europe, and East Asia to 0.97 for East Europe), 1.16 for South Asia, and 1.14 for biomass burning-dominated areas or seasons in these four regions. In this study, AAECA of 1.16 appropriate for Kanpur and 0.84 appropriate for Beijing is used. Furthermore, Chung et al. (2012) adopted the lowest 10th percentile of the fossil fuel aerosol AAE distribution (range: 0.38 and 0.67) and used the mean value (=0.5) for AAEBC. This is used in this study to estimate the BC contribution to AAODCA. BC is not only the strongest absorber per unit mass, with an SSA of 0.19 (5-times higher) compared to 0.85 for BrC and 0.84 for dust, thereby contributing the largest amount to atmospheric heating; it also dominates (≥75%) the aerosol absorption over South and East Asia (Ramachandran et al., 2020b). Thus, we focus on BC AAOD and its trends over Asia. AAOD and BC AAOD values in the present study correspond to the wavelength of 0.55 μm.
2.2.4 Atmospheric Solar Heating Rate
The aerosol-induced atmospheric solar heating rate (HR) is obtained using ARFATM (aerosol radiative forcing in the atmosphere (ATM)) and the difference in atmospheric pressure between the elevation of the measurement site (in our case Kanpur: 123 m and Beijing: 92 m) and 5,000 m asl over each site. As almost all the aerosols in the troposphere reside between the surface and 5,000 m asl, we adopted this commonly used procedure for computing the aerosol heating rate (Ramanathan and Carmichael, 2008; Ramachandran et al., 2020a).
2.2.5 Trends in Aerosol Properties
The linear regression method is used in estimating the trends in aerosol properties (e.g., AAOD and BC AAOD) and aerosol-induced atmospheric heating rate (HR). It is suitable when the uncertainty or the error in data is constant, and regression can be obtained by assigning the same precision for each value (thereby allotting a weight of unity to each value). In addition, it is a simple, robust, and less sensitive method even when there are breaks in the time series of data. The trends in AAOD, BC AAOD, and HR are found statistically significant. The p-values of trends at 99% confidence level (CL) in AAOD, BC AAOD, and HR for the 2002–2017 period are <0.001 for Beijing data and ≤0.10 for Kanpur data.
3 Results and Discussion
3.1 Energy Transitions Over Asia
Coal and oil are the two major sources of energy in Asia, accounting for >60% in India and >80% in China (Figure 1), with the absolute amount of primary energy supplied (PES) by these two fuels being four times greater in China than in India (Figure 1). The energy supply from coal stays rather steady in the last decade over both India and China, while the primary and secondary energy supply from oil has been consistently on the rise in both countries over the last two decades (Figure 1). The changing energy supply is largely driven by domestic consumption activities, and the transition in the energy mix is anticipated to influence its emissions and thus the composition of the atmosphere. Gross domestic product (GDP) and CO2 emissions are strongly coupled over both regions, similar to the patterns seen in more developed countries. In China and India, the GDP and CO2 emissions both grew by a factor of four between 2000 and 2017. In addition, both GDP and CO2 emissions are a factor of four higher in China than in India (Figure 1). BC emissions in China are at least twice as high as that in India (Figure 1) (Kurokawa and Ohara, 2020). BC emissions in China continued to increase from early 2000s to 2010 and then started to fall (Figure 1H) mainly due to reductions in transport and industrial emissions rapidly and a slight decrease in residential emissions (Kurokawa and Ohara, 2020; Kanaya et al., 2020). The reductions in residential emissions were mainly caused by a decrease in emissions from biomass consumption (Kurokawa and Ohara, 2020). In contrast, in India, BC emissions showed increasing trends during the same period (2002–2017) caused by growth of emissions from diesel vehicles and industry sector (IEA, 2016; Kurokawa and Ohara, 2020). The percentage contributions of biofuels and waste to the total PES have decreased while those of solar, wind, hydro power, nuclear, and natural gas have increased over the last two decades in both countries (Figure 2). Recently, the coupling between emissions of polycyclic aromatic hydrocarbons (PAHs) driven by energy transitions and socioeconomic factors over China was examined, and the results showed that after 2016 the PAHs emissions were decoupled from socioeconomic growth (Cao et al., 2022). It was predicted that emissions of PAHs will reach a peak in 2035 when driven only by energy transition under the shared socioeconomic pathways (Cao et al., 2022). Typically, the energy growth, GDP growth, and CO2 emissions are tightly coupled; however, the coupling/de-coupling between energy, GDP, and emissions of climate-forcing air pollutants (e.g., BC) and the resultant atmospheric effects over Asia are unclear and have not been properly investigated yet.
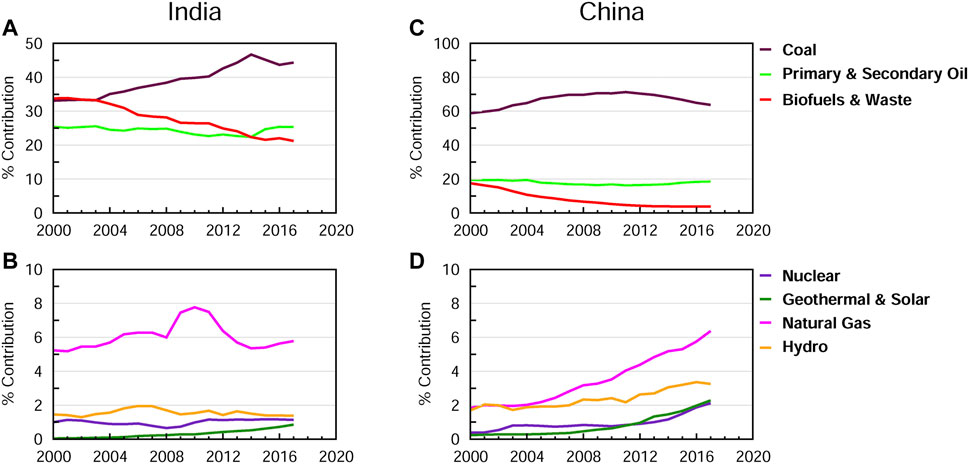
FIGURE 2. Contribution of energy sources to their total for India and China during 2000–2017: percentage contribution of different energy sources to their total (Figure 1) for India (A,B) and China (C,D).
3.2 Trends in the Absorption Aerosol Optical Depth and Atmospheric Heating Rate
We analyze the measured columnar content of absorption due to particulate air pollution (absorption measured in terms of AOD and AAOD) and the resultant aerosol-induced heating of the atmosphere (HR) from two AERONET sites with the longest data records in these two regions to provide a previously unavailable regional and temporal patterns of trends in aerosol pollution and its climate implications over South and East Asia, the two main global aerosol hotspots. The aerosol emissions over South and East Asia have been changing since 2010, especially due to the introduction of stringent air quality measures in China aimed to address public health concerns. The AAOD is relatively higher over Beijing than Kanpur, whereas the BC AAOD is relatively higher over Kanpur than Beijing (Figure 3). Both AAOD and BC AAOD decrease over both sites during 2002–2017, with the rate of the BC AAOD decrease being a factor of three faster over Beijing (Table 1). In remarkable contrast, satellite observations show that during the last decade, the AOD (the total aerosol columnar content) decreased significantly over China (Table 2) in contrast to an increase in AOD over India, strongly shifting the weighting of the dipole pattern in AOD which is present between East and South Asia (Table 2).
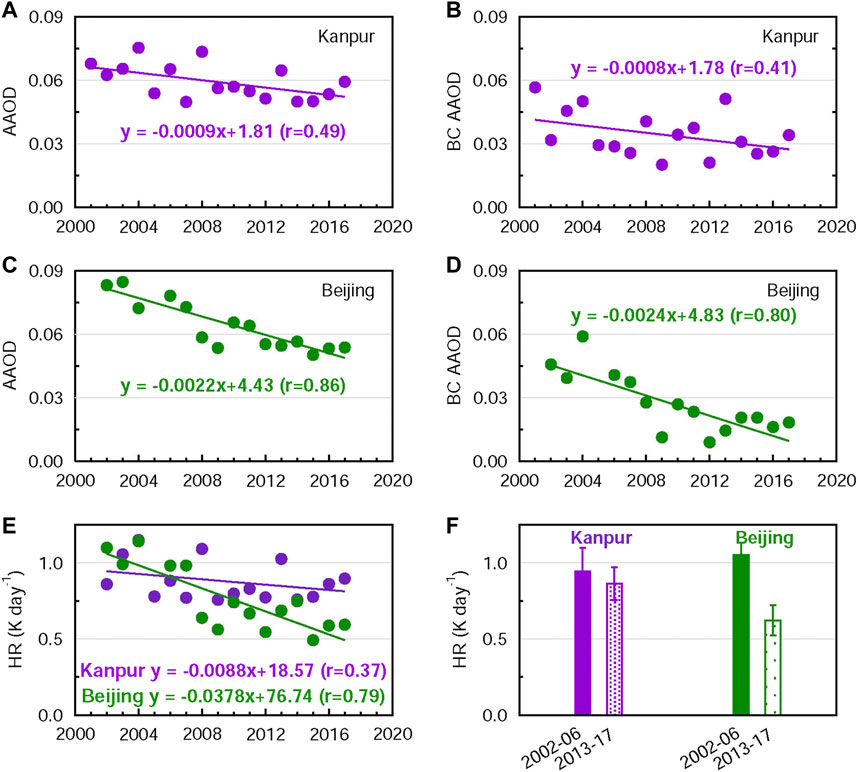
FIGURE 3. Aerosol absorption and atmospheric heating rate induced by aerosols over Kanpur and Beijing during 2002–2017: Annual-mean absorption aerosol optical depth (AAOD) and black carbon absorption aerosol optical depth (BC AAOD) over (A,B) Kanpur in the IGP and (C,D) Beijing in the NCP. (E) The annual mean atmospheric heating rate due to aerosols (HR) over Kanpur and Beijing during 2002–2017. The p-values at the 99% confidence level for the 2002–17 period are (A) 0.05, (B) 0.10, (C) 0.00001, (D) 0.0004, and (E) 0.10 (Kanpur) and 0.0007 (Beijing). (F) HR for Kanpur and Beijing averaged for the two 5-year periods of 2002–2006 and 2013–2017. Vertical bars indicate ±1σ (standard deviation) from the mean.
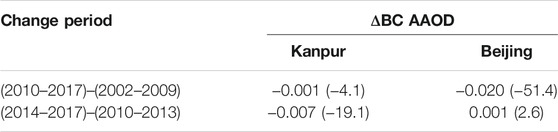
TABLE 1. Decadal and intra-decadal changes in BC AAOD (BC absorption aerosol optical depth) over Kanpur and Beijing from AERONET observations (Figure 3). Numbers in parenthesis indicate the change in %.
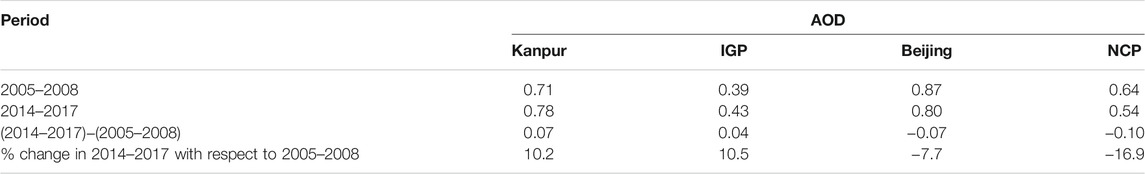
TABLE 2. Intra-decadal changes in MODIS Terra 6.1 version 3, level 3 combined dark target and deep blue algorithms retrieved aerosol optical depth (AOD) over Kanpur, the Indo-Gangetic Plain (IGP), Beijing, and the North China Plain (NCP) (Figure 4).
The BC AAOD shows a sharp drop over Beijing in 2009, which is in part due to the direct implementation of aggressive emission controls in the run up to Beijing Olympics 2008 and afterward, though there is considerable interannual variability and a continued downward trend in the following years (with 2012 having the lowest BC AAOD). Though the energy consumption has increased during the last two decades, the reduction in emissions of SO2 and other pollutants including BC has been more rapid in China than in India due to highly successful aggressive emission control policies in China (Li et al., 2017; Zheng et al., 2018; Kanaya et al., 2020). Chinese emissions of both SO2 and BC (Figure 1F) have decreased (Zheng et al., 2018; Meng et al., 2019; Kanaya et al., 2020); however, their rates of decrease differ significantly— SO2 emissions decreased by 62% and BC decreased by 28% during 2010–17 (Zheng et al., 2018). Over Beijing, BC decreased by about 70% in 2020 with respect to 2012, and the aerosol extinction coefficient of fine particles decreased by ∼50% due to the Clean Air Action Plan implemented in 2013 (Sun et al., 2022). The estimated annual mean PM2.5 weighed by the nation’s population decreased by 32% from 62 µg m−3 to 42 µg m−3 during the five-year period (2013–2017) (Zhang et al., 2019). An analysis on a measure-by-measure basis indicated that strengthening industrial emission standards in power plants and emission-intensive industrial sectors, upgrades on industrial boilers, phasing out outdated industrial capacities, and promoting clean fuels in the residential sector were the major effective measures that reduced PM2.5 emissions over China (Zhang et al., 2019). These measures resulted in an estimated reduction of 16 µg m−3 in 2017 when compared to 2013, with clean fuels in the residential sector contributing 13% of the reduction of PM2.5 (Zhang et al., 2019). In contrast, in India, the emissions of PM2.5 and BC (Figure 1G) have increased, parallel to the coal and heavy oil consumption in thermal power plants and industries and diesel in transport (Sadavarte and Venkataraman, 2014; Meng et al., 2019). The increase in PM2.5 and SO2 emissions from the industrial sector in India was ∼2.5 times larger than the increase in fuel consumption, which was attributed to the growth in process emissions resulting from an increase in production activity (Sadavarte and Venkataraman, 2014). In the transport sector in India, the increase in these emissions was smaller than the corresponding fuel consumption increase, owing to implementation of emissions and fuel quality norms (Sadavarte and Venkataraman, 2014). Due to the near-constant biomass burning amounts over India during the study period (Figure 1A), the decrease in BC AAOD over India is not as significant as over China, as ca. 50% of BC over South Asia is emitted from biomass burning while it is only 20% over East Asia (Li et al., 2016). Consequently, the changes in the aerosol-induced atmospheric heating rates (HRs) due to changes in emissions of air pollutants differ significantly over the two regions (Figure 3E). The annual average HR is ≥0.8 K day−1 every year during 2002–2017 over Kanpur, while it is in the range of 0.5 (2017)–1.1 (2002) K day−1 over Beijing; the rate of decrease is three times faster over Beijing which is consistent with the decrease in BC AAOD. The HR averaged over the two periods is shown in Figure 3F—the first period represents the first five-year period of the analysis (2002–2006), and the second period corresponds to the last five-year period of the analysis (2013–2017) (Figure 3), which is carried out to quantify the change in HR due to BC reduction on a half-decadal scale in a more robust and quantitative manner. The five-year period was selected so that the effect of interannual variations is smoothened out. Also, the year 2013 marks the beginning of the implementation of Clean Air Action Plan in China. The HR averaged over the periods 2002–2006 and 2013–2017 decreases from 1.05 to 0.62 K day−1 over Beijing, and from 0.94 to 0.86 K day−1 over Kanpur, i.e., a decrease of 41% over Beijing versus only 9% over Kanpur. Our observation-based results clearly provide evidence for the de-coupled trend between cleaner energy transitions and aerosol-induced atmospheric heating over India and China (Figure 3), as opposed to the more typical coupling between increasing energy use, economic growth, and CO2 emissions (Figure 1).
The total PES in both China and India has not decreased over time; it is in fact increasing, by >3-fold increasing from 1131 megatons oil-equivalent (Mtoe) in 2000–3065 Mtoe in 2017 in China and by 2-fold from 441 to 882 Mtoe in the same period over India (Figure 1C, F), including absolute contributions of each source type (except biofuels and waste which are decreasing) (Figure 1). Regarding percentage contributions of each source type to PES, the share of biofuels and waste has decreased significantly while that of solar, wind, hydro power, nuclear and natural gas has increased significantly during 2000–2017 in both countries (Figure 2). At the same time, the percentage contribution of coal increased until 2010 in China and until 2014 in India and since then it has been decreasing at a rather slow pace whereas that of oil is more or less same each year throughout this period. The fossil fuel and biomass and waste are also used in cleaner ways recently, i.e., cleaner production and consumption of energy through adoption of cleaner technologies and cleaner fuels compared to the past. Furthermore, the relation between aerosol emissions (source), their mass loading, and optical depth are not linear (Ramachandran et al., 2020b). For example, BC contribution to total aerosol mass is at least 5-times less than the sum of BrC and dust, the other two light-absorbing aerosols (Ramachandran et al., 2020b). The vertical distribution of an aerosol species and therefore its column content depends on the emissions, chemical production, residence time, transport, and removal mechanisms. Thus, the changes (decrease/increase) in emissions may not exactly match with changes in AAOD values and/or their trends over a location. Furthermore, other AERONET sites in IGP and Himalayan foothills affected by IGP pollution outflow, namely Lahore, Gandhi College, and Pokhara also show a positive (increasing) trend of AOD, consistent with the regionally coherent/consistent increase observed in satellite observations over the IGP (Ramachandran and Rupakheti, 2022). Xiang He in NCP showed a negative (decreasing) trend in AOD and AAOD consistent with a negative trend observed over Beijing, confirming a regionally homogenous decrease in the aerosol content over the NCP. BC AAODs at all the aforementioned sites in IGP and NCP showed decreasing trends (Ramachandran and Rupakheti, 2022). Therefore, the resultant decrease in BC emissions and BC AAOD over Asia is regionally coherent (Table 3) and occurs primarily due to transitions into cleaner energies (both renewables and fossil fuels) and not due to the decrease in PES or decrease in use of fossil use and biomass and waste which would have resulted in less BC emissions.
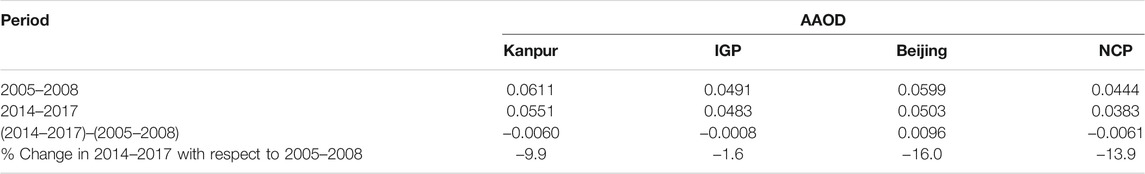
TABLE 3. Intra-decadal changes in OMI-retrieved version 3, level 2 absorption aerosol optical depth (AAOD) over Kanpur, the Indo-Gangetic Plain (IGP), Beijing, and the North China Plain (NCP) (Figure 4).
The regional air quality and climate over South and East Asia are strongly influenced by the Asian summer monsoon circulation, with southwesterly winds during summer monsoon and with northeasterly winds during winter monsoon, respectively (Ramachandran et al., 2020a). The IGP and NCP are influenced by aerosols from fossil fuel combustion and biomass burning throughout the year, in addition to transport of dust aerosols and sea salt particles during the pre-monsoon and monsoon seasons, respectively (Ramachandran et al., 2020a). The HR was found to be significantly lower (25–50%) during the monsoon than the other seasons of the year mainly because of wet removal of aerosols (Ramachandran et al., 2020a). The seasonal trend analysis of AOD clearly showed that natural aerosols (dust and sea salt) did not change enough to alter the AOD and SSA significantly across the seasons over the IGP and the NCP during the last two decades. Thus, the changes/trends in AOD and SSA occurred/are controlled mainly due to/by the increase/decrease in emissions of anthropogenic aerosols and aerosol precursor gases (Ramachandran et al., 2020a).
3.3 Changes and Drivers of Aerosol and Precursor Emissions Over Asia
On local and global scales, identifying the factors that drive climate change, and that connect it to air pollution, is crucial to effectively reduce emissions and their impacts (Meng et al., 2019). The global emission inventories show that the emissions of fine PM and its precursor gases continued to grow between 2004 and 2011 in China, though somewhat slower than in the previous years, partly due to restrictions in industrial emissions in China (Meng et al., 2019). Emissions of key climate forcing species (e.g., BC, SO2, and CO2) in South Asia showed slightly increasing trends during 2004–2011 (Sadavarte and Venkataraman, 2014; Meng et al., 2019). Among the two regions, the demand for construction, machinery and equipment, and transport sectors was the largest driver in East Asia, while in South Asia energy production was a key driver, along with the demands for metals and food products, especially in increasing SO2 emissions (Meng et al., 2019; Kurokawa and Ohara, 2020). Large decreases in primary PM2.5 and BC emissions over East Asia occurred due to emission controls in industrial processes, while these are not implemented yet on a sufficient scale in South Asia to lead to significant decreases of emissions, so that, for example, SO2 emissions in South Asia still increased slightly due to the growth of energy production by coal (Meng et al., 2019; Kurokawa and Ohara, 2020), and BC emissions only decreased slightly over India, which is still strongly influenced by residential emissions without significant emission controls (Sadavarte and Venkataraman, 2014).
The changes in aerosol emission patterns result in variations in BC AAOD over Asia on inter- and intra-decadal timescales (Table 1). The intra-decadal difference shows the effects of rapidly changing (decreasing) aerosol emissions over East Asia after 2009 (Zheng et al., 2018; Meng et al., 2019). The rate of decrease in BC AAOD on a decadal scale (i.e., for 2010–2017 compared to 2002–2009) is significantly higher over Beijing (>50%, compared to only ∼4% over Kanpur). The BC AAOD over Kanpur, in contrast, has decreased much more strongly (∼20%) in the last few years (i.e., comparing 2014–2017 to 2010–2013), while over Beijing it has been relatively constant over the last decade. The changes in BC AAOD over Beijing and Kanpur are consistent with the trends in energy mix and associated emissions discussed previously.
Over East and South Asia, the AAOD contributes about 5–10% to the total AOD (Figure 3), with BC being the main absorbing aerosol species contributing to the AAOD. BC is the most dominant aerosol absorber among BC, BrC, and dust over the Indo-Gangetic Plain and the Himalayan foothill region (Ramachandran et al., 2020b). The satellite observations show that during the last decade, AOD decreased significantly over China (Figure 4), in contrast to an increase in AOD over India, strongly shifting the weighting of the dipole pattern in AOD which is present between East and South Asia. An analysis of MODIS satellite observations clearly showed the presence of a regional-scale dipole as well as the decadal-scale changes in the aerosol content (AOD) over Asia (Ramachandran et al., 2020a). The analysis further revealed that the trends in AOD for the two regions (IGP and NCP) as well as over the two locations of Kanpur and Beijing for the period 2002–2017 were similar— AOD increased over Kanpur and IGP, a large BC emission hotspot region in South Asia and decreased over Beijing and NCP, another BC emission hotspot in Asia in the last two decades (Table 2). The rate of increase is the same over Kanpur and the IGP, whereas the AOD over the NCP decreased two-times higher than that over Beijing (Table 2), indicating a regional scale reduction in BC emissions over China. The annual variation in the area-averaged AODs over the IGP and NCP was found to decrease in the recent years pointing to a regional consistency in the sign of increase or decrease of aerosol emissions and amounts, however, with different rates (Ramachandran et al., 2020a) (Table 2). The decrease in AAODs is smaller than AODs (Tables 2, 3) over South and East Asia. The AAODs decrease by ∼10% over Kanpur and only by 2% over South Asia whereas the decrease is higher and more consistent regionally over East Asia (∼16%). Over Beijing, AAOD decreases by 14% (Table 3). On both local scale (Figure 3, Table 1) and regional scale (Figure 4, Table 3), the AAOD decreased over both South and East Asia, at different rates which are consistent with the changes in BC emissions discussed previously.
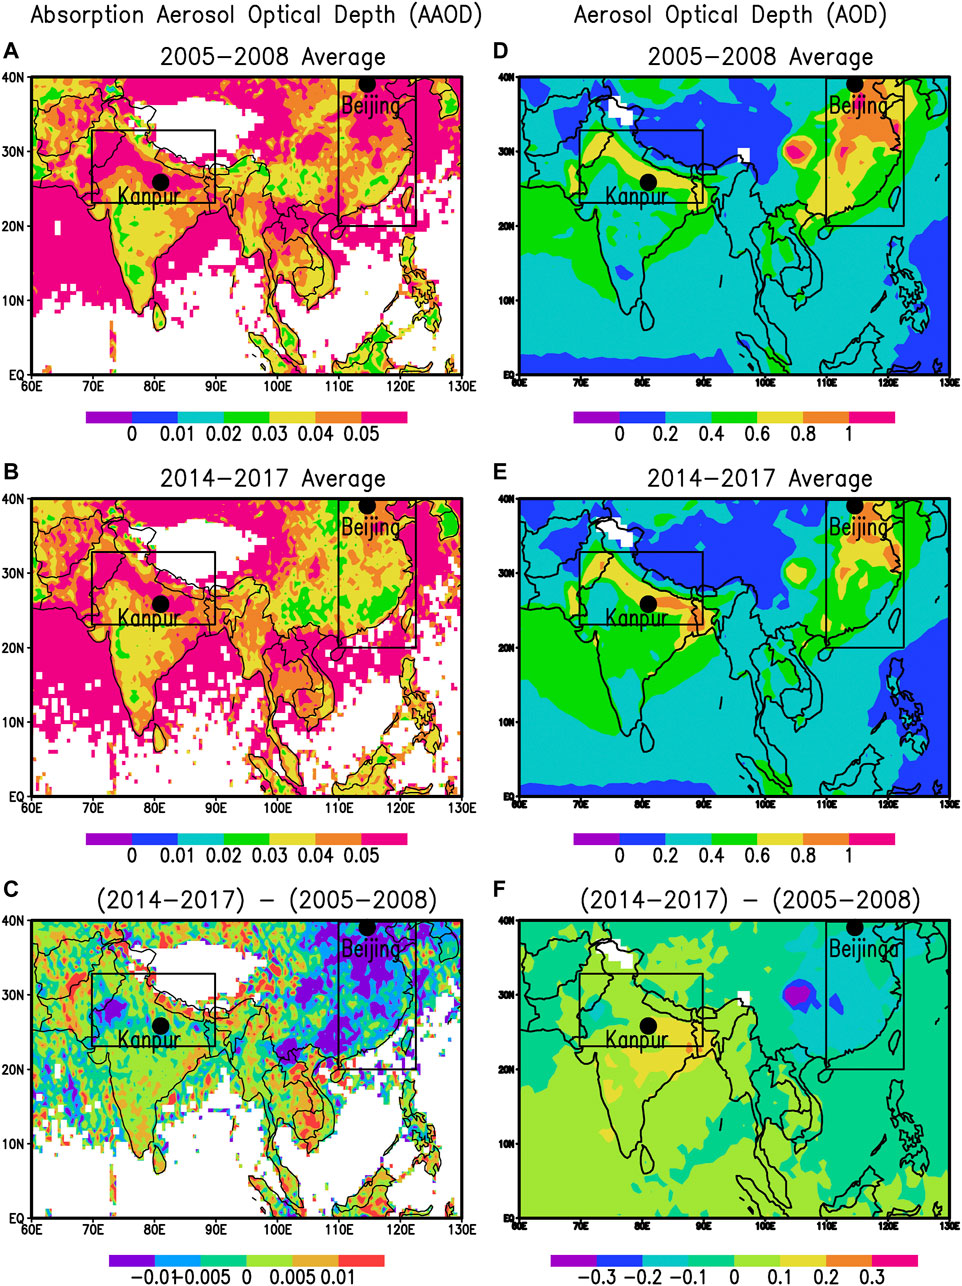
FIGURE 4. Absorption aerosol optical depth (AAOD) and aerosol optical depth (AOD) over Asia: OMI OMAERUVd v003 level 2 AAOD at 0.388 µm wavelength averaged for (A) 2005–2008 and (B) 2014–2017, and MODIS Terra version 6.1 level 3 AOD at 0.55 µm wavelength averaged for (D) 2005–2008 and (E) 2014–2017. The spatial differences in AAOD and AOD between the two periods are shown in (C, F), respectively. Data were downloaded from https://giovanni.gsfc.nasa.gov/giovanni/. The boxes in the figure correspond to the IGP (22.5°N–33.5°N, 69.5°E–90.5°E) and the NCP (20°N–40°N, 110°E–122°E) regions. The two AERONET study sites—Kanpur and Beijing are marked in the figure.
3.4 Climate Benefits
To demonstrate the climate benefits due to changes (reduction/increase) in BC aerosols, the results obtained from the U.K. Earth System Model (UKESM1-0-LL), which participated in the AerChemMIP (Collins et al., 2017) experiments in the Coupled Model Intercomparison Project Phase 6 (CMIP6) (Eyring et al., 2016) are used for the analysis. The UKESM1 model description and evaluation of the chemistry and aerosol schemes can be found in Archibald et al. (2020) and Mulcahy et al. (2020), respectively. The AerChemMIP 30-year time slice experiments are used to determine the present-day (2014) climate responses for the changes in emissions of aerosols or other climate forcers (Collins et al., 2017). The “piClim-control,” “piClim-BC,” and “piClim-SO2” experiments along with the “historical” simulation (which includes transient emissions of aerosols and greenhouse gases (GHGs) and natural variabilities) are used to estimate the climatic effects of aerosol precursors. The changes are calculated by comparing control and perturbed runs with the same prescribed 1850 preindustrial sea surface temperatures (SSTs), sea ice, aerosols, and GHGs. A total of thirty years of simulation are required to minimize internal variability (mainly from clouds) (Forster et al., 2016). One ensemble member simulation for each experiment is used for the present analysis. However, it should be noted that this is for a specific model, and the perturbed experiment still has the 1850 climate conditions. These prescribed SST runs also remove much of the variability that is visible in the ocean-coupled models due to responses in SST, ocean circulation, sea ice, atmospheric circulation, and clouds. Thus, although the results from the model simulations do not directly correspond to the actual temporal trends observed during the years of observational data analysis, they are nevertheless useful for deciphering the climate benefits due to the reduction in the respective aerosol and precursor emissions, particularly BC and SO2.
The emissions of SO2 and black carbon have been increasing over Asia since 1850 (Figure 5). In recent years, the decreases in SO2 emissions were more clearly seen over China when compared to BC (Ramachandran et al., 2022). It was noted that the decreases in these emissions were slower in CMIP6 models than in observation-based estimates (Wang et al., 2021), leading to smaller changes in model-simulated AAOD and BC AAOD (Figure 6) than in the observations (Figure 3). The Atmospheric Chemistry and Climate Model Intercomparison Project (ACCMIP), which examined the short-lived drivers of climate change in current climate models, reported that models strongly underestimate AAOD in many regions, and every model showed markedly less AAOD in South and East Asia (Shindell et al., 2013). The model results clearly show that the BC aerosols alone contribute about half of the surface temperature change (warming) due to all forcing agents (greenhouse gases including CO2, natural and internal variability, and transient emissions of aerosols) (Figure 6). The surface cooling due to sulfate aerosols is more or less equal to the warming by BC aerosols. Thus, it is clear that a reduction in BC emissions would significantly reduce the global warming. However, these modeling results differ from previous studies because this study excludes the responses from the natural variability, circulation, and sea ice responses, which cause relatively strong temperature fluctuations that may counteract (and thus mask) the impacts of small signals from BC aerosols. The concentration and changes in emissions of reactive species are found to cause multiple changes in the composition of radiatively active species, including aerosols (Thornhill et al., 2021). Recent studies suggest that the response of temperature change to the BC forcing is dominated by rapid adjustments (Stjern et al., 2017). While it was found that substantial increases in BC concentrations have considerable simulated impacts on the climate system, some of these effects were found to offset one another, resulting in a reduced global warming of ∼0.5 K per Wm−2, which was about 20% less than the response to a doubling of CO2 (Stjern et al., 2017). Over Asia, the increase in BC was found to produce a surface cooling due to the strong reduction in surface heating, generally similar to our results shown in Figure 6. However, on a sub-regional scale over Asia (Figure 6I), the increase in BC produced a surface cooling over the large region in South Asia and East Asia with intense BC emissions, whereas there is a strong surface heating over mountainous regions in the Himalayan–Tibetan Plateau with less BC loadings.
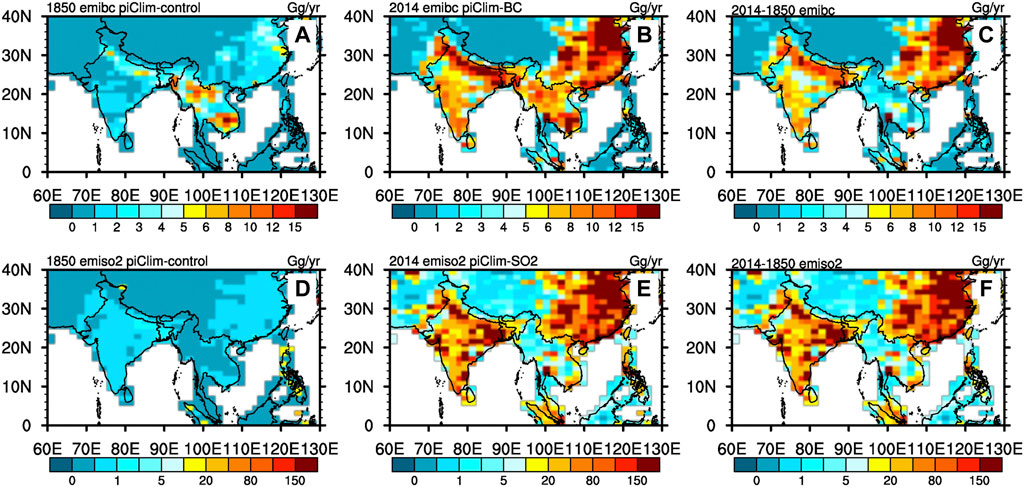
FIGURE 5. Aerosol emissions and their evolution over Asia: Black carbon (BC) and sulfur dioxide (SO2) emissions (in Gg per year), respectively, over Asia for 1850 (A,D), 2014 (B,E), and their respective absolute differences (C,F).
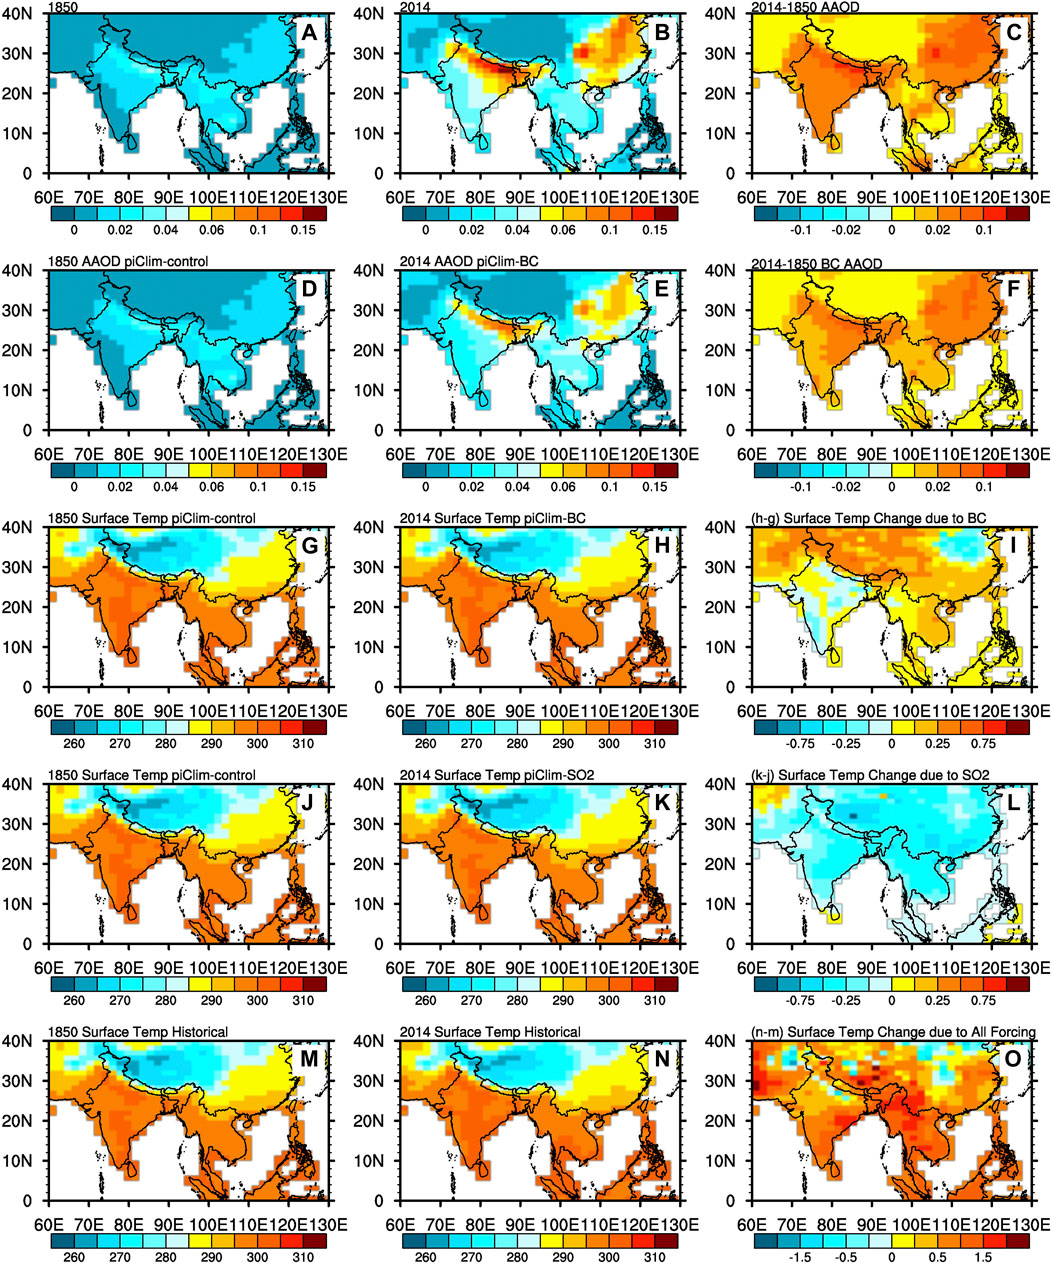
FIGURE 6. Aerosol absorption and temperature changes over Asia from model simulations: Absorption AOD in (A) 1850, (B) 2014, and its difference (C). Black carbon (BC) AAOD in (D) 1850, (E) 2014, and (F) the difference between 2014 and 1850. Surface temperatures simulated by UKESM1 due to BC, SO2, and all species forcing in 1850 [control, (G,J,M)] and in 2014 (H,K,N), respectively. The surface temperature changes in response to the changes (increases) in BC, SO2, and all forcing [includes transient emissions of aerosols and greenhouse gases (GHGs) and natural variabilities] between 1850 and 2014 are drawn in (I,L,O), respectively.
The climate benefits due to reduction in BC will generally depend strongly on the precipitation and regional transport. The precipitation over Asia is found to increase with an increase in BC aerosols and decrease with an increase in sulfate aerosols (Figure 7). The changes in precipitation reported in the current study are consistent with earlier studies (Menon et al., 2002; Stjern et al., 2017). Absorbing aerosols (BC) warm the atmosphere, thereby altering the regional atmospheric stability and vertical motions, in turn affecting the large-scale circulation and hydrological cycle (Menon et al., 2002). On the other hand, the scattering aerosols (sulfate) reduce precipitation (Figure 7) since they cause global cooling at the surface (Menon et al., 2002). The precipitation increase due to an increase in BC emissions varied significantly among different climate models and was found to be small (Stjern et al., 2017), thereby suggesting the challenges involved in delineating the precipitation changes due to changes in BC emissions. It should be cautioned that the model simulations are performed using fixed SSTs. The changes in precipitation depend strongly on initial conditions, natural variability in sea ice extent, circulation patterns, and cloud changes. While in general, a reduction in BC results in less atmospheric warming (as shown here), with implications for atmospheric stability, the hydrological cycle, and precipitation, a separate analysis focusing on the monsoon season may be needed to decipher the climate benefit and impact during the monsoon due to BC reduction, which is beyond the scope of the study, but would be worth investigating in follow-up studies. Furthermore, it should be noted that actual sources of BC also emit a mix of many different short-lived pollutants (e.g., OC, NOx, and SO2) as well as CO2. So, the reduced warming due to reductions of BC emissions will generally be partly masked by the impacts of co-emitted aerosol precursors.
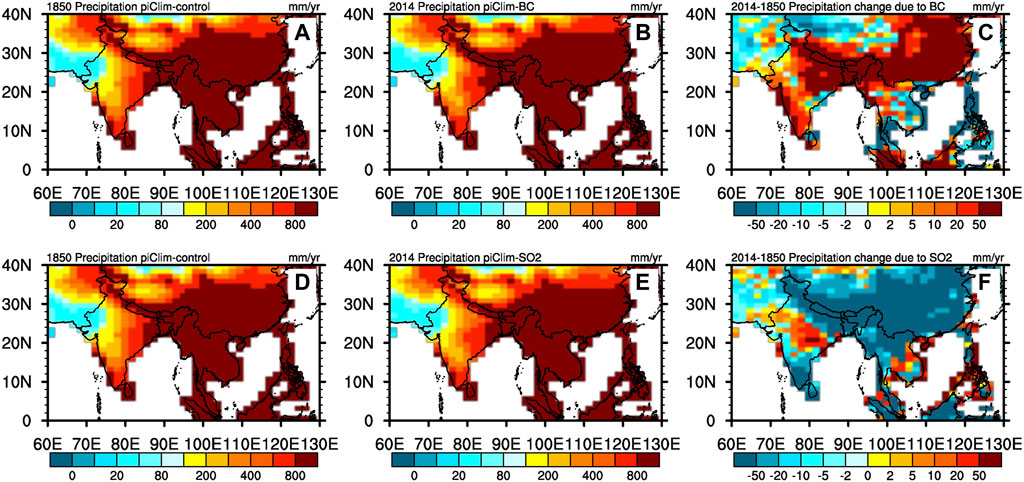
FIGURE 7. Precipitation changes due to an increase in aerosols over Asia: (A,D) precipitation (mm/yr) in 1850 (control). Precipitation in 2014 due to BC aerosols (B) and SO2 (E). The changes in precipitation (mm/yr) in response to the changes (increases) in BC and SO2 emissions between 1850 and 2014 are drawn in (C) and (F), respectively.
4 Conclusion
During the last two decades, East and South Asia were the most significant regional contributors to the global increases in anthropogenic emissions of air pollutants, largely driven by increasing levels of energy consumption using inefficient and/or ill-regulated technologies, though partly offset in recent years by improvements in emission controls. We have shown that the atmospheric heating rate (HR) due to aerosols has decreased over South and East Asia during the last two decades (Figure 3) due to the decrease in BC AAOD. The HR decreases more strongly over East Asia than South Asia, due to the differences in the relative rates of decrease in scattering aerosols (e.g., sulfate) and absorbing aerosols (mainly BC). These variations observed in the in situ AAOD measurements over the two aerosol hotspot regions (Kanpur and Beijing) are compatible with the satellite observations of regional changes in AAOD and AOD over South and East Asia (Figure 4). The HR decreases by ∼45% between 2002 and 2017 over East Asia, four times more than that of South Asia. These trends in the aerosol content and composition over South and East Asia clearly show for the first time that cleaner energy transitions are already resulting in a reduced regional atmospheric heating rate due to decreases in emissions of light-absorbing BC aerosols.
Nevertheless, the annual-mean HR is still high: >0.5 K day−1 over East Asia and >0.7 K day−1 over South Asia (Figure 3), accounting for half or more of the lower atmospheric warming over this region (Ramanathan et al., 2007; Figure 6), and the other half being due to CO2 and other greenhouse gases. This makes clear how significant the reduction in atmospheric heating over the last decade due to reduced emissions of BC has been and indicates how this connection between energy transitions and climate impacts including precipitation (Figure 7) is important to consider in the context of further reductions of air pollutant and greenhouse gas emissions over Asia, especially through moving to cleaner production and consumption of energy and hence to addressing larger issues of sustainability such as energy, climate, air pollution, public health, and food security, in the context of national socioeconomic development goals, including sustainable development goals (SDGs).
Furthermore, these results provide an important context in the backdrop of a reduction in anthropogenic aerosol emissions due to a sudden and abrupt lockdown enforced to contain the spread of COVID-19 (Cao et al., 2021) vis-à-vis due to a gradual decrease or increase in aerosol emissions that have occurred in a phased manner as analyzed in the current study. PM2.5 was found reduced by 40% over China and India during lockdown resulting in improved air quality (Cao et al., 2021). The concentrations of atmospheric aerosols decreased due to closure of cities, restrictions on vehicular movement, shutdown of industries, factories, and restaurants (Cao et al., 2021) leading to a reduction in BC-related emissions due to an decrease in emissions from cooking and gas burning; however, the reduction in secondary aerosol species was much smaller in China (Sun et al., 2020). This is important since it has been shown that secondary organic aerosols, which comprise up to 70% of the aerosol concentration in metropolitan areas, have been increasing over China (Huang et al., 2014). The decreases in aerosol emissions such as SO2 and BC can change the proportion of secondary organic aerosols, which are scattering in nature, and can lead to a higher SSA (Ramachandran et al., 2020a). The COVID-19 pandemic significantly affected global energy systems and usage (Cheshmehzangi, 2020; Bertram et al., 2021). The CO2 emissions from the power sector declined noticeably due to two causes—1) the economic downturn due to COVID-19 and the associated reduction of demand for electricity and 2) the decrease in carbon intensity due to a decrease in coal generation (Bertram et al., 2021). The impacts of COVID-19 on household energy use were assessed in six sectors—transportation for commuting and leisure, cooking, entertainment, heating and cooling, lighting, and the other revealed long-term, high impact effects as short-term insignificant impacts (Cheshmehzangi, 2020). For example, it was noticed that the impacts on transportation was long-term and was two-fold—there was a significant increase in private transportation for commuting and leisure and a noticeable decline in using the public transportation (Cheshmehzangi, 2020). In contrast, the impact on energy consumption related to household cooking was short-term and deemed temporary as it is expected to reverse after the lockdown period (Cheshmehzangi, 2020). Therefore, a cohesive approach on air quality and climate change is recommended for obtaining better societal benefits (Bertram et al., 2021). This approach is considered crucial in particular to BC, focus of the current study, which is emitted from a mixture of emissions from burning of fossil fuels, biomass, and biofuels (emitted from transportation and industrial and domestic activities). BC emissions can be reduced by improving the energy efficiency of combustion technology which in turn will also lead to a reduction in CO2, thereby leading to a win-win situation for air quality and climate (von Schneidemesser et al., 2017).
It is well known that significant interdependencies exist between short-lived climate forcers (SLCFs) and long-term climate change. The air quality and climate impacts of SLCFs depend on the energy usage, associated changes in emissions, and the atmosphere, into which they are emitted as changes in meteorological conditions can change the impacts (Isaksen et al., 2009). Furthermore, changes in SLCFs due to COVID-19 can also impact vegetation via changes in air quality (Collins et al., 2010), nutrient deposition (Mahowald, 2011), or photosynthetic active radiation (Mercado et al., 2009). It will be crucial to decipher and delineate the environmental, health, and climate impacts due to near-, short-, and long-term changes in aerosols (arising out of sudden reduction in aerosols due to COVID-19 pandemic) versus the longer-term changes/trends over decades in aerosols on precipitation and the hydrological cycle, especially over Asia due to the existence of an aerosol dipole. The findings will be crucial for climate model simulations to obtain a better understanding of the future climate impacts (near-, short-, and long-term) and delineate the effects that might arise due to reductions in scattering and absorbing aerosols as the respective radiative effects on the atmosphere and their impacts on clouds and climate are quite different. It is opined that the developments on energy and power sectors post COVID-19 crisis will be strongly impacted by the policy choices (Bertram et al., 2021) on short- and long-time scales. These results can also help in evolving better energy transitions that will be helpful to counter global warming and climate change. Such an analysis connecting the trends in energy transitions and aerosol absorption leading to aerosol impact on climate, unavailable so far, thus, is crucial for simulating the impacts due to aerosols over Asia which is quite uncertain (Krishnan et al., 2019; Samset et al., 2019).
Data Availability Statement
Publicly available datasets were analysed in this study. These data can be found here: https://www.iea.org/countries/, https://data.worldbank.org, http://www.nies.go.jp/REAS/index.html#data%20sets, https://aeronet.gsfc.nasa.gov/, https://giovanni.gsfc.nasa.gov/giovanni/, and https://esgf-index1.ceda.ac.uk/search/cmip6-ceda/.
Author Contributions
SR and MR designed the study in consultation MGL. SR and RC performed the analysis. SR wrote the paper. All the authors reviewed and edited the paper.
Conflict of Interest
The authors declare that the research was conducted in the absence of any commercial or financial relationships that could be construed as a potential conflict of interest.
Publisher’s Note
All claims expressed in this article are solely those of the authors and do not necessarily represent those of their affiliated organizations, or those of the publisher, the editors, and the reviewers. Any product that may be evaluated in this article, or claim that may be made by its manufacturer, is not guaranteed or endorsed by the publisher.
Acknowledgments
We thank the principal investigators for their efforts in establishing and maintaining the Kanpur and Beijing AERONET sites (https://aeronet.gsfc.nasa.gov/), the data of which are used in the study. This work was performed when SR was a Senior Fellow at IASS on a sabbatical from the Physical Research Laboratory, India. Presently, SR is an Affiliate Scholar of IASS. We are grateful to the German Federal Ministry for Education and Research (BMBF) and the Brandenburg State Ministry for Science, Research and Culture (MWFK) for funding the work of IASS. RC acknowledges the funding support by DFG (project number: 637230). The annual average of MODIS Terra version 6.1 monthly combined dark target and deep blue AOD data at 0.55 µm for land and ocean at 1o resolution and OMI OMAERUVd v003 level 2 AAOD at 0.388 µm at 0.5o resolution are downloaded (Figure 4) from https://giovanni.gsfc.nasa.gov/giovanni/. We also acknowledge the OMI and NASA mission scientists and associated NASA personnel for the production of the data used in Figure 4. All data from the UKESM model used in this manuscript are available on the Earth System Grid Federation (ESGF) website and can be downloaded from the website (https://esgf-index1.ceda.ac.uk/search/cmip6-ceda/). We acknowledge the World Climate Research Programme, which through its working group on coupled modeling, coordinated and promoted Coupled Model Intercomparison Project Phase 6 (CMIP6). We thank the climate modeling groups for producing and making available their model output, the ESGF for archiving the data and providing access, and the multiple funding agencies that support CMIP6 and ESGF.
References
Archibald, A. T., O'Connor, F. M., Abraham, N. L., Archer-Nicholls, S., Chipperfield, M. P., Dalvi, M., et al. (2020). Description and Evaluation of the UKCA Stratosphere-Troposphere Chemistry Scheme (StratTrop Vn 1.0) Implemented in UKESM1. Geosci. Model. Dev. 13, 1223–1266. doi:10.5194/gmd-13-1223-2020
Barnett, T. P., Adam, J. C., and Lettenmaier, D. P. (2005). Potential Impacts of a Warming Climate on Water Availability in Snow-Dominated Regions. Nature 438, 303–309. doi:10.1038/nature04141
Bergstrom, R. W., Pilewskie, P., Russell, P. B., Redemann, J., Bond, T. C., Quinn, P. K., et al. (2007). Spectral Absorption Properties of Atmospheric Aerosols. Atmos. Chem. Phys. 7, 5937–5943. doi:10.5194/acp-7-5937-2007
Bertram, C., Luderer, G., Creutzig, F., Bauer, N., Ueckerdt, F., Malik, A., et al. (2021). COVID-19-induced Low Power Demand and Market Forces Starkly Reduce CO2 Emissions. Nat. Clim. Chang. 11, 193–196. doi:10.1038/s41558-021-00987-x
Cao, Y., Shao, L., Jones, T., Oliveira, M. L. S., Ge, S., Feng, X., et al. (2021). Multiple Relationships between Aerosol and COVID-19: A Framework for Global Studies. Gondwana Res. 93, 243–251. doi:10.1016/j.gr.2021.02.002
Cao, X., Huo, S., Zhang, H., Zhao, H., He, Z., Ma, C., et al. (2022). Polycyclic Aromatic Hydrocarbons in China: Will Decoupling of Their Emissions and Socioeconomic Growth Emerge? Earth Future 10, e2021EF002360. doi:10.1029/2021EF002360
Cheshmehzangi, A. (2020). COVID-19 and Household Energy Implications: what Are the Main Impacts on Energy Use? Heliyon 6, e05202. doi:10.1016/j.heliyon.2020.e05202
Chung, C. E., Ramanathan, V., and Decremer, D. (2012). Observationally Constrained Estimates of Carbonaceous Aerosol Radiative Forcing. Proc. Natl. Acad. Sci. 109, 11624–11629. doi:10.1073/pnas.1203707109
Collins, W. J., Sitch, S., and Boucher, O. (2010). How Vegetation Impacts Affect Climate Metrics for Ozone Precursors. J. Geophys. Res. 115, D23308,. doi:10.1029/2010JD014187
Collins, W. J., Lamarque, J.-F., Schulz, M., Boucher, O., Eyring, V., Hegglin, M. I., et al. (2017). AerChemMIP: Quantifying the Effects of Chemistry and Aerosols in CMIP6. Geosci. Model. Dev. 10, 585–607. doi:10.5194/gmd-10-585-2017
Dubovik, O., Smirnov, A., Holben, B. N., King, M. D., Kaufman, Y. J., Eck, T. F., et al. (2000). Accuracy Assessments of Aerosol Optical Properties Retrieved from Aerosol Robotic Network (AERONET) Sun and Sky Radiance Measurements. J. Geophys. Res. 105, 9791–9806. doi:10.1029/2000jd900040
Eck, T. F., Holben, B. N., Dubovik, O., Smirnov, A., Goloub, P., Chen, H. B., et al. (2005). Columnar Aerosol Optical Properties at AERONET Sites in central Eastern Asia and Aerosol Transport to the Tropical Mid-Pacific. J. Geophys. Res. 110, D06202. doi:10.1029/2004JD005274
Eck, T. F., Holben, B. N., Sinyuk, A., Pinker, R. T., Goloub, P., Chen, H., et al. (2010). Climatological Aspects of the Optical Properties of fine/coarse Mode Aerosol Mixtures. J. Geophys. Res. 115, D19205. doi:10.1029/2010JD014002
Eyring, V., Bony, S., Meehl, G. A., Senior, C. A., Stevens, B., Stouffer, R. J., et al. (2016). Overview of the Coupled Model Intercomparison Project Phase 6 (CMIP6) Experimental Design and Organization. Geosci. Model. Dev. 9, 1937–1958. doi:10.5194/gmd-9-1937-2016
Forster, P. M., Richardson, T., Maycock, A. C., Smith, C. J., Samset, B. H., Myhre, G., et al. (2016). Recommendations for Diagnosing Effective Radiative Forcing from Climate Models for CMIP6. J. Geophys. Res. Atmos. 121, 12460–12475. doi:10.1002/2016JD025320
García, O. E., Díaz, A. M., Expósito, F. J., Díaz, J. P., Dubovik, O., Dubuisson, P., et al. (2008). Validation of AERONET Estimates of Atmospheric Solar Fluxes and Aerosol Radiative Forcing by Ground-Based Broadband Measurements. J. Geophys. Res. 113, D21207. doi:10.1029/2008JD010211
García, O. E., Díaz, J. P., Expósito, F. J., Díaz, A. M., Dubovik, O., Derimian, Y., et al. (2012). Shortwave Radiative Forcing and Efficiency of Key Aerosol Types Using AERONET Data. Atmos. Chem. Phys. 12, 5129–5145. doi:10.5194/acp-12-5129-2012
Hoegh-Guldberg, O., Jacob, D., Taylor, M., Bindi, M., Brown, S., Camilloni, I., et al. (2018). “Impacts of 1.5ºC Global Warming on Natural and Human Systems,” in Global Warming of 1.5°C. An IPCC Special Report on the Impacts of Global Warming of 1.5°C above Pre-industrial Levels and Related Global Greenhouse Gas Emission Pathways, in the Context of Strengthening the Global Response to the Threat of Climate Change, Sustainable Development, and Efforts to Eradicate Poverty. Editors V. Masson-Delmotte, P. Zhai, H. O. Pörtner, D. Roberts, J. Skea, P. R. Shuklaet al. (New York, NY: Cambridge University Press), 175–312.
Holben, B. N., Tanré, D., Smirnov, A., Eck, T. F., Slutsker, I., Abuhassan, N., et al. (2001). An Emerging Ground-Based Aerosol Climatology: Aerosol Optical Depth from AERONET. J. Geophys. Res. 106, 12067–12097. doi:10.1029/2001jd900014
Huang, R.-J., Zhang, Y., Bozzetti, C., Ho, K.-F., Cao, J.-J., Han, Y., et al. (2014). High Secondary Aerosol Contribution to Particulate Pollution during Haze Events in China. Nature 514, 218–222. doi:10.1038/nature13774
IEA (2016). World Energy Outlook 2016. Paris: IEA. Available at: https://www.iea.org/reports/world-energy-outlook-2016 (Accessed November 15, 2019).
IPCC (2021). “Summary for Policymakers,” in Climate Change 2021: The Physical Science Basis. Contribution of Working Group I to the Sixth Assessment Report of the Intergovernmental Panel on Climate Change. Editors V. Masson-Delmotte, P. Zhai, A. Pirani, S. L. Connors, C. Péan, S. Bergeret al. (New York, NY: Cambridge University Press). In Press.
Isaksen, I. S. A., Granier, C., Myhre, G., Berntsen, T. K., Dalsøren, S. B., Gauss, M., et al. (2009). Atmospheric Composition Change: Climate-Chemistry Interactions. Atmos. Environ. 43, 5138–5192. doi:10.1016/j.atmosenv.2009.08.003
Kanaya, Y., Yamaji, K., Miyakawa, T., Taketani, F., Zhu, C., Choi, Y., et al. (2020). Rapid Reduction in Black Carbon Emissions from China: Evidence from 2009-2019 Observations on Fukue Island, Japan. Atmos. Chem. Phys. 20, 6339–6356. doi:10.5194/acp-20-6339-2020
Krishnan, R., Shrestha, A. B., Ren, G., Rajbhandari, R., Saeed, S., Sanjay, J., et al. (2019). “Unravelling Climate Change in the Hindu Kush Himalaya: Rapid Warming in the Mountains and Increasing Extremes,” in The Hindu Kush Himalaya Assessment. Editors P. Wester, A. Mishra, A. Mukherji, and A. B. Shrestha (Cham, Switzerland: Springer Nature), 57–97. doi:10.1007/978-3-319-92288-1_3
Kurokawa, J., and Ohara, T. (2020). Long-term Historical Trends in Air Pollutant Emissions in Asia: Regional Emission Inventory in ASia (REAS) Version 3. Atmos. Chem. Phys. 20, 12761–12793. doi:10.5194/acp-20-12761-2020
Levy, R. C., Mattoo, S., Munchak, L. A., Remer, L. A., Sayer, A. M., Patadia, F., et al. (2013). The Collection 6 MODIS Aerosol Products over Land and Ocean. Atmos. Meas. Tech. 6, 2989–3034. doi:10.5194/amt-6-2989-2013
Li, C., Bosch, C., Kang, S., Andersson, A., Chen, P., Zhang, Q., et al. (2016). Sources of Black Carbon to the Himalayan-Tibetan Plateau Glaciers. Nat. Commun. 7, 12574. doi:10.1038/ncomms12574
Li, C., McLinden, C., Fioletov, V., Krotkov, N., Carn, S., Joiner, J., et al. (2017). India Is Overtaking China as the World's Largest Emitter of Anthropogenic Sulfur Dioxide. Sci. Rep. 7, 14304. doi:10.1038/s41598-017-14639-8
Liu, X., and Chen, B. (2000). Climatic Warming in the Tibetan Plateau during Recent Decades. Int. J. Climatol. 20, 1729–1742. doi:10.1002/1097-0088(20001130)20:14<1729::aid-joc556>3.0.co;2-y
Mahowald, N. (2011). Aerosol Indirect Effect on Biogeochemical Cycles and Climate. Science 334, 794–796. doi:10.1126/science.1207374
Mallet, M., Dubovik, O., Nabat, P., Dulac, F., Kahn, R., Sciare, J., et al. (2013). Absorption Properties of Mediterranean Aerosols Obtained from Multi-Year Ground-Based Remote Sensing Observations. Atmos. Chem. Phys. 13, 9195–9210. doi:10.5194/acp-13-9195-2013
Maurer, J. M., Schaefer, J. M., Rupper, S., and Corley, A. (2019). Acceleration of Ice Loss across the Himalayas over the Past 40 Years. Sci. Adv. 5, eaav7266. doi:10.1126/sciadv.aav7266
Meng, J., Yang, H., Yi, K., Liu, J., Guan, D., Liu, Z., et al. (2019). The Slowdown in Global Air-Pollutant Emission Growth and Driving Factors. One Earth 1, 136–148. doi:10.1016/j.oneear.2019.08.013
Menon, S., Hansen, J., Nazarenko, L., and Luo, Y. (2002). Climate Effects of Black Carbon Aerosols in China and India. Science 297, 2250–2253. doi:10.1126/science.1075159
Mercado, L. M., Bellouin, N., Sitch, S., Boucher, O., Huntingford, C., Wild, M., et al. (2009). Impact of Changes in Diffuse Radiation on the Global Land Carbon Sink. Nature 458, 1014–1017. doi:10.1038/nature07949
Mulcahy, J. P., Johnson, C., Jones, C. G., Povey, A. C., Scott, C. E., Sellar, A., et al. (2020). Description and Evaluation of Aerosol in UKESM1 and HadGEM3-GC3.1 CMIP6 Historical Simulations. Geosci. Model. Dev. 13, 6383–6423. doi:10.5194-gmd-13-6383-202010.5194/gmd-13-6383-2020
OMI DUG (2012). NASA. Available at: https://docserver.gesdisc.eosdis.nasa.gov/public/project/OMI/README.OMI_DUG.pdf (Accessed July 15, 2020).
Ramachandran, S., and Rupakheti, M. (2022). Trends in Physical, Optical and Chemical Columnar Aerosol Characteristics and Radiative Effects over South and East Asia: Satellite and Ground-Based Observations. Gondwana Res. doi:10.1016/j.gr.2021.09
Ramachandran, S., Rupakheti, M., and Lawrence, M. G. (2020a). Aerosol-induced Atmospheric Heating Rate Decreases over South and East Asia as a Result of Changing Content and Composition. Sci. Rep. 10, 20091. doi:10.1038/s41598-020-76936-z
Ramachandran, S., Rupakheti, M., and Lawrence, M. G. (2020b). Black Carbon Dominates the Aerosol Absorption over the Indo-Gangetic Plain and the Himalayan Foothills. Environ. Int. 142, 105814. doi:10.1016/j.envint.2020.105814
Ramachandran, S., Rupakheti, M., and Cherian, R. (2022). Insights into Recent Aerosol Trends over Asia from Observations and CMIP6 Simulations. Sci. Total Environ. 807, 150756. doi:10.1016/j.scitotenv.2021.150756
Ramanathan, V., and Carmichael, G. (2008). Global and Regional Climate Changes Due to Black Carbon. Nat. Geosci. 1, 221–227. doi:10.1038/ngeo156
Ramanathan, V., Ramana, M. V., Roberts, G., Kim, D., Corrigan, C., Chung, C., et al. (2007). Warming Trends in Asia Amplified by Brown Cloud Solar Absorption. Nature 448, 575–578. doi:10.1038/nature06019
Russell, P. B., Bergstrom, R. W., Shinozuka, Y., Clarke, A. D., DeCarlo, P. F., Jimenez, J. L., et al. (2010). Absorption Angstrom Exponent in AERONET and Related Data as an Indicator of Aerosol Composition. Atmos. Chem. Phys. 10, 1155–1169. doi:10.5194/acp-10-1155-2010
Sadavarte, P., and Venkataraman, C. (2014). Trends in Multi-Pollutant Emissions from a Technology-Linked Inventory for India: I. Industry and Transport Sectors. Atmos. Environ. 99, 353–364. doi:10.1016/j.atmosenv.2014.09.081
Samset, B. H., Lund, M. T., Bollasina, M., Myhre, G., and Wilcox, L. (2019). Emerging Asian Aerosol Patterns. Nat. Geosci. 12, 582–584. doi:10.1038/s41561-019-0424-5
Shindell, D., Kuylenstierna, J. C. I., Vignati, E., van Dingenen, R., Amann, M., Klimont, Z., et al. (2012). Simultaneously Mitigating Near-Term Climate Change and Improving Human Health and Food Security. Science 335, 183–189. doi:10.1126/science.1210026
Shindell, D. T., Lamarque, J.-F., Schulz, M., Flanner, M., Jiao, C., Chin, M., et al. (2013). Radiative Forcing in the ACCMIP Historical and Future Climate Simulations. Atmos. Chem. Phys. 13, 2939–2974. doi:10.5194/acp-13-2939-2013
Stjern, C. W., Samset, B. H., Myhre, G., Forster, P. M., Hodnebrog, Ø., Andrews, T., et al. (2017). Rapid Adjustments Cause Weak Surface Temperature Response to Increased Black Carbon Concentrations. J. Geophys. Res. Atmos. 122, 11462–11481. doi:10.1002/2017JD027326
Sun, Y., Lei, L., Zhou, W., Chen, C., He, Y., Sun, J., et al. (2020). A Chemical Cocktail during the COVID-19 Outbreak in Beijing, China: Insights from Six-Year Aerosol Particle Composition Measurements during the Chinese New Year holiday. Sci. Total Environ. 742, 140739. doi:10.1016/j.scitotenv.2020.140739
Sun, J., Wang, Z., Zhou, W., Xie, C., Wu, C., Chen, C., et al. (2022). Measurement Report: Long-Term Changes in Black Carbon and Aerosol Optical Properties from 2012 to 2020 in Beijing, China. Atmos. Chem. Phys. 22, 561–575. doi:10.5194/acp-22-561-2022
Thompson, L. G., Mosley-Thompson, E., Davis, M. E., Lin, P.-N., Henderson, K., and Mashiotta, T. A. (2003). Tropical Glacier and Ice Core Evidence of Climate Change on Annual to Millennial Time Scales. Clim. Change 59, 137–155. doi:10.1007/978-94-015-1252-7_8
Thornhill, G. D., Collins, W. J., Kramer, R. J., Olivié, D., Skeie, R. B., O'Connor, F. M., et al. (2021). Effective Radiative Forcing from Emissions of Reactive Gases and Aerosols - a Multi-Model Comparison. Atmos. Chem. Phys. 21, 853–874. doi:10.5194/acp-21-853-2021
UNEP (2019). Air Pollution in Asia and the Pacific: Science-Based Solutions. Bangkok, Thailand: United Nations Environment Programme-UNEP, 250.
UNEP-WMO (2011). Integrated Assessment of Black Carbon and Tropospheric Ozone. Nairobi, Kenya: United Nations Environment Programme-UNEP and World Meteorological Organization-WMO, 303.
von Schneidemesser, E., Mar, K. A., and Saar, D. (2017). Black Carbon in Europe-Targeting an Air Pollutant and Climate Forcer. IASS Policy Brief 2Potsdam, Germany, 14.
Wang, Z., Lin, L., Xu, Y., Che, H., Zhang, X., Dong, W., et al. (2021). Incorrect Asian Aerosols Affecting the Attribution and Projection of Regional Climate Change in CMIP6 Models. Npj Clim. Atmos. Sci. 4, 2. doi:10.1038/s41612-020-00159-2
Xu, Y., Ramanathan, V., and Washington, W. M. (2016). Observed High-Altitude Warming and Snow Cover Retreat over Tibet and the Himalayas Enhanced by Black Carbon Aerosols. Atmos. Chem. Phys. 16, 1303–1315. doi:10.5194/acp-16-1303-2016
Zhang, Q., Zheng, Y., Tong, D., Shao, M., Wang, S., Zhang, Y., et al. (2019). Drivers of Improved PM2.5 Air Quality in China from 2013 to 2017. Proc. Natl. Acad. Sci. U S A. 116, 24463–24469. doi:10.1073/pnas.1907956116
Keywords: cleaner energy transitions, Asia, air pollution, black carbon, climate benefits
Citation: Ramachandran S, Rupakheti M, Cherian R and Lawrence MG (2022) Climate Benefits of Cleaner Energy Transitions in East and South Asia Through Black Carbon Reduction. Front. Environ. Sci. 10:842319. doi: 10.3389/fenvs.2022.842319
Received: 23 December 2021; Accepted: 14 February 2022;
Published: 09 March 2022.
Edited by:
Pasquale Sellitto, UMR7583 Laboratoire inter-universitaire des systèmes atmosphèriques (LISA), FranceReviewed by:
Dipesh Rupakheti, Nanjing University of Information Science and Technology, ChinaJian Sun, University Corporation for Atmospheric Research (UCAR), United States
Copyright © 2022 Ramachandran, Rupakheti, Cherian and Lawrence. This is an open-access article distributed under the terms of the Creative Commons Attribution License (CC BY). The use, distribution or reproduction in other forums is permitted, provided the original author(s) and the copyright owner(s) are credited and that the original publication in this journal is cited, in accordance with accepted academic practice. No use, distribution or reproduction is permitted which does not comply with these terms.
*Correspondence: S. Ramachandran, cmFtQHBybC5yZXMuaW4=