 Wen Xuezhou1
 Rana Yassir Hussain
 Haroon Hussain
 Muhammad Fareed
94% of researchers rate our articles as excellent or good
Learn more about the work of our research integrity team to safeguard the quality of each article we publish.
Find out more
HYPOTHESIS AND THEORY article
Front. Environ. Sci., 24 February 2022
Sec. Environmental Economics and Management
Volume 10 - 2022 | https://doi.org/10.3389/fenvs.2022.841380
This article is part of the Research TopicFinancial and Trade Globalization, Greener Technologies and Energy TransitionView all 46 articles
Business sustainability is compromised with an increase in insolvency risk. Firm growth is desirable, but it brings an associated bundle of high risks. We decomposed firm growth into internal and external growth and studied its impact on insolvency risk using a panel data set of 284 listed non-financial firms in Pakistan from 2013 to 2017. This study used the hierarchical multiple regression approach through panel corrected standard error (PCSE) and feasible generalized least squares estimators to test the proposed relationships. The results reveal that the leverage maturity ratio mediated the relationship between firm growth and insolvency risk. Moreover, we also collected fresh evidence on the moderating role of potential fixed collaterals that negatively moderated the relationship between leverage maturity and insolvency risk. It points toward the accumulation of non-productive fixed assets that create a burden for firms instead of helping them avail of favorable loan opportunities. The findings of this research suggests that fund managers should use more long term debt to tackle insolvency risk in highly volatile markets. Inclusion of assets that serve as better collaterals should be made part of the asset structure.
Business sustainability is achievable by avoiding high financial distress (Zabolotnyy & Wasilewski, 2019). Firm failures are at their peak in firms seeking rapid growth (Lukason & Laitinen, 2016), and continuous rise in insolvency risk is also one of the reasons that cause frequent business failures. Insolvency risk refers to the times when firms find honoring their financial obligations difficult. The growth–insolvency risk nexus puzzle remains a less explored area, specifically in the developing world. In addition, this relationship seems ambiguous in previous studies as growth is proved to be a positive (Patel et al., 2018) and a negative predictor of risk (Loderer & Waelchli, 2015). The question of whether growth is a risk exhibitor, or a risk inhibitor requires further inquiry. The majority of previous studies discussed growth as a one-dimensional concept and ignored its endogenous and exogenous aspects. In reality, growth can be internal, which mainly deals with internal factors, such as growth in firm assets or profitability. It may also be external, which can be regarded as growth based on some market phenomenon, such as sales or market price of equity. This research addresses this issue and discusses the role of internal firm growth (IFG) and external firm growth (EFG) separately. Further, this research is based on the recent claims made by Xuezhou et al. (2020a) that consider the relationship between growth and insolvency risk as indirect because the riskiness of growth depends on the leverage arrangements made by a firm. If a conservative financing approach is adopted to finance the growth potentials, then the related insolvency risk can be controlled. Long-term financing is thought to be less risky as compared with short-term financing (Wang & Chiu, 2019). Firms in high tax brackets tend to utilize more debt, but if debt financing is relevant, then they prefer long-term financing to avoid high insolvency risk. It reflects that firms employ leverage maturity structure as a tool to control insolvency as they wish to pursue secure growth potentials (Xuezhou et al., 2020a).
Institutional external financing requires firm assets as collateral for loan approvals. Information asymmetry theory claims that firms with a high percentage of fixed assets are in a better position to negotiate for their borrowings (Yu and Zhu, 2018). They also have the potential to acquire attractive loan facilities at reasonable terms. Xuezhou et al. (2020b) researched similar lines to find the moderating effect of tangible assets. However, in our opinion, all the tangible assets cannot be classified as fixed collaterals, but they do have the potential to act as fixed collaterals. Unlike Hussain et al. (2021), this research used the terminology potential fixed collaterals (PFCs) that, in our opinion, can moderate the mediated relationship between firm growth and insolvency risk. This proposition is also based on the maturity-matching approach, which refers that debt maturity should correspond to asset maturity. Productive fixed assets not only serve as PFCs but also generate revenue for debt servicing and can also be sold off to redeem the loans at the time of maturity. Maturity mismatches can also create runs for the firm. Nonetheless, instead of creating avenues for loan redemptions, non-productive assets can aggravate the non-payments on corporate loans. The following Table 1 reports a few updated studies regarding the variability of empirical evidence in this domain confirming author claims.
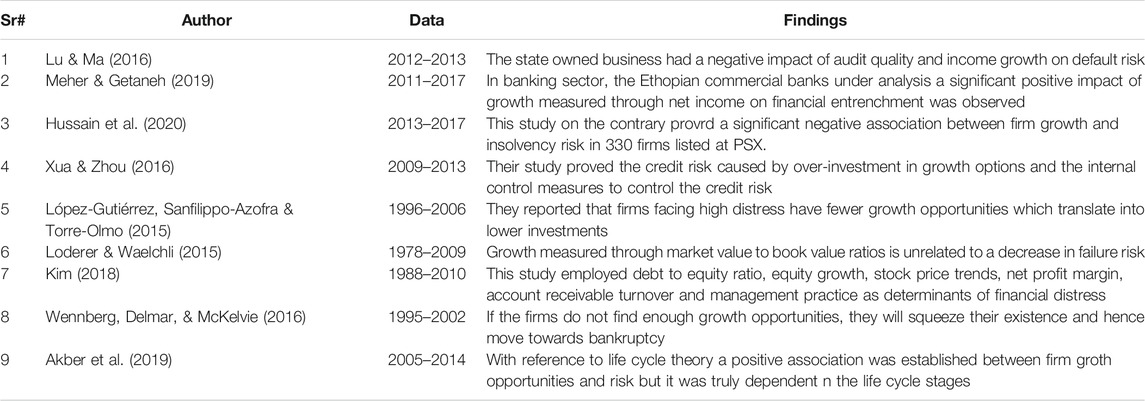
TABLE 1. Evidence on heterogenous impact of firm growth on insolvency risk.
We took Pakistan-based non-financial firms as our study sample due to multiple reasons. One of the reasons for selecting non-financial firms is that financial firms are protected by various provisions and guarantees. Conversely, non-financial firms do not have such threads woven around them. The World Bank (2016) reported that the non-performing loan (NPL) ratio is 11.3% in Pakistan, which much high in comparison with its closest neighbor India, is having this ratio equal to 7.6% during the same period. In Europe, this ratio is 5.4%, and it stood at just 1.5% in the US. The cost of borrowing is also high in Pakistan as the Interest rate stood at 8.32% in this period. Similarly, the loan extension ratio to the private sector is only 15.4% of GDP, and in India, this ratio equals 52.2%. Furthermore, the reports of the World Bank on the ease of doing business for years 2017, 2018, and 2019 indicated the ranks of 144, 147, and 136, respectively for Pakistan. It lags behind Sri Lanka (110, 111, and 100) and India (130, 100, and 77) for the same years. These figures indicate the financial and business constraints faced by the business loan applicants in Pakistan. Relying on this data-based evidence, a sample of Pakistani firms constitutes a perfect case to study in our framework.
This study contributes to the existing literature in several ways. First, it tends to capture the mediating role of debt maturity on the relationship between internal/external growth and insolvency risk. There is insufficient evidence that distinguishes between internal and external growth in a single framework. Second, it discusses the moderating role of PFCs on the relationship between leverage maturity and insolvency risk. Third, it tests all the proposed relationships in an underdeveloped economy. In underdeveloped economies, the business growth faces obstacles, specifically with reference to the availability of favorable loan opportunities (ICMAP, 2015). Finally, the past literature is overwhelmed with the traditional mediation and moderation approaches, such as Baron & Kenny (1986) and Preacher & Hayes (2008), but this study adopts a relatively much newer approach to mediated moderation analysis. It uses a hierarchical multiple regression approach (HMRA) that not only encapsulates the previous approaches, but also proposes a more comprehensive eight-step process that presents a more in-depth analysis of the mediation and moderation mechanisms. The rest of this paper is structured as follows: Section 3 deals with the detailed literature and proposes the relevant hypotheses; Section 4 explains the data and methods used; Section 5 reports the study results; and Section 6 presents the conclusions and policy implications.
Firm growth is a dual phenomenon as it is either endogenous or exogenous (Karpavičius and Yu, 2019). There is an abundance of research that links firm growth to insolvency risk, but very few studies differentiate the impact of the internal and external growths. This section of literature has reported the past studies that relate firm growth components individually. The internal growth is firm-specific and is more endogenous. Most of the previous literature has used several firm-specific accounting measures to gauge the internal growth of firms. As far as the external growth is concerned, it is more of a market-related phenomenon, and various studies have utilized market-based proxies to measure firm growth in such circumstances. We have reported the literature on this relationship on the basis of a similar line. The internal growth refers to the endogenous/firm-specific growth variable that does not involve the interaction of market-related proxies. Most commonly employed proxies for the measurement of internal growth opportunities include income growth, asset growth, and increase in R&D expenditures. Considerable previous research has established a relationship between internal firm growth (IFG) and insolvency risk and has used firms-specific accounting proxies as a measure of firm growth (Wennberg et al., 2016; Caporale et al., 2017). Few studies establish an inverse relationship between firm growth and risk (Cooper and Maio, 2019), and this claim proves to be true if firms are in a position to liquidate their assets in times of need. Contrarily, several researchers claim that young firms seeking high growth take aggressive risk positions (Akbar et al., 2019; Xuezhou et al., 2020b; Xia et al., 2022). Substantial focus has been given to the relationship between growth and financing choices (Lee and Lee, 2019) because the impact of growth on insolvency risk is channelized through the liquidity and adequate availability of financial resources while pursuing growth incentives. Chang et al. (2014) claimed that asset growth is a better measure of the growth opportunities of a firm as it is historic, suitable for unstable markets, and is a more endogenous proxy for the calibration of growth. In addition, a higher value of assets in place increases information symmetry that leads to better financing options lowering risk exposures (Lelland and Pyle, 1977). Choi (2017) also explained that the relationship between growth and risk is dependent on the available occupational choices of young entrepreneurs. Managers with better options will take more aggressive growth decisions and will cover the life stages more quickly. It is a sheer reality that firms that tend to grow rapidly are commonly faced with more bankruptcy risk as compared with ones that take slow and steady steps. When a comparison between small and large firms is made, the pace of growth in small firms is much higher, and they are also exposed to more risk. Large firms are mature in their operations and try to stay in business, whereas small firms are immature and tend to grow more rapidly due to having more growth potentials (Amaral, 2008). Cooper et al. (2008) tested the asset growth effect in Australian stock returns and documented its presence but likewise find no evidence to support a risk-based explanation. Additionally, Farooq et al. (2012) reported that Pakistani-listed firms have an association between asset growth and sales opportunity lost both in the pre and the post distress era, and they confirmed that operational inefficiencies in sales and asset growths contribute to financial distress. Gomes et al. (2003) demonstrated that growth options are riskier than assets-in-place as these options are “leveraged” on existing assets. Particularly, they affirmed that the association between capital spending (exercise of growth options) and subsequent returns should be negative.
Multiple studies have used growth measures based on market-related proxies, and they have also employed market-dependent accounting proxies, such as sales growth and different ratios that involve the market value of assets and/or market value of equity (MVE). We have placed these studies under the external growth umbrella. Although the presence of more growth opportunities can create value for the firm and the shareholders, but it may also enhance risk. Previous researchers have established mixed evidence on the relationship between growth and risk (Nakano and Nguyen, 2012). Furthermore, Ahmad and Azhari (2020) reported a mixed effect of the growth measured through the market-to-book ratio on risk-taking in Malaysian non-financial firms, and their results were sensitive to the divergent regression techniques employed. Faccio et al. (2016) also proved a negative impact of sales growth on risk-taking, and their results were insensitive to the methodological variations. Dang et al. (2020) controlled the impact of sales growth in their study to capture the impact of debt structure, solvency ratio, profitability, operation ability, and capital structure on financial risk. The results for sales growth proved to be insignificant in this setting. In addition, Fredrick (2018) discovered revenue growth as a negative predictor of the financial distress measured through the Altman Z score in Nigerian firms by employing panel corrected standard error (PCSE) regression. Kabir et al. (2020) used Tobin’s Q as a measure of growth potentials, and they also reported a significant impact on a unique proxy for default risk.
Ali et al. (2018) also measured growth opportunities by employing the market-to-book ratio of equity in their study, and they reported that the firms that practiced better corporate governance mechanisms can better control the default risk. Moreover, they also validated that this relationship was even stronger in firms with more growth opportunities. Loderer and Waelchli (2015) also asserted that mature firms have lesser growth opportunities and that their profits also exhibit declining trends but they have less fear of taking over risk in comparison with young firms. Additionally, they verified that immature firms pursuing growth indulge in more risk probabilities. Koh et al. (2015) extended the literature by studying the corporate restructuring and recovery options while experiencing financial distress in diverse life stages proposed by life cycle theory. They also argued that firms that used dividend reductions changed their capital structure and adopted a lesser number of strategies succeeded in recovery irrespective of the life stage they are going through.
H1: Firm growth has a significant impact on insolvency risk.
H1a: The IFG has a significant impact on insolvency risk.
H1b: The EFG has a significant impact on insolvency risk.
Firms showing growth prospects need more financing than those with fewer opportunities. Managers resort to debt financing in such situations after having exhausted their own resources (Bulan and Yan, 2010). Debt capital is also attractive because it is associated with lower costs such as costs related to IPO, brokerage, and tax benefits. Nevertheless, debts are considered riskier and can lead to bankruptcy if not properly managed but still preferred to equity, as postulated by pecking order theory. Evidence for the relationship between growth and debt is mixed and numerous studies have shown this relationship to be positive (Puspitasari and Ekaningtias, 2017; Öhman and Yazdanfar, 2017). There is also a lot of evidence showing a negative association between growth and financial leverage (Frank and Goyal, 2009; Karpavičius and Yu, 2019). Some studies have also reported a non-linear relationship between growth and external debt (Wu and Yeung, 2012). Leverage decisions also include the choice between short-term and long-term debt. Managers will decide to shrink the maturity of their bank debt if there are viable growth opportunities to solve reduced investment and asset substitution concerns (Barclay, 1995; Cuñat, 1999). These concerns are predominantly pertinent to companies that have exploited their internal resources and require external debt financing for newfangled investment ventures. According to Costa et al. (2014), signaling theory suggests that companies having sound credit positions and lucrative growth opportunities will benefit from short-term loans in such scenarios. Short-term bank debt reduces the costs of loans if equated to companies whose financial situation is deteriorating. Only financially healthy companies can offer short-term bank loans without swelling their insolvency risk (Stohs and Mauer, 1996). Johnson (2003) contended that debt maturity will create value for the company if it is ahead of the execution of its growth opportunities. Similarly, Barnea et al. (1980) affirmed that short-term debt can shrink the delinquency of the substitution of assets because the value of short-term debt is less volatile with alterations in the value of company assets. Furthermore, the more excellent elasticity of bank debt compared with the traversable loan can serve as a device to regulate the maturity of the debt (Carey and Rosen, 2001).
H2: Firm growth has a significant impact on leverage maturity.
H2a: The IFG has a significant impact on leverage maturity.
H2b: The EFG has a significant impact on leverage maturity.
Debt duration/maturity refers to the use of long-term or short-term debt in a company’s capital structure. Debt is considered risky relative to equity, but debt with shorter maturities can have an even greater impact. It needs refinancing; otherwise, as liquidity theory suggests, the business will be faced with illiquidity. Consequently, the company is exposed to the risk of refinancing in the financing of its activities. Agency theory and signaling theory also oppose this situation. However, supporters of information asymmetry advocate the use of short-term debt (Diamond, 1991). In good financial health, the company can adjust its maturity structure more quickly in the face of changes in its assets. Ideally, the business would secure long-term financing just before its financial health deteriorated. This strategy allows the company to secure financing for the longest possible continuous period without rollover problems and it also helps avoid inefficient restructuring costs. Moyen (2007) contrasted the investment policy of firms issuing short-term debt and continuously readjusting debt to that of a firm issuing but not readjusting long-term debt. This study also found that underinvestment can occur due to over-indebtedness with both models, but it is more dramatic with long-term debt models. Scherr and Hulburt (2001) use Altman’s Z-Score as default risk or liquidity risk for the empirical study of Diamond’s liquidity risk hypothesis which states that debt maturity and risk defaults are not monotonically related. In line with empirical predictions, they confirmed that the average debt maturity is lower for companies with high and low probabilities of default than for companies with medium probabilities of default. In addition, Titman and Tsyplakov (2007) examined a dynamic leverage model in the style of Leland (1994), arguing that short-term debt tends to mitigate underinvestment, but also leads to more defaults. Diamond and He (2014) also pointed out that short-term debt can lead to “future debt distress”: if debt matures before future investment decisions are made, it can also lead to lower future investments. The illiquidity of the market, coupled with the difficulty for creditors to coordinate their refinancing decisions on a company’s short-term debt, could lead to runs on financial firms (Morris and Shin, 2016). Credit risk arises due to an increase in bad loans, and these loans are a cause of worry for the banking sector of developed as well as developing countries (Khan et al., 2021). Deteriorating liquidity and rising volatility are also prompting creditors to increase the required margins on their secured business loans, which in turn could force firms to liquidate their positions in illiquid markets (Shleifer and Vishny, 2010). As Morris (1976) explains, if the asset matures too short, it may not generate enough cash flow at the maturity date to service the debt. Although this option is also available for longer durations, it is less likely and has the advantage of postponing any liquidity crisis further into the future. Debt that matures longer than the life of the asset may also be risky due to uncertainty about the source and volume of cash flows required to service the debt after retirement.
H3: Leverage maturity has a significant impact on insolvency risk.
Previous literature has shown a positive relationship between firm growth and leverage decisions (Hamada, 1972; Gertler and Hubbard, 1991). Firms tend to leverage their capital structure in order to take advantage of potential investment opportunities, and using more debt increases the risk of bankruptcy (Iotti and Bonazzi, 2018). The debt structure also includes the maturity of the debt. The choice between short-term and long-term debt depends on the profitable growth opportunities available. It is believed that short term debt is more of a handicap for companies with less information asymmetry. The timing of the debt also determines the level of bankruptcy risk, as short-term debt creates a higher risk than long-term debt, known as rollover risk. Previous studies have developed a mediating role for the capital structure (Van Essen et al., 2012; Umrie and Yuliani, 2014; Detthamrong et al., 2017; Ramli et al., 2019). Recently, Naseem et al. (2020) examined the impact of personal and organizational characteristics of a CEO on performance using data from 179 Pakistani listed companies from 2009 to 2015. Their results were found to be significant and the debt-to-equity proved as a significant mediator. Detthamrong et al. (2017) divided their sample of companies into small and large sub-samples to determine the impact of the audit committee and firm reputation on the performance of large and small companies. The relationship between the size of the audit committee and company performance was mediated by leverage decisions in large companies. La Rocca (2007) argued that the interacting or intervening role of the capital structure on the relationship between corporate governance and firm value should be taken into account. Van Essen et al. (2012) reported that the intermediary role of capital structure should be taken into account when considering the role of corporate governance and growth. There is no point in considering the role of corporate governance, in particular the characteristics of the board of directors, without analyzing the decisions, mechanisms and processes chosen by management that lead to different outcomes. Ramli et al. (2019) conducted a comparative study of Malaysian and Indonesian companies for the period 1990–2010. Using Partial Least Squares Structural Equation Modeling (PLS-SEM) in their research, they uncovered the intermediate effects of leverage in Malaysian firms while examining the effects of asset structure, opportunities growth, taxes, liquidity and interest rates on the performance of the company. Such evidence was not found in Indonesian companies. In addition, Kassim et al. (2013) examined the influence of the board process on the performance of the company with decisions relating to the capital structure as a mediator. Thus, the following hypothesis can be drawn:
H4: Leverage maturity mediates the relationship between firm growth and insolvency risk.
H4a: Leverage maturity mediates the relationship between IFG and insolvency risk.
H4b: Leverage maturity mediates the relationship between EFG and insolvency risk.
This study examined whether the link between leverage and default risk is moderated by the level of fixed assets. In particular, we have argued that the impact of corporate debt decisions on default risk may not be uniform for all companies and that “one size fits all” governance practices may be inappropriate. Information asymmetry is likely to be higher in high growth companies, as executives are likely to receive private information about the value of future projects that is not readily available to shareholders. Therefore, high growth companies are associated with higher agency costs for shareholders/managers and are in urgent need of careful governance scrutiny (Hutchinson and Gul, 2004). Further, Lyandres and Zhdanov (2013) asserted that a firm’s optimal failure strategy depends on its combination of growth options and existing assets, arguing that firms with attractive investment opportunities would be ready to wait longer to fail. There are several theoretical explanations for the moderating role of fixed assets, which can serve as potential collateral in the pursuit of financial leverage. Resource dependency theory explains that company assets are potential resources used to carry out business operations and achieve profitability. Fixed assets not only serve as an operational wheel, but can also be used as a source of liquidity for companies through the acquisition of loans (Lowe et al., 1994). This scenario establishes a positive correlation between the existence of fixed assets and financial leverage (Alipour et al., 2015). Extensive studies have shown that fixed collaterals have a negative impact on the risk of insolvency (Barton et al., 1989). Daskalakis and Psillaki (2008) confirmed that firms that invest more in fixed assets feel less stressed financially. Recently, Alfaro et al. (2019) determined the importance of total assets in defining the relationship between financial debt and financial fragility in emerging markets. They also stressed that large companies are more fragile and just as essential to economic growth. Lee et al. (2011) also examined the relationship between leverage and financial difficulties in the hospitality industry in the United States. This study has shown the positive moderating role of capital intensity measured by the ratio of fixed assets to total assets on the relationship between financial debt and distress. Therefore, the positive link between financial debt and financial distress can be mitigated by ensuring high levels of property, plant and equipment in balance sheets. Joshi (2018) reported that companies with better risk management systems take on more debt and acquire more real assets. Increased debt creates greater risk, but is offset by better risk management practices. These companies also have better cash flow with stable sales and profits. Recently, Xuezhou et al. (2020b) analyzed the interaction of tangible assets in Pakistani non-financial corporations that are directly or indirectly related to agriculture. They also confirmed that property, plant and equipment negatively moderate the relationship between debt maturity and the risk of bankruptcy. Based on this evidence, we hypothesized that the positive relationship between debt decisions and default risk should be relatively small for companies with higher value of potential fixed collaterals.
H5: PFCs moderate the relationship between leverage maturity and insolvency risk.
The data sample comprises 284 non-financial firms listed on the Pakistan Stock Exchange (PSX) for 5 years ranging from 2013 to 2017. Total number of listed firms on PSX at the end of this period was 369. We manually constructed a balanced pool of data that includes only those firms that had no missing values specifically in a non-random pattern. In case of random missing values unbalanced pool is more appropriate. Further, only those firms were included which were incorporated before our study period and also survived in this period. The data were extracted from the annual audited financial statements published by the PSX, the financial statement analysis (FSA) performed by the State Bank of Pakistan (SBP), and the audited reports available on the websites of the respective firms. The data regarding the corporate board structure were manually extracted from the audited financial statements of individual firms in annual frequency available at the PSX official website and the respective websites of the different firms. Resultantly, a panel data set was constructed, which possesses the characteristics of cross-section and time-series simultaneously. The panel data are more informative, more efficient, and less collinear and have more degrees of freedom (Gujarati, 2012).
The final sample comprises 284 firms divided into 14 sectors or economic groups as defined by the SBP. The textile sector is the biggest sector of firms in Pakistan with 136 firms, out of which 101 firms succeeded to become part of our sample constituting 74.26%. The remaining sectors include the sugar sector (23 firms, 76.67%), the food sector (11 firms, 68.75%), chemical and pharmaceuticals (34 firms, 79.07%), manufacturing (20 firms, 80.65%), mineral products (5 firms, 55.56%), cement (17 firms, 100%), motor vehicles, trailers and auto parts (18 firms, 100%), fuel and energy (14 firms, 63.64%), information and communication (10 firms, 90.91%), coke and refined petroleum products (9 firms, 90%), paper, paper board, and products (7 firms, 77.78%), electrical machinery and apparatus (5 firms, 71.43%), and other service activities (5 firms, 50%). The data confirm that each sector has been given fair representation in the final data sample. Even the lowest contribution of firms from any sector is 50%, and some sectors have a representation of as high as 100%.
The objective of this study was to examine the impact of business growth on the risk of bankruptcy. Therefore, the risk of getting insolvent was treated as a dependent variable for Pakistan-based non-financial enterprises. The current study includes a model to predict financial distress as an indicator of insolvency risk. Pakistan is an underdeveloped country; so it is advisable to use a model adapted to such a market. The Z-Score emergency forecasting model for emerging markets proposed by Altman (2005) is much suitable for developing countries. It has a high reported accuracy and is a widely used model in emerging markets. In this model, the market value of assets was replaced by the book value of assets due to the lack of trading liquidity in developing countries in relative terms (Alfaro et al., 2019).
This model includes four ratios, represented by X1, X2, X3 and X4. X1 = working capital (WC)/total assets (TA), X2 = retained earnings (RE)/TA, X3 = operating revenue/TA and X4 = book value of equity (BVE)/total liabilities. The decision criterion is a threshold, according to which a Z-Score below 3.75 predicts financial urgency. A Z-Score between 3.75 and 5.85 is a grey zone, and a value greater than 5.85 places a company in a safe zone.
As already discussed, this study also focused on the impact of firm growth on the dependent variable. Bei and Wijewardana (2012) explained that firm growth can be differentiated into the internal and external growths. We also followed similar propositions and analyzed the impact of both the internal and external growths on insolvency risk. For the IFG, we employed the most widely used measure that captures the annual percentage change in total firm assets. An increase in the total asset base of a firm demonstrates the increase in the firm size, and a year on year (YoY) percentage change in size depicts that how much a firm has grown over the year. There are several proxies utilized over the years for the measurement of growth, but we preferred a more endogenous proxy that focuses on the assets of the firm in this study. The IFG rate was calculated as in Peng (2015) with the formula given below.
The EFG was measured as a ratio between the MVE and the BVE. The MVE is the trading value of shares at the stock exchange. A rising MVE usually depicts the bright prospects of the firm that enhances the confidence of an investor in shares of a particular company, whereas the BVE is the value of shares present in the company books that include the book value of shares stated in firm accounts plus any retained earnings. A higher value of EFG depicts the higher external growth of the firm and can be mathematically written as follows:
We preferred this measure of EFG over sales growth due to the extremely good performance of the majority of firms on PSX during this period. PSX performed exceptionally well in this period in the region and in the world.
This study analyzed the impact of growth on the insolvency risk through the leverage maturity of firms listed on PSX. Therefore, we aimed to analyze the mediating role of leverage maturity in the relationship between growth and insolvency risk. The ‘leverage maturity ratio’ (LMR) was measured by the ratio between long-term and total debts (Orman and Bülent, 2015). This ratio is superior in some ways because it can be used to interpret the role of long and short term maturity, but in reverse. The ratio between short-term debt and total debt shall have the same coefficients, but with opposite signs (+, −), the denominator being similar (Xuezhou et al., 2020b).
PFC represents the volume of fixed assets present in the asset structure of a company. It involves the land, property, plant, and equipment acquired by a business for long-term usage. In this study, it was used as a moderator between the relationship of corporate leverage maturity and insolvency risk. A business with more tangible assets has more bargaining power when negotiating for a loan, and at the same time it reduces risk. It was measured by dividing the fixed assets of a firm by total assets as represented in the following formula:
Several control variables were also used in this study, including company size, taxes, profitability, risk and liquidity. Variable firm size was measured as the logarithmic value of total assets (Patel et al., 2018). Previous researchers have argued that “company size matters” and this prompted us to monitor its effects to examine our suggestions in this study. We also used taxes because they affect the structure of debt, as debt is a tax saving tool in highly taxed companies (Xuezhou et al., 2020a). Growth-oriented companies usually take an aggressive stance which brings more risk and vice versa (Kirikkaleli et al., 2021). Profitable companies have a low tendency to go bankrupt and may also borrow more due to the higher solvency costs associated with debt. Therefore, we used ROA as an indicator of profitability (Saeed and Sameer, 2017). Risky businesses tend to use less debt because they are already in trouble. We also measured the risk as the volatility of ROA (Palich et al., 2000). We used liquidity as companies with a better liquidity position can meet their short-term obligations quickly and face less financial hardship (Goel et al., 2015). Figure 1 presents the research framework.
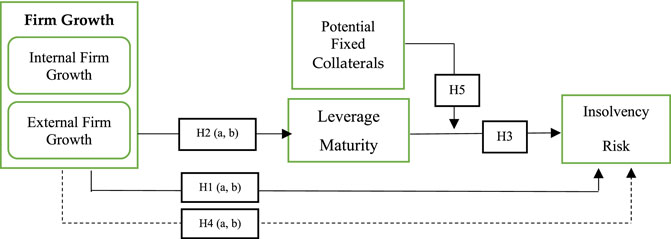
FIGURE 1. Conceptual framework of the current study.
The basic research framework of this study targets to tackle the mediated moderation effect of leverage structure and PFCs in a single framework. On the basis of the proposition of Cheng et al. (2019), instead of treating mediation and moderation separately, we utilized a set of eight regressions. This approach is more viable and comprehensive to assess the mediated moderation analysis in a set of eight independent regressions. In addition, it also combines the traditional three-step mediation analysis, four-step mediation analysis, multiple mediation framework, and the moderation analysis altogether. The detailed description of this eight-step process includes the following. 1) In the first step, only the control variables are regressed on the mediator variable. 2) The second step involves the regressing of the control and independent variables on the mediator variable. 3) The third step considers the control variables as independent and regressed against the dependent variable. 4) The fourth step includes regressing the control variables and the independent variables being regressed on the dependent variable. 5) The control, independent, and mediator variables are regressed against the dependent variable in the fifth step. 6) The sixth step covers regressing the control, independent, and moderator variables as the determinants of the dependent variable. 7) In the seventh step, the control, independent, mediator, and moderator variables all are regressed on the dependent variable. 8) The final step involves all the variables, i.e., control, independent, mediator, and moderator and also the interaction term to be regressed on the dependent variable.
The panel data possess the characteristics of both time series and cross-sections (TSCS). The problems of serial correlation, heteroskedasticity, cross-sectional dependence, and autocorrelation may emerge during the data analysis that are regarded as basic assumptions while performing panel regressions with multiple variables. In this research, we preferred PCSE and FGLS regression estimators over panel OLS due to multiple reasons. The PCSE and FGLS regression techniques are good estimators when the data are non-homoscedastic and serially correlated and possess cross-sectional dependence (Parks, 1967). Beck and Katz (1995) reconfirmed that the data that have contemporaneous correlations, high serial correlation, and heteroskedasticity are viable to apply the PCSE and FGLS techniques. Le and Nguyen (2019) also believed that FGLS and PCSE regressions control for heterogeneity and autocorrelation with robust standard errors.
The time-series cross-sectional (TSCS) data set is either time-series dominant or cross-section dominant. The former means that there are more time intervals than cross-sections (T > N), also called temporal dominant data, while the latter means that there are more cross-sections than time intervals (N > T) also known as contemporaneous or cross-section-dominant data. Both of these aspects of panel data have their associated problems that may arise while generating regression estimates (Joyce and Spaltro, 2014). In the case of temporal data, the problems of non-stationary data series and autocorrelation of error terms can result in spurious regression estimates. Cross-section dependent data can also make regression results non-trustworthy due to contemporaneous correlations and panel heteroskedasticity issues. Moreover, we used the PCSE estimator as our baseline regression technique because it is more feasible in the case of cross-section-dependent data, as in our case, 284 firms are having 5 years of data for each firm (Nută and Nută, 2020). Beck and Katz (1995) emphasized that the FGLS estimator produces undervalued standard errors, which can be corrected by the PCSE estimator, and also stated the FGLS estimator is more suitable in the case of temporal data. However, Reed and Webb (2010) opposed these claims and recommended the superiority of the FGLS estimator. Accordingly, we employed the FGLS estimator as well in our analysis to make our results more robust.
This study measured the direct impact of firm growth on insolvency risk through the intervention of leverage maturity and the interaction of PFCs. We also used the HMRA that is an eight-step process. The firm growth was measured through two independent variables. The eight-step hierarchical multiple regression process was repeated twice for the two proxies of insolvency risk. It is not viable to report the statistical encryption of all the eight-step models with these variations; instead, we presented the statistical description of the last step of the hierarchical approach considering the brevity of this study. Thus, the last step for individual independent variables considering the mediator is reported in the following equations:
Equations 5 and 6 include the IFG and EFG for the IFG and EFG as independent variables, respectively. We used five different control variables in this article. The notation LMR represents LMR, and PFCs are denoted by PFC. The notations SIZE, TAX, ROA, σROA, and LIQ represent the firm size, taxes, profitability, volatility of returns on asset, and firm liquidity as mathematical notations for the control variables. We also introduced dummy variables represented by DummyYE and DummyIE to control the time effects and industry effects in our panel data series. The notation α represents constant, β refers to the slope coefficients, i is for cross-sections, and t for time intervals, whereas it represents error terms across cross-sections and time intervals.
Empirical findings encapsulate the various statistical tools to understand the exact nature of data. The selection of appropriate regression tools is blind unless we fully perform the data diagnosis because main regression estimates must adhere to the discovered data properties. Therefore, in this section we reported certain tests on data description, and also the main empirical results are included to make the statistical inferences regarding the proposed relationships.
Table 2 reports the data description with information on mean, 25th percentile, median, 75th percentile, and standard deviation. The number of observations for five-yearly data counts to 1,420 observations for each variable, making it a balanced pool of data from 284 firms listed at PSX. The mean value of EMZ score, a proxy used for insolvency risk, is 9.969, the median value lies at 5.431, and the standard deviation is 76.861 during the study period.
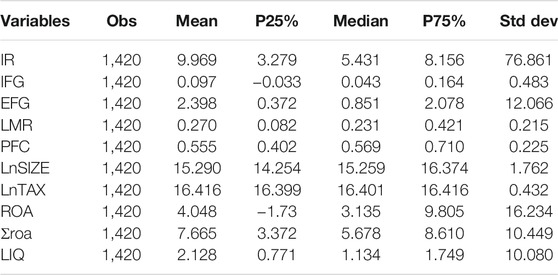
TABLE 2. Descriptive statistics.
There are two independent variables involved in this study for the measurement of internal and external growths. For the IFG, the mean value is 9%, the median value is a little above 4%, and there is a 48% deviation from the mean value. These firms observed an exponential average external growth of 239% during this time, and the median value is also quite high, which equals 85% and with a moderate deviation of 12%. These figures are not surprising as during our sample period, PSX broke the 50,000 marks and also declared one of the best performing stock exchanges in the world. Furthermore, the leverage structure on average uses long-term debt up to 27%, which means that the majority of financing is based on short-term loans. The median value stands at 23% percent, and the long-term debt ratio deviates from the standard up to 21% during our study period. The sampled non-financial firms have on average more than 55% fixed assets in their asset structure, and the median level of tangible assets that can be used as collaterals lies at almost 57%. There is a 22.5% deviation in the mean value of PFCs in our study sample. The mean proportions of controls, including lnSIZE, lnTAX, ROA, the volatility of ROA, and LIQ, appear to be 15.2, 16.4, 4.04, 7.6, and 2.1, respectively.
Table 3 reports the pairwise correlations and multicollinearity estimates of the variables selected in this sample. Pairwise correlations are also reported for all the possible combinations among the study variables. The presence of a strong correlation with large coefficient values is an indication of possible multicollinearity among the study variables. A high correlation between the selected variables can generate untrue regression coefficients, and any of the variables causing the statistical disorder should be dropped from the econometric framework.
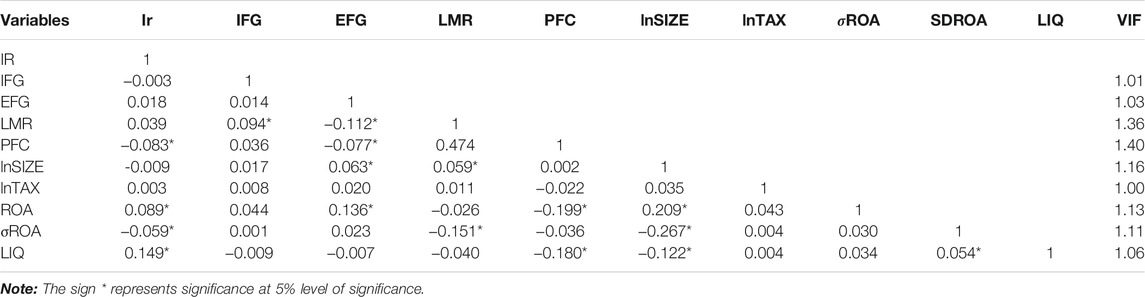
TABLE 3. Results for Pearson correlations and Multicollinearity.
The correlation values reported in our case are pretty much within the acceptable limits rejecting the probable presence of high multicollinearity among the study variables. Nevertheless, we did not only rely on this estimator and used the variance inflation factor to further strengthen our view regarding this issue. Studenmund (2000) regarded that a VIF value above 10 is problematic for any variable included in the model, and such variable should be dropped while going through the statistical analysis phase. Our findings are extremely satisfactory regarding this estimator as the variance inflation factor values are well below the cutoff point, and the calculated values for each variable lie much near to 1.
To ensure and fulfill the basic assumptions of multivariate panel regression analysis and the selection of a proper regression estimator that well suits according to the nature of data, we applied various unit root, heteroskedasticity, autocorrelation, and cross-sectional dependence tests (Adebayo and Kirikkaleli, 2021; Adebayo et al., 2021a; Adebayo et al., 2021b). Table 4 reports the unit root test results using three diverse techniques, namely, the ADF fisher type test, the Harris–Tzavalis unit root test, and the Hadri unit root test, to develop a more consensus-based opinion.
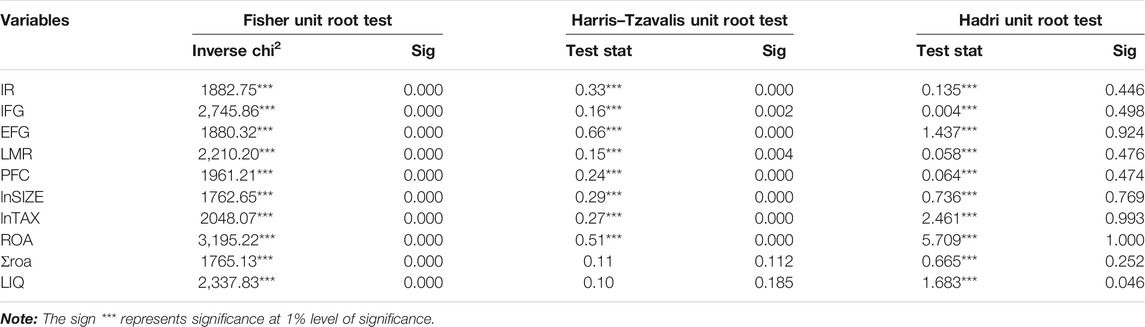
TABLE 4. Data stationary tests.
A significant p-value ensures data as stationary in the Fisher and Harris–Tzavalis unit root tests confirming the alternate hypothesis, but the Hadri unit root test is interpreted differently. In the Hadri unit root tests, insignificant p-values ensure that data are stationary. On this basis, the estimations prove that all the variables are stationary at the level based on the majority acceptance criteria.
Table 5 is designed to assess the panel heteroskedasticity, autocorrelation, and cross-sectional dependence in our constructed data sample. We used the modified Wald test for the detection of group-wise heteroskedasticity. The test statistics value is 41.343 and significant at less than 1%, which leads to the acceptance of the hypothesis that there exists group-wise heteroskedasticity in this sample of firms. We also employed the Wooldridge test for possible autocorrelation, and its value also turned out to be significant. The F-stat value of 1706.978 and a p-value of 0.00 enabled us to accept that there exists autocorrelation in panel data. Further, we applied Pesaran’s test for cross-sectional dependence and estimated a CD statistic of 41.343, and a p-value of less than 1% ensured that there exists cross-sectional dependence in all variables. On the basis of this information, we used a PCSE regression estimator that is suitable for smaller time intervals (T) and large cross-sections (N) in panel data settings. We also employed the FGLS estimator to ensure the robustness of our results.

TABLE 5. Heteroskedasticity, autocorrelation and cross-sectional dependence tests.
Figure 2 comprises of multiple regression graphs prepared by using ORIGIN software for two regressions considering the two independent variables separately. Insolvency risk is plotted at the y-axis. The graph on the left side considers the IFG as independent variable, whereas the graph on right considers EFG as independent variable. The other variables included are the mediator, the interaction term and the control variables in both the graphs. It is abvious from this figure that on the whole the panel data series are near to the best line of fit with few distortions in the shape of spikes above and below the regression line. It depicts the presence of heterogeneity in data values. This figure also confirms the suitability of a regression model that better tackles the heterogeneity, autocorrelation and cross sectional dependence issues prevalent in our panels.
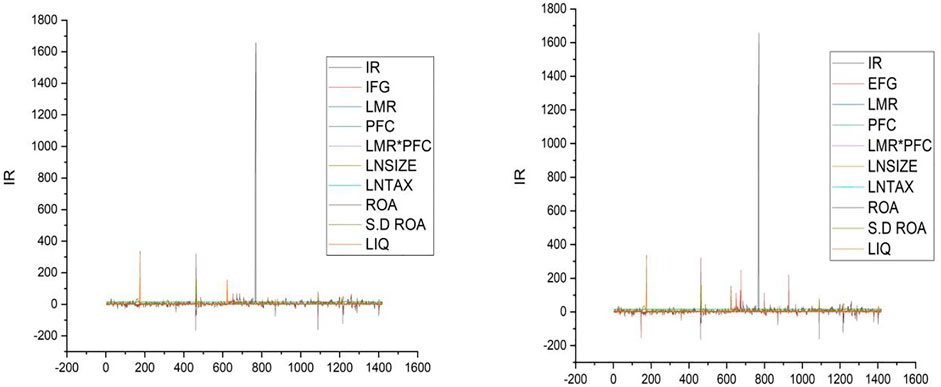
FIGURE 2. Multiple regression graphs for IFG and EFG
Table 6 presents the results for the HMRA after using the PCSE regression estimator. Hierarchical regression is an eight-step approach in which the first two steps consider leverage maturity as a dependent variable, whereas the remaining six steps consider insolvency risk as a dependent variable. The IFG proves to be a significantly positive predictor of leverage maturity with a coefficient value of 0.04132 and a p-value of less than 10%. It refers that a firm seeking internal growth attracts long-term financing in its leverage maturity structure confirming the propositions of Xuezhou et al. (2020b). The debt maturity has a significant positive impact on emerging market Z score referring to the fact that firms using larger proportion of long term debt in their debt maturity structure have lower level of insolvency risk (Adachi-Sato and Vitessonthi, 2019; Wang and Chiu, 2019). This evidence also confirms that debt maturity mediates the relationship between firm growth and insolvency risk in the proposed relationships (Hussain et al., 2020). The results also reveal that leverage maturity and PFCs have a significant impact on insolvency risk when used separately in a mediating role as depicted in models five and 6. However, leverage maturity is a significantly positive predictor of EMZ score (30.74128***), and PFC is a significantly negative predictor of insolvency risk (−12.30066***). This evidence explains that the use of long-term debt in capital structure reduces the risk regarding its use of a conservative strategy. Unlike Lee et al. (2011), the presence of more tangible assets in asset structure does not help in reducing the insolvency risks posed. When we introduced the interaction of leverage maturity and PFCs, the leverage maturity remained a significantly positive predictor of insolvency risk. The interaction term LMR*PFC had a significant but negative impact on insolvency (−140.8758***) confirming a negative mediated moderation effect validating the findings of Hussain et al. (2021). Previous literature including Zhang et al. (2021), Joshi (2018) and Lee, Koh and Kang (2011) support the concept of having more tangible collaterals to have better control on risk of bankruptcy. A few researchers however, have also given evidence that support the risk increment due to non-productive fixed assets and/or poor utilization of fixed collaterals during loan acquistions (Psillaki et al., 2010).

TABLE 6. Hierarchical PCSE regression results with IFG as I.V.
The results for control variables present a mixed picture as size has a positive but insignificant impact on leverage maturity as depicted in the first two steps, whereas it has a significantly negative impact on the emerging market Z score depicting that large firms have high insolvency risk. Taxes also have a positive impact on leverage maturity and a negative impact on insolvency risk, but these results are insignificant in both cases. ROA has an insignificantly negative impact on leverage maturity but a significantly positive impact on the emerging market Z score. The volatility of returns measured through the standard deviation of ROA has a significantly negative impact on leverage maturity and insolvency risk as well. The liquidity was also reported as negative but insignificant for leverage maturity but significantly positive for insolvency risk depicting that the firms that possess more liquid assets experience less financial distress.
Table 7 presents the results of our second model that assumes EFG as our independent variable keeping other variables the same. In this section of the analysis, we again used the PCSE regression in a hierarchical multiple regression framework. Among the control variable, we observed the consistency of results as reported in Table 6. Nonetheless, the impact of the EFG variable turned out to be significant but negative (−0.00113***) in this case as reported in model 2. The negative impact of EFG on leverage maturity depicts that firms that have performed better concerning the ratio between the MVE and BVE prefer less long-term financing and conversely more short-term financing. It confirms the signaling hypothesis of information asymmetry theory that depicts that high share values convey a positive signal to short-term money lenders and that easy access to short-term financing becomes possible for such firms. It is also an indicator that such firms have better prospects as compared with their counterparts as signaled by the security markets in which they operate. The LMR once again has a significantly positive association with leverage maturity, and leverage maturity has a significantly positive (136.2331***) influence on insolvency risk. The interaction term LRM*FPC reconfirmed the previous results showing negative and significant results in this case as well.

TABLE 7. Hierarchical PCSE regression results with EFG as I.V.
As discussed earlier, we also used feasible generalized least square regression to check the sensitivity of our generated results. This regression estimator was once again tested using a HMRA that comprises an eight-step process. Table 8 reports the results using this approach using our first independent variable called IFG. There is not much difference in the results of the control variables using the FGLS estimator as well. Only firm size has contradictory results as its results exhibits a significantly positive impact on LMR, and it also has a significantly negative impact on insolvency risk before the introduction of mediator and moderator in the regression equations. The impact of IFG is insensitive to the use of the alternative regression estimator as it has a positive and significant coefficient value of 0.03984*** when regressed on leverage maturity structure. LMR also has a positive and significant role in defining insolvency risk depicting a decrease in the risk as a more positive value of the emerging market Z score translates into lesser chances of becoming insolvent. The interaction of leverage maturity and PFCs has a beta coefficient value of −10.81954** proving that this relationship is insensitive to the type of the regression estimator used. These results portray that firms in Pakistan are unable to follow the propositions of the maturity-matching approach, which can be one of the reasons that increase the insolvency risk of listed firms. Further, these results assert that the proportion of fixed assets that can act as PFCs are underutilized in this context. Either they are not used properly as fixed collaterals while negotiating the loans, or the firms are unable to generate the revenue from assets that can be used to service the debt.

TABLE 8. Hierarchical FGLS regression results with IFG as I.V.
Table 9 is prepared on a similar line as it also uses the FGLS regression technique, but the independent variable utilized in this case is the EFG. The EFG had a negative but significant influence on LMR (−0.00109***) proving the robustness of regression results. The LMR has a positive impact on insolvency risk (14.38490***) measured through the emerging market Z score. The interacting role of leverage maturity and PFCs reconfirmed the results being a significantly negative (−9.04904*) predictor of the emerging market Z score. The results for the control variables remained unchanged throughout the analysis even after using the different independent variables and regression techniques. The industry and year effects were also controlled throughout our analysis of the collected data. The findings of this study support the initial stance taken in this study that impact of internal and external firm growths have heterogenous impact on leverage structure and ultimately the insolvency risk. Bei and Wijewardana (2012) decomposed the overall growth into internal and externals domains. The significant positive impact of IFG and significat negative impact on leverage maturity proves this fact in this study as well. It describes that the firms grown internally utilize more long term loan (Iotti and Bonazzi, 2018) and firms grown externally utilize more short term loans (Costa et al., 2014).
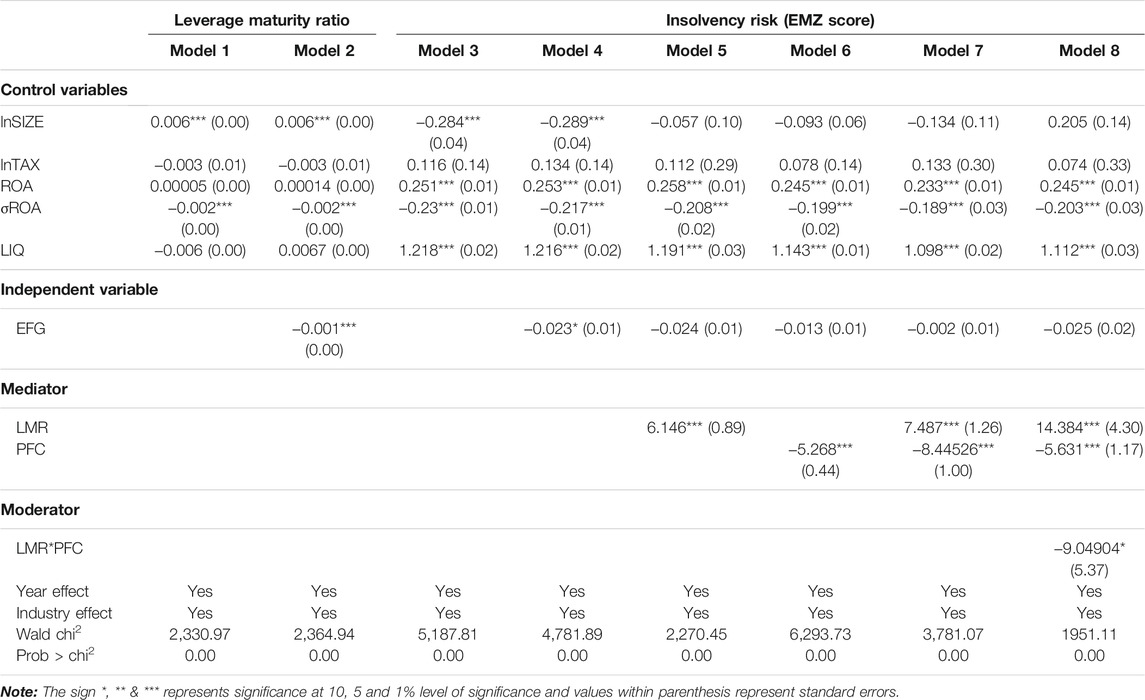
TABLE 9. Hierarchical FGLS regression results with EFG as I.V.
Table 10 is constructed to present a summarized view of our regression results in a short, condensed form. It also presents the three paths to evaluate the mediation process that is moderated by PFCs. The first relationship depicts that the relationship between the IFG and insolvency risk is fully mediated by the LMR, and the second proposes that the relationship between the EFG and insolvency risk is partially mediated by the LMR. In the subsequent section of this table, we analyzed the same relationship but after using the FGLS estimator. Thus, the next steps showing the relationship between IFG and insolvency risk and between EFG and insolvency risk is fully mediated by the LMR. The last column in this table depicts the moderating effect of PFCs, and it shows that all the mediated relationships in these four steps are negatively moderated by PFCs. Similar to the propositions of Xuezhou et al. (2020a), these results confirm our proposed model of the mediated moderation of insolvency risk and PFCs. This evidence also supports the researchsers like Rampini and Viswanath (2020), Joshi (2018) and Lee et al. (2011) who pointed towards the moderating role of collaterals. Abdioğlu (2019) confirmed that same results in Turkish firms.
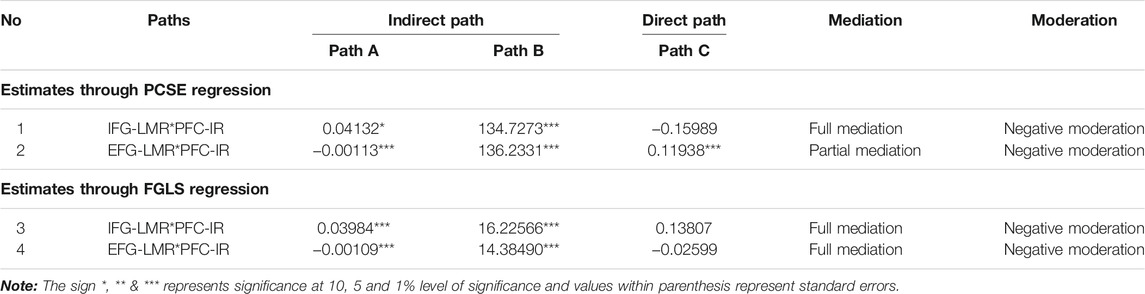
TABLE 10. Summary of results.
Another important issue that exists while dealing with panel data is endogeneity concern (Fatima et al., 2021). To cope up with this potential issue, we used a dynamic regression model called the generalized method of moments (GMM), which is preferable over other dynamic regression approaches when data are contemporaneous (N > T). We relied on system GMM instead of differenced GMM because it addresses the unit root issue more precisely and also gives better results (Tan, 2016).
Table 11 reports the result for the two-step system GMM approach, and we included the results for the final step of the hierarchical approach in this section that include the control variables, independent variables, mediator, moderator, and the interaction term. This table presents the results in two columns for each independent variable separately. The results report an insignificant impact of both of our independent variables, i.e., IFG and EFG. Leverage maturity proves to be a significantly positive predictor of insolvency risk in both cases with coefficient values of 4.85799* and 5.56888**. This result ensures that the usage of long-term debt can impede insolvency risk. The PFCs as also proved by the previous results have a significantly negative impact on insolvency risk (−12.35707*** & −12.34528***). The interaction between leverage maturity and fixed collaterals presented the same character as already evidenced with significantly negative values of −6.77424** and −7.48047*. The results for all the control variables prove positive and significant with the dynamic regression approach. We also reported the results for Sargan’s test to detect any over-identification of the instruments. The significant values of this test in both cases reveal the non-presence of this issue, i.e., 29.55936 and 29.65676 with the probability values of much less than 1%.
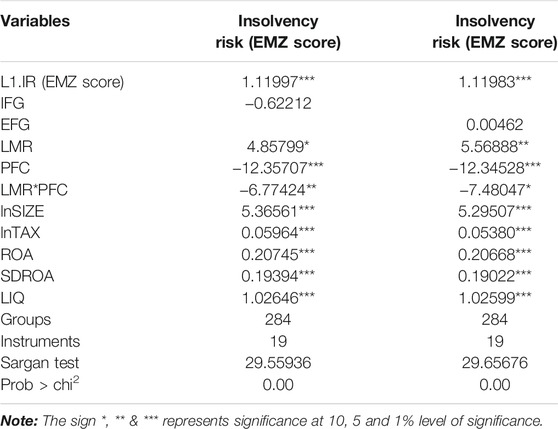
TABLE 11. Two-step system GMM results.
This study was conducted to analyze the impact of firm growth on insolvency risk in the non-financial listed firms of Pakistan. For this purpose, we manually gathered the data for 284 firms over a period of 5 years. Firm growth was discussed as two-dimensional phenomena, namely, the IFG and the EFG. The majority of the previous research has failed to differentiate between the effects of internal and external growth opportunities on insolvency risk. The internal growth is an endogenous phenomenon, while the external growth is regarded as a market-based factor.
We also claimed that the impact of growth on insolvency risk is not direct, but rather, there are leverage decisions that interplay in this relationship. On the basis of the findings of Hussain et al. (2021) and Xuezhou et al. (2020a), we considered only the leverage maturity aspect of the leverage decisions because they proposed that it is the debt maturity decision that is more crucial while controlling for insolvency risk in comparison with the capital structure decision. Therefore, a growth-led leverage maturity influence was tested in our study.
In addition, the moderating role of PFCs in the relationship between leverage maturity and insolvency risk was analyzed. This analysis is based on the maturity-matching principle, which claims that the maturity structure of debt and asset structure should match. Unmatched maturity can either create financial distress or result in unused non-productive assets. The utility of tangible assets is twofold, specifically when we relate it to leverage. One aspect is the generation of continuous revenue from these assets for loan servicing and its possible disposal for loan redemptions. Another important aspect is their use as fixed collaterals. Not all of the fixed assets are used as collaterals, but they do possess the potential to act as fixed collaterals. Information asymmetry theory also regards the presence of PFCs as beneficial. Managers with more PFCs are in a position to obtain loan at favorable terms, and they can also earn short-term leverage on a frequent basis. It renders them a superior negotiating position, but things may be different if the fixed assets prove to be non-productive or used as collateral inefficiently.
Our results confirm that LMR is a good mediator between firm growth and insolvency risk relationships, but PFCs negatively moderate the relationship between leverage maturity and the emerging market Z score rendering an increase in insolvency risk.
On the basis of this research, certain strategic changes are proposed that can be considered while policy making at strategic and regulatory levels to save firms from financial vulnerability. The findings imply that more long-term financing is advantageous in coping with corporate financial distress. Few previous researchers have also supported this evidence and have made similar recommendations for using more long-term debt in the leverage maturity structure of firms. However, this study underlined the fact that managers can use the leverage structure as a tool to control the financial distress, which, if addressed inappropriately, may damage the firm sustainability and also hinder the going concern assumption for the firms. Also, the previous researches are mostly confined to the capital structure aspect of the leverage decisions but lack the role of debt maturity structure in this paradigm. The findings of this research recommend managers to carefully study the debt maturity structure as well. Furhter, it is also crucial to differentiate between the internal and the external growth while making decisions as they may have varied consequences on insolvency risk as proposed in this research. Therefore, the firms that are exposed to high financial distress while seeking growth should opt for less risky external financial resources. It also proves the worth of pecking order theory in Pakistan that takes a step-by-step conservative approach while using financial resources.
The PFCs prove a negative moderator, which explains the non-productive nature of fixed assets and also questions the managerial ability to use them as better collaterals while negotiating for external financing. The maturity-matching approach can serve as a yardstick to the proper utilization of tangible assets as collateral for loan acquisition. The unnecessary and over-accumulation of fixed assets is also harmful as it increases the associated fixed expenses instead of revenue generation, which supersedes the benefits associated with tangible assets.
The governments should formulate policies that make external financing cheaper by reducing the benchmark rates on loans for commercial consumption. Long-term financing is less risky, and its provision to the business community can nurture growth at the industrial level that eventually strengthens the economic growth in the country. At the government level, it is also required to make short-term financing readily available at favorable conditions to encounter the rollover risk associated with short-term financing. It is proven that the financial firms exhibit a ‘fill the gap’ behavior while lending to the manufacturing sectors. The maturity of government issued loans leads to the loan maturities of other lending and borrowing agencies. If long term loan facilities are managed by government, the short term gap is fulfilled by the private lenders and vice versa. Hence, feasible loan maturities can be adjusted by such governmental policies to subsidize the manufacturing sector. The domestic credit to GDP ratio needs to be overhauled. It should atleast be made competitive to other South Asian countries to nurture the growth in business sector. A healthy business and regulatory environment regarding loan disbursement can promote long-term distress avoidance and sustainable business operations.
The current study also encounters a few limitations that include the following. 1) Single and underdeveloped country evidence is presented, and multinational comparative evidence can generate more interesting results in future studies. 2) This study also employed the proportion of tangible assets as potential collateral across all firm types, whereas several studies (although small) regard it as a sector-specific indicator. Therefore, a cross-industry comparison in future studies can also generate enhanced evidence in this domain. 3) We included the internal and external growths as our independent variables in this investigation. Other firm-specific variables and macroeconomic variables, such as inflation and economic growth, may also be tested in this framework to generate more interesting results.
The original contributions presented in the study are included in the article/Supplementary Material, further inquiries can be directed to the corresponding author.
Ethical review and approval was not required for the study on human participants in accordance with the local legislation and institutional requirements. Written informed consent from the (patients/participants OR patients/participants legal guardian/next of kin) was not required to participate in this study in accordance with the national legislation and the institutional requirements.
WX: Proofreading RH: Data collection and analysis AS: Editing and procedures. HH: Research methods AK: Literature writing MF: Article drafting.
The authors declare that the research was conducted in the absence of any commercial or financial relationships that could be construed as a potential conflict of interest.
All claims expressed in this article are solely those of the authors and do not necessarily represent those of their affiliated organizations, or those of the publisher, the editors and the reviewers. Any product that may be evaluated in this article, or claim that may be made by its manufacturer, is not guaranteed or endorsed by the publisher.
Abdioğlu, N. (2019). The Impact of Firm Specific Characteristics on the Relation between Financial Abdioğlu, N. (2019). The Impact of Firm Specific Characteristics on the Relation between Financial Distress and Capital Structure Decisions. İşletme Araştırmaları Dergisi 11 (2), 1057–1067.
Adachi-Sato, M., and Vithessonthi, C. (2019). Corporate Debt Maturity and Future Firm Performance Volatility. Int. Rev. Econ. Finance 60, 216–237. doi:10.1016/j.iref.2018.11.001
Adebayo, T. S., and Kirikkaleli, D. (2021). Impact of Renewable Energy Consumption, Globalization, and Technological Innovation on Environmental Degradation in Japan: Application of Wavelet Tools. Environ. Dev. Sustain. 23, 16057–16082. doi:10.1007/s10668-021-01322-2
Adebayo, T. S., Oladipupo, S. D., Adeshola, I., and Rjoub, H. (2021a). Wavelet Analysis of Impact of Renewable Energy Consumption and Technological Innovation on CO2 Emissions: Evidence from Portugal. Environ. Sci. Pollut. Res., 1–18. doi:10.1007/s11356-021-17708-8
Adebayo, T. S., Rjoub, H., Akadiri, S. S., Oladipupo, S. D., Sharif, A., and Adeshola, I. (2021b). The Role of Economic Complexity in the Environmental Kuznets Curve of MINT Economies: Evidence from Method of Moments Quantile Regression. Environ. Sci. Pollut. Res., 1–13. doi:10.1007/s11356-021-17524-0
Ahmad, H. H., and Azhari, A. (2020). The Effects of Institutional Ownership and Growth Opportunities on Malaysian Corporate Risk-Taking Behaviour. Int. J. Psychosocial Rehabil. 24 (02). doi:10.37200/ijpr/v24i3/pr200904
Akbar, A., Akbar, M., Tang, W., and Qureshi, M. A. (2019). Is Bankruptcy Risk Tied to Corporate Life Cycle? Evidence from Pakistan. Sustainability 11 (678), 1–22. doi:10.3390/su11030678
Alfaro, L., Asis, G., Chari, A., and Panizza, U. (2019). Corporate Debt, Firm Size and Financial Fragility in Emerging Markets. J. Int. Econ. 118, 1–19. doi:10.1016/j.jinteco.2019.01.002
Ali, S., Liu, B., and Su, J. J. (2018). Does Corporate Governance Quality Affect Default Risk? the Role of Growth Opportunities and Stock Liquidity. Int. Rev. Econ. Finance 58, 422–448. doi:10.1016/j.iref.2018.05.003
Alipour, M., Mohammadi, M. F. S., and Derakhshan, H. (2015). Determinants of Capital Structure: an Empirical Study of Firms in Iran. Int. J. L. Manag. doi:10.1108/ijlma-01-2013-0004
Altman, E. I. (2005). An Emerging Market Credit Scoring System for Corporate Bonds. Emerging markets Rev. 6 (4), 311–323. doi:10.1016/j.ememar.2005.09.007
Amaral, M. (2008). Examine Relationship between Firm Risk and Firm Growth. Account. Rev. 180, 54–65.
Bank, W. (2016). South Asia Economic Focus. Washington, DC: Spring 2016: Fading TailwindsWorld Bank.
BarclaySmith., M. J. C., and Smith, C. W. (1995). The Maturity Structure of Corporate Debt. J. Finance 50 (2), 609–631. doi:10.1111/j.1540-6261.1995.tb04797.x
Barnea, A., Haugen, R. A., and Senbet, L. W. (1980). A Rationale for Debt Maturity Structure and Call Provisions in the agency Theoretic Framework. J. Finance 35 (5), 1223–1234. doi:10.1111/j.1540-6261.1980.tb02205.x
Baron, R. M., and Kenny, D. A. (1986). The Moderator-Mediator Variable Distinction in Social Psychological Research: Conceptual, Strategic, and Statistical Considerations. J. Personal. Soc. Psychol. 51 (6), 1173–1182. doi:10.1037/0022-3514.51.6.1173
Barton, S. L., Hill, N. C., and Sundaram, S. (1989). An Empirical Test of Stakeholder Theory Predictions of Capital Structure. Financial Manag. 18, 36–44. doi:10.2307/3665696
Beck, N., and Katz, J. N. (1995). What to Do (And Not to Do) with Time-Series Cross-Section Data. Am. Polit. Sci. Rev. 89 (3), 634–647. doi:10.2307/2082979
Bei, Z., and Wijewardana, W. P. (2012). Financial Leverage, Firm Growth and Financial Strength in the Listed Companies in Sri Lanka. Proced. - Soc. Behav. Sci. 40, 709–715. doi:10.1016/j.sbspro.2012.03.253
Bulan, L. T., and Yan, Z. (2010). Firm Maturity and the Pecking Order Theory. Available at SSRN 1760505.
Caporale, G. M., Cerrato, M., and Zhang, X. (2017). Analysing the Determinants of Insolvency Risk for General Insurance Firms in the UK. J. Banking Finance 84, 107–122. doi:10.1016/j.jbankfin.2017.07.011
Carey, M., and Rosen, R. (2001). Public Debt as a Punching Bag: an agency Model of the Mix of Public and Private Debt. Trabajo no publicado, 1–36.
Chang, C., Chen, X., and Liao, G. (2014). What Are the Reliably Important Determinants of Capital Structure in China? Pacific-Basin Finance J. 30, 87–113. doi:10.1016/j.pacfin.2014.06.001
Cheng, J., Bai, H., and Yang, X. (2019). Ethical Leadership and Internal Whistleblowing: A Mediated Moderation Model. J. Bus Ethics 155 (1), 115–130. doi:10.1007/s10551-017-3517-3
Choi, J. (2017). Entrepreneurial Risk-Taking, Young Firm Dynamics, and Aggregate Implications. Board Governors Fed. Reserve Syst.
Cooper, I., and Maio, P. (2019). Asset Growth, Profitability, and Investment Opportunities. Manag. Sci. 65 (9), 3988–4010. doi:10.1287/mnsc.2018.3036
Cooper, M. J., Gulen, H., and Schill, M. J. (2008). Asset Growth and the Cross-Section of Stock Returns. J. Finance 63 (4), 1609–1651. doi:10.1111/j.1540-6261.2008.01370.x
Costa, S., Laureano, L. M. S., and Laureano, R. M. S. (2014). The Debt Maturity of Portuguese SMEs: The Aftermath of the 2008 Financial Crisis. Proced. - Soc. Behav. Sci. 150, 172–181. doi:10.1016/j.sbspro.2014.09.024
Cuñat, V. (1999). Determinantes del plazo de endeudamiento de las empresas españolas. Investigaciones económicas 23 (3), 351–392.
Dang, H. T., Phan, D. T., Phan, D. T., Nguyen, H. T., and Hoang, L. H. T. (2020). Factors Affecting Financial Risk: Evidence from Listed Enterprises in Vietnam. Jafeb 7 (9), 11–18. doi:10.13106/jafeb.2020.vol7.no9.011
Daskalakis, N., and Psillaki, M. (2008). Do country or Firm Factors Explain Capital Structure? Evidence from SMEs in France and Greece. Appl. Financial Econ. 18 (2), 87–97. doi:10.1080/09603100601018864
Detthamrong, U., Chancharat, N., and Vithessonthi, C. (2017). Corporate Governance, Capital Structure and Firm Performance: Evidence from Thailand. Res. Int. Business Finance 42, 689–709. doi:10.1016/j.ribaf.2017.07.011
Diamond, D. W. (1991). Debt Maturity Structure and Liquidity Risk. Q. J. Econ. 106 (3), 709–737. doi:10.2307/2937924
Diamond, D. W., and He, Z. (2014). A Theory of Debt Maturity: the Long and Short of Debt Overhang. J. Finance 69 (2), 719–762. doi:10.1111/jofi.12118
Faccio, M., Marchica, M.-T., and Mura, R. (2016). CEO Gender, Corporate Risk-Taking, and the Efficiency of Capital Allocation. J. corporate Finance 39, 193–209. doi:10.1016/j.jcorpfin.2016.02.008
Farooq, U., Nazir, M. S., and Nawaz, M. M. (2012). Operating or Financial Distress? How Much Costly These Are. Am. J. Scientific Res. 55 (3), 96–108.
Fatima, T., Shahzad, U., and Cui, L. (2021). Renewable and Nonrenewable Energy Consumption, Trade and CO2 Emissions in High Emitter Countries: Does the Income Level Matter? J. Environ. Plann. Manag. 64 (7), 1227–1251. doi:10.1080/09640568.2020.1816532
Frank, M. Z., and Goyal, V. K. (2009). Capital Structure Decisions: Which Factors Are Reliably Important? J. Financial Manag., 1–37.
Fredrick, I. (2018). Capital Structure and Corporate Financial Distress of Manufacturing Firms in Nigeria. J. Account. Taxation 10 (7), 78–84.
Gertler, M., and Hubbard, R. G. (1991). Corporate Financial Policy, Taxation, and Macroeconomic Risk. Retrieved from. doi:10.3386/w3902
Goel, U., Chadha, S., and Sharma, A. K. (2015). Operating Liquidity and Financial Leverage: Evidences from Indian Machinery Industry. Proced. - Soc. Behav. Sci. 189 (14), 344–350. doi:10.1016/j.sbspro.2015.03.230
Gomes, J., Kogan, L., and Zhang, L. (2003). Equilibrium Cross Section of Returns. J. Polit. Economy 111 (4), 693–732. doi:10.1086/375379
Hamada, R. S. (1972). The Effect of the Firm's Capital Structure on the Systematic Risk of Common Stocks. J. Finance 27 (2), 435–452. doi:10.1111/j.1540-6261.1972.tb00971.x
Hs Umrie, H. R., and Yuliani, Y. (2014). Ownership Structure, Innovation to Firm Value with the Financing Decision as Mediation. Jebav 17 (2), 245–258. doi:10.14414/jebav.v17i2.307
Hussain, R. Y., Wen, X., Butt, R. S., Hussain, H., Qalati, S. A., and Abbas, I. (2020). Are Growth Led Financing Decisions Causing Insolvency in Listed Firms of Pakistan? Zagreb Int. Rev. Econ. Business 23 (2), 89–115. doi:10.2478/zireb-2020-0015
Hussain, R. Y., Xuezhou, W., Hussain, H., Saad, M., and Qalati, S. A. (2021). Corporate Board Vigilance and Insolvency Risk: a Mediated Moderation Model of Debt Maturity and Fixed Collaterals. Int. J. Manag. Econ., 1. (ahead-of-print). doi:10.2478/ijme-2020-0032
Hutchinson, M., and Gul, F. A. (2004). Investment Opportunity Set, Corporate Governance Practices and Firm Performance. J. corporate Finance 10 (4), 595–614. doi:10.1016/s0929-1199(03)00022-1
ICMAP. (2015). Business Climate in Pakistan-challenges and Remedies. ICMA Pakistan, Tech. Support Pract. Dev. (Tspd) Committee.
Iotti, M., and Bonazzi, G. (2018). Analysis of the Risk of Bankruptcy of Tomato Processing Companies Operating in the Inter-Regional Interprofessional Organization "OI Pomodoro da Industria Nord Italia". Sustainability 10 (4), 947. doi:10.3390/su10040947
Johnson, S. A. (2003). Debt Maturity and the Effects of Growth Opportunities and Liquidity Risk on Leverage. Rev. Financ. Stud. 16 (1), 209–236. doi:10.1093/rfs/16.1.0209
Joshi, H. (2018). Corporate Risk Management, Firms' Characteristics and Capital Structure: Evidence from Bombay Stock Exchange (BSE) Sensex Companies. Vision 22 (4), 395–404. doi:10.1177/0972262918803172
Kabir, M. N., Miah, M. D., Ali, S., and Sharma, P. (2020). Institutional and Foreign Ownership Vis-À-Vis Default Risk: Evidence from Japanese Firms. Int. Rev. Econ. Finance 69, 469–493. doi:10.1016/j.iref.2020.05.020
Karpavičius, S., and Yu, F. (2019). External Growth Opportunities and a Firm's Financing Policy. Int. Rev. Econ. Finance 62, 287–308.
Kassim, A. A. M., Ishak, Z., and Manaf, N. A. A. (2013). Board Effectiveness and Company Performance: Assessing the Mediating Role of Capital Structure Decisions. Int. J. Business Soc. 14 (2), 319.
Khan, A., Fareed, M., Salameh, A. A., and Hussain, H. (2021). Financial Innovation, Sustainable Economic Growth, and Credit Risk: A Case of the ASEAN Banking Sector. Front. Environ. Sci. 9, 729922. doi:10.3389/fenvs.2021.729922
Kim, S. Y. (2018). Predicting Hospitality Financial Distress with Ensemble Models: the Case of US Hotels, Restaurants, and Amusement and Recreation. Serv. Bus 12 (3), 483–503. doi:10.1007/s11628-018-0365-x
Kirikkaleli, D., Güngör, H., and Adebayo, T. S. (2021). Consumption-based Carbon Emissions, Renewable Energy Consumption, Financial Development and Economic Growth in Chile. Business Strategy Environ.
Koh, S., Durand, R. B., Dai, L., and Chang, M. (2015). Financial Distress: Lifecycle and Corporate Restructuring. J. corporate Finance 33, 19–33. doi:10.1016/j.jcorpfin.2015.04.004
La Rocca, M. (2007). The Influence of Corporate Governance on the Relation between Capital Structure and Value. Corporate Governance: Int. J. Business Soc. doi:10.1108/14720700710756580
Le, T.-H., and Nguyen, C. P. (2019). Is Energy Security a Driver for Economic Growth? Evidence from a Global Sample. Energy Policy 129, 436–451. doi:10.1016/j.enpol.2019.02.038
Lee, N., and Lee, J. (2019). External Financing, R&D Intensity, and Firm Value in Biotechnology Companies. Sustainability 11 (15), 4141. doi:10.3390/su11154141
Lee, S., Koh, Y., and Kang, K. H. (2011). Moderating Effect of Capital Intensity on the Relationship between Leverage and Financial Distress in the U.S. Restaurant Industry. Int. J. Hospitality Manag. 30 (2), 429–438. doi:10.1016/j.ijhm.2010.11.002
Leland, H. E. (1994). Corporate Debt Value, Bond Covenants, and Optimal Capital Structure. J. Finance 49 (4), 1213–1252. doi:10.1111/j.1540-6261.1994.tb02452.x
Lelland, H. E., and Pyle, D. H. (1977). Informational Asymmetries, Financial Structure and Financial Intermediaries. J. Finance 32, 371–387.
Loderer, C., and Waelchli, U. (2015). Corporate Aging and Takeover Risk*. Rev. Finance 19 (6), 2277–2315. doi:10.1093/rof/rfu048
López-Gutiérrez, C., Sanfilippo-Azofra, S., and Torre-Olmo, B. (2015). Investment Decisions of Companies in Financial Distress. BRQ Business Res. Q. 18 (3), 174–187. doi:10.1016/j.brq.2014.09.001
Lowe, J., Naughton, T., and Taylor, P. (1994). The Impact of Corporate Strategy on the Capital Structure of Australian Companies. Manage. Decis. Econ. 15 (3), 245–257. doi:10.1002/mde.4090150306
Lu, Y., and Ma, D. (2016). Audit Quality and Financial Distress: Evidence from China. WSEAS Trans. Business Econ. 13, 330–340.
Lukason, O., and K. Laitinen, E. (2016). Failure Processes of Old Manufacturing Firms in Different European Countries. Investment Manag. Financial Innov. 13, 310–321. doi:10.21511/imfi.13(2-2).2016.06
Lyandres, E., and Zhdanov, A. (2013). Investment Opportunities and Bankruptcy Prediction. J. Financial Markets 16 (3), 439–476. doi:10.1016/j.finmar.2012.10.003
Meher, K., and Getaneh, H. (2019). Impact of Determinants of the Financial Distress on Financial Sustainability of Ethiopian Commercial banks. Banks Bank Syst. 14 (3), 187–201. doi:10.21511/bbs.14(3).2019.16
Morris, J. R. (1976). On Corporate Debt Maturity Strategies. J. Finance 31 (1), 29–37. doi:10.1111/j.1540-6261.1976.tb03193.x
Morris, S., and Shin, H. S. (2016). Illiquidity Component of Credit Risk - the 2015 Lawrence R. Klein Lecture. Int. Econ. Rev. 57 (4), 1135–1148. doi:10.1111/iere.12192
Moyen, N. (2007). How Big Is the Debt Overhang Problem? J. Econ. Dyn. Control. 31 (2), 433–472. doi:10.1016/j.jedc.2005.10.008
Nakano, M., and Nguyen, P. (2012). Board Size and Corporate Risk Taking: Further Evidence from Japan. Corporate Governance: Int. Rev. 20 (4), 369–387. doi:10.1111/j.1467-8683.2012.00924.x
Naseem, M. A., Lin, J., ur Rehman, R., Ahmad, M. I., and Ali, R. (2020). Does Capital Structure Mediate the Link between CEO Characteristics and Firm Performance? Manag. Decis.
Nuță, A.-C., and Nuță, F.-M. (2020). Modelling the Influences of Economic, Demographic, and Institutional Factors on Fiscal Pressure Using OLS, PCSE, and FD-GMM Approaches. Sustainability 12 (4), 1681.
Öhman, P., and Yazdanfar, D. (2017). Short-and Long-Term Debt Determinants in Swedish SMEs. Rev. Account. Finance. doi:10.1108/raf-08-2015-0118
Palich, L. E., Carini, G. R., and Seaman, S. L. (2000). The Impact of Internationalization on the Diversification-Performance Relationship. J. Business Res. 48 (1), 43–54. doi:10.1016/s0148-2963(98)00074-5
Parks, R. W. (1967). Efficient Estimation of a System of Regression Equations when Disturbances Are Both Serially and Contemporaneously Correlated. J. Am. Stat. Assoc. 62 (318), 500–509. doi:10.1080/01621459.1967.10482923
Patel, P. C., Guedes, M. J., Soares, N., and da Conceição Gonçalves, V. (2018). Strength of the Association between R&D Volatility and Firm Growth: The Roles of Corporate Governance and Tangible Asset Volatility. J. Business Res. 88, 282–288. doi:10.1016/j.jbusres.2017.12.033
Peng, X. (2015). Risk Taking and Firm Growth. Res. Inst. Economy, Track Industry (Rieti) Discussion Paper Ser.
Preacher, K. J., and Hayes, A. F. (2008). Asymptotic and Resampling Strategies for Assessing and Comparing Indirect Effects in Multiple Mediator Models. Behav. Res. Methods 40 (3), 879–891. doi:10.3758/brm.40.3.879
Psillaki, M., Tsolas, I. E., and Margaritis, D. (2010). Evaluation of Credit Risk Based on Firm Performance. Eur. J. Oper. Res. 201 (3), 873–881. doi:10.1016/j.ejor.2009.03.032
Puspitasari, Y. A., and Ekaningtias, D. (2017). The Influence of Profitability, Size, and Growth on the Capital Structure in Consumer Goods Companies. Tiar 7 (2), 155–164. doi:10.14414/tiar.v7i2.1603
Ramli, N. A., Latan, H., and Solovida, G. T. (2019). Determinants of Capital Structure and Firm Financial Performance-A PLS-SEM Approach: Evidence from Malaysia and Indonesia. Q. Rev. Econ. Finance 71, 148–160. doi:10.1016/j.qref.2018.07.001
Reed, W. R., and Webb, R. (2010). The PCSE Estimator Is Good–Just Not as Good as You Think. J. Time Ser. Econom. 2 (1).
Saeed, A., and Sameer, M. (2017). Impact of Board Gender Diversity on Dividend Payments: Evidence from Some Emerging Economies. Int. Business Rev. 26 (6), 1100–1113. doi:10.1016/j.ibusrev.2017.04.005
Scherr, F. C., and Hulburt, H. M. (2001). The Debt Maturity Structure of Small Firms. Financial Manag. 30, 85–111. doi:10.2307/3666392
Shleifer, A., and Vishny, R. W. (2010). Unstable Banking. J. financial Econ. 97 (3), 306–318. doi:10.1016/j.jfineco.2009.10.007
Stohs, M. H., and Mauer, D. C. (1996). The Determinants of Corporate Debt Maturity Structure. J. Bus 69, 279–312. doi:10.1086/209692
Studenmund, A. H. (2000). Using Econometrics: A Practical Guide, Pearson New International Edition. 6th ed. EssexHarlow: Edinburgh Gate.
Tan, Y. (2016). The Impacts of Risk and Competition on Bank Profitability in China. J. Int. Financial Markets, Institutions Money 40, 85–110. doi:10.1016/j.intfin.2015.09.003
Titman, S., and Tsyplakov, S. (2007). A Dynamic Model of Optimal Capital Structure. Rev. Finance 11 (3), 401–451. doi:10.1093/rof/rfm017
Van Essen, M., van Oosterhout, J. H., and Carney, M. (2012). Corporate Boards and the Performance of Asian Firms: A Meta-Analysis. Asia Pac. J. Manag. 29 (4), 873–905. doi:10.1007/s10490-011-9269-1
Wang, C.-W., and Chiu, W.-C. (2019). Effect of Short-Term Debt on Default Risk: Evidence from Pacific Basin Countries. Pacific-Basin Finance J. 57, 101026. doi:10.1016/j.pacfin.2018.05.008
Wennberg, K., Delmar, F., and McKelvie, A. (2016). Variable Risk Preferences in New Firm Growth and Survival. J. Business Venturing 31 (4), 408–427. doi:10.1016/j.jbusvent.2016.05.001
Wu, X., and Au Yeung, C. K. (2012). Firm Growth Type and Capital Structure Persistence. J. Banking Finance 36 (12), 3427–3443. doi:10.1016/j.jbankfin.2012.08.008
Xia, W., Apergis, N., Bashir, M. F., Ghosh, S., Doğan, B., and Shahzad, U. (2022). Investigating the Role of Globalization, and Energy Consumption for Environmental Externalities: Empirical Evidence from Developed and Developing Economies. Renew. Energ. 183, 219–228. doi:10.1016/j.renene.2021.10.084
Xu, C., and Zhou, Z. (2016). The Study of Internal Control and Over-investment on Corporate Credit Risk. Proced. Comp. Sci. 91, 109–113. doi:10.1016/j.procs.2016.07.047
Xuezhou, W., Hussain, R., Butt, R., Hussain, H., Qalati, S., and Abbas, I. (2020a). Are Growth Led Financing Decisions Causing Insolvency in Listed Firms of Pakistan? Zagreb International Review of Economics and Business.
Xuezhou, W., Hussain, R. Y., Hussain, H., Saad, M., and Butt, R. S. (2020b). Interaction of Asset Tangibility on the Relationship between Leverage Structure and Financial Distress in Agriculture-Linked Non-financial Firms. Scientific Pap. Manag. Econ. Eng. Agric. Rural Dev. 20 (3), 649–662.
Yu, J., and Zhu, D. (2018). Study on the Selection Strategy of Supply Chain Financing Modes Based on the Retailer's Trade Grade. Sustainability 10 (9), 3045. doi:10.3390/su10093045
Keywords: firm growth, insolvency risk, leverage maturity, potential fixed collaterals, mediated moderation model
Citation: Xuezhou W, Hussain RY, Salameh AA, Hussain H, Khan AB and Fareed M (2022) Does Firm Growth Impede or Expedite Insolvency Risk? A Mediated Moderation Model of Leverage Maturity and Potential Fixed Collaterals. Front. Environ. Sci. 10:841380. doi: 10.3389/fenvs.2022.841380
Received: 22 December 2021; Accepted: 03 February 2022;
Published: 24 February 2022.
Edited by:
Umer Shahzad, Anhui University of Finance and Economics, ChinaReviewed by:
Bahareh Oryani, Seoul National University, South KoreaCopyright © 2022 Xuezhou, Hussain, Salameh, Hussain, Khan and Fareed. This is an open-access article distributed under the terms of the Creative Commons Attribution License (CC BY). The use, distribution or reproduction in other forums is permitted, provided the original author(s) and the copyright owner(s) are credited and that the original publication in this journal is cited, in accordance with accepted academic practice. No use, distribution or reproduction is permitted which does not comply with these terms.
*Correspondence: Muhammad Fareed, bS5mYXJlZWRAdXVtLmVkdS5teQ==; Rana Yassir Hussain, eWFzc2lyLmh1c3NhaW5AdWUuZWR1LnBr
Disclaimer: All claims expressed in this article are solely those of the authors and do not necessarily represent those of their affiliated organizations, or those of the publisher, the editors and the reviewers. Any product that may be evaluated in this article or claim that may be made by its manufacturer is not guaranteed or endorsed by the publisher.
Research integrity at Frontiers
Learn more about the work of our research integrity team to safeguard the quality of each article we publish.