
95% of researchers rate our articles as excellent or good
Learn more about the work of our research integrity team to safeguard the quality of each article we publish.
Find out more
ORIGINAL RESEARCH article
Front. Environ. Sci. , 09 February 2022
Sec. Atmosphere and Climate
Volume 10 - 2022 | https://doi.org/10.3389/fenvs.2022.841285
This article is part of the Research Topic Atmospheric Aerosols and their Interactions with Clouds, Radiation, and Climate on Regional Scales View all 7 articles
 Peifu Xie
 Hong Liao*
We applied the global 3-D chemical transport model GEOS-Chem to examine the effects of changes in anthropogenic emissions over China on PM2.5 concentrations in South Korea and Japan over 2013–2017 during which the Chinese governmental “Action Plan on the Prevention and Control of Air Pollution” was implemented. The reductions in anthropogenic emissions in China alleviated PM2.5 concentrations in South Korea and Japan. The reductions in anthropogenic emissions in China alone led to reductions in annual mean PM2.5 concentrations by 13.7 (19.7%), 2.7 (7.7%), and 1.0 (7.9%) μg m−3 over 2013–2017 in eastern China, South Korea, and Japan, respectively. The reductions in anthropogenic emissions in China also changed the components of PM2.5 in South Korea and Japan. The concentrations of sulfate, ammonium, black carbon and organic carbon were simulated to decrease and those of nitrate were simulated to increase in both South Korea and Japan. With the changes in anthropogenic emissions and the changes in meteorology (BASE simulation), the proportions of sulfate, nitrate, and OC in PM2.5 in South Korea (Japan) were, respectively, 17.1, 44.4, and 15.8% (27.2, 30.5, and 20.0%) in 2013, and 14.3, 46.0, and 17.8% (23.7, 33.2, and 21.6%) in 2017. Model results shown here are helpful for understanding the temporal evolution in PM2.5 on different timescales in the downwind regions of China.
Air pollution is a serious environmental problem that influences human health, ecosystem, and climate (IPCC, 2021). The Chinese government issued the “Action Plan on the Prevention and Control of Air Pollution” in 2013 to aggressively control anthropogenic emissions thereafter. With the implementation of a series of stringent air pollution control measures, the observed annual mean PM2.5 concentrations from the China National Environmental Monitoring Center (CNEMC) showed decreases in PM2.5 concentrations by 34–49% over 2013–2018 in the five megacity clusters (Beijing–Tianjin–Hebei, Yangtze River Delta, Pearl River Delta, Fenwei Plain, and Sichuan Basin) (Zhai et al., 2019). Because of the prevailing westerlies in Northeast Asia, it is of interest to examine how the changes in anthropogenic emissions in China can influence air quality in the downwind areas, especially in Japan and South Korea, through the long-range transport of air pollutants.
A number of observational and modeling studies have demonstrated the influence of long-range transport of aerosols from China on aerosol levels in South Korea and Japan. Lee et al. (2018) selected four long-lasting haze episodes (all in winter) occurred in South Korea during 2009–2014 using aerosol optical depth (AOD) at 550 nm from Terra and Aqua Moderate Resolution Imaging Spectroradiometer (MODIS). The distributions of AODs over northeast Asia during each episode showed that the high-AOD area moved from China to South Korea in the presence of northwestliers or westerlies. Similarly, Lee et al. (2019) examined three representative cases during the Korea-United States Air Quality (KORUS-AQ) campaign from 1 May to 12 June 2016 by using the hourly Geostationary Ocean Colour Imager (GOCI) AOD images. They found that the heavy aerosol plumes generated in central-eastern China (particularly in the Shandong peninsula) could pass across the Yellow Sea, and then reached the middle to northern South Korea. Park et al. (2018) collected PM2.5 samples in Seoul, South Korea, from September 2013 to May 2015 and in Nagasaki, Japan, from February 2014 to May 2015 to analyze the 72-h backward trajectories of aerosols. For Seoul, 62% of total trajectories originated from the Yellow Sea near the industrial area in Liaoning Province in China and then moved to the southwestern of Seoul. For Nagasaki, 61% of total trajectories originated from northern China (near Beijing) and passed through North Korea and South Korea to Nagasaki. Aikawa et al. (2010) used a 3-dimensional regional chemical transport model to estimate the impact of transboundary transport on sulfate concentrations at 24 sites in urban, suburban, and rural areas of Japan. They performed simulations with and without anthropogenic emissions in China from 1 January 2003 to 31 March 2006, and reported that Chinese emissions contributed 50–70% to modeled 3-year mean sulfate concentrations at 24 sites in Japan, with a maximum of about 65–80% in winter. Lee et al. (2017) examined PM2.5 concentrations in 10 PM2.5 episodes (both modeled and measured PM2.5 concentrations exceeded the daily air quality standard of 50 μg m−3) in May of 2009–2013 using the GEOS-Chem model, and found that anthropogenic emissions from Shandong Province in China had the largest modeled influence on PM2.5 in Seoul in May. Averaged over the 10 episodes, 69% of simulated PM2.5 in Seoul were from China (39% from the Shandong Province, 16% from Shanghai, and 14% from the Beijing). Yim et al. (2019) used the Weather Research and Forecasting Model (WRF) and Community Multiscale Air Quality Modeling System (CMAQ) to simulate the contributions of anthropogenic emissions in China to PM2.5 in South Korea and Japan in 2010 by sensitivity studies. Anthropogenic emissions in China were estimated to contribute 54% to annual mean surface concentrations of PM2.5 in both Japan and South Korea in 2010. In Japan, the highest contribution from China occurred in spring (61.4%), followed by winter (55.1%) and summer (50.5%), and autumn (44.0%). In South Korea, the contributions of Chinese emissions were higher in winter (62.9%) and spring (55.5%), while lower in autumn (51.7%) and summer (43.8%). Kumar et al. (2021) used the GEOS-Chem model to estimate source attribution to PM2.5 in South Korea from international and domestic emissions in 2015 and 2016 by sensitivity simulations. Their results showed that, on an annual mean basis, anthropogenic emissions in China contributed 45% to PM2.5 in South Korea in 2016, which was 3–5% lower than the Chinese contribution in 2015 because of emissions reductions in China. Results from these studies indicate that the air quality in South Korea and Japan is closely related to air pollution in China.
The long-range transboundary transport of air pollutants (LRTT) is an important issue in air quality planning. East Asia is located in the warm conveyor belts (WCBs) of mid-latitude storm tracks, where airstreams rapidly transport the atmospheric boundary layer air into the upper troposphere by convection, orographic lifting, frontal lifting and ascension (Stohl et al., 2002; Eckhardt et al., 2004). The analysis of meteorological conditions for heavy pollution episodes in South Korea showed that the anomalous low pressure over the upwind regions lifted air pollutants into the upper troposphere, then the strong persistent westerlies in this region driven the flow of pollutants (Qu et al., 2016). When the outflow of air pollutants arrives at South Korea and Japan, the anomalous high pressure causes the air to descend and leads to the accumulation of pollutants in these regions (Lee et al., 2011; Lee et al., 2018).
There were several studies that examined the effects of changes in outflow from China in recent years on aerosol levels in Japan and South Korea. Bhardwaj et al. (2019) carried out the multi-year trend analysis for observed AOD, CO and SO2 with a special focus on the Yellow Sea region. They showed that percentage changes in AOD over 2012–2016 were -23.7%, -11.7% and -16.5% over the North China Plain, Yellow Sea, and South Korea, respectively, and the surface CO mixing ratios over 2012–2016 decreased by 8.3, 5.1 and 3.9%, respectively, in these three regions. Kanaya et al. (2020) analyzed the changes in black carbon (BC) and PM2.5 over 2009–2019 at Fukue island in Japan, and reported that concentrations of BC and PM2.5 decreased by 48 and 21%, respectively. Uno et al. (2020) reported that the observed surface-layer PM2.5 in Japan decreased in recent years, and the proportion of stations that satisfied the PM2.5 air quality standard increased from 37.8% in 2014 to 89.9% in 2017. Bae et al. (2021) showed that, from 2015 to 2018, the observed PM2.5 concentrations averaged over 344 monitoring stations across South Korea decreased by 4.3% per year and the MODIS AOD in South Korea decreased by 4.7% per year. They also used the Community Multiscale Air Quality (CMAQ) model to quantify the impacts of the emissions and meteorology on the PM2.5 concentration over 2015–2018. Their results showed that the changes in emissions and meteorology over 2015–2018 contributed 51 and 49%, respectively, to the reductions in PM2.5 in South Korea. Previous studies, however, did not quantify the influence of air quality improvement in China on air quality in the downwind regions.
In this study, we examined the effects of reductions in anthropogenic emissions reductions in China over 2013–2017 on PM2.5 concentrations in downwind areas (South Korea and Japan) through the long-range transport of air pollutants. The scientific goals of this work include: 1) to quantify the influence of anthropogenic emissions reductions in China on PM2.5 in South Korea and Japan by using the global chemical transport model GEOS-Chem; 2) to distinguish the impacts of changes in meteorological fields and/or anthropogenic emissions on PM2.5; 3) to understand the seasonal characteristics of PM2.5 changes in South Korea and Japan.
We use PM2.5 concentrations observed in 199 cities in provinces across China. The monthly PM2.5 concentrations in 199 cities during 2014–2017 were obtained by averaging the hourly data of each city from the China National Environmental Monitoring Center (http://www.cnemc.cn/). Observed PM2.5 concentrations in 2013–2017 in Japan were collected from the National Institute for Environmental Studies (http://www.nies.go.jp/igreen/), which provides PM2.5 observations in 47 prefectures across Japan. The monthly mean PM2.5 in a11 47 regions are available from this website. The observation of PM2.5 in South Korea started in 2015. The observed PM2.5 concentrations in 2015–2017 were downloaded from the official Air Korea website of the Ministry of Environment of Korea (http://www.airkorea.or.kr). We selected 30 cities from this website which had continuous and valid monthly averaged observation data (the percentage of observation days in a month is greater than 50%). The locations of cities in China, South Korea and Japan are shown in Figure 1.
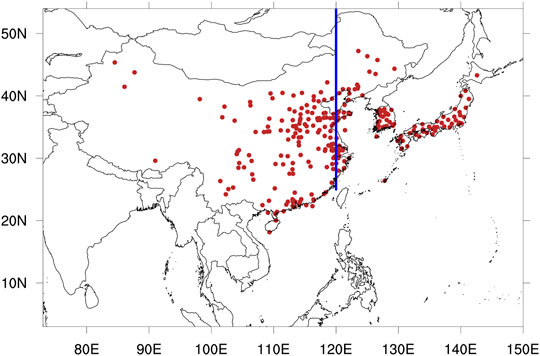
FIGURE 1. The spatial distribution of selected cities in China, South Korea and Japan with observed PM2.5 concentrations for model evaluation. The blue line represents the cross section (120°E, 25–55°N) from the surface to 100 hPa altitude for which the PM2.5 mass flux was calculated.
For simulation of aerosols in East Asia, we used the 3-D Goddard Earth Observing System chemical transport model (GEOS-Chem) which includes fully coupled HOx-NOx-VOC-O3-aerosol chemistry with more than 80 species and 300 reactions and online calculations of aerosols including sulfate (Park et al., 2004), nitrate (Pye et al., 2009), ammonium, BC and organic carbon (OC) (Park et al., 2003), mineral dust (Fairlie et al., 2007), and sea salt (Alexander et al., 2005). We simulated concentrations of aerosols using the nested-grid version of the GEOS-Chem model version11-01 (http://acmg.seas.harvard.edu/geos/) driven by Modern-Era Retrospective Analysis for Research and Applications Version (MERRA-2) assimilated meteorological fields from NASA’s Global Modeling and Assimilation Office (GMAO) (Gelaro et al., 2017). The nested domain for Asia (60–150°E, 11°S-55°N) has 47 vertical layers up to 0.01 hPa and a horizontal resolution of 0.5° latitude by 0.625° longitude. Both wet deposition of soluble aerosols and gases (Liu et al., 2001) and dry deposition (Wesely, 2007) are included in the model simulation. PM2.5 concentration is calculated as the sum of sulfate, nitrate, ammonium, BC, and OC from the model. We do not consider sea salt and mineral dust aerosols in PM2.5 in this study.
The NOx emissions from soil and lighting were calculated online based on MERRA-2 meteorology. Biomass burning emissions followed the Global Fire Emissions database Version 4 (van der Werf et al., 2017), and biogenic emissions of volatile organic compounds (VOCs) were calculated online by Model of Emissions of Gases and Aerosols from Nature Version 2 (Guenther et al., 2006). We used anthropogenic emissions from the Community Emissions Data System (CEDS) (Hoesly et al., 2018) for the global domain during 2013–2017, overwritten by year-specific Multi-resolution Emission Inventory for China (MEIC) (Zheng et al., 2018) over China and Regional Emission inventory in Asia (REASv3.2) (Kurokawa and Ohara, 2020) over other regions of East Asia. The anthropogenic emissions from REAS in 2016 and 2017 were obtained by linear extrapolation of values over 2012–2015 for each grid. The anthropogenic emissions mainly come from five sectors of agriculture, power, transportation, industry and residential.
Table 1 shows the summary of annual anthropogenic emissions of aerosols and aerosol precursors in China from MEIC and in South Korea and Japan from REASv32 during 2013–2017. As the result of air pollution control policies, anthropogenic emissions of all species except non-methane volatile organic compounds (NMVOCs) decreased year by year over China from 2013 to 2017, with largest reductions in the North China Plain (NCP) and the Yangtze River Delta (YRD) (see Supplementary Figure S1). The reduction in emissions of SO2 was the largest, with a decrease of 58.7% over 2013–2017. Over 2013–2017, the emissions of NOx, CO, NH3, BC and OC in China were reduced by 20.7, 22.9, 3.4, 28.2 and 32.4%, respectively. In South Korea, over 2013–2017, the annual anthropogenic emissions of BC and NOx decreased, while other anthropogenic emissions increased, especially those of OC. In Japan, the anthropogenic emissions kept decreasing year by year during 2013–2017, the annual anthropogenic emissions of NOx, CO, NMVOCs, SO2, NH3, BC and OC in Japan decreased by 20.0, 17.7, 12.5, 21.9, 4.9, 30.7 and 12.7%, respectively.
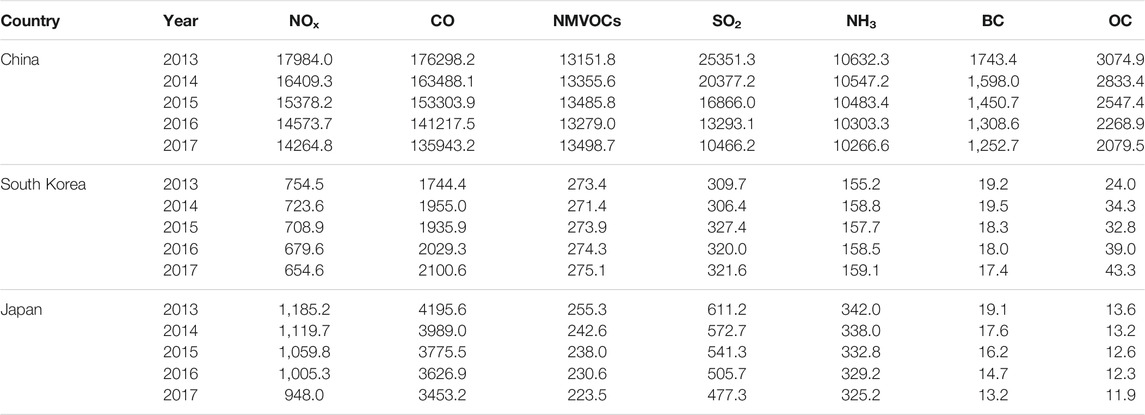
TABLE 1. Summary of annual anthropogenic emissions of aerosols and aerosol precursors in China from MEIC, in South Korea and Japan from REASv32 during 2013–2017 (units: GgC for NMVOCs and Gg for other species).
This study will be focused on aerosol concentrations in China, South Korea and Japan. To investigate the influences of anthropogenic emission reductions in China on air quality over South Korea and Japan, we conducted three 5-year simulations with the GEOS-Chem model with nested domain in Asia (Table 2):
1. BASE: The standard simulation with variations of anthropogenic emissions in Asia and meteorological fields over 2013–2017. Anthropogenic emissions outside Asia were fixed at 2013 levels.
2. FIXEM_KJ: Same as BASE simulation except that anthropogenic emissions over regions other than China were fixed at 2013 levels.
3. FIXEM_CKJ: Same as BASE simulation except that anthropogenic emissions over all regions were fixed at 2013 levels.
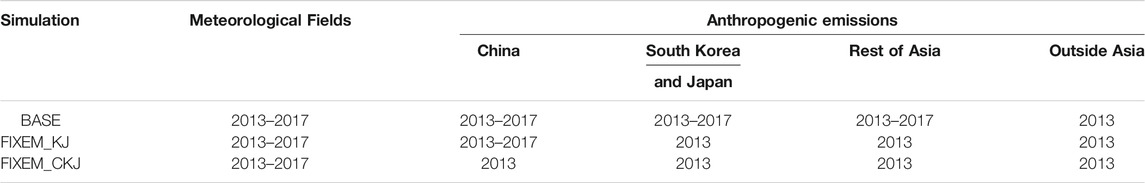
TABLE 2. Configurations of GEOS-Chem simulations in this study.
The BASE simulation was used for model evaluation. The FIXEM_CKJ simulation shows the effects of changes in meteorological fields over 2013–2017 alone on aerosol levels in China, South Korea and Japan. The differences between FIXEM_KJ and FIXEM_CKJ (FIXEM_KJ minus FIXEM_CKJ) represent the impacts of changes in anthropogenic emissions in China over 2013–2017 on aerosol concentrations in China, South Korea, and Japan.
Figure 2 shows the simulated annual and seasonal mean surface layer PM2.5 concentrations over East Asia from 2013 to 2017 from the BASE simulation. The simulated annual mean PM2.5 concentrations in eastern China reached 80–120 μg m−3 during 2013–2017. Seasonally, PM2.5 concentrations in China were the highest in DJF due to the strengthened anthropogenic emissions as well as the unfavorable weather conditions, and were the lowest in JJA because of the enhanced wet removal from the East Asian summer monsoon (Zhang et al., 2010). Both the annual and seasonal mean PM2.5 concentrations in China exhibited clear decreasing trends over 2013–2017 because of the stringent emission control measures in China. PM2.5 concentrations in South Korea were generally higher than those in Japan, the simulated annual mean PM2.5 concentrations were in the range of 20–40 μg m−3 over South Korea and were 10–20 μg m−3 in Japan. PM2.5 concentrations over South Korea and Japan had the same seasonal variations, with concentrations higher in DJF and MAM and lower in JJA and SON.
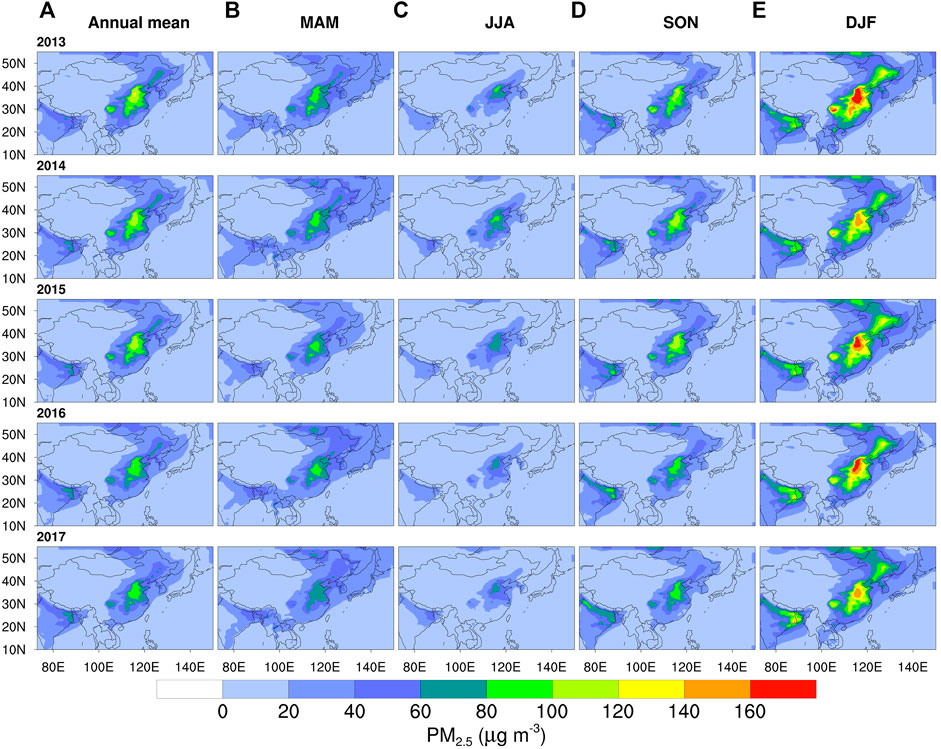
FIGURE 2. Simulated spatial distributions of annual mean (A) and seasonal mean (B–E) surface-layer PM2.5 (μg m−3) in East Asia during 2013–2017 from the BASE simulation. The seasons include March-April-May (MAM), June-July-August (JJA), September-October-November (SON) and December-January-February (DJF, refers to December of this year and January and February of the following year).
We use the ground-based observations to evaluate the model performance in simulating the surface-layer PM2.5 for each year. Supplementary Figure S2–4 display the spatial distributions of simulated (from the BASE simulation) and observed annual mean PM2.5 concentrations in China, South Korea, and Japan. The model can reproduce the spatial distributions of PM2.5 concentrations in these three regions. The normalized mean biases (NMBs) between simulated and observed annual mean PM2.5 concentrations in China are −0.5, 9.1, 8.9, and 15.1% in years of 2014–2017, respectively. The NMBs of annual mean PM2.5 concentrations in South Korea are 25.2, 34.6, and 37.5% in years of 2015–2017, respectively, and in Japan are 5.5, 12.2, 14.7, 34.2, and 34.1% in years of 2013–2017, respectively. Thus the model has high biases in South Korea and Japan during 2016–2017. There might be two reasons for the increasing trend of biases. First, anthropogenic emissions outside Asia were kept at 2013 levels (see Table 2). Second, the REAS emission inventory is available only up to 2015, so anthropogenic emissions in South Korea and Japan in 2016 and 2017 were obtained by linear extrapolation of the REAS values over 2012–2015 for each grid. Figure 3 compares simulated and observed monthly mean PM2.5 concentrations at 15 selected cities (5 cities in each of China, South Korea and Japan). Simulated concentrations of PM2.5 in China agree fairly well with the observations, with high correlation coefficients of 0.81–0.89 and small NMBs of 2.1–24.0% in the five cities located in different polluted areas in China. In South Korea, the model has high biases with NMBs of 32.2–124.0% in the western part of South Korea (Seoul, Daejeon and Dae-gu locations, especially in the Seoul metropolitan area), and has small low biases with NMBs of −9.3% and −4.8% in remote areas like Busan and Jeju Island. The NMBs in five cities in Japan are in the range of −13.5–32.8%, but the correlation coefficients are relatively smaller (between 0.45 and 0.65) compared to the values in China and South Korea. The seasonal variations of the observed PM2.5 in Japanese cities were small, but the simulated results show large seasonal variations. The model well captures the decreasing trends in PM2.5 concentrations in all cities except for Seoul and the trends from the model were weaker than those in the observations in some cities.
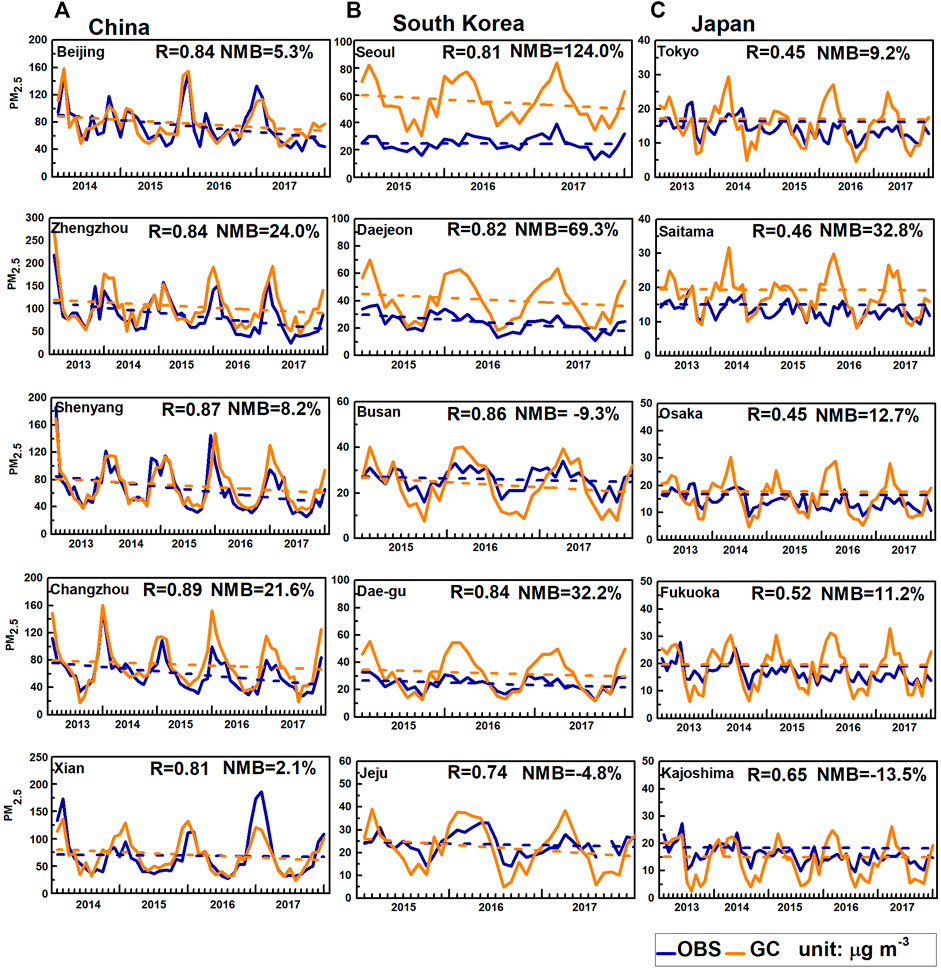
FIGURE 3. Time series of monthly mean PM2.5 concentrations (unit: μg m−3) during 2013–2017 at the selected cities in East Asia. Orange/blue solid lines represent the results from the BASE simulation/observations. Orange/blue dashed lines show linear trends of simulated/observed PM2.5 concentrations over the studied time period. Values inset in each panel are correlation coefficient R and normalized mean biases (NMB) between the GEOS-Chem values and observations. There are 15 cities in total, including five in China (A), five in South Korea (B), and five in Japan (C).
Figure 4 shows the yearly changes in PM2.5 in East Asia compared to the previous year. In China, the simulated annual mean PM2.5 concentrations in the BASE simulation generally decreased in all years compared to the previous year, except for a partial increase in North China caused by the meteorological conditions in 2015. In the downwind regions of China, with the changes in both meteorology and anthropogenic emissions, simulated annual mean PM2.5 concentrations in the BASE simulation showed overall increases in 2014 and 2016 compared to the previous year whereas decreases in 2015 and 2017. The patterns of simulated year-to-year changes in PM2.5 concentrations over South Korea and Japan in BASE simulation were similar to those in FIXEM_CKJ simulation, indicating the dominant influence of meteorology. Changes in anthropogenic emissions over China are estimated to reduce PM2.5 levels in China and its downwind regions year by year during 2013–2017 (FIXEM_KJ minus FIXEM_CKJ).
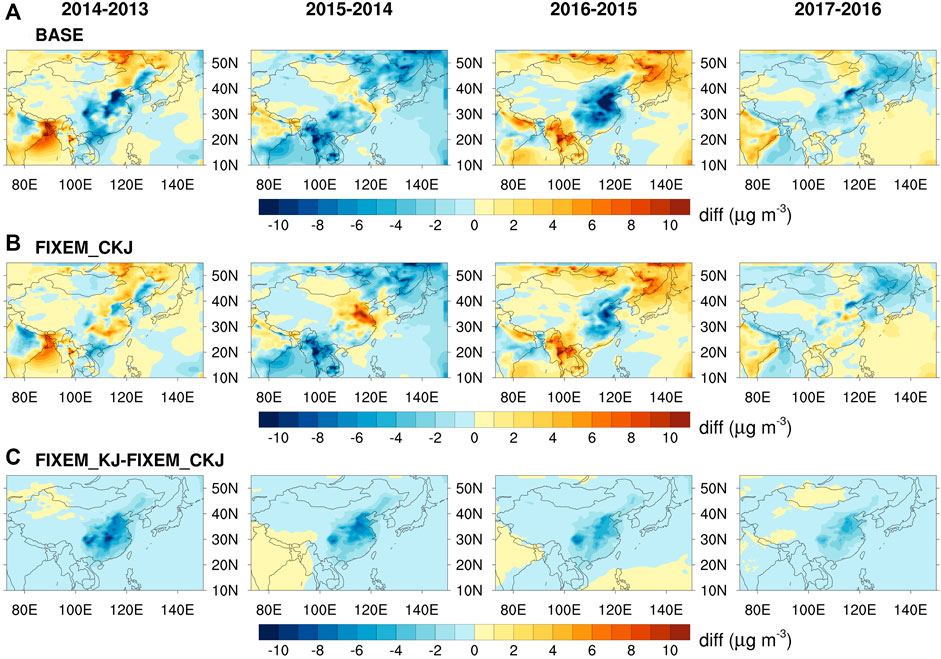
FIGURE 4. Simulated spatial distribution of the yearly changes in surface PM2.5 concentrations over East Asia compared to the previous year during 2013–2017 owing to (A) the changes in both meteorology and in anthropogenic emissions in Asia (BASE simulation) (B) the changes in meteorology alone (FIXEM_CKJ simulation), and (C) the changes in anthropogenic emissions over China (FIXEM_KJ minus FIXEM_CKJ).
We further analyze the 2013–2017 changes in PM2.5 concentrations in eastern China (25–40°N, 110–120°E), South Korea (34.3–38°N, 126.2–129.5°E), and Japan (38–45°N, 139–145°E and 31–38°N, 130–141°E) and attribute these changes to the changes in anthropogenic emissions (FIXEM_KJ minus FIXEM_CKJ) or the changes in meteorological fields (FIXEM_CKJ) (Figure 5).
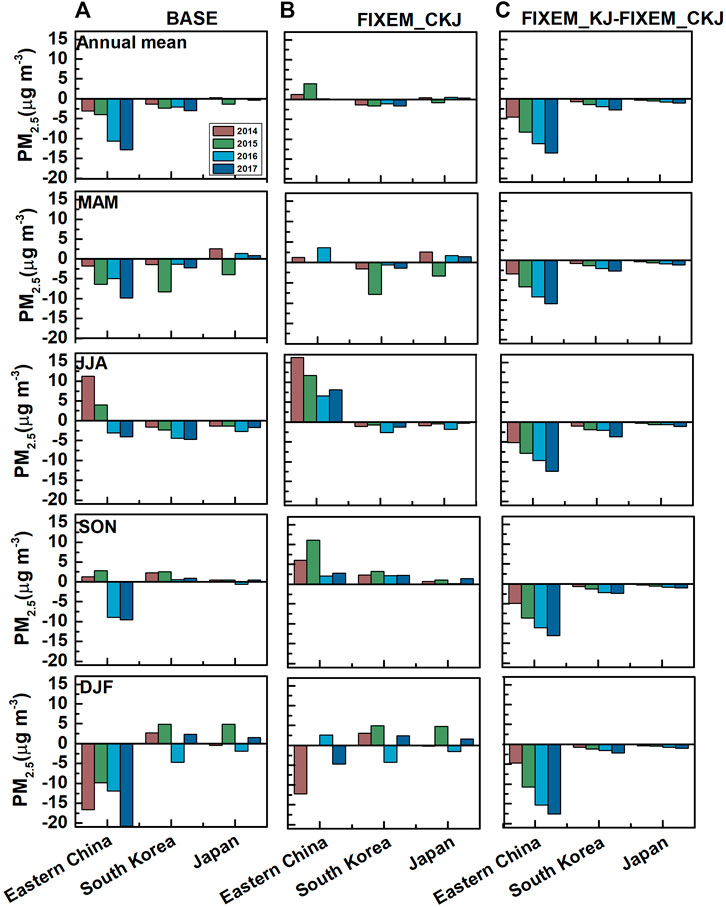
FIGURE 5. The changes in annual or seasonal mean surface PM2.5 concentrations in Eastern China (25–40°N,110–120°E), South Korea (34.3–38°N,126.2–129.5°E) and Japan (38–45°N,139–145°E and 31–38°N,130–141°E) relative to 2013 owing to (A) the changes in both meteorology and in anthropogenic emissions in Asia (BASE simulation) (B) the changes in meteorology alone (FIXEM_CKJ simulation), and (C) the changes in anthropogenic emissions over China (FIXEM_KJ minus FIXEM_CKJ).
In the BASE simulation, from 2013 to 2017, the annual mean PM2.5 concentrations in eastern China were 69.4, 66.3, 65.4, 58.7, and 56.6 μg m−3, respectively. The year by year decreases in PM2.5 concentrations were dominated by the changes in anthropogenic emissions. Relative to 2013, the annual mean PM2.5 concentration in 2017 was reduced by 13.7 μg m−3 from the changes in anthropogenic emission (Figure 5C). The role of meteorology varied with years, which increased PM2.5 by 4.0 μg m−3 in 2015 relative to 2013. Among all seasons, the emission control measures in China were simulated to lead to largest reduction in PM2.5 (−17.6 μg m−3 in 2017 relative to 2013) in eastern China in DJF. The changes in meteorological conditions had larger impacts on PM2.5 concentrations in eastern China in JJA and SON (2.0–16.3 μg m−3) than those in MAM and DJF (−12.2–3.6 μg m−3) (Figure 5B).
In the BASE simulation with combined changes in emissions and meteorology, simulated annual mean PM2.5 concentration in South Korea had a decreasing trend of −0.66 μg m−3 year−1 over 2013–2017 and the annual mean PM2.5 concentration in 2017 was reduced by 3.0 μg m−3 (8.4%) compared to 2013 (Figure 5A). Over 2013–2017, the meteorological changes alone were estimated to lead to a trend of −0.3 μg m−3 year−1 for PM2.5 (Figure 5B), and the changes in anthropogenic emissions in China alone were estimated to lead to a trend of −0.67 μg m−3 year−1 (Figure 5C). Over 2013–2017, the change in PM2.5 of −2.74 μg m−3 by the changes in anthropogenic emissions in China contributed 91% to the change in PM2.5 concentration in South Korea in the BASE simulation. The impacts of changes in Chinese anthropogenic emissions on PM2.5 concentration in South Korea were the largest in JJA, with PM2.5 concentration dropped by 3.8 μg m−3 from 2013 to 2017. The changes in both meteorological conditions and anthropogenic emissions over China led to reductions in PM2.5 concentrations in South Korea, but the changes in anthropogenic emissions over China played a leading role.
Simulated PM2.5 concentrations in Japan exhibited a small trend of −0.09 μg m−3 year−1 over 2013–2017 in the BASE simulation. The annual PM2.5 concentrations in Japan during 2013–2017 were 13.7, 13.9, 12.4, 13.8, and 13.3 μg m−3, respectively. The meteorological changes alone were estimated to lead to an increasing trend of 0.08 μg m−3 year−1, although meteorological conditions led to large reduction (0.84 μg m−3) in PM2.5 in 2015 (Figure 5B). The simulated 2013–2017 trend resulting from changes in anthropogenic emissions over China was −0.26 μg m−3 year−1 (Figure 5C). From 2013 to 2017, the changes in anthropogenic emission in China led to similar changes in PM2.5 concentrations in Japan by −1.2, −1.1, −1.0, and −0.96 μg m−3 in MAM, JJA, SON and DJF, respectively. Therefore, in Japan, changes in meteorological conditions and in anthropogenic emissions in China over 2013–2017 had comparable effects on PM2.5 concentrations but with opposite signs.
Figure 6 shows the simulated spatial distributions of the trends of concentrations of PM2.5 components (sulfate, nitrate, ammonium, BC and OC) over 2013–2017 in East Asia. In the BASE simulation, the concentrations of all aerosol species had downward trends in eastern China, in which sulfate and nitrate had the largest decreases. In the downwind regions of China, sulfate, ammonium, and BC exhibited decreasing trends, nitrate decreased in South Korea and increased in Japan, and OC concentrations had increasing trends in both South Korea and Japan in the BASE simulation. In the FIXEM_CKJ simulation, the trends of all components caused by changes in meteorological conditions had similar spatial distributions, with negative trends in northeastern and southeastern China and South Korea whereas positive trends in central eastern China and Japan. The changes in anthropogenic emissions in China led to reductions in sulfate, ammonium, BC, and OC in the whole of East Asia. However, nitrate aerosol had an increasing trend in the downwind regions of China.
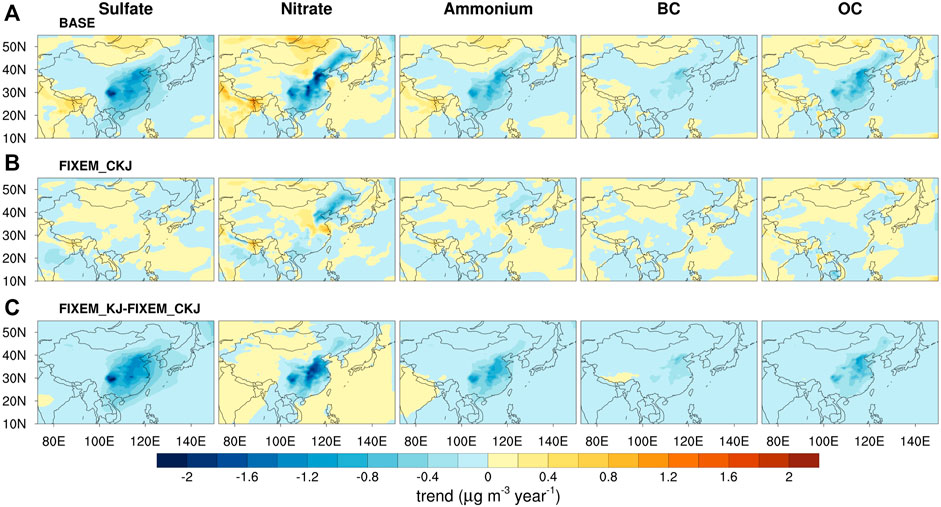
FIGURE 6. Spatial distribution of the trends of simulated surface aerosols (sulfate, nitrate, ammonium, BC and OC) over 2013–2017 in East Asia owing to (A) the changes in both meteorology and in anthropogenic emissions in Asia (BASE simulation) (B) the changes in meteorology alone (FIXEM_CKJ simulation), and (C) the changes in anthropogenic emissions over China (FIXEM_KJ minus FIXEM_CKJ).
The regional trends of aerosol components are summarized in Figure 7. The trends of sulfate, nitrate, ammonium, BC and OC in eastern China in the BASE simulation were −0.86, −0.75, −0.53, −0.24, and −0.53 μg m−3 year−1, respectively, which were much higher than the trends of decreases in South Korea and Japan (Figure 7). These decreasing trends in eastern China were mainly caused by domestic changes in anthropogenic emissions.
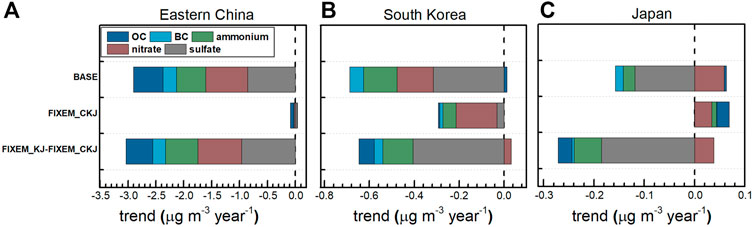
FIGURE 7. Simulated trends of aerosol components (sulfate, nitrate, ammonium, BC and OC) in (A) China (B) South Korea, and (C) Japan over 2013–2017 owing to the changes in both meteorology and in anthropogenic emissions in Asia (BASE simulation), the changes in meteorology alone (FIXEM_CKJ simulation), and the changes in anthropogenic emissions over China (FIXEM_KJ minus FIXEM_CKJ).
In South Korea, sulfate had the largest decreasing trend (−0.32 μg m−3 year−1), followed by nitrate (−0.16 μg m−3 year−1) and ammonium (−0.15 μg m−3 year−1), in the BASE simulation. The changes in anthropogenic emissions in China led to large reductions in sulfate and ammonium whereas an increase in nitrate. Changes in meteorological conditions led to a relatively large decreasing trend of nitrate in South Korea.
The trends of aerosol components in the BASE simulation in Japan were the smallest among the three countries. The trends of aerosol concentrations influenced by meteorology were positive for all aerosol species. The changes in anthropogenic emissions over China had similar impacts on aerosol components in Japan as compared to South Korea. Nitrate concentrations increased in Japan from 2013 to 2017 by changes both in anthropogenic emissions in China and in meteorological fields.
To summarize, the changes in anthropogenic emissions over China in 2013–2017 had the largest impacts on sulfate concentrations in South Korea and Japan, leading to large reductions in sulfate. On the contrary, the changes in meteorology had almost no effect on sulfate in South Korea and Japan. Over 2013–2017, anthropogenic emissions of nitrate precursors of NOx and NH3 were reduced by 20.7 and 3.4% in China, respectively, and the concentrations of nitrate were reduced in China. However, the changes in anthropogenic emissions over China led to an increasing trend of nitrate in South Korea and Japan, which can be explained by that the reductions in SO2 emissions changed the balance of the ammonia–nitric acid–sulfuric acid–water system, creating free NH3 that reacted with HNO3 to form NH4NO3 (Bae et al., 2021; Uno et al., 2020).
In order to have a clearer understanding of the impacts of reductions in anthropogenic emissions in China as well as the changes in meteorological conditions on PM2.5 in South Korea and Japan, we analyzed the changes in mass outflow from eastern China during 2013–2017. Figure 8 shows the simulated annual and seasonal mass fluxes of PM2.5 and zonal winds across the selected plane from the surface to 100 hPa altitude and from 25°N to 55°N along 120°E in the BASE simulation. The maximum mass fluxes of PM2.5 were located at 700–1,000 hPa. On an annual mean basis, a maximum flux was located over 40°N throughout 2013–2017, and another maximum flux occurred over 46°N in 2016 and 2017 due to the strengthening of the westerlies in this location in MAM and DJF of 2016 and in SON and DJF of 2017.
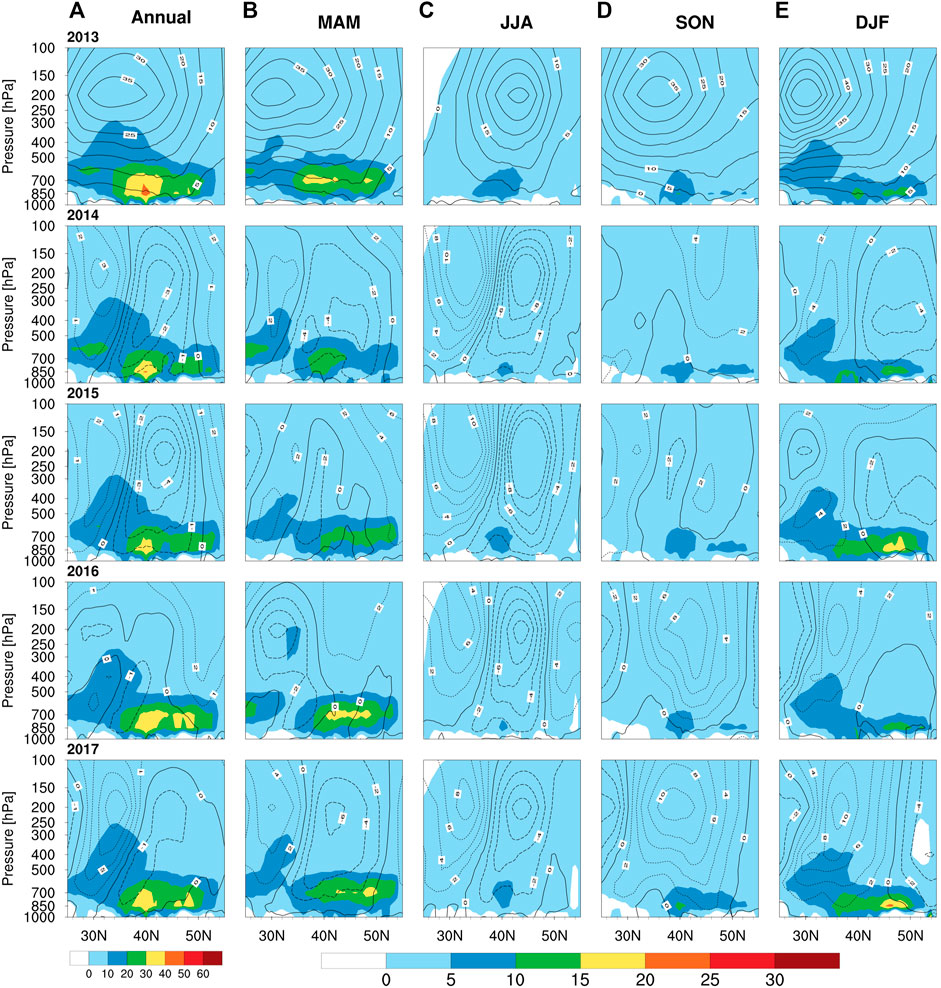
FIGURE 8. Simulated (A) annual and (B–E) seasonal mass fluxes of PM2.5 as well as zonal winds from 2013 to 2017 from the BASE simulation. The mass fluxes of PM2.5 are shown by shades (units: 106 kg), and winds are represented by contours (units: m s−1). The winds in 2013 are represented by solid line (top row). In each of 2014–2017, the differences in zonal winds between this year and 2013 are shown (this year minus 2013) (long dashed lines indicate negative values, short dashed lines indicate positive values, and solid lines indicate no changes in wind speed). Both mass fluxes and winds are those through the meridional plane from the surface to 100 hPa altitude and from 25°N to 55°N along 120°E.
As summarized in Table 3, the seasonal outflow flux of PM2.5 peaked in MAM of every year as a result of the strong westerlies, although PM2.5 levels in MAM in China were not the highest (Figure 2). The mass outflow of PM2.5 was the lowest in JJA, which was caused by the lowest concentrations of PM2.5 in China as well as the weakest westerlies in this season (Figure 8). From 2013 to 2017, the annual flux of PM2.5 was the highest in 2013 and the lowest in 2015 (Table 3). The annual mean westerlies were the weakest over 25°-55°N in 2015 (Figure 8). Compared to 2013, the flux of PM2.5 decreased by 15.1% in MAM of 2015, but increased by 28.0% in DJF of 2015. These yearly changes in simulated mass fluxes of PM2.5 led to corresponding changes in simulated PM2.5 concentrations in South Korea and Japan (Relative to 2013, the PM2.5 concentrations in South Korea and Japan from the BASE simulation decreased significantly in MAM of 2015 and increased largely in DJF of 2015, Figure 5). The interannual and seasonal variations in mass flux are mainly driven by the changes in meteorological parameters (Holzer et al., 2005; Yang et al., 2015). With the changes in both emissions and meteorology, from 2013 to 2017, the annual mass fluxes of PM2.5 from eastern China had a linear increasing trend of 13.1 × 10⁶ kg yr−1 in the BASE simulation. However, the trend of flux was −99.4 × 10⁶ kg yr−1 over 2013–2017 with changes in anthropogenic emissions in China alone (FIXEM_KJ minus FIXEM_CKJ).
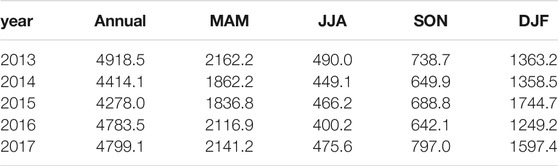
TABLE 3. Simulated outflow of PM2.5 from eastern China through the meridional plane from the surface to 100 hPa altitude and from 25°N to 55°N along 120°E. The units are 106 kg season−1 for seasonal fluxes and 106 kg yr−1 for annual fluxes of PM2.5.
Over 2013–2017, the changes in meteorological conditions have different effects on PM2.5 concentrations in South Korea and Japan. The changes in meteorological conditions led to a decreasing trend of 0.30 μg m−3 year−1 in PM2.5 concentration in South Korea, whereas an increasing trend of 0.08 μg m−3 year−1 in Japan (Figure 5B). Therefore, to further understand the impacts of meteorological fields on PM2.5 in South Korea and Japan, we calculated the trends of annual mean temperature, relative humidity (RH) and planetary boundary layer height (PBLH) as well as the trend of annual total precipitation over 2013–2017 (Figure 9).
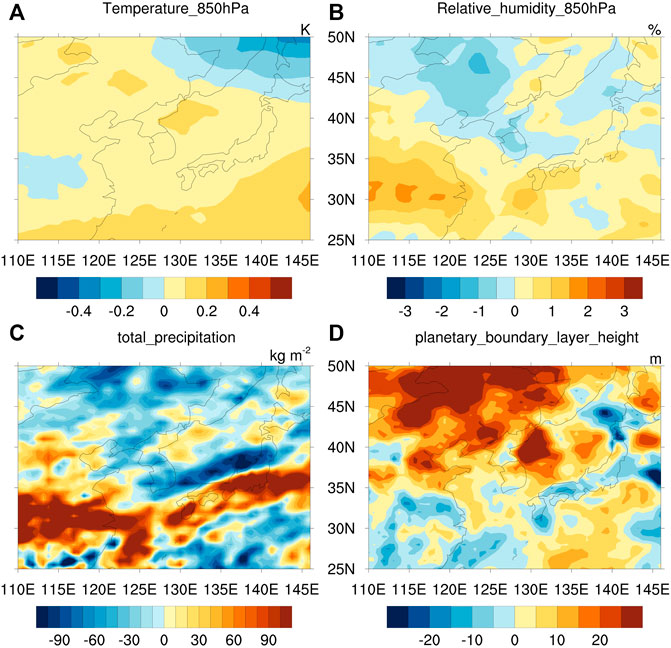
FIGURE 9. Linear regression trends of annual mean (A) temperature (B) relative humidity, and (D) planetary boundary layer height from 2013 to 2017 (C) Linear regression trends of annual total precipitation from 2013–2017. Temperature, RH, PBLH and precipitation are from the MERRA-2 reanalysis data from the NASA Goddard Earth Sciences (GES) Data and Information Services Center.
Temperature and RH can affect the thermodynamics of ammonium nitrate formation. In South Korea, the combined effect of increases in temperature and decreases in RH had an effect of reducing nitrate concentrations from 2013 to 2017 (Zhai et al., 2021) (Figure 7B). In South Korea, from 2013 to 2017, PBLH had an increasing trend, which increased the diffusion of pollutants and also reduced PM2.5 concentrations. Although precipitation decreased in South Korea, the overall impact of meteorological conditions in South Korea was to reduce PM2.5 over 2013–2017. In Japan, temperature and RH increased whereas PBLH decreased over 2013–2017. The increases in temperature could increase sulfate but reduce nitrate (Aw and Kleeman 2003). Higher RH was reported to increase the formation of secondary aerosols through enhanced chemical reactions (Yin et al., 2016). The decreases in PBLH in Japan restrained vertical mixing and lead to the accumulation of particles (Gao et al., 2015). The spatial distributions of changes in precipitation in Japan were uneven. As a result, the meteorological conditions in Japan led to increases of PM2.5.
We examined the impacts of reductions in anthropogenic emissions over China and/or changes in meteorological conditions over 2013–2017 on PM2.5 and its components in South Korea and Japan. The seasonal variation, interannual variation, and trend of PM2.5 and its components in China, South Korea and Japan were simulated using the GEOS-Chem model driven by the MERRA-2 meteorological fields. The impacts of variations in anthropogenic emissions and in meteorological parameters were imposed separately and together by sensitivity studies.
From 2013–2017, with the changes in both anthropogenic emissions and meteorology (BASE simulation), the trends of simulated annual mean PM2.5 concentration in eastern China, South Korea, and Japan were −3.33, −0.66, and −0.09 μg m−3 year−1, respectively, in which the reductions in anthropogenic emissions in China played a dominant role compared to that of meteorology. From 2013 to 2017, the annual mean PM2.5 concentrations in eastern China, South Korea, and Japan were reduced by 12.8 (18.5%), 3.0 (8.3%), and 0.36 (2.7%) μg m−3, respectively. The reductions in anthropogenic emissions in China (FIXEM_KJ minus FIXEM_CKJ) over 2013–2017 alone led to reductions in annual mean PM2.5 concentrations by 13.7 (19.7%), 2.7 (7.7%), and 1.0 (7.9%) μg m−3 in eastern China, South Korea, and Japan, respectively. The changes in meteorological fields (FIXEM_CKJ simulation) were also important for PM2.5 concentrations in South Korea and Japan. From 2013 to 2017, the changes in meteorological conditions led to reductions in PM2.5 concentration in South Korea by 4.7% and increases in PM2.5 concentration in Japan by 2.5%.
From 2013 to 2017, the reductions in anthropogenic emissions in China (FIXEM_KJ minus FIXEM_CKJ) also changed the components of PM2.5 in South Korea and Japan. The changes in anthropogenic emissions in China led to reductions in sulfate, ammonium, BC and OC concentrations whereas increases of nitrate in both South Korea and Japan. The reductions in SO2 emissions in China changed the balance of the ammonia–nitric acid–sulfuric acid–water system, creating free NH3 that reacted with HNO3 to form NH4NO3. In South Korea, the proportions of sulfate, nitrate, and OC in PM2.5 were, respectively, 17.1, 44.4, and 15.8% in 2013, and 14.3, 46.0, and 17.8% in 2017. In Japan, the fractions of sulfate, nitrate, and OC in PM2.5 were 27.2, 30.5, and 20.0% in 2013 while 23.7, 33.2, and 21.6% in 2017, respectively. The changes in anthropogenic emissions in China instead of the changes in meteorology dominated this compositional shift.
Model results shown here are helpful for understanding the temporal evolution in the PM2.5 on different timescales in the downwind regions of China. Conclusions from this work also have important implications for air quality planning, which needs to account for changes in emissions in the upwind countries. It should be noted that our model results may have uncertainties, especially from the uncertainties in emissions inventories. First, the anthropogenic emissions in other regions except Asia were fixed at the 2013 levels in the BASE simulation, which could not account for the effects of changes in emissions outside Asia. Second, the REAS emission inventory is available only up to 2015, so anthropogenic emissions from REAS in 2016 and 2017 were obtained by linear extrapolation of the values over 2012–2015 for each grid. Third, since we were focused on the impact of the Chinese Governmental “Action Plan on the Prevention and Control of Air Pollution,” we did not account for the role of natural aerosols such as mineral dust and sea salt in this work. All these aspects can be improved in future studies.
The raw data supporting the conclusions of this article will be made available by the authors, without undue reservation.
HL designed the study and PX wrote the first version of paper. PX performed model simulations and analyzed the data. HL and PX wrote the final versions of manuscript together.
This work was supported by the National Natural Science Foundation of China (grant no. 42021004), the National Key Research and Development Program of China (grant no. 2019YFA0606804), and the Major Research Plan of the National Social Science Foundation (grant no.18ZDA052).
The authors declare that the research was conducted in the absence of any commercial or financial relationships that could be construed as a potential conflict of interest.
All claims expressed in this article are solely those of the authors and do not necessarily represent those of their affiliated organizations, or those of the publisher, the editors and the reviewers. Any product that may be evaluated in this article, or claim that may be made by its manufacturer, is not guaranteed or endorsed by the publisher.
The Supplementary Material for this article can be found online at: https://www.frontiersin.org/articles/10.3389/fenvs.2022.841285/full#supplementary-material
Aikawa, M., Ohara, T., Hiraki, T., Oishi, O., Tsuji, A., Yamagami, M., et al. (2010). Significant Geographic Gradients in Particulate Sulfate over Japan Determined from Multiple-Site Measurements and a Chemical Transport Model: Impacts of Transboundary Pollution from the Asian Continent. Atmos. Environ. 44 (3), 381–391. doi:10.1016/j.atmosenv.2009.10.025
Alexander, B., Park, R. J., Jacob, D. J., Li, Q. B., and Yantosca, R. M. (2005). Sulfate Formation in Sea-Salt Aerosols: Constraints from Oxygen Isotopes. J. Geophys. Res. 110, D10307. doi:10.1029/2004jd005659
Aw, J., and Kleeman, M. J. (2003). Evaluating the First-Order Effect of Intraannual Temperature Variability on Urban Air Pollution. J. Geophys. Res. 108 (D12), 4365. doi:10.1029/2002JD002688
Bae, M., Kim, B.-U., Kim, H. C., Kim, J., and Kim, S. (2021). Role of Emissions and Meteorology in the Recent PM2.5 Changes in China and South Korea from 2015 to 2018. Environ. Pollut. 270, 116233. doi:10.1016/j.envpol.2020.116233
Bhardwaj, P., Ki, S. J., Kim, Y. H., Woo, J. H., Song, C. K., Park, S. Y., et al. (2019). Recent Changes of Trans-boundary Air Pollution over the Yellow Sea: Implications for Future Air Quality in South Korea. Environ. Pollut. 247, 401–409. doi:10.1016/j.envpol.2019.01.048
Eckhardt, S., Stohl, A., Wernli, H., James, P., Forster, C., and Spichtinger, N. (2004). A 15-year Climatology of Warm Conveyor Belts. J. Clim. 17, 218–237. doi:10.1175/1520-0442(2004)017<0218:aycowc>2.0.co;2
Fairlie, T. D., Jacob, D. J., and Park, R. J. (2007). The Impact of Transpacific Transport of mineral Dust in the United States. Atmos. Environ. 41 (6), 1251–1266. doi:10.1016/j.atmosenv.2006.09.048
Gao, Y., Zhang, M., Liu, Z., Wang, L., Wang, P., Xia, X., et al. (2015). Modeling the Feedback between Aerosol and Meteorological Variables in the Atmospheric Boundary Layer during a Severe Fog-Haze Event over the North China Plain. Atmos. Chem. Phys. 15, 4279–4295. doi:10.5194/acp-15-4279-2015
Gelaro, R., McCarty, W., Suárez, M. J., Todling, R., Molod, A., Takacs, L., et al. (2017). The Modern-Era Retrospective Analysis for Research and Applications, Version 2 (MERRA-2). J. Clim. 30 (14), 5419–5454. doi:10.1175/jcli-d-16-0758.1
Guenther, A., Karl, T., Harley, P., Wiedinmyer, C., Palmer, P. I., and Geron, C. (2006). Estimates of Global Terrestrial Isoprene Emissions Using MEGAN (Model of Emissions of Gases and Aerosols from Nature). Atmos. Chem. Phys. 6 (11), 3181–3210. doi:10.5194/acp-6-3181-2006
Hoesly, R. M., Smith, S. J., Feng, L., Klimont, Z., Janssens-Maenhout, G., Pitkanen, T., et al. (2018). Historical (1750-2014) Anthropogenic Emissions of Reactive Gases and Aerosols from the Community Emissions Data System (CEDS). Geosci. Model. Dev. 11 (1), 369–408. doi:10.5194/gmd-11-369-2018
Holzer, M., Hall, T. M., and Stull, R. B. (2005). Seasonality and Weather-Driven Variability of Transpacific Transport. J. Geophys. Res. 110, D23103. doi:10.1029/2005jd006261
IPCC (2021). Climate Change 2021: The Physical Science Basis. United Kingdom and New York, NY, USA: Cambridge University Press.
Kanaya, Y., Yamaji, K., Miyakawa, T., Taketani, F., Zhu, C., Choi, Y., et al. (2020). Rapid Reduction in Black Carbon Emissions from China: Evidence from 2009-2019 Observations on Fukue Island, Japan. Atmos. Chem. Phys. 20, 6339–6356. doi:10.5194/acp-20-6339-2020
Kumar, N., Park, R. J., Jeong, J. I., Woo, J.-H., Kim, Y., Johnson, J., et al. (2021). Contributions of International Sources to PM2.5 in South Korea. Atmos. Environ. 261, 118542. doi:10.1016/j.atmosenv.2021.118542
Kurokawa, J., and Ohara, T. (2020). Long-term Historical Trends in Air Pollutant Emissions in Asia: Regional Emission Inventory in ASia (REAS) Version 3. Atmos. Chem. Phys. 20 (21), 12761–12793. doi:10.5194/acp-20-12761-2020
Lee, H.-J., Kim, J. E., Cha, J. W., Song, S., Ryoo, S.-B., and Kim, Y. P. (2018). Characteristics of Long-Lasting Haze Episodes Observed in Seoul, South Korea, for 2009-2014. Theor. Appl. Climatol 136 (1-2), 55–64. doi:10.1007/s00704-018-2415-7
Lee, H.-M., Park, R. J., Henze, D. K., Lee, S., Shim, C., Shin, H.-J., et al. (2017). PM2.5 Source Attribution for Seoul in May from 2009 to 2013 Using GEOS-Chem and its Adjoint Model. Environ. Pollut. 221, 377–384. doi:10.1016/j.envpol.2016.11.088
Lee, S., Ho, C.-H., and Choi, Y.-S. (2011). High-PM10 Concentration Episodes in Seoul, Korea: Background Sources and Related Meteorological Conditions. Atmos. Environ. 45 (39), 7240–7247. doi:10.1016/j.atmosenv.2011.08.071
Lee, S., Kim, J., Choi, M., Hong, J., Lim, H., Eck, T. F., et al. (2019). Analysis of Long-Range Transboundary Transport (LRTT) Effect on Korean Aerosol Pollution during the KORUS-AQ Campaign. Atmos. Environ. 204, 53–67. doi:10.1016/j.atmosenv.2019.02.020
Liu, H., Jacob, D. J., Bey, I., and Yantosca, R. M. (2001). Constraints from210Pb and7Be on Wet Deposition and Transport in a Global Three-Dimensional Chemical Tracer Model Driven by Assimilated Meteorological fields. J. Geophys. Res. 106 (D11), 12109–12128. doi:10.1029/2000jd900839
Park, E. H., Heo, J., Hirakura, S., Hashizume, M., Deng, F., Kim, H., et al. (2018). Characteristics of PM2.5 and its Chemical Constituents in Beijing, Seoul, and Nagasaki. Air Qual. Atmos. Health 11 (10), 1167–1178. doi:10.1007/s11869-018-0616-y
Park, R. J., Jacob, D. J., Chin, M., and Martin, R. V. (2003). Sources of Carbonaceous Aerosols over the United States and Implications for Natural Visibility. J. Geophys. Res. 108 (D12), 4355. doi:10.1029/2002jd003190
Park, R. J., Jacob, D. J., Field, B. D., Yantosca, R. M., and Chin, M. (2004). Natural and Transboundary Pollution Influences on Sulfate-Nitrate-Ammonium Aerosols in the United States: Implications for Policy. J. Geophys. Res. 109, D15204. doi:10.1029/2003jd004473
Pye, H. O. T., Liao, H., Wu, S., Mickley, L. J., Jacob, D. J., Henze, D. K., et al. (2009). Effect of Changes in Climate and Emissions on Future Sulfate-Nitrate-Ammonium Aerosol Levels in the United States. J. Geophys. Res. 114, D01205. doi:10.1029/2008jd010701
Qu, Y., An, J., He, Y., and Zheng, J. (2016). An Overview of Emissions of SO 2 and NO X and the Long-Range Transport of Oxidized Sulfur and Nitrogen Pollutants in East Asia. J. Environ. Sci. 44, 13–25. doi:10.1016/j.jes.2015.08.028
Stohl, A., Eckhardt, S., Forster, C., James, P., and Spichtinger, N. (2002). On the Pathways and Timescales of Intercontinental Air Pollution Transport. J.-Geophys.-Res. 107 (D23), 4684. doi:10.1029/2001jd001396
Uno, I., Wang, Z., Itahashi, S., Yumimoto, K., Yamamura, Y., Yoshino, A., et al. (2020). Paradigm Shift in Aerosol Chemical Composition over Regions Downwind of China. Sci. Rep. 10 (1), 6450. doi:10.1038/s41598-020-63592-6
van der Werf, G. R., Randerson, J. T., Giglio, L., van Leeuwen, T. T., Chen, Y., Rogers, B. M., et al. (2017). Global Fire Emissions Estimates during 1997-2016. Earth Syst. Sci. Data 9 (2), 697–720. doi:10.5194/essd-9-697-2017
Wesely, M. (2007). Parameterization of Surface Resistances to Gaseous Dry Deposition in Regional-Scale Numerical Models☆. Atmos. Environ. 41, 52–63. doi:10.1016/j.atmosenv.2007.10.058
Yang, Y., Liao, H., and Lou, S. (2015). Decadal Trend and Interannual Variation of Outflow of Aerosols from East Asia: Roles of Variations in Meteorological Parameters and Emissions. Atmos. Environ. 100, 141–153. doi:10.1016/j.atmosenv.2014.11.004
Yim, S. H. L., Gu, Y., Shapiro, M. A., and Stephens, B. (2019). Air Quality and Acid Deposition Impacts of Local Emissions and Transboundary Air Pollution in Japan and South Korea. Atmos. Chem. Phys. 19 (20), 13309–13323. doi:10.5194/acp-19-13309-2019
Yin, Q., Wang, J., Hu, M., and Wong, H. (2016). Estimation of Daily PM 2.5 Concentration and its Relationship with Meteorological Conditions in Beijing. J. Environ. Sci. 48, 161–168. doi:10.1016/j.jes.2016.03.024
Zhai, S., Jacob, D. J., Wang, X., Liu, Z., Wen, T., Shah, V., et al. (2021). Control of Particulate Nitrate Air Pollution in China. Nat. Geosci. 14 (6), 389–395. doi:10.1038/s41561-021-00726-z
Zhai, S., Jacob, D. J., Wang, X., Shen, L., Li, K., Zhang, Y., et al. (2019). Fine Particulate Matter (PM2.5) Trends in China, 2013-2018: Separating Contributions from Anthropogenic Emissions and Meteorology. Atmos. Chem. Phys. 19 (16), 11031–11041. doi:10.5194/acp-19-11031-2019
Zhang, L., Liao, H., and Li, J. (2010). Impacts of Asian Summer Monsoon on Seasonal and Interannual Variations of Aerosols over Eastern China. J. Geophys. Res. 115, D00K05. doi:10.1029/2009JD012299
Keywords: PM2.5, anthropogenic emissions, meteorology, China, South Korea, Japan
Citation: Xie P and Liao H (2022) The Impacts of Changes in Anthropogenic Emissions Over China on PM2.5 Concentrations in South Korea and Japan During 2013–2017. Front. Environ. Sci. 10:841285. doi: 10.3389/fenvs.2022.841285
Received: 22 December 2021; Accepted: 12 January 2022;
Published: 09 February 2022.
Edited by:
Yang Gao, Ocean University of China, ChinaReviewed by:
Kan Huang, Fudan University, ChinaCopyright © 2022 Xie and Liao. This is an open-access article distributed under the terms of the Creative Commons Attribution License (CC BY). The use, distribution or reproduction in other forums is permitted, provided the original author(s) and the copyright owner(s) are credited and that the original publication in this journal is cited, in accordance with accepted academic practice. No use, distribution or reproduction is permitted which does not comply with these terms.
*Correspondence: Hong Liao, aG9uZ2xpYW9AbnVpc3QuZWR1LmNu
Disclaimer: All claims expressed in this article are solely those of the authors and do not necessarily represent those of their affiliated organizations, or those of the publisher, the editors and the reviewers. Any product that may be evaluated in this article or claim that may be made by its manufacturer is not guaranteed or endorsed by the publisher.
Research integrity at Frontiers
Learn more about the work of our research integrity team to safeguard the quality of each article we publish.