 Gary Ossmar Lara-Topete1
 Carlos Yebra-Montes2
 Danielle A. Orozco-Nunnelly3
 Carlos Eduardo Robles-Rodríguez4
 Misael Sebastián Gradilla-Hernández1*
- 1Tecnologico de Monterrey, Escuela de Ingenieria y Ciencias, Zapopan, Mexico
- 2ENES-León, Universidad Nacional Autónoma de México, León, Guanajuato, Mexico
- 3Department of Biology, Valparaiso University, Valparaiso, IN, United States
- 4TBI, Université de Toulouse, CNRS, INRAE, INSA, Toulouse, France
Most of the municipal solid waste (MSW) in developing countries ends up in landfills. For example, more than 95% of the MSW generated in Latin America is disposed of in some type of landfill. Factors such as high organic compositions, low recycling rates and poor control over the disposal sites greatly increase the environmental impacts associated with MSW management in this region, resulting in increased emissions of greenhouse gases (GHGs) and runoff of leachates. Therefore, local governments in Latin America are making efforts to transition to more “circular” management models for MSW. This is the case in the Guadalajara Metropolitan Area (GMA), the third most populous city in Mexico, where the implementation of the following two mechanical biological treatment (MBT) alternatives are being considered: 1) a high-capacity mechanical sorting facility with no biological treatment and 2) a medium-capacity mechanical sorting facility coupled with a composting process. Thus, the aim of the present study was to assess the environmental performance of the current MSW management system (baseline) as compared to the two potential MBT alternatives through life cycle assessment (LCA) and sensitivity analyses. Furthermore, by using a SWOT analysis, this study aimed to provide insights into the main economical, sociocultural, legal, political and technological/infrastructure challenges that need to be overcome in the GMA, as well as other cities in developing countries, in order to transition to circular MSW management models. An assessment of global warming potential (measured in Gg CO2-eq/year) indicated that the current MSW management system (baseline) results in the emission of 111.21 Gg CO2-eq/year, while the two potential alternative scenarios displayed a net emissions reduction of 24 and 34%, respectively, due to material recycling and the substitution of petroleum coke with refuse-derived fuel (RDF) in cement kilns. When evaluating abiotic resource depletion (measured in Gg Sb-eq/year), the potential alternative scenarios both outperformed the baseline with savings increases between 3,380 and 3,501%. This result is largely attributed to the decrease in fossil fuel consumption (due to the substitution of petroleum coke with RDF), which provides a potential reduction of 5.62 Gg Sb-eq/year. The sensitivity analysis revealed that several key parameters, such as the fraction of food and plastic wastes in the MSW, can alter the scenario rankings. Recycling of the recovered materials and treatment of the organic fraction were found to be key strategies for a reduction in direct environmental impacts. Additionally, better management of waste picker activities, standardization of landfill operations and enhancement of material separation and selective collection must be addressed prior to the introduction of new treatment technologies. The results of the study herein can assist in the formation of policies to improve the feasibility of MBT implementation and drive the first steps towards a circular economy model in the GMA, as well as other cities within Latin American and Caribbean regions with similar characteristics.
1 Introduction
Rapid population growth coupled with unsustainable consumption habits in developing countries has led to multiple environmental problems, including a considerable increase in the generation of municipal solid waste (MSW) (Ghanimeh et al., 2019). Current waste management practices in Latin America and the Caribbean (LAC) are highly focused on a ‘concentrate and contain’ approach, where disposal of waste into landfills is the predominant practice, because it represents the cheapest and simplest means of elimination (Castrejón-Godínez et al., 2015). More than two-thirds of the waste generated in the LAC region is disposed of in landfills (controlled or sanitary), while open dumping (uncontrolled landfilling) accounts for about 27% of waste disposal (Kaza et al., 2018). Recycling and composting systems are still emerging across the LAC region, and the extent of implementation varies by country. In general, only 4.5% of MSW is recycled in this region, and less than 1% undergoes treatment methods, such as anaerobic digestion, composting or incineration (Kaza et al., 2018).
In Mexico, approximately 65% of the MSW generated is disposed of in a controlled landfill, while 30% ends up in open dumps, and only 5% is recycled (Güereca et al., 2015). However, controlled landfills vary greatly in their technical quality, and, in most cases, they do not meet the minimum requirements (SEMARNAT, 2020) of disposal established by the applicable regulatory body (DOF, 2003). Additionally, mixed collection is still a predominant practice, as only 4.39% of MSW is source-separated, and only 7.44% of the daily MSW generated in Mexico is sent to a sorting plant to recover valuable materials, where the average recycling efficiency is 3.1%. There is no official data regarding the daily total organic waste treated in Mexico (SEMARNAT 2020).
Thus, the prevailing MSW management model in Mexico follows a linear scheme, where mixed MSW is collected from households and transported either by municipality collection vehicles or by private operators, who deliver the waste to the sanitary landfill, or in some cases, first to transfer stations, where waste pickers (WP) manually select the recoverable materials prior to sending the MSW to the sanitary landfill (Aristóteles et al., 2017). The disposal of untreated MSW in sanitary landfills results in two major problems: 1) a poor reincorporation rates of different recoverable materials into productive chains (Tsydenova et al., 2018), which implies the loss of their potential for reuse, recycling or energy recovery (Menikpura et al., 2013) and 2) emissions of pollutants or toxic compounds (Torretta et al., 2017) into the environment, including leachates, greenhouse gases (GHGs), like methane (CH4), and carbon dioxide (CO2) (Saier, 2007). These emissions represent a potential risk to human health and to other living organisms (Salmerón-Gallardo, 2016).
In light of these environmental issues, several solid waste treatment technologies, such as incineration, gasification, anaerobic digestion, composting and mechanical biological treatment (MBT), have been implemented, mainly in developed countries, to increase the circularity of MSW management systems and, consequently, mitigate the associated environmental and health hazards (Hoornweg and Bhada-Tata, 2012). Particularly, MBT is a technology which combines the mechanical separation of recoverable materials with the biological stabilization of organic matter, by processes such as anaerobic digestion or composting (Stegmann, 2018). The mechanical separation stage allows for material recovery (Di Lonardo et al., 2012), mainly of plastics and metals, which can be reincorporated into productive chains, while the biological stabilization reduces the biodegradable organic content of waste, which translates into a reduction in the generation of leachates (Sánchez et al., 2015) and landfill gases (van Praagh et al., 2009).
The work herein focuses on the Guadalajara Metropolitan Area (GMA), one of the most populous cities in Mexico, which has reported several problems regarding the management of MSW in the last several decades (Aristóteles et al., 2017). Currently, around 55% (2,810.87 tons/day) of the total GMA MSW generation is sent to the ‘Los Laureles’ landfill, a disposal site that has received criticism due to their poor operation conditions, which have caused severe environmental and health impacts, mainly by leachate runoff entering ground and surface water sources, as well as GHGs emissions and micro-scale burning of waste (CEDHJ, 2020). Moreover, in 2019, the Jalisco´s Human Rights Commission requested the permanent closure of ‘Los Laureles’ landfill due to a 5-day fire that caused an emergency in the GMA due to the resulting poor air quality (CEDHJ, 2020). In response to all the problems of the ‘Los Laureles’ landfill site, the State Government pledged to fully close it by 2022 and to replace it with a new sanitary landfill. Furthermore, local authorities are working on a public agenda to implement a more circular MSW management model, which considers the introduction of MBT technologies (PGEJ, 2019). Two potential scenarios are currently being considered: the first includes a high-capacity (1,000 ton/day) mechanical sorting facility with no biological treatment, while the second contemplates a medium-capacity (500 ton/day) mechanical sorting facility coupled with a composting process (Section 2.3.2 provides a full description of these scenarios). However, even though MBT has already been implemented for more than 20 years in developed countries, such as Croatia (Sarc et al., 2018), Poland (Połomka & Jędrczak, 2019), Germany (Vielhaber, 2015), France (Bayard et al., 2010) and Italy (Trulli et al., 2018), further research is needed to determine if these systems should be promoted in developing countries, such as those in the LAC region, where environmental, sociocultural, technological and geopolitical conditions can significantly affect the implementation of MBT plants.
Life cycle assessment (LCA) has been extensively applied to systematically evaluate the environmental impacts of waste management scenarios (Brancoli & Bolton, 2019) and to guide policy decisions (relating to environmental, economic and social topics) towards best management alternatives (Abeliotis et al., 2012). Furthermore, previous studies have been recently conducted in developing countries to assess the environmental performance of MBT. For instance, Tsydenova (2017) compared GHG emissions under the five following MSW management scenarios in the Toluca region of Mexico: 1) landfilling, 2) landfilling with landfill gas recovery, 3) direct incineration, 4) MBT with landfilling, and 5) anaerobic digestion within the landfill. The author concluded that the replacement of the landfill for alternatives 2, 3 or 4 could significantly reduce GHG emissions. Moreover, Fei et al. (2018) employed LCA to compare the environmental performances of five MSW treatment alternatives for the city of Changzhou located in Jiangsu Province in China. The alternatives compared by these authors were: 1) landfilling with landfill gas converted to electricity, 2) landfilling with landfill converted to natural gas, 3) direct incineration, 4) MBT with incineration and biogas converted to electricity, and 5) MBT with incineration and biogas converted to natural gas. The authors concluded that the alternatives including MBT, displayed the best environmental performance and were promising even when source separation was inefficient. More recently, Silva et al. (2021) conducted an LCA to compare four MSW management scenarios in the city of Brasilia, Brazil: 1) the most common practice (direct landfilling) and (2, 3, 4) three scenarios, including MBT and the production of refuse-derived fuel (RDF) by two existing plants that were evaluated individually and in combination. The authors concluded that the introduction of MBT and RDF production systems reduced emissions by up to 23%. Despite this existing literature, there is still a lack of integrated assessments for different MBT configurations in a city of a developing country, which consider the local sociocultural, economical and geopolitical factors. Furthermore, to the best of the author’s knowledge, there are no studies that go beyond the environmental assessment and which provide insights into the main economical, sociocultural, legal, political and technological/infrastructure challenges that need to be overcome by cities in developing countries to be able to transition to circular economy MSW management models.
Therefore, the aim of the present work was 1) to assess the environmental performance of the current MSW management system in the GMA and to compare it with two potential alternative scenarios (with different MBT configurations) currently being considered by the local authorities, through Life Cycle Assessment (LCA); 2) to evaluate the effect that key parameters, such as MSW composition, can have on the scenario rankings; 3) to provide insights into the main economical, sociocultural, legal, political and technological/infrastructure challenges that need to be overcome in the GMA and in other similar cities in developing countries, in order to transition to a circular economy MSW management model; and 4) to provide guidance for the development of policies that can improve the feasibility of MBT implementation and drive the first steps towards a circular economy model in the GMA, as well as in other cities with similar characteristics. To achieve these goals, an MSW composition characterization was conducted to determine the potential for material recovery. Then, an LCA was employed to compare the environmental performance of the current scenario (baseline) with two potential alterative MSW management scenarios considering a cradle-to-cradle approach. Additionally, a sensitivity analysis was conducted to assess how the performance of all three management scenarios is affected by changes in three input variables: MSW composition, percentage of source-separated MSW and percentage of gas recovered and flared at the sanitary landfill. Finally, through a SWOT approach, this study identified the main strengths, weaknesses, opportunities and threats to the GMA under the current MSW management system.
2 Materials and Methods
2.1 Study Area
The GMA is in the central region of the State of Jalisco, and with approximately five million inhabitants, it is the third most populous city in all of Mexico (IIEG, 2017). The GMA covers an area of 3,265.5 km2 and integrates nine municipalities with a total urbanization rate of 78% (IMEPLAN, 2015). The GMA has a per capita MSW generation of 1.02 kg/day, which translates into 5,100 tons of MSW per day (Aristóteles et al., 2017). Within the GMA, the subsystem under study in this work (Figure 1) integrates the municipalities of Guadalajara, Tlajomulco, Tonalá and El Salto, which can be analyzed as a cluster (subsystem), as of all these municipalities currently dispose of their MSW in the ‘Los Laureles’ sanitary landfill without any associated treatment or recovery processes. This subsystem produces 2,861.17 ton of MSW per day (56.1% of the total for GMA) (Aristóteles et al., 2017).
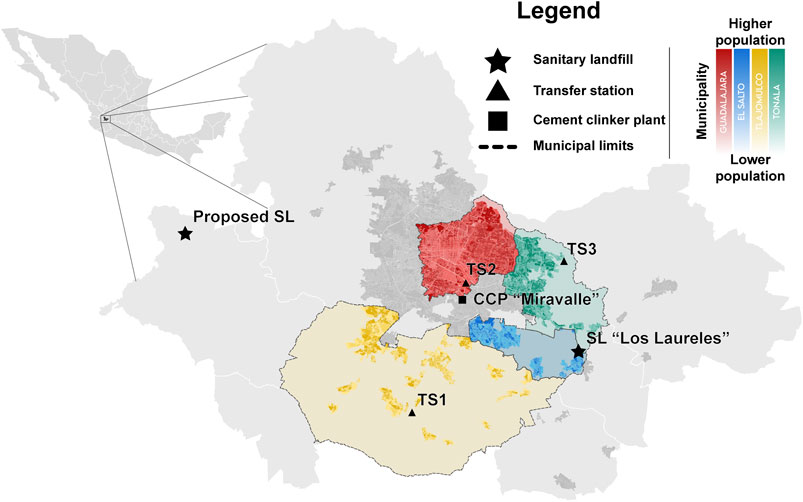
FIGURE 1. GMA subsystem under study and location of MSW management facilities in the area. Sanitary Landfill (SL), Transfer Station ‘La Cajilota’ (TS1), Transfer Station ‘18 de marzo’ (TS2), Transfer Station ‘Coyula Matatlan’ (TS3), Cement clinker plant ‘Miravalle’ (CCP).
2.2 Estimation of the GMA MSW Composition
An estimation of the MSW composition was performed by the selection and sampling of collection routes in Tonalá, which is one of the four municipalities in the subsystem under study. This municipality was preferred because it is where the biggest MSW transfer station ‘Coyula-Matatlan’ and the ‘Los Laureles’ sanitary landfill are located. Collection routes were selected according to a stratified sampling plan, which considered the socioeconomic level of the neighborhoods that were along the routes. To assess the socioeconomic level of the neighborhoods, an official poverty indicator (CONEVAL, 2015) was considered. The sample size was fixed at four collection routes due to limited resource availability, mainly the machinery required for waste homogenization and the working space to store the waste and collection trucks at the sanitary landfill. Following a stratified sampling scheme, low and high poverty neighborhoods were represented by one collection route, while the middle poverty neighborhoods were represented by two collection routes. Samples were taken from regular collection trucks along their normal route, allowing the waste pickers to perform their usual uptake of recoverable materials. MSW characterization was made upon arrival at the sanitary landfill according to the applicable regulation (DOF, 1992). Special attention was paid to the quantification of the recoverable materials, such as plastics or glass, to generate accurate information for the analysis from an economic perspective. The MSW compositions determined for each of the three socioeconomic levels were extrapolated to estimate the MSW composition of the subsystem under study.
2.3 Life Cycle Assessment
An LCA was selected as the methodological approach to assess the environmental performance of the current and potential scenarios for MSW management, and was implemented according to the framework proposed by ISO (2006), which includes the following steps: (a) definition of the objectives and scope, (b) life cycle inventory, (c) life cycle impact assessment and (d) selection of the best scenario considering the environmental impacts estimated. All these steps for the LCA are discussed in detail in the subsequent sections.
2.3.1 Goal and Scope Definition
This study aims to compare the environmental performance of the current vs. two potential MSW management scenarios in the subsystem under study within the GMA. As recommended by Cherubini et al. (2009), the functional unit used was the wet MSW generated by the subsystem during 1 year, which corresponded to 1,044,327.05 tons/year with the composition determined in section 3.1. Current and potential management scenarios are described in section 2.3.2 and displayed in Figure 2, where, for the sake of simplicity, flow values are expressed as percentages of the functional unit, where 1,044,327.05 tons/year corresponds to 100%.
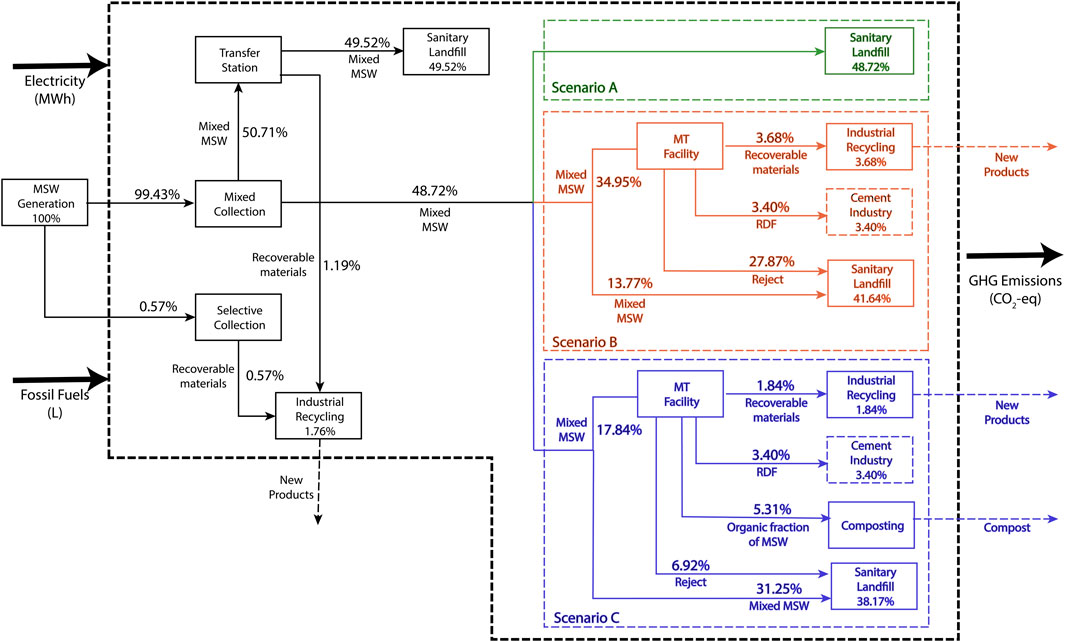
FIGURE 2. Current and proposed MSW management scenarios and system’s boundaries.
The system boundaries were set to include the collection of MSW and its transportation (to the transfer stations, the treatment facilities and the landfill), as well as the separation activities of the WP, the landfill, as well as the MT and MBT facilities (for the potential scenarios). The environmental LCA assumed that all the recovered materials were recycled to avoid the use of virgin materials. For instance, if a raw material was replaced by a recovered material, the avoided emissions were subtracted from the total emissions of a given scenario. The MSW management system inputs that were considered were the MSW generated by the subsystem under study (Figure 1) and the energy consumption, in the form of electricity and fossil fuels (diesel) used at the landfill, the transfer stations, the treatment plants (MBT or MT) and the fuel consumption for MSW transportation. Regarding the outputs, emissions of the following GHGs emitted during the assessed processes were considered: carbon dioxide (CO2), methane (CH4) and nitrous oxide (N2O). The analyzed system’s boundaries for each scenario are shown in Figure 2.
2.3.2 MSW Management Scenarios
2.3.2.1 Scenario A: Current Management Scenario
The current management system follows a linear model (Figure 2, Scenario A, represented in green) and is focused mainly on the disposal of mixed MSW in sanitary landfills. However, selective collection has been growing slowly in the subsystem under study within the GMA through the introduction of two types of infrastructure: 1) ‘Clean Points’, which encourage citizens to separate their MSW into four categories: metals, cardboard and paper, plastics, and others, and 2) ‘Glass towers’, which are designed to collect three types of glass bottles (brown, clear and green). The source-separated MSW is then sent to affiliated companies for recycling (Martínez et al., 2018). Despite these efforts, only 0.57% (16.17 tons/day) of the MSW collected is classified into the different waste streams (source-separated), while 48.72% (1,394 tons/day) of the mixed MSW stream is sent directly to the ‘Los Laureles’ landfill and the remaining 50.71% (1,451 tons/day) is sent to transfer stations where the MSW is compacted and transferred to larger capacity trucks (Figure 2) before being sent to ‘Los Laureles’. The WP activity is the main mechanism for material recovery in the subsystem under study. The WP in the GMA separate recoverable materials, mainly polyethylene terephthalate (PET), polypropylene (PP), paper, cardboard, aluminum, and others, throughout the complete management system (Bernache & Lucero, 2019). In the study herein, the material recovery activities conducted by the WP were accounted for in the transfer stations according to the data presented by Bernache & Lucero (2019). Currently, 1.193% (34.13 tons/day) of the MSW is recovered by the WP (Figure 2, Scenario A), which, combined with the source-separated MSW (0.57%), adds up to 1.76%. The remaining 98.24% (2,810.87 tons/day) is buried in ‘Los Laureles’.
2.3.2.2 Scenario B: First Proposed Scenario
The first potential scenario (Figure 2, Scenario B, represented in orange) considers the inclusion of a mechanical treatment (MT) plant next to a recently proposed new sanitary landfill (Figure 1). According to the government’s plan, the nominal operation capacity of the MT plant considered in this scenario is 1,000 MSW ton/day, which will be designed to treat the part of the MSW that does not pass through the transfer stations. Although this MT plant is not projected to treat the full generation of MSW, the Government of Jalisco considers this to be an initial step towards transitioning to a more circular model for MSW management. The MT plant is designed to recover three streams: plastics, aluminum cans and ferrous metals (SEMADET, personal communication, December 2019). Figure 3 shows a scheme of the MT plant and the material recovery efficiencies. Due to the operational requirements of the MT plant, this scenario assumes that the glass stream is separated in the ‘Glass towers’ before entering the plant and is, therefore, entirely valorized (N. Dias et al., 2012). The material balance results in a stream of recovered materials with a flow of 105.38 tons/day. Additionally, the MT plant considers the production of refuse-derived fuel (RDF) (SEMADET, personal communication, December 2019). The RDF production rate is estimated as 194.55 tons/day. However, the GMA cement industry only has the capacity to receive around 98 tons RDF/day (Opportimes, 2016), considering the co-processing of RDF with petroleum coke in a 20–80% ratio (Güereca et al., 2015). Therefore, from the total RDF production, approximately half (97.28 tons/day) can be energetically valorized in the cement clinker plant. Since it is assumed that there is no accumulation in the MT plant (steady-state operation), the amount rejected by the plant is 797.34 tons/day, which is composed of the non-treated organic stream, half of the RDF produced that cannot be valorized in the cement plant, in addition to all the remaining materials that are not recovered in the recyclable materials or the RDF streams. This reject stream is assumed to be sent directly to the sanitary landfill.
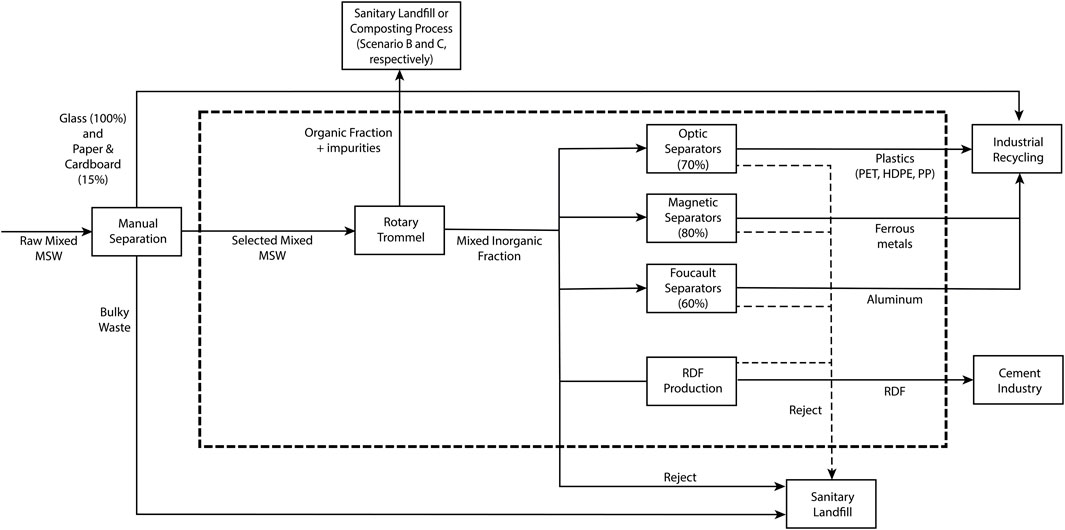
FIGURE 3. Mechanical treatment plant flow diagram considered for scenarios B and C. The percentage below each separation unit represents its efficiency. The dashed line represents the boundaries of the MT plant (SEMADET, personal communication, 2020).
2.3.2.3 Scenario C: Second Proposed Scenario
The second potential scenario (Figure 2, Scenario C, represented in blue) considers the implementation of an MBT plant, which has a nominal operation capacity of 500 MSW ton/day and combines an MT plant with the same design specifications considered for scenario B with a composting facility handling 152 tons of organic waste/day (SEMADET, personal communication, February 2020). The resulting compost is classified as type B according to the applicable regulation, which means that it can be employed as a soil improver or as a cover layer in landfills (GODF, 2012). The recovery of valuable materials, the RDF production and the volume rejected from the MBT plant proposed in this scenario have been estimated as 52.69, 97.28 and 198.03 tons/day, respectively, (Figure 2, Scenario C). All the RDF produced in this scenario can be energetically valorized in the cement kiln.
2.3.3 Life Cycle Inventory
According to Bakas et al. (2018), the main environmental concerns related to MSW management are resource efficiency, either biotic or abiotic, GHG emissions and toxic emissions to the environment and humans. Therefore, the life cycle inventory was developed considering two midpoint environmental indicators: global warming impact and abiotic resources depletion. Equations 1–11 summarize the calculations for the GHG emissions, while Equations 12–14 detail the calculations for the abiotic resources depletion.
The sources considered to assess the global warming impact are summarized as follows: 1) the emissions generated by MSW transportation vehicles, including their trajectories from the collection point to the transfer station and then to the current sanitary landfill (for scenario A), and from the transfer station to the treatment facilities (the MT plant and MBT plant, for scenarios B and C, respectively), which are projected to be next to the new sanitary landfill (Figure 1); 2) the emissions from the transfer stations, the landfill and the treatment plants (MT and MBT), including the electricity requirements and diesel consumption; 3) the emissions from the decomposition of MSW in the landfill; 4) the emissions from the composting of MSW; 5) the emissions reduction due to energy savings by recycling the recoverable materials and avoiding the production of these materials from raw natural resources; and 6) the emissions reduction by employing the refuse-derived fuel produced in the treatment plants in the cement industry. Due to the lack of specific data, emissions savings from the employment of compost as cover in the sanitary landfill are not discussed in this paper.
The sum of the GHG emissions of each scenario was assessed using Eqn. 1
GHG represents the total emissions for a given scenario;
Two types of vehicles were considered to account for transport emissions: 1) collection trucks
To calculate the emissions generated by the operation of facilities (
The first order decay model for Solid Waste Disposal Sites (SDWS) (Eqs. 4‒8) was employed to estimate the sanitary landfill emissions (IPCC, 2006b).
The methane (CH4) and dinitrogen oxide (N2O) produced from organic waste during the anaerobic composting process were calculated using Eqn. 9, in which
The emission factors
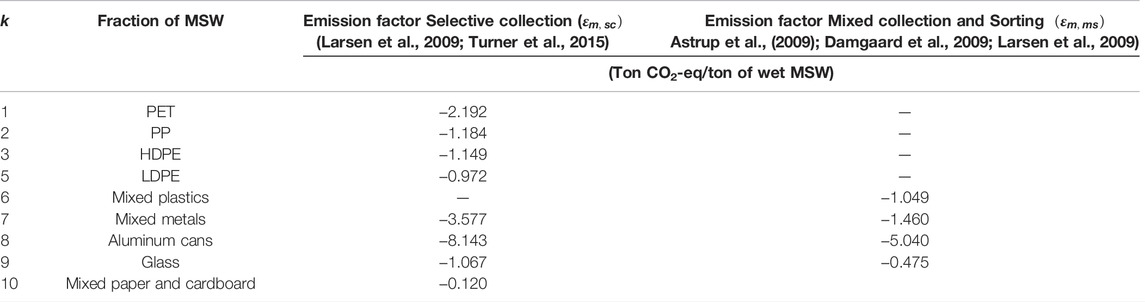
TABLE 1. Emission factors for recoverable materials.
To estimate the emissions savings derived from the RDF produced in the treatment plants (MT or MBT) and energetically valorized in the cement plant, an emission factor
An abiotic resource depletion indicator was also estimated for each scenario (
To compute
Eqn. 14 was used for the computation of
2.3.4 Life Cycle Impact Assessment
A Life Cycle Impact Assessment was carried out according to the methodology used by Guinée (2001) for the assessment of two impact categories previously mentioned: Global Warming Potential (GWP) and abiotic resource depletion (ARD). The GWP impact category indicator assesses the phenomenon of rising surface temperature across the planet driven by the increase of GHG concentrations in the atmosphere (Rosenbaum et al., 2018). The GHG emissions were expressed in ton CO2-eq. In this study, a global warming potential over a 100-years time span was adopted (IPCC, 2014); therefore, the Global Warming Potential factors of methane (
2.4 Sensitivity Analysis
The sensitivity of three key input parameters was analyzed to observe the robustness of the scenario assessment regarding the global warming impact indicator. The selected parameters corresponded to MSW composition, the percentage of the landfill gas recovery at the disposal site, and the percentage of source-separated and selectively collected MSW. The probability distribution of the MSW composition (estimated herein) was assumed to fit a normal distribution, and through a Monte Carlo simulation algorithm (with 1,000 iterations), the probability distribution of each scenario was obtained. Furthermore, a perturbation analysis was conducted for all of the MSW fractions to examine the actual sensitivity of these parameters based on a fixed input variation of 10%, as shown in Eqn. 15.
SR is the sensitivity ratio, representing the ratio of the relative change in the results to the relative change in the parameter. According to Liikanen et al. (2017), SRs greater than 0.8 are considered significant, while SRs lower than 0.2 are not considered to be significant. The MSW fractions that were found significant based on this criterion were considered for further sensitivity analysis.
All calculations and graphs were prepared in MATLAB R2019a and R 4.1.1 with the Tidyverse package.
2.5 SWOT Analysis
To further explore the sociocultural, geopolitical, technological/infrastructure and economic challenges surrounding implementation of the potential alternative scenarios, a SWOT (Strengths, Weaknesses, Opportunities and Threats) analysis was performed, using the current management scenario as the basis for the analysis. SWOT analysis is a widely known business strategy tool to assess how an organization compares to its competition (in this case, how the current management system compares against the potential management scenarios). The strengths and weaknesses are internal considerations, where the former comprise the advantages of a scenario, and the latter comprise the characteristics that lead to a relative disadvantage. Regarding the external considerations, the opportunities are realities in the greater environment that can be exploited to benefit the scenario, and the threats are realities that might lead to problems (Teoli et al., 2020).
3 Results and Discussion
3.1 GMA MSW Composition
Characterization of the MSW generated in the GMA was carried out to determine the mass fractions of the 23 MSW categories reported in Table 2. Despite the WP activities, the average percentage of recoverable materials, which include plastics, glass, metals, paper and cardboard, was found to be within the range of 23.17–30.70% of the total generation. However, the percentage of organic waste, which includes wood, kitchen, yard and garden waste, is still predominant, accounting for 57% of the MSW. These results are consistent with a recent report of the average Mexican MSW composition, where the “susceptible to use” or recoverable fraction was found to be 31.55% (SEMARNAT, 2020). However, the fractions of plastics, paper/cardboard and glass estimated in this study showed slight differences when compared with other estimations made by the State and the Guadalajara municipal governments (Table 3). These variations may result from the intrinsic temporal variability of the composition of MSW generated across seasons, since these comparative studies were carried out during the months of June and July (the hot wet season), while the present work was conducted during February‒March (the cold dry season). An MSW characterization conducted by Gómez et al. (2009) for Chihuahua, Mexico reported seasonal variations, with a decreasing trend from the hot wet to the cold dry seasons for paper, glass, and plastic containers (PET, HDPE, PP, LDPE) and an increasing trend for plastic (film polyethylene, small plastic, food containers, polyethylene bags). Additionally, the data herein suggests a decrease in the glass fraction and an increase in the plastic fraction of the MSW produced in the GMA over the past 20 years, compared with the data reported by Bernache-Pérez et al. (2001). This can be attributed to variations in the materials used by the beverage industry, which has increased its production of plastics and multilaminate containers (Sipper, 2019). Furthermore, previous studies (Bernache-Pérez et al., 2001; Aristóteles et al., 2017; Martínez et al., 2018) based their characterization on samples taken directly from households where the MSW was generated. Such an approach, which is contrary to the approach employed in the present study, fails to reflect the WP activities. A comparison of the characterization made in this study and the characterizations reported in previous studies is shown in Table 3.
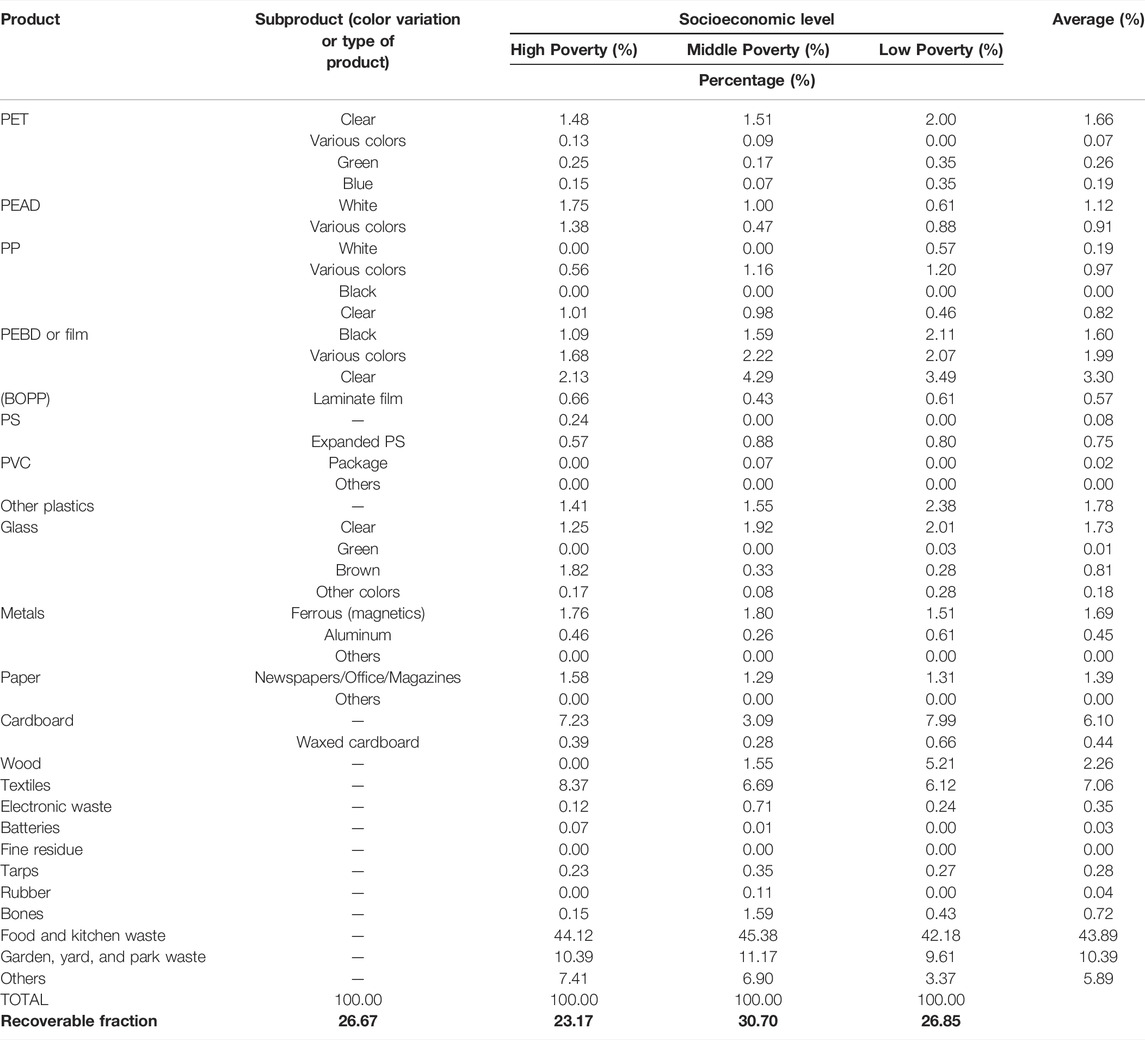
TABLE 2. Characterization of MSW of the GMA.
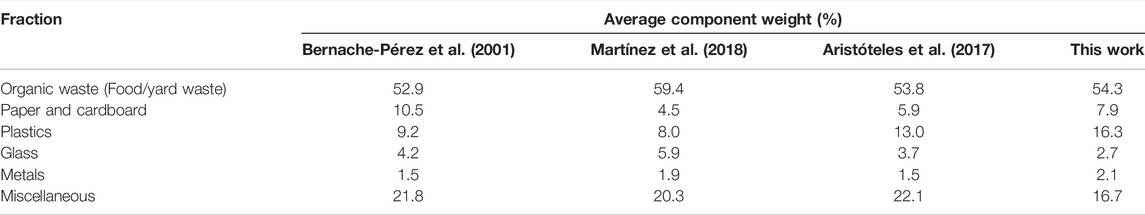
TABLE 3. GMA MSW composition studies comparison.
3.2 Life Cycle Assessment and Sensitivity Analysis
Table 4 shows all of the inputs and outputs to the studied subsystem for each assessed scenario, considering the functional unit (annual MSW generation of the subsystem). The electricity consumption in the transfer stations and the sanitary landfill was found to be practically the same for all three scenarios. However, there was an increase in the overall electricity input by 813 and 550% due to the operation of the treatment plants (MT and MBT) for scenarios B and C, respectively. Regarding fuel consumption, the potential scenarios increased by 151% in comparison with the current model, which is due to an increase in the distance traveled by the collection vehicles because of the location of the new sanitary landfill, which is almost 4 times further than the current landfill (95.5 as opposed to 21.5 km). Besides the increase in total distance traveled, the considerable quantity of collection vehicles (8-ton capacity) that must travel directly to the treatment plant next to the new sanitary landfill also contributes to the increase in diesel consumption. For instance, if the collection vehicles were employed only for collection and all the MSW was transferred to heavy-duty vehicles to transport the MSW to the new landfill, the diesel consumption of the B and C scenarios could be reduced by nearly 38% (around 7.8 million liters per year) due to the more efficient diesel consumption of the heavy-duty vehicles employed. Therefore, the GMA Authorities must focus on the opening of more transfer stations, as this infrastructure would allow for an efficient use of the collection vehicles, with a significant reduction in fuel demand and, hence, GHG emissions. This potential improvement is consistent with the study performed by Bovea et al. (2007), who evaluated the environmental benefits of incorporating a transfer station in an MSW management system of the Plana region (Spain). These authors concluded that the environmental impact of the whole system could be reduced by as much as 14.0–20.7%. Moreover, the authors reported that the increases in environmental impacts due to energy consumption in the transfer station is highly compensated due to the fuel savings that results from the use of transfer trucks instead of collection trucks. Despite the logistical inefficiency that supposes a sanitary landfill far from the subsystem under study, this assumption was made as the most probable scenario because of the rapid urbanization the city is experiencing (Figueroa, 2017), as well as the generalized social discontent generated around ‘Los Laureles,’ which hinders the possibility of constructing the new sanitary landfill near to city (Meléndez, 2018). While the location of the sanitary landfill is yet to be confirmed, the optimal spatial distribution of the MSW management infrastructure must be considered for future assessments.
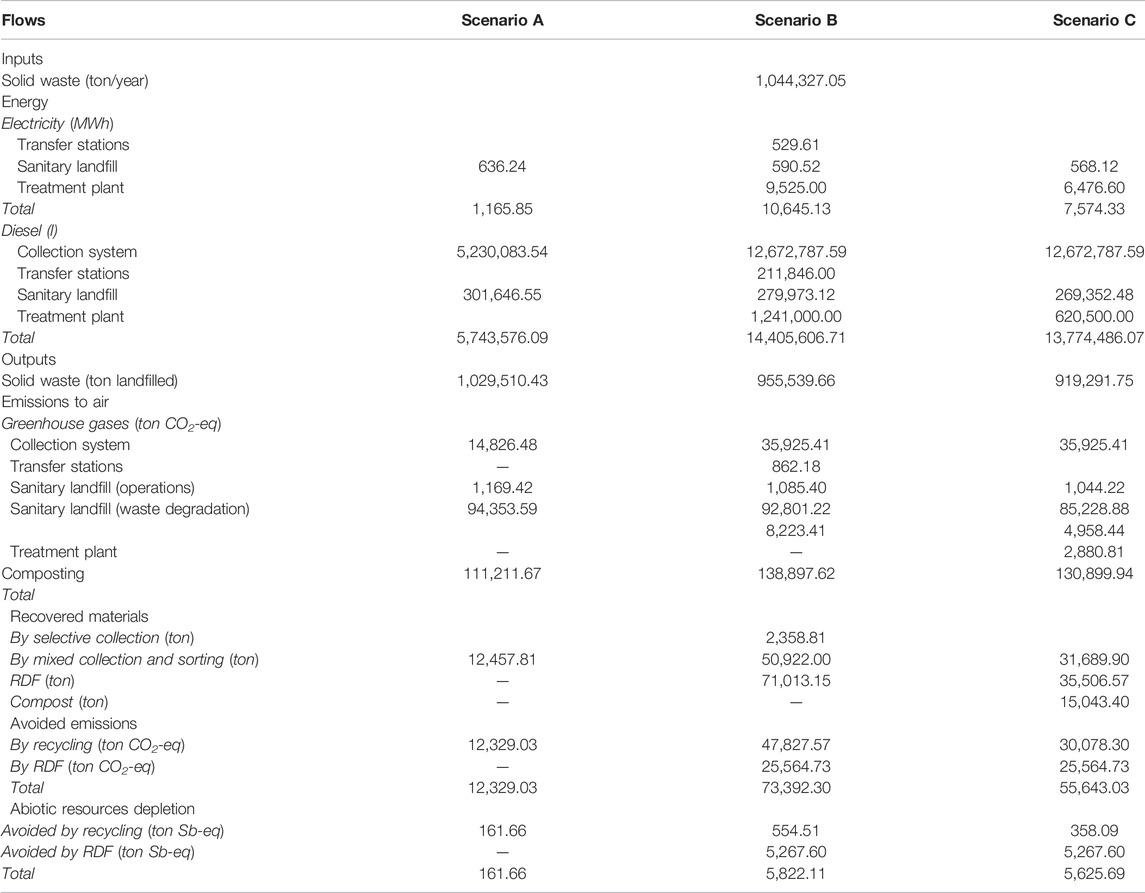
TABLE 4. LCI - Balance of system for the management of the annual GMA MSW generation in each scenario.
Regarding the outputs, Figure 4 shows the performance of each scenario regarding their global warming impact. The gross CO2-eq emissions of scenarios B and C are higher than those of the current management system (scenario A) due to the contributions of MSW transportation (with a greater distance traveled to the sanitary landfill) and the energy consumed by the treatment plants. However, both potential management scenarios (B and C) present a decrease in the sanitary landfill emissions category, especially scenario C, which reduces emissions by 9.8% due to composting 9.78% of the organic waste. Despite the larger gross GHG emissions of B and C, the balance between the CO2-eq emitted and the avoided emissions shows that the current MSW management system (scenario A) has the worst environmental performance regarding GHG emissions. Overall, the B and C scenarios displayed a reduction in GHG emissions by 34 and 24%, respectively, in comparison to scenario A. For B, the main source of emission savings was the recovery of materials at the MT facility (65% of the total savings) as well as the substitution of petroleum coke by RDF (35%). Despite the fact that the material quality is reduced in the recoverable materials (mainly due to the contact with organic waste), the implementation of the MT plant with a capacity of 1,000 tons per day allows for a large amount of emission savings. MSW recycling (Sevigné-Itoiz et al., 2015) and fuel substitution by RDF (Güereca et al., 2015) have been reported to be effective measures to reduce the GHG emissions of MSW management systems. In the case of scenario C, since the capacity of the treatment facility is halved with respect to B, the reduction in GHG emissions was achieved by the combined action of material recovery (47% of the total savings), petroleum coke substitution by RDF (39%) and composting activities (14%). Scenario B was the most beneficial in terms of a reduction in GHG emissions, due to the bigger contribution of emissions avoided by the recovery of materials. The reduced emissions, which resulted from the energetic valorization of RDF, are the same for B and C, since half of the RDF produced in scenario B is not used by the cement plant due to a lack of capacity. Therefore, the main factor contributing to the difference in avoided emissions is the capacity of the MT plant, which is significantly larger in B. Nevertheless, the reduction of landfill space for the disposal of organic waste and the subsequent reduction in the generation of leachates that results from composting the organic material, as considered by scenario C, needs to be further explored for a more comprehensive environmental assessment.
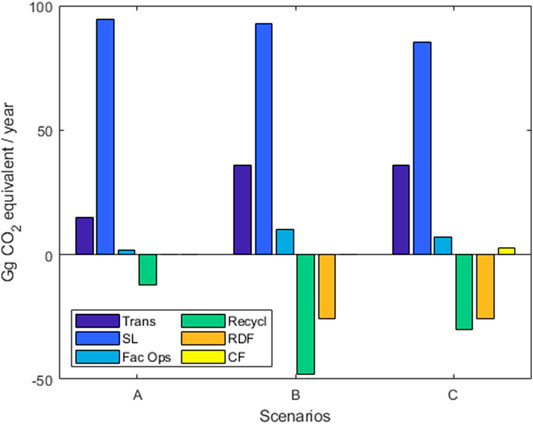
FIGURE 4. Total GHG contributions per scenario. Transport (Trans), Sanitary landfill (SL), Facilities operations (Fac Ops), Savings due to recycling of recoverable materials (Recycl), Savings due to RDF co-processing in cement kiln (RDF), Composting facilities (CF).
Furthermore, the emissions generated by the facility operations and the transport activities are surpassed by the sanitary landfill emissions. This is consistent with the work of Xin et al. (2020), who concluded that the sanitary landfill was the component of the MSW management system with the largest contribution to GHG emissions. This becomes an even larger issue in countries with a high organic fraction in MSW, low material recovery rates, uncontrolled landfill operation conditions and a lack of infrastructure to capture landfill gases, which are common features of the MSW management systems in Mexico and Latin America (Kaza et al., 2018). For instance, Manfredi et al. (2009) have reported that an uncontrolled landfill displayed an emission range between 0.56 and 0.78 ton CO2-eq/ton MSW landfilled, while a controlled landfill resulted in an emission range of 0.071–0.150 ton CO2-eq/ton MSW landfilled. Therefore, the new MSW management models developed for the GMA and Latin American countries must prioritize the introduction of treatments, such as composting or anaerobic digestion, which can significantly reduce or bio-stabilize the organic waste prior to disposal and can reduce the environmental impacts generated. Moreover, the energetic valorization of biogas produced through organic waste treatment could be employed to reduce the GHG emissions as a result of fuel substitution. Montejo et al. (2013) conducted an LCA to assess the environmental performance of eight MBT plants located in the region of Castilla and Leon, Spain. They concluded that the increase of material recovery through automation of the plant and an optimized use of the biogas-energy (through maximization of electricity production and using the waste heat from the biogas engine process) may drastically increase the associated GHG savings. Therefore, in the present case, the model should prioritize the installation of high-capacity treatment plants rather than focusing on the search for a site location that reduces the transport distances. However, other economic, legal and logistics aspects could shape the new MSW management collection routes to avoid long-distance travel.
Another key aspect that must be considered for the development of a new MSW management model is the accelerated implementation of selective collection. Although no increases were considered for the selective collection in the potential scenarios (B and C), it has been reported that the ‘Clean Points’ program is progressing rapidly with the installation of new units and that the number of participants (people separating their waste) is also steadily increasing (Martínez et al., 2018). This stream of source-separated MSW accounts for an emissions savings of 1.95 Gg of CO2-eq/year for all scenarios (as no increases were considered for B and C), and accounts for 15, 2.65 and 3% of the emissions savings resulting from the recovery of materials for scenarios A, B and C, respectively, as B and C include the recovery of materials from treatment plants. Selective collection has been identified as a great way to increase MSW management efficiency in developing countries. The enhancement of these activities would help to obtain higher quality recoverable material and would simultaneously involve the population in a more active and eco-conscious manner (Grau et al., 2015).
Figure 5 shows the results for the abiotic resource depletion category. Direct resource depletion was not considered, and only indirect impacts of recycling and fossil fuel substitution were accounted for. Contrary to the global warming impact category, the recycling of recoverable materials represents a minimal part of the ARD impact indicator (6–10% of the total ARD savings) in comparison with the use of RDF in the cement kiln (90–94%). As previously reported by Silva et al. (2021), the reduction of fossil fuel consumption achieved through the substitution of petroleum coke with RDF represents a more significant contribution to this category due to the high energy demand associated with the cement clinker production. Scenario B resulted in the lowest impact to this category with an ARD savings increase of 3,501% (when using scenario A as baseline) due to the recovery of materials. However, since the use of this is the same for B and C, this scenario also performed well with a savings increase of 3,380% when considering the savings due to the recovery of materials. However, if all the RDF produced in scenario B could be energetically valorized by the cement kiln, the ARD savings for scenario B would double. Therefore, another key aspect to consider for the development of a new MSW management system in the GMA is the lack of a larger capacity for RDF utilization in the cement plant (around 98 tons/day). Unfortunately, the biggest cement clinker plant in the State is located in the Zapotiltic municipality, 152 km from the GMA (INEGI, 2013). The lack of ability to use a larger stream of RDF needs to be resolved if a high-capacity MT plant were to be installed in the future. The employment of RDF has the potential to reduce the landfilled MSW by up to 20% (if all the MSW was treated prior to disposal). This would result in a significant decrease in GHG emissions and less depletion of abiotic resources.
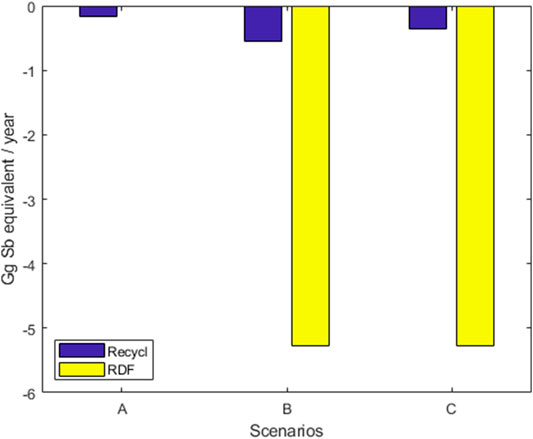
FIGURE 5. Abiotic resource depletion savings per scenario. Savings due to recycling of recoverable materials (Recycl), Savings due to RDF co-processing in cement kiln (RDF).
Figure 6 shows the results of the sensitivity analysis of the key parameters affecting the global warming impact indicator. Even when the variability of MSW composition is considered (Figure 6A), scenario A displays the worst environmental performance (98.84 ± 2.1 Gg CO2-eq/year). Additionally, while scenario B was thought of as the preferred option in terms of GHG emissions, the sensitivity analysis shows that for certain possible MSW compositions, scenario C (74.65 ± 3.9 Gg CO2-eq/year) could be a better alternative than scenario B (64.33 ± 6.3 Gg CO2 -eq/year), as is shown in the overlapping of the probability density of scenarios B and C. Furthermore, a perturbation analysis was performed over the MSW fractions (Figure 6D). According to the criteria presented by Liikanen et al. (2017), only the food and kitchen waste fraction (FKW) was identified as a key parameter. However, for the purpose of comparison, the FKW and the plastic fractions were selected for a further scenario analysis (Figures 7A,C). Considering both MSW fractions, scenario B prevailed as the preferred option for certain fraction ranges (0–52% and 0–72% for FKW and plastic contents, respectively). However, in accordance with what is shown in the probability distribution graph, after a certain fraction threshold (53 and 72% for FKW and plastic waste contents, respectively), scenario C becomes a better alternative than scenario B. This results from the diversification of sources of emissions savings in scenario C (material recovery, composting and substitution of coke with RDF), which makes this alternative more robust against variations in MSW composition, such as increases in the organic fraction and an associated decrease in the recoverable materials fractions (which is the main strength of scenario B).
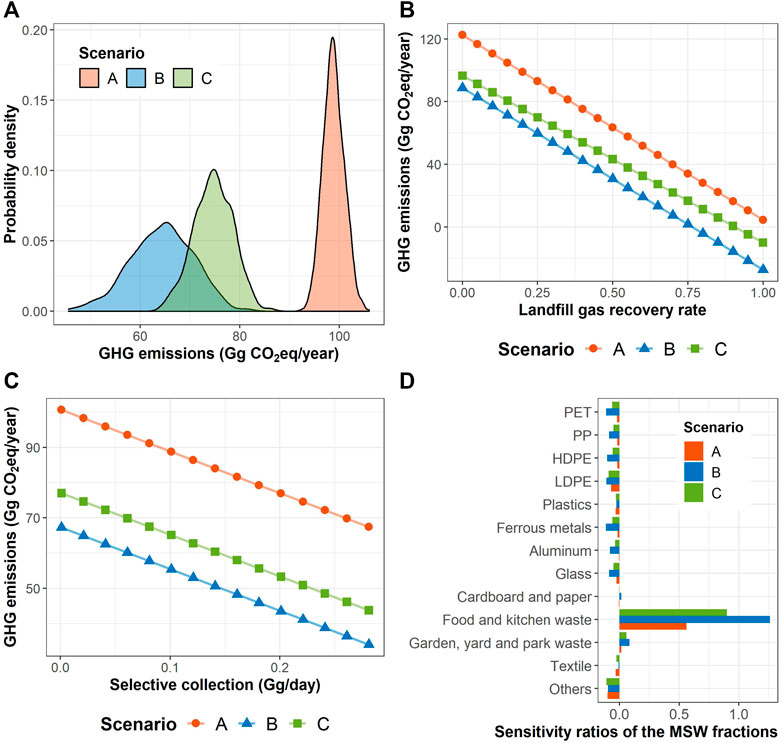
FIGURE 6. Sensitivity analysis of key parameters and their impact on the net GHGs emissions and scenario performance: (A) MSW composition; (B) Landfill gas recovery fraction; (C) Selective collection; (D) Perturbation analysis of MSW fractions.
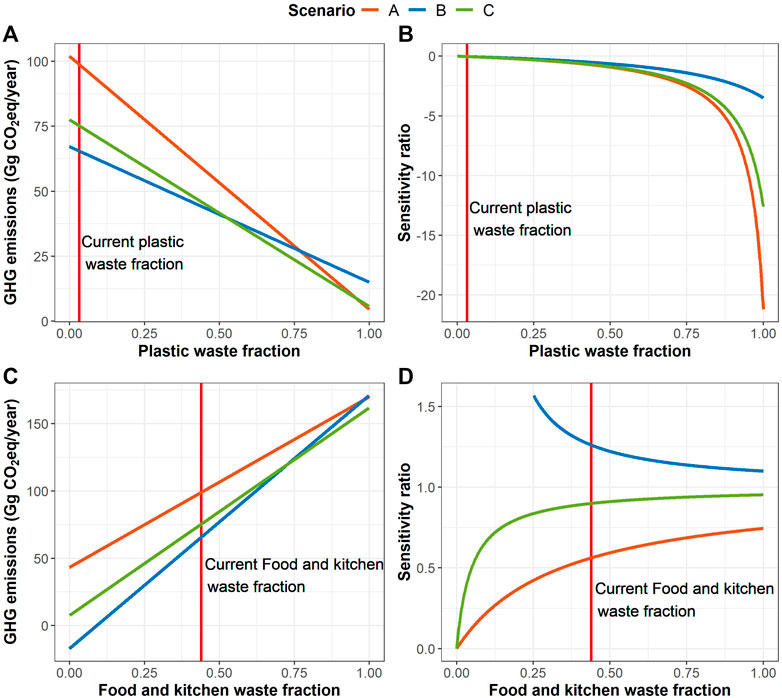
FIGURE 7. Sensitivity analysis of food and kitchen waste and plastic waste fractions and their impact on the net GHGs emissions and scenario performance: (A) Plastic waste fraction; (B) Sensitivity ratio behavior with respect to the plastic waste fraction content; (C) Food and kitchen waste fraction; (D) Sensitivity ratio behavior with respect to the food and kitchen waste content.
Regarding selective collection and landfill gas recovery percentage, these parameters showed an inversely proportional relationship (Figures 6B,C). For both parameters, at each simulated value within the possible range, scenario B displayed a better global warming impact performance (33.40–67.35 and −27.29‒88.70 Gg CO2-eq/year, for selective collection and LG recovery percentage, respectively) with a similar performance of scenario C (43.15–77.10 and -9.97‒96.56 Gg CO2-eq/year). Scenario A was identified as the worst alternative for the entire range (66.78–100.73 and 4.52–122.47 Gg CO2-eq/year). As already discussed, the landfill represents the largest emissions source for all of the scenarios, and this is largely due to poor management conditions and low recovery rates of the biogas generated within the disposal site. The simulation showed that doubling the current landfill gas recovery rate (from 20 to 40%) would reduce the total emissions by 24% for the current management system. Regarding selective collection, the simulation demonstrated that if 10% of all the MSW were source-separated and selectively collected (compared to the current rate of 0.57%), emissions would decrease by 34% due to the recycling of recovered materials.
Finally, an additional analysis was performed to explore the possible variability of the selectivity ratios if changes were to occur in the MSW fractions (Figures 7B,D). Although the plastic fraction showed a non-significant SR coefficient, the curve shows a potential increase in the SR with changes in composition. Therefore, the SR values can vary substantially depending on the MSW composition. This should be considered in future studies, including sensitivity analyses where the MSW composition could change.
3.3 SWOT Analysis
Table 5 displays the SWOT analysis performed for the current (linear) MSW management system (scenario A) as a basis for the transition towards a circular economy management system. From an economic perspective, despite the high fraction of recoverable materials, the recovery and recycling rates are very low in the GMA. WP are currently the main beneficiaries of material recovery, accounting for 85% of the total MSW valorization. However, before the implementation of a major treatment facility that can ensure a larger stream of recoverable materials, the lack of important data, such as the demand and the quality specifications of recoverable materials and the characteristics of the recycling infrastructure within the GMA, need to be better understood. Furthermore, despite Jalisco’s great potential for recycling some material streams like plastics (Romo, 2015), the recoverable materials market needs to be regulated to ensure safe working conditions and fair compensation for the WP and to avoid price volatility (Bernache & Lucero, 2019). The creation of a council to regulate the WP activities, issue certifications of materials quality and offer subsidies (e.g., for the transport of the recovered materials and recycling projects) could strengthen the value chain and ensure that all the recovered materials are used.
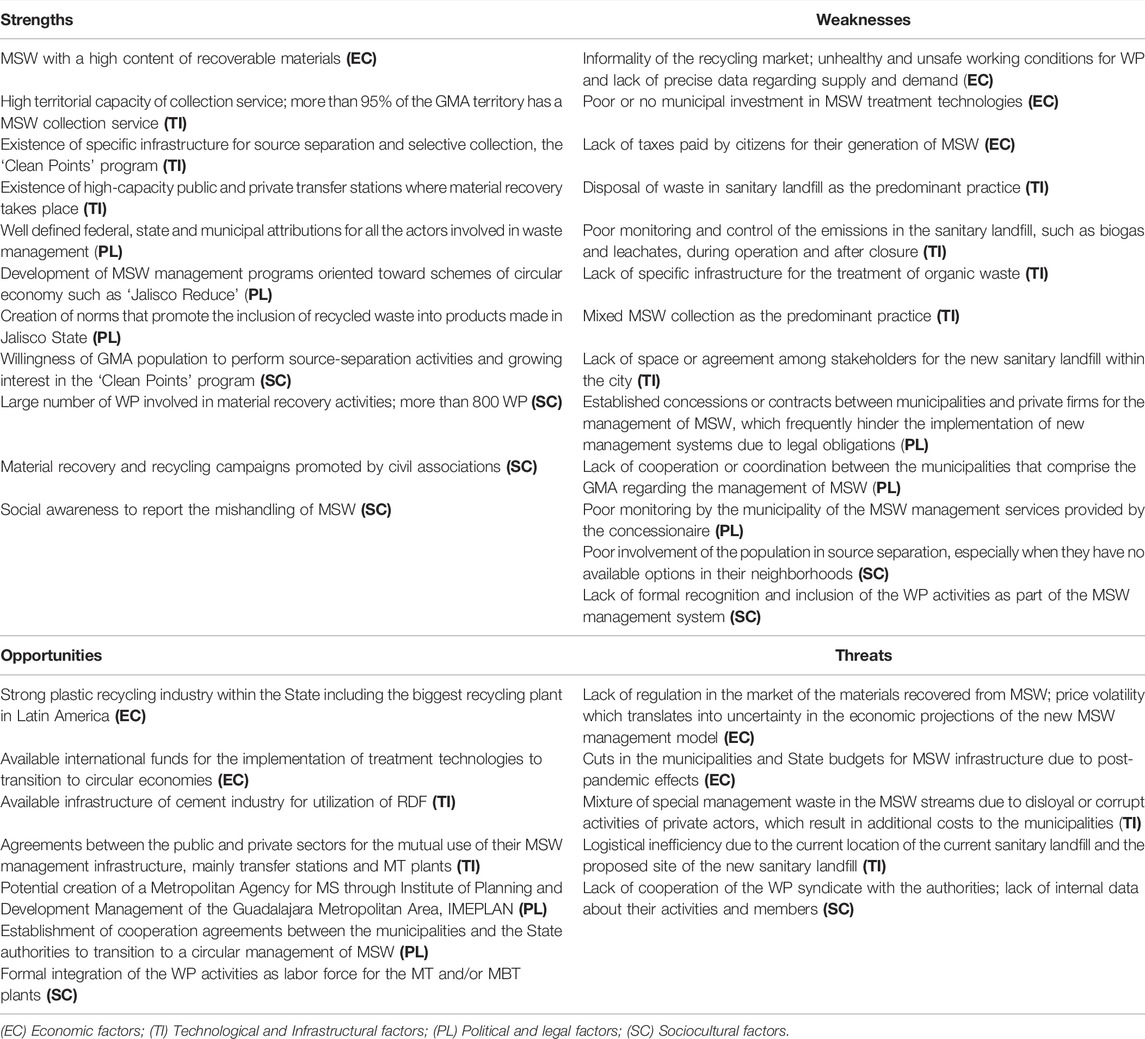
TABLE 5. SWOT analysis of the current GMA MSW management system.
From a sociocultural perspective, there is a growing participation of civil associations in the promotion of material recovery activities (Casa CEM, 2020). This is happening through the implementation of sites for the correct disposal of specific waste fractions, such as for electronic devices and batteries (Martínez et al., 2018), as well as through raising awareness of the mismanagement of sanitary landfills (CEDHJ, 2020). However, social participation in source-separation activities still remains low (Aristóteles et al., 2017). Furthermore, the WP have been historically marginalized, with poor working conditions characterized by social invisibility, lack of labor recognition (Guibrunet et al., 2017), unsafe environments (specifically due to a lack of security equipment and to the direct exposure to MSW), poor compensation ($4.92–7.37 USD per 8-h shift) and a lack of social security benefits (Valente-Santos & Guevara-García, 2019). However, the WP represents one of the most important workers across Latin America (S. Dias, 2016). Instead of being excluded, the WP should be formally included in the system through the establishment of WP unions with whom the authorities can work with for hiring purposes and to ensure safe working conditions and fair compensation, as has previously been done in Brazil (Valente-Santos & Guevara-García, 2019). For instance, Rutkowski (2020) presented a three-party scheme in which a coalition was formed by about 4,000 companies from 22 different business sectors, the Brazil Government and the WP cooperatives, to collaboratively implement an Extended Producer Responsibility (EPR) program focused in package waste. The private stakeholders provided financial support, through non-governmental organizations (NGO’s), for the improvement of the infrastructure of the WP cooperatives to increase their productivity in the processes of collection, transportation and pre-treatment prior to recycling. In return, WP cooperatives reported to the private stakeholders the monthly number of recoverable materials sold. These reports were presented by the affiliated companies to the Government Environmental Department, which establishes the goals for recycling and landfill disposal reduction in the country. Such a scheme allows for a reduction in the costs of collection and disposal for the municipalities by the action of WP, encourages investments in the recycling chain and assures material inputs into the recycling chain. Additionally, the introduction of taxes on the generation of MSW to be paid by the citizens would generate an income that could be used for MSW management and which would encourage the population to moderate their consumption habits and simultaneously increase source separation, as has been previously implemented in many developed countries (Folz & Giles, 2002).
The infrastructure/technological challenges have already been discussed along with the environmental assessment. However, special attention needs to be paid to three additional aspects: 1) settling agreements must be made between the local authorities and the private stakeholders for the common use of the infrastructure, either public or private, such as transfer stations, sorting plants and composting facilities, distributed across the GMA; 2) initiating or resuming actions to mitigate the environmental impacts of abandoned disposal sites, such as ‘Matatlan’, ‘El Taray’ or ‘La Copalita’, which have been absorbed by the growth of the city and have received poor or no monitoring and no investment since their closure for their physical, chemical and biological stabilization (Guillén, 2009); 3) reinforcing the monitoring of collection routes in order to avoid the illegal mixing of special management waste (SMW) that results from production (private) activities, with the MSW collection routes. This practice is common among small businesses to avoid the hiring of a licensed SMW collector by offering a tip to the MSW collectors (Patiño, 2019). These practices should be urgently addressed because they not only cause an increase in the disposal and transport costs for the municipalities, but they also unfairly exempt the private sector from managing their own waste using public resources.
Finally, from a political/legal perspective, circular economy approaches have been promoted for MSW management by the creation of state programs and norms, such as the regulation of single-use recycled plastic bags that make up a significant fraction of plastic recovered from MSW (POEJ, 2019) and the development of a specific State Norm for the source separation and selective collection of MSW in the State of Jalisco (POEJ, 2008). This Norm established a mandatory primary type source separation and selective collection of three fractions: organic (food, kitchen, garden and yard waste), sanitary (diapers, pads, toilet paper, among others) and inorganic (all the remaining MSW fractions). Once implemented, the Norm proposed a transition to a secondary type of scheme in which the inorganic fraction was further separated in two new classes: 1) high recyclable potential fraction (PET, HDPE, PE, paper, cardboard, metals, glass, and textiles), and 2) low recyclable potential fraction (PP, PS, vegetal fibers, leather, and ceramics, among others). Despite being released since 2008, this Norm has been completely ignored as only some Municipalities have tried to implement it with poor success. One of the main causes of this failure are the poor municipality monitoring and control of the collection activities, which allow for the mixture of different waste fractions in the collection vehicles. These practices have discouraged the population to perform the MSW source separation activities (Bobadilla, 2018).
Furthermore, each municipality has autonomy over the MSW produced by its population and, in a large metropolitan area comprising nine municipalities such as the GMA, it is imperative to establish participation mechanisms that allow the environmental representatives of the municipalities to cooperate and take actions with an integrated vision of the metropolitan area as a single system. In this context, the Metropolitan Planning Institute, which is a GMA metropolitan governance institute dedicated to the development of planning instruments in areas such as land use, risk analysis, budget investment, environmental care, among others, should function as a headquarters and mediator.
4 Conclusion
An LCA was implemented for the environmental assessment of the current GMA MSW management system vs. two potential alternative scenarios, which include MBT facilities currently considered by the local authorities. This assessment showed that the introduction of MBT facilities in the system can produce significant savings in GHGs emissions and in the use of abiotic resources. Furthermore, to enhance the reduction in environmental impacts, GMA authorities must focus on the treatment of the high organic fraction contained in the MSW and in the opening of more transfer stations to avoid inefficient waste transport. These results can help guide the transition towards a more sustainable MSW management system in the GMA. However, one limitation of this study is that only two possible alternatives to the current MSW management system were evaluated. Hence, further research is warranted to strengthen this analysis and to determine other eco-efficient alternatives for the local context. Future analyses should consider: 1) other treatment alternatives, such as anaerobic digestion, incineration, or gasification, among others; 2) a wider set of impact indicators to avoid the burden of shifting between the environmental impacts; 3) the direct emissions from combustion processes at the cement kilns; 4) region-specific emission factors for the transport and the recycling industry; 5) the new sanitary landfill location and 6) the whole GMA system.
Furthermore, despite the robustness of the LCA methodology, its results can only tell us if an option is more eco-efficient than another, but this does not imply that it is sustainable. Therefore, a deep understanding of the MSW system components and main actors is required. In this regard, this study contributes to a systemic understanding of the MSW management system of the GMA through an integrated approach combining environmental LCA, a sensitivity analysis and a SWOT analysis, which taken together can explain the basic relationships among the environmental impact indicators with economic, sociocultural, legal, and technological/infrastructure considerations and can help bring about a stronger adoption of LCA. Therefore, developing countries, such as Mexico, need to address the key economic, sociocultural and political challenges identified in this work to transition to circular economy models, including: 1) the introduction of source-separation and selective collection mechanisms, mainly for the high fraction of organic waste contained in the MSW in these countries; 2) reinforcement of the monitoring and control of the disposal sites to avoid emissions of GHG and leachates runoff; 3) the inclusion of the WP in the MSW management system through the recognition and formalization of their activities under safe working conditions; 4) the establishment of formal valorization markets; 5) the implementation of monetary responsibility policies for waste generators; 6) the conformation of intermunicipal cooperation schemes; and 7) the development of technically skilled human resources for the design and implementation of new MSW management models. The results of this work will assist in the creation of policies that can improve the feasibility of MBT implementation and drive the first steps towards a circular economy model in the GMA and in other cities in developing countries with similar characteristics.
Data Availability Statement
The raw data supporting the conclusions of this article will be made available by the authors, without undue reservation.
Author Contributions
Conceptualization, GOL-T and MSG-H; Data curation, GOL-T and CY-M; Formal analysis, GOL-T and MSG-H; Funding acquisition, MSG-H; Investigation, GOL-T and MSG-H; Methodology, GOL-T, CY-M, CER-R, and MSG-H; Project administration, MSG-H; Resources, MSG-H; Software, GOL-T and CY-M; Supervision, CER-R and MSG-H; Validation, DAO-N and CY-M; Visualization, GOL-T and CY-M; Roles/Writing - original draft, GOL-T; Writing - review & editing, CER-R, MSG-H, and DAO-N.
Conflict of Interest
The authors declare that the research was conducted in the absence of any commercial or financial relationships that could be construed as a potential conflict of interest.
Publisher’s Note
All claims expressed in this article are solely those of the authors and do not necessarily represent those of their affiliated organizations, or those of the publisher, the editors and the reviewers. Any product that may be evaluated in this article, or claim that may be made by its manufacturer, is not guaranteed or endorsed by the publisher.
Acknowledgments
The authors gratefully acknowledge the technical support of Susan Alvarado-Cummings, Ana Cecilia Luque-Vadillo, Gerardo Villanueva-Maciel and Diego Díaz-Vázquez and the administrative support of Tecnologico de Monterrey campus Guadalajara and Consejo Nacional de Ciencia y Tecnologia (CONACYT). We also acknowledge the Jalisco Scientific Development Fund to Address State Problems (FODECIJAL by its acronym in Spanish) for the support provided through the 8226 project. Finally, we also thank the Jalisco´s Ministry of the Environment and Territorial Development (SEMADET by its acronym in Spanish) and particularly would like to recognize M Sc. Sergio Humberto Graf Montero for all their support and data provided.
References
Abeliotis, K., Kalogeropoulos, A., and Lasaridi, K. (2012). Life Cycle Assessment of the MBT Plant in Ano Liossia, Athens, Greece. Waste Manag. 32 (1), 213–219. doi:10.1016/j.wasman.2011.09.002
Aguilar-Virgen, Q., Taboada-González, P., and Ojeda-Benítez, S. (2011). Mexican Model for the Estimation of the Generation of Biogas. Ingenieria 15 (1), 37–45. Available at: https://www.redalyc.org/pdf/467/46718150006.pdf.
Archer, E., Baddeley, A., Klein, A., Scwager, J., and Whiting, K. (2005). Mechanical-Biological-Treatment: A Guide for Decision Makers. Processes, Policies and Market - Annexe A. Gloucester, United Kingdom: Juniper Counsultancy Servces Ltd.
Aristóteles, J., Ruiz, M., Román, R., Parra, E., and Cortinas, C. (2017). Programa Estatal para la Prevención y Gestión Integral de Residuos del Estado de Jalisco 2016-2022.
Astrup, T., Fruergaard, T., and Christensen, T. H. (2009). Recycling of Plastic: Accounting of Greenhouse Gases and Global Warming Contributions. Waste Manag. Res. 27 (8), 763–772. doi:10.1177/0734242X09345868
Bakas, I., Laurent, A., Clavreul, J., Saraiva, A. B., Niero, M., Gentil, E., et al. (2018). “LCA of Solid Waste Management Systems,” in Life Cycle Assessment: Theory and Practice, 887–926. doi:10.17654/JPHMTFeb2015_029_04210.1007/978-3-319-56475-3_35
Bayard, R., de Araújo Morais, J., Ducom, G., Achour, F., Rouez, M., and Gourdon, R. (2010). Assessment of the Effectiveness of an Industrial Unit of Mechanical-Biological Treatment of Municipal Solid Waste. J. Hazard. Mater. 175 (1–3), 23–32. doi:10.1016/j.jhazmat.2009.10.049
Bernache-Pérez, G., Sánchez-Colón, S., Garmendia, A. M., Dávila-Villarreal, A., and Sánchez-Salazar, M. E. (2001). Solid Waste Characterisation Study in the Guadalajara Metropolitan Zone, Mexico. Waste Manag. Res. 19 (5), 413–424. doi:10.1177/0734242X0101900506
Bobadilla, R. (2018). Alcaldías “desechan” norma para separar basura. El Informador. Available at: https://www.informador.mx/Alcaldias-desechan-norma-para-separar-basura-l201807180001.html.
Bovea, M. D., Powell, J. C., Gallardo, A., and Capuz-Rizo, S. F. (2007). The Role Played by Environmental Factors in the Integration of a Transfer Station in a Municipal Solid Waste Management System. Waste Manag. 27 (4), 545–553. doi:10.1016/j.wasman.2006.03.020
Brancoli, P., and Bolton, K. (2019). “Life Cycle Assessment of Waste Management Systems,” in Sustainable Resource Recovery and Zero Waste Approaches (Elsevier B.V), 23–33. doi:10.1016/B978-0-444-64200-4.00002-5
Casa CEM (2020). Eventos de educación. Available at: http://casacem.com/ver_categoria.php?c=2.
Castrejón-Godínez, M. L., Sánchez-Salinas, E., Rodríguez, A., and Ortiz-Hernández, M. L. (2015). Analysis of Solid Waste Management and Greenhouse Gas Emissions in México: A Study Case in the Central Region. Jep 06 (02), 146–159. doi:10.4236/jep.2015.62017
Cherubini, F., Bargigli, S., and Ulgiati, S. (2009). Life Cycle Assessment (LCA) of Waste Management Strategies: Landfilling, Sorting Plant and Incineration. Energy 34 (12), 2116–2123. doi:10.1016/j.energy.2008.08.023
Consejo Nacional de Evaluación de la Política de Desarrollo Social (2015). Rangos según el porcentaje de pobreza y pobreza extrema por AGEB. Available at: https://www.coneval.org.mx/Medicion/Paginas/POBREZA-URBANA-EN-MEXICO-2015.aspx.
Contreras, F., Hanaki, K., Aramaki, T., and Connors, S. (2008). Application of Analytical Hierarchy Process to Analyze Stakeholders Preferences for Municipal Solid Waste Management Plans, Boston, USA. Resour. Conservation Recycling 52, 979–991. doi:10.1016/j.resconrec.2008.03.003
Di Lonardo, M. C., Lombardi, F., and Gavasci, R. (2012). Characterization of MBT Plants Input and Outputs: A Review. Rev. Environ. Sci. Biotechnol. 11 (4), 353–363. doi:10.1007/s11157-012-9299-2
Diario Oficial de la Federación (1992). Secretaría de Comercio y Fomento Industrial-Norma Mexicana NMX-AA-22-1985. Protección al ambiente - Contaminación del suelo - Residuos sólidos municipales - Selección y cuantificación de subproductos.
Diario Oficial de la Federación (2003). Secretaría de Medio Ambiente y Recursos Naturales-Norma Oficial Mexicana NOM-083-SEMARNAT-2003, Especificaciones de protección ambiental para la selección del sitio, diseño, construcción, operación, monitoreo, clausura y obras complementarias de un sitio.
Dias, N., Teresa Carvalho, M., and Pina, P. (2012). Characterization of Mechanical Biological Treatment Reject Aiming at Packaging Glass Recovery for Recycling. Minerals Eng. 29, 72–76. doi:10.1016/j.mineng.2011.10.004
Dias, S. M. (2016). Waste Pickers and Cities. Environ. Urbanization 28 (2), 375–390. doi:10.1177/0956247816657302
Fei, F., Wen, Z., Huang, S., and De Clercq, D. (2018). Mechanical Biological Treatment of Municipal Solid Waste: Energy Efficiency, Environmental Impact and Economic Feasibility Analysis. J. Clean. Prod. 178, 731–739. doi:10.1016/j.jclepro.2018.01.060
Figueroa, R. (2017). Expansión urbana Y Vocación Territorial. Guadalajara, Mexico: Entrevistas IMEPLAN. Available at: https://www.imeplan.mx/en/entrevistas/expansion-urbana-y-vocacion-territorial.
Folz, D. H., and Giles, J. N. (2002). Municipal Experience with "Pay-As-You-Throw" Policies: Findings from a National Survey. State. Local Government Rev. 34 (2), 105–115. doi:10.1177/0160323x0203400203
Gaceta Oficial del Distrito Federal (2012). Norma Ambiental para el Distrito Federal NADF-020-AMBT-2011, que establece los requerimientos mínimos para la producción de composta a partir de la fracción orgánica de los residuos sólidos urbanos, agrícolas, pecuarios y forestales. Available at: http://www.sedema.cdmx.gob.mx/sedema/images/archivos/sedema/leyes-reglamentos/normas/locales/NADF-020-AMBT-2011.pdf.
Ghanimeh, S., Gómez-Sanabria, A., Tsydenova, N., Štrbová, K., Iossifidou, M., and Kumar, A. (2019). Two-Level Comparison of Waste Management Systems in Low-, Middle-, and High-Income Cities. Environ. Eng. Sci. 36 (10), 1281–1295. doi:10.1089/ees.2019.0047
Gómez, G., Meneses, M., Ballinas, L., and Castells, F. (2009). Seasonal Characterization of Municipal Solid Waste (MSW) in the City of Chihuahua, Mexico. Waste Manag. 29 (7), 2018–2024. doi:10.1016/j.wasman.2009.02.006
Grau, J., Terraza, H., Velosa, R., Milena, D., Rihm, A., and Sturzenegger, G. (2015). Solid Waste Management in Latin America and the Caribbean, 3. Inter-American Development Bank. Available at: https://publications.iadb.org/handle/11319/7177#sthash.7bODjAHq.dpuf.
Güereca, L. P., Torres, N., and Juárez-López, C. R. (2015). The Co-processing of Municipal Waste in a Cement kiln in Mexico. A Life-Cycle Assessment Approach. J. Clean. Prod. 107, 741–748. doi:10.1016/j.jclepro.2015.05.085
Guibrunet, L., Sanzana Calvet, M., and Castán Broto, V. (2017). Flows, system boundaries and the politics of urban metabolism: Waste management in Mexico City and Santiago de Chile. Geoforum 85, 353–367. doi:10.1016/j.geoforum.2016.10.011
Guillén, A. (2009). Cuatro vertederos de Zapopan contaminan el Santiago. Available at: https://www.informador.mx/Jalisco/Cuatro-vertederos-de-Zapopan-contaminan-el-Santiago-20090902-0071.html.
Guinée, J. B. (2001). Handbook on Life Cycle Assessment. Operational Guide to the ISO Standards, 148. Kluwer Academic Publishers.
Hoornweg, D., and Bhada-Tata, P. (2012). “What a Waste: A Global Review of Solid Waste Management,” in Urban Development Series Knowledge Papers. doi:10.1201/9781315593173-4
Instituto de Información Estadística y Geográfica (2017). Alcanza Área Metropolitana de Guadalajara los 5 millones de habitantes. Guadalajara, Mexico: STRATEGOS. Available at: https://iieg.gob.mx/strategos/alcanza-area-metropolitana-de-guadalajara-los-5-millones-de-habitantes/.
Instituto Metropolitano de Planeación (2015). Área Metropolitana de Guadalajara: Ciudad. Available at: https://www.imeplan.mx/en/ciudad.
Instituto Nacional de Estadística y Geografía (2013). Estadísticas a propósito de la Industria del cemento.
International Organization for Standardization (2006). Environmental Management — Life Cycle Assessment — Principles and Framework. ISO 14040:2006.
IPCC (2014). Climate Change 2014: Synthesis Report. Contribution of Working Groups I, II and III to the Fifth Assessment Report of the Intergovernmental Panel on Climate Change. doi:10.1016/S0022-0248(00)00575-3
IPCC (2006a). “Mobile Combustion,” in 2006 IPCC Guidelines for National Greenhouse Gas Inventories, 2, 1–78. https://www.ipcc-nggip.iges.or.jp/public/2006gl/index.html.
IPCC (2006b). “Solid Waste Disposal,” in 2006 IPCC Guidelines for National Greenhouse Gas Inventories, 5.
IPCC (2019). Solid Waste DisposalIn. 2019 Refinement 2006 IPCC Guidel. Natl. Greenhouse Gas Inventories 5, 1–25.
IPCC (2006c). “Waste Generation, Composition, and Management Data,” in 2006 IPCC Guidelines for National Greenhouse Gas Inventories, 5. Available at: http://www.ipcc-nggip.iges.or.jp/public/2006gl/spanish/vol5.html.
Kaza, S., Yao, L., Bhada-Tata, P., and Van Woerden, F. (2018). What a Waste 2.0: A Global Snapshot of Solid Waste Management to 2050.
Leme, M. (2010). “Avaliação das Opções Tecnológicas para Geração de Energia a Partir dos Resíduos Sólidos Urbanos: Estudo de Caso,” in Universidade Federal De Itajubá Programa De Pós-Graduação Em Engenharia Da Energia. Available at: http://juno.unifei.edu.br/bim/0037110.pdf.
Liikanen, M., Havukainen, J., Hupponen, M., and Horttanainen, M. (2017). Influence of Different Factors in the Life Cycle Assessment of Mixed Municipal Solid Waste Management Systems - A Comparison of Case Studies in Finland and China. J. Clean. Prod. 154 (June), 389–400. doi:10.1016/j.jclepro.2017.04.023
Manfredi, S., Tonini, D., Christensen, T. H., and Scharff, H. (2009). Landfilling of Waste: Accounting of Greenhouse Gases and Global Warming Contributions. Waste Manag. Res. 27 (8), 825–836. doi:10.1177/0734242X09348529
Martínez, E., Sánchez, V., Villalobos, Ó., de la Mora, L., García, W., Cervantes, P., et al. (2018). Gestión Integral de Residuos Sólidos Base Cero 2018-2021.
Meléndez, V. (2018). Niegan ampliación de relleno sanitario. Available at: https://www.ntrguadalajara.com/post.php?id_nota=100662.
Menikpura, S., Sang-Arun, J., and Bengtsson, M. (2013). Climate Co-benefits of Energy Recovery from Landfill Gas in Developing Asian Cities: A Case Study in Bangkok. Waste Manag. Res. 31 (10), 1002–1011. doi:10.1177/0734242X13492004
Merrild, H., Larsen, A. W., and Christensen, T. H. (2012). Assessing Recycling versus Incineration of Key Materials in Municipal Waste: The Importance of Efficient Energy Recovery and Transport Distances. Waste Manag. 32 (5), 1009–1018. doi:10.1016/j.wasman.2011.12.025
Montejo, C., Tonini, D., Márquez, M. d. C., and Fruergaard Astrup, T. (2013). Mechanical-biological Treatment: Performance and Potentials. An LCA of 8 MBT Plants Including Waste Characterization. J. Environ. Manage. 128, 661–673. doi:10.1016/j.jenvman.2013.05.063
Opportimes (2016). Cemex opera 56 plantas de cemento en el munto. Available at: https://www.opportimes.com/cemex-opera-56-plantas-de-cemento-en-el-mundo/.
Patiño, M. (2019). Guadalajara anuncia mano dura en recolección de residuos. Guadalajara, Mexico: Milenio. Available at: https://www.milenio.com/politica/comunidad/guadalajara-anuncia-acciones-multas-recoleccion-basura.
Periódico Oficial del Estado de Jalisco (2008). NAE-SEMADES-007/2008, que establece los criterios y especificaciones técnicas bajo las cuales se deberá realizar la separación, clasificación, recolección selectiva y valorización de los residuos en el Estado de Jalisco.
Periódico Oficial del Estado de Jalisco (2019). Norma Ambiental Estatal NAE-SEMADET-010/2019, que establece criterios y especificaciones técnicas para la producción de bolsas de plástico para acarreo y popotes de un solo uso que vayan a ser distribuidas y/o comercializadas en el Edo. Guadalajara, Mexico: de Jalisco.
Pikoñ, K. (2012). Abiotic Depletion in Energy and Waste Management Systems. Polityka Energetyczna 15 (1). Available at: https://www.min-pan.krakow.pl/Wydawnictwa/PE151/07.pdf.
Połomka, J., and Jędrczak, A. (2019). Efficiency of Waste Processing in the MBT System. Waste Manag. 96, 9–14. doi:10.1016/j.wasman.2019.06.041
Prensa del Gobierno del Estado de Jalisco (2019). Lanza Gobierno de Jalisco programa integral Jalisco Reduce; anuncia Enrique Alfaro cierre del relleno sanitario de Los Laureles. Available at: https://www.jalisco.gob.mx/es/prensa/noticias/94175.
Romo, P. (2015). Jalisco produce 50% de los plásticos del país. Available at: https://www.eleconomista.com.mx/estados/Jalisco-produce-50-de-plasticos-del-pais-20151022-0170.html.
Rosenbaum, R. K., Hauschild, M. Z., Boulay, A.-M., Fantke, P., Laurent, A., Núñez, M., et al. (2018). Life Cycle Impact Assessment. Life Cycle Assess. Theor. Pract. 148, 167–270. doi:10.1007/978-3-319-56475-3_10
Saier, M. H. (2007). Climate Change, 2007. Water Air Soil Pollut. 181, 1–2. doi:10.1007/s11270-007-9372-6
Salmerón-Gallardo, Y. (2016). Evaluación Sinóptica del Impacto Ambiental de Sitios de Disposición Final en Etapa de Posclausura. Chilpancingo, Mexico: Universidad Autónoma de Guerrero.
Sánchez, A., Artola, A., Gea, T., Barrena, R., and Font, X. (2015). A New Paradigm for Waste Management of Organic Materials. Waste Manag. 42, 1–2. doi:10.1016/j.wasman.2015.05.002
Sarc, R., Petrović, K., Relić, I., and Lorber, K. (2018). Mechanical-Biological Waste Treatment Plants in Croatia. Waste Manag., 315–336.
Secretaría de Energía (2020). Lista de combustibles y sus poderes caloríficos 2021 que se considerarán para identificar a los usuarios con un patrón de alto consumo, así como los factores para determinar las equivalencias en términos de barriles equivalentes de petróleo. Available at: https://www.gob.mx/cms/uploads/attachment/file/302306/Lista_de_combustibles_2018.pdf.
Secretaría de Medio Ambiente y Recursos Naturales (2020). Diagnóstico Básico para la Gestión Integral de los Residuos.
Secretaría de Medio Ambiente y Recursos Naturales (2021). Factor de emisión del sistema eléctrico nacional 2020. (Issue 223). Available at: https://www.gob.mx/cms/uploads/attachment/file/630693/Aviso_FEE_2020.pdf.
Sever Akdağ, A., Atımtay, A., and Sanin, F. D. (2016). Comparison of Fuel Value and Combustion Characteristics of Two Different RDF Samples. Waste Manag. 47, 217–224. doi:10.1016/j.wasman.2015.08.037
Sevigné-Itoiz, E., Gasol, C. M., Rieradevall, J., and Gabarrell, X. (20152015). Contribution of Plastic Waste Recovery to Greenhouse Gas (GHG) Savings in Spain. Waste Manag. 46, 557–567. doi:10.1016/j.wasman.2015.08.007
Silva, V., Contreras, F., and Bortoleto, A. P. (2021). Life-cycle Assessment of Municipal Solid Waste Management Options: A Case Study of Refuse Derived Fuel Production in the City of Brasilia, Brazil. J. Clean. Prod. 279, 123696. doi:10.1016/j.jclepro.2020.123696
Sipper, B. (2019). It’s Time for Glass Again. Can We End Beverage Industry’s Use of Plastic? Waste Advantage. Available at: https://wasteadvantagemag.com/its-time-for-glass-again-can-we-end-beverage-industrys-use-of-plastic/.
Stegmann, R. (2018). Mechanical Biological Pretreatment. Solid Waste Landfilling, 141–155. doi:10.1016/b978-0-12-407721-8.00008-5
Teoli, D., Sanvictores, T., and Jason, A. (2020). SWOT Analysis. Treasure Island, FL: StatPearls Publishing LLC. Available at: https://www.ncbi.nlm.nih.gov/books/NBK537302/.
Torretta, V., Ferronato, N., Katsoyiannis, I., Tolkou, A., and Airoldi, M. (2017). Novel and Conventional Technologies for Landfill Leachates Treatment: A Review. Sustainability 9 (1), 9–39. doi:10.3390/su9010009
Trulli, E., Ferronato, N., Torretta, V., Piscitelli, M., Masi, S., and Mancini, I. (2018). Sustainable Mechanical Biological Treatment of Solid Waste in Urbanized Areas with Low Recycling Rates. Waste Manag. 71, 556–564. doi:10.1016/j.wasman.2017.10.018
Tsydenova, N. (2017). Applying Waste Treatment Scenarios in Toluca Region (Mexico) 5(1), 1–8. doi:10.12777/wastech.5.1.%p
Tsydenova, N., Vázquez Morillas, A., and Cruz Salas, A. (2018). Sustainability Assessment of Waste Management System for Mexico City (Mexico)-Based on Analytic Hierarchy Process. Recycling 3 (3), 45. doi:10.3390/recycling3030045
Valente-Santos, C., and Guevara-García, J. (2019). El papel de los pepenadores de materiales reciclables en la gestión de residuos sólidos: los casos de Brasil y México. Revista Legislativa de Estudios Sociales y de Opinión Pública 12 (24), 87–114. Available at: https://dialnet.unirioja.es/servlet/articulo?codigo=6980074.
van Oers, L., and Guinée, J. (2016). The Abiotic Depletion Potential: Background, Updates, and Future. Resources 5 (1), 16. doi:10.3390/resources5010016
van Praagh, M., Heerenklage, J., Smidt, E., Modin, H., Stegmann, R., and Persson, K. M. (2009). Potential Emissions from Two Mechanically-Biologically Pretreated (MBT) Wastes. Waste Manag. 29 (2), 859–868. doi:10.1016/j.wasman.2008.06.028
Vielhaber, B. (2015). Mechanical-Biological Treatment Plant in Hanover , Germany – Experience in Mechanical Processing , Anaerobic Digestion and Refuse Derived Fuel Quality. Neuruppin, Germany: International Recycling and Recovery Congress IRRC Waste-to-Energy, 387–398.
Xin, C., Zhang, T., Tsai, S.-B., Zhai, Y.-M., and Wang, J. (2020). An Empirical Study on Greenhouse Gas Emission Calculations under Different Municipal Solid Waste Management Strategies. Appl. Sci. 10 (5), 1673. doi:10.3390/app10051673
Zanin, M., Santos, C. V., and García, J. A. G. (2019). “Catadoras E Catadores De Materiais Recicláveis E A Perspectiva Social Dos Resíduos Sólidos Urbanos Casos Do México E Brasil,” in Pepenadoras y Pepenadores de Materiales Reciclables y la Perspectiva Social de los Residuos Sólidos Urbanos: Casos de México y Brasil, 83–105. doi:10.5935/978-85-65527-30-9
Keywords: MSW, MBT, life-cycle assessment, developing country, circular ecomomy
Citation: Lara-Topete GO, Yebra-Montes C, Orozco-Nunnelly DA, Robles-Rodríguez CE and Gradilla-Hernández MS (2022) An Integrated Environmental Assessment of MSW Management in a Large City of a Developing Country: Taking the First Steps Towards a Circular Economy Model. Front. Environ. Sci. 10:838542. doi: 10.3389/fenvs.2022.838542
Received: 17 December 2021; Accepted: 14 March 2022;
Published: 14 April 2022.
Edited by:
Nsikak U. Benson, Covenant University, NigeriaReviewed by:
Temitope O. Sogbanmu, University of Lagos, NigeriaGodwin Asukwo Ebong, University of Uyo, Nigeria
Copyright © 2022 Lara-Topete, Yebra-Montes, Orozco-Nunnelly, Robles-Rodríguez and Gradilla-Hernández. This is an open-access article distributed under the terms of the Creative Commons Attribution License (CC BY). The use, distribution or reproduction in other forums is permitted, provided the original author(s) and the copyright owner(s) are credited and that the original publication in this journal is cited, in accordance with accepted academic practice. No use, distribution or reproduction is permitted which does not comply with these terms.
*Correspondence: Misael Sebastián Gradilla-Hernández, bXNncmFkaWxsYUB0ZWMubXg=