 Louis Bouchet
 Martin C. Thoms
 Melissa Parsons†
- Riverine Landscapes Research Laboratory, University of New England, Armidale, NSW, Australia
Groundwater systems are social-ecological systems (SES) in which human communities, groundwater dependent ecosystems and groundwater resources are linked, and therefore, cannot be studied in isolation. Complex adaptive systems are characterised by non-linear relationships and feedbacks between the system variables. Modeling feedbacks between social and ecological variables of groundwater systems requires a shift from traditional hydrogeological studies to more holistic approaches that simulate groundwater as a SES. A framework was developed to study and manage groundwater as a social-ecological system. Operationalizing the framework to develop empirical models that consider the social and ecological aspects of groundwater dynamics requires translating the framework components into measurable model inputs that capture the key relationships between social and ecological components. Causal loop diagrams (CLD) are an ideal tool for translating between a conceptual framework and an operational, empirical model. Causal loop diagrams can reveal system complexity associated with the interaction of social, ecological and hydrological components, and identify key inputs that need to be considered to model groundwater as a SES. This paper applies CLD to conceptualize the feedbacks between the social, ecological and hydrological components of a groundwater system. The concept is applied to the groundwater system in the island of Nauru, and shows that two balancing feedbacks help maintain the system in a precarious state of usability while several reinforcing feedbacks in the social subsystem apply constant pressure to the system. The CLD reveals that the social subsystem is large and complex, even though the island population is small (approximately 10,000 people). It also demonstrates that the social system is by far the larger disruptor and has the greater potential to alter system states.
1 Introduction
Groundwater systems are social-ecological systems (SES) in which human communities, groundwater resources and groundwater dependent ecosystems (GDE) are linked (Bouchet et al., 2019). Groundwater provides a range of ecosystem services valuable to humans, including the provision of freshwater and food. Human communities also influence groundwater quality and availability through land use, pollution and extraction (Barreteau et al., 2016). However, it has often been observed that change in a human component of the system (e.g., groundwater extraction) does not necessarily lead to a change of similar magnitude in a physical component of the system (e.g., saltwater intrusion) because, in a complex SES, interactions between human communities, groundwater resources and GDE generate non-linear relationships and feedbacks (Bouchet et al., 2019; Comte et al., 2015; Paniconi et al., 2001). Consequently, the social and ecological components of groundwater SES cannot be studied in isolation. There has been a recent push to integrate hydrogeological studies with other disciplines (e.g., engineering, ecology, social sciences) to provide more holistic approaches to water management and planning (Mielby and Henriksen, 2020). However, hydrogeological studies are often an addition to broader water management incentives rather than being integrated into whole-of-design water projects and policies (Elshall et al., 2020). Hydrogeological studies are commonly solution orientated, aiming to answer a specific problem with a social or environmental focus (e.g., how much groundwater can be abstracted without negative impact on surrounding socio-environmental systems). As such they do not consider how the social and environmental elements of a complex adaptive system interact and how interactions may affect, or be affected by, technical solutions proposed by these studies. Thus, there is currently disconnect between the impact that anthropogenic activities have on groundwater resources and the limited extent to which these anthropogenic influences are understood and incorporated into groundwater research (Kemper, 2004; Re et al., 2017).
Research on groundwater systems is often focused on hydrogeological and hydrodynamic processes (Barreteau et al., 2016). Conceptual and numerical models are widely used to represent groundwater flow and its interaction with surrounding environments (Betancur et al., 2012; Yang et al., 2010). Numerical models can be highly complex representations of groundwater flow and solute transport. However, these models do not incorporate the non-linear relationships and feedbacks between aquifers, GDE and human communities and, how these influence groundwater flow and quality. This can lead to management strategies that are not well suited to addressing the social processes at the root of groundwater pollution and/or depletion issues (Hynds et al., 2018). Modeling the feedbacks between social and ecological components of groundwater systems requires a shift from traditional hydrogeological studies to more holistic approaches that simulate groundwater as a SES.
Bouchet et al. (2019) developed a framework to study and manage groundwater as a social-ecological system. The framework has three components or building blocks (Table 1): complex adaptive systems (CAS); resilience thinking; and, Strategic Adaptive Management (SAM). However, operationalising the framework to assist with the development of empirical models that consider both the social and ecological aspects of groundwater dynamics requires translating conceptual complex system thinking into measurable model inputs that capture actual relationships between social and ecological components. Causal loop diagrams (CLD) are an ideal tool for translating between a conceptual framework and empirical modelling. Situated in the field of systems thinking, causal loop diagrams map the complexity of relationships among system components using linear chains of causes and effects and associated circular causal relationships, also known as feedback loops (Kirkwood, 1998; Janssen, 2011). Applied to models of groundwater as a SES, causal loop diagrams can reveal system complexity associated with the interaction of social, ecological and hydrological components, and identify key inputs that need to be considered to model groundwater SES.
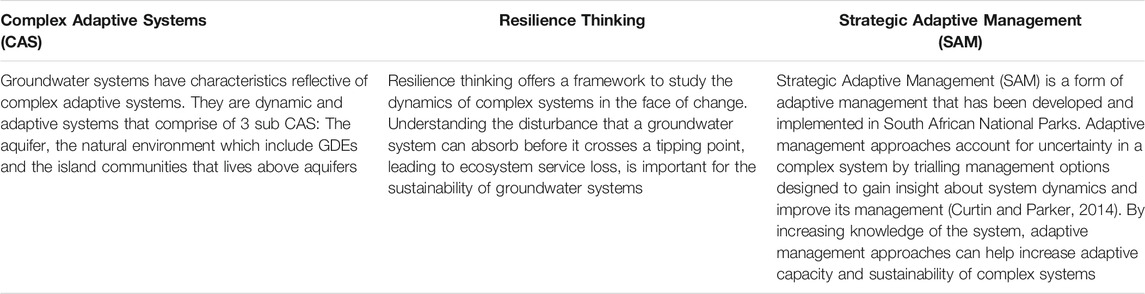
TABLE 1. Building blocks of the framework for managing groundwater in Pacific Small Island Developing States. Adapted from Bouchet et al. (2019).
This paper applies CLD to conceptualize relationships and feedbacks between the social, ecological and hydrological components of a groundwater system. We first overview the specific approach and steps required to develop a CLD in relation to a groundwater SES. Important system characteristics of CAS, resilience thinking and SAM—the main building blocks of the framework—are investigated, including system identity, desired system states and reorganization and feedback. The island of Nauru is used as a case study to illustrate the development a CLD for groundwater as a SES. Ultimately, the CLD reveals key measurable components that can be used for empirical modelling and subsequent testing of resilience and sustainability scenarios (Bouchet et al., 2019).
2 Methods
2.1 Causal Loop Diagrams for Groundwater Social-Ecological Systems
Causal loop diagrams are a foundational tool in systems thinking (Haraldsson, 2004). Originally applied to industrial management and production (Forrester, 1961), the approach has evolved to include ecological, social and business systems (Hirsch et al., 2007; Kiani et al., 2009). In a CLD, causal relationships between key variables are expressed using positive and negative relationships (Tip, 2011) which may be direct (e.g., an increase in one variable generates an increase of the linked variable) or inverse (e.g., an increase in one variable generates a decrease of the linked variable). This relatively simple notation between system components overcomes the suggested inability of CLDs to correctly capture flows into and out of “stocks” in complex systems (Richardson, 1997). A causal loop diagram is built using closed loops (Figure 1) that incorporate two or more variables and represent the feedback mechanisms within the system (Neal, 2016). Balancing (negative) feedbacks maintain the system in a stable domain (Mitleton-Kelly, 2003). Conversely, reinforcing (positive) feedbacks can lead to extreme change and re-organisation in the system, until a new stable state is reached, with a new set of balancing feedbacks (Collier and Hooker, 1999).
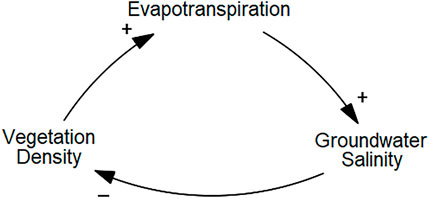
FIGURE 1. Example of a simple causal loop diagram showing two closed loops.
Faced with the challenge of understanding the relationships between multiple social, ecological and hydrological components causal loop diagrams are a heuristic approach for identifying and mapping complex relationships in groundwater systems. Causal loop diagrams allow for the identification and extraction of relationships that can be used as variables to input into empirical models of groundwater as SES. There are four properties of groundwater systems that should be included in the CLD: system desirability, system identity, system states and causality and feedback. These properties are key attributes of CAS and are central to the groundwater framework developed by Bouchet et al. (2019). Studying each property enables the dynamic interplay between the components of groundwater SES to be evaluated.
The following sections overview the contribution of each property to the construction of a CLD for groundwater as a social-ecological system.
2.1.1 System Desirability
System desirability refers to the social consensus over the use of the resources (Heitzig et al., 2016). System dynamics focus on finding causes of undesirable behaviour within the system (endogenous behaviour) instead of attributing undesirable behaviour to variables outside the system (exogenous drivers) (Forrester, 1993). The aim is to identify those variables (and associated feedbacks) that may be altered in order to steer the system toward a desirable state. The first step to constructing a CLD is to identify system desirability (Table 2). A desirable system is characterised by at least one state at which the system is at equilibrium (Haraldsson, 2004). The social input to this step is key and, participatory approaches to gather perceptions of the system are essential. The system dynamics approach to CLD emphasises gathering primary data from different sources to characterise the system. A variety of data sets or information sources are used to elaborate CLDs and these can come from mental data bases (perception, actions and non-written rules), written data bases (policies, law and written procedures) or numerical data bases (numerical data) (Forrester, 1993).
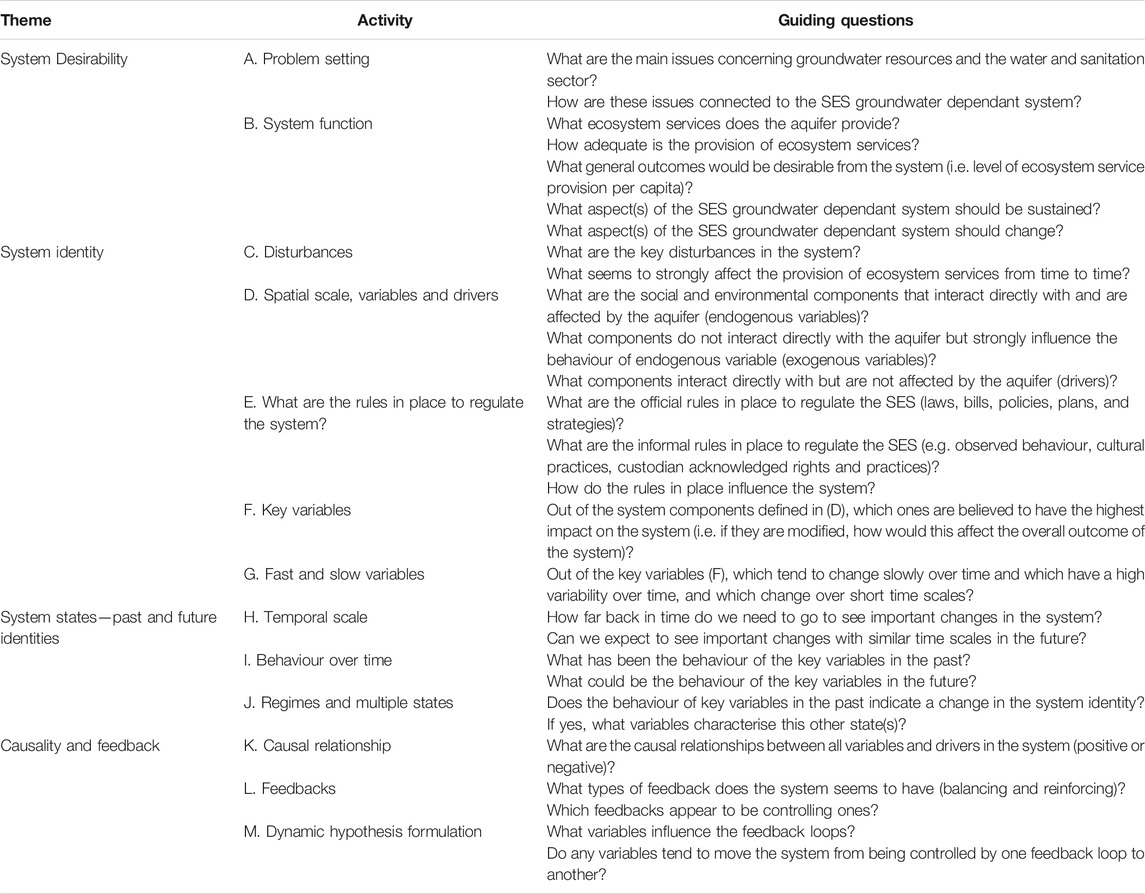
TABLE 2. Properties to consider in causal loop diagrams of groundwater social-ecological systems.
Gathering primary data from mental and written data bases is well suited to CLD of SES because social components and their feedbacks are often not captured using the quantitative methods of data collection favoured by the biophysical sciences (Bouchet et al., 2019). To appraise desirability, stakeholders within the groundwater SES must be identified and included within the study scope. The needs of stakeholders will generally determine how they currently rely on the resource (e.g. groundwater extraction for various use) or how they may impact the resources (e.g. waste disposal leaching to groundwater). Available technical studies (e.g. groundwater user census, groundwater licences and usage, contamination studies) assist in identifying issues and key stakeholders.
2.1.2 System Identity
Defining current system identity is the second step in unpacking the behaviour of a complex system into a high-level representation using CLD. There is no universal definition of system identity. In the resilience literature, system identity is often characterised by the dynamic relations among the parts (Cumming and Collier, 2005), from which originate system function and structure. System function is associated with desirability since function is a desired outcome of system behaviour. In the ecological resilience literature, system function is associated with ecosystem services while structure includes system scale, key variables, drivers and disturbances as well as the rules in place (written and non-written) that define how variables interact with one another.
The selection of appropriate system boundaries is fundamental to system identity within a CLD. A CLD should only have a few exogenous drivers. All variables thought to be important should be included (i.e. as endogenous variables) whether or not numerical data exist (Sterman, 2000). Complex systems are generally controlled by a small number (4–6) of endogenous variables (Walker et al., 2012). These key variables are also called slow variables because they tend to change slowly over time or over larger spatial areas (Walker et al., 2012). A disturbance of sufficient magnitude may push the system across a tipping point into a new stable state, in which the system no longer has the same identity.
In a groundwater SES, system function can be represented by one or more ecosystem services (e.g., provision of freshwater, sustaining of trees during dry periods, sustaining of fauna). System structure can be represented by scale, key variables, rules and disturbances. Scale may be spatially limited to catchment boundaries but should include the larger social system which relies on, or has an impact on, the resource. Key variables are drivers associated with the hydrogeological, ecological, socio-political and economic sub-systems. Rules are linked to law and policy but also include non-written rules such as customary laws and cultural/religious practices. Disturbance encompasses all actions that impact the system from outside (drivers) such as climate variability, climate change, foreign policies and market changes.
2.1.3 System States
Understanding the level of disturbance a system can absorb before it moves into a new regime or state is an objective of ecological resilience studies (Carpenter et al., 2001). Ecological resilience was first defined by Holling (1973) as “the amount of disturbance that an ecosystem can withstand without changing self-organized processes and structures”. Ecological resilience considers ecosystems as complex systems with multiple stable states. Ecological resilience thus focuses on maintaining structure and function in ecological systems (Schulze, 1996). Desired system states are defined by variation in key variables (slow variables). Historical data for key variables may provide insight on past system behavior and whether the system has experienced different stable states. This is especially relevant where baseline data is available (i.e. prior to anthropogenic disturbance).
Four elements of resilience thinking are relevant to groundwater systems (Bouchet et al., 2019); basins of attraction (i.e. stable states), tipping points, ecosystem services and the potential loss that might occur between two stable states. Reviewing historical data of a groundwater SES should highlight key variables, drivers and disturbances and may reveal tipping points for the system. Tipping points may be characterised by a significant change in the number of users relying on the resource or change in usage or type of use. A common example is an increase in groundwater salinity which may occur as a result of groundwater extraction, sea level rise (seawater intrusion), or deforestation (dryland salinity). The increase might be significant enough that many users are not able to rely on the resource anymore and must find another water source. The system would have reached a tipping point if groundwater users—human and ecosystems—are negatively impacted by the change in groundwater quality, to the point that the system would need to re-structure in order to maintain desirability and identity.
2.1.4 Causality and Feedback
Complex systems are constantly changing (i.e. the variables characterising its structure and function are changing) but the structure of the system (i.e. key variables and processes that support function) tend to remain within the same stable state, supported by balancing feedbacks (Walker et al., 2004). A part of a system receives feedback when the way its neighbours interact with it at a later time depends on how it interacts with them at an earlier time (Ladyman et al., 2013). Balancing feedbacks (negative) are an important tacit rule within complex systems that help maintain the system in a stable domain (Mitleton-Kelly, 2003). Conversely, reinforcing feedbacks can lead to major change in the system and re-organisation until a new stable state is reached, with a set of balancing feedbacks.
Examples of feedback mechanisms that have been observed in groundwater SES are detailed in Bouchet et al. (2019). One example is a feedback between seawater intrusion and vegetation. Comte et al. (2015) observed that an increase in seawater intrusion in a small coral atoll caused a decrease in vegetation, because many species cannot survive in highly saline conditions. In return, the decrease in vegetation allowed an increase in aquifer recharge because of reduced evapotranspiration, which then reduced aquifer salinity.
Investigating feedbacks is the final step in building CLD. The CLD is created by linking each variable to another (or several others) through causal relationships. Once all variables have been linked, the feedbacks are revealed.
2.2 Case Study
Nauru is an independent island nation of 10,000 people located in the central Pacific region. The island is 22 km2 and most of the population resides on the island fringe. Fresh groundwater is primarily found in the coralline sand aquifer along the island coastline; a coralline sand deposit up to 10 m deep that lies between the soil and the older limestone (Figure 2). Nauru is a raised coral atoll primarily composed of dolomitic limestone overlying a volcanic seamount. The limestone which extend to about 500 m deep is believed to be intensely karstified to a depth of 55 m below sea level (Jacobson, 1997). The coastal terrace was formed while sea level was about 3 m higher. With sea level receding, the coastal terrace was exposed and covered by a small deposit of coral sand (Figure 3).
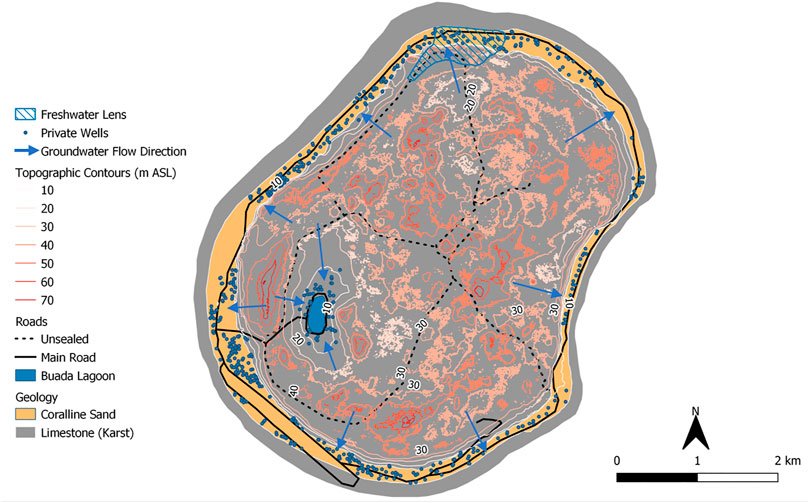
FIGURE 2. Topography and hydrogeological features of Nauru.
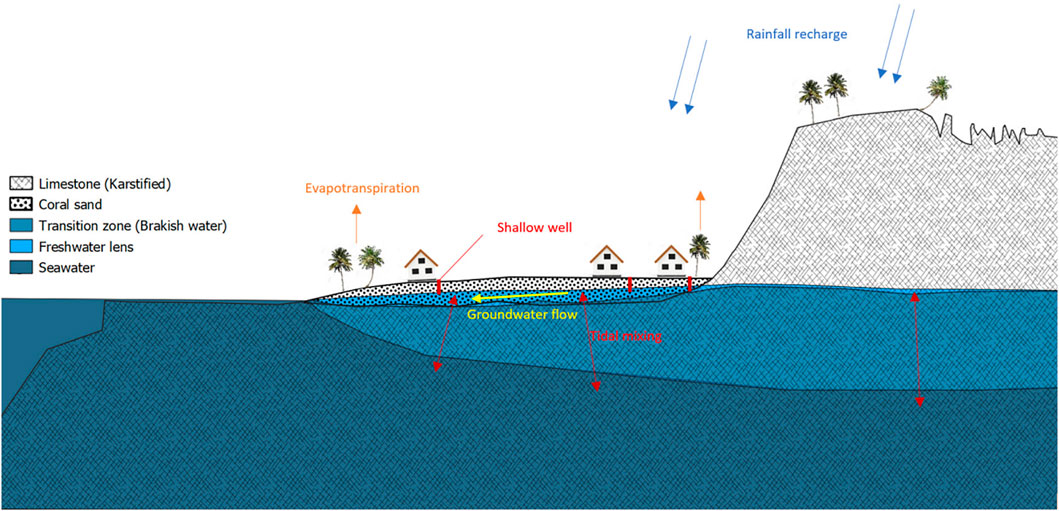
FIGURE 3. Conceptual hydrogeological cross section showing groundwater features in Nauru.
There are no rivers or streams on the island. The only permanent surface water body is Buada lagoon (Figure 2), a brackish lake that is likely hydraulically connected to the surrounding groundwater based on the observed similarity in electrical conductivity (Bouchet and Sinclair, 2010). Groundwater recharge occurs primarily from rainfall infiltration to the limestone and coralline sand aquifer. Jacobson and Hill (1988) estimated recharge to be approximately 40 percent of rainfall, which is an average of 620 mm per year. The groundwater flow follows a topographical gradient, from the island centre toward the coastline and Buada lagoon (Figure 2). In the coralline sand aquifer, the water table fluctuates with tidal movement and is generally within a couple of metres from the surface. In the limestone, groundwater below elevated ridges can be up to 60 m deep. Overall groundwater levels vary from approximately 4 m ASL in the island interior to near sea level where the groundwater discharge to the sea along the coastline (Alberti et al., 2019).
The freshwater lens is not continuous and is mostly present in some areas of the coralline sand aquifer (coastal terrace). It is believed that the small island size, coupled with the high conductivity and karstified nature of the limestone, does not allow the formation of any substantial freshwater lens on the island interior (Bouchet and Sinclair, 2010). Previous groundwater investigations have concluded that only a small area on the North east of the island contains a permanent freshwater lens (referred herein as the “Ewa freshwater lens”) (Castelletti et al., 2012), estimated to be 5 m thick on average (Figure 2). The groundwater quality in the remainder of the coralline sand aquifer is highly variable and fluctuates from fresh to highly brackish, influenced by recharge events, abstraction volumes and localized geological features. In this study, we consider the coastal aquifer system as two connected systems: the Ewa freshwater lens (which because of its size differs from other small non-permanent lenses) and the remainder of the coralline sand aquifer along the coastline.
Groundwater is the only reliable freshwater resource in Nauru. Groundwater is largely tapped by dwellings along the coastline, and around half of the island’s population has reticulated access to groundwater through privately owned wells. For these dwellings, groundwater is used for up to 83% of their water needs. Considering all users, reliance on groundwater varies from about 25% to more than 50% of total water use, depending on the availability of alternative sources of rainwater or desalinated water. Considering an estimated domestic demand of 150L per capita per day, this represents a total groundwater demand of 375—750 KL per day (Bouchet and Sinclair, 2010). The majority of this demand applies to the brackish coastal aquifer water, for non-potable uses. Specific demand that applies to the freshwater lens is currently unknown as new businesses (i.e. laundries) have recently been established by landowners. A study conducted in 2012 estimated that the sustainable extraction yield for the freshwater lens was approximately 16 KL per day (Castelletti et al., 2012).
The aquifer is subject to substantial impacts on water quality and availability. Although groundwater is naturally vulnerable to saltwater intrusion because of the limited extent of the coralline sand aquifer, increased abstraction has exacerbated this vulnerability. Change in water quality due to anthropogenic activities has impacted local communities to the point where groundwater is called “brackish water” and regarded as a dirty source of water (Bouchet, 2011). The aquifer is polluted by faecal contamination from poorly designed sanitation systems and by point source hydrocarbon contamination, posing serious health risks to the community (Bouchet and Sinclair, 2010). Even though groundwater is widely used, low quality has created a reinforcing feedback where groundwater is poorly valued and whose protection is of low priority. The need to manage groundwater in a holistic way has been recognised in Nauru for more than a decade (Pacific Island Applied Geoscience Commission, 2007), but there has not been any significant improvement in groundwater governance, management, quality or availability (Bouchet 2014a). Efforts of governments and donor partners to better manage groundwater have focused on small scale technical solutions and top down regulation, which have so far been mostly ineffective. Thus, there is a need for new forms of groundwater governance and management that recognise the complexity of groundwater in Nauru as a SES (Bouchet et al., 2019). This SES is mapped using a CLD in the following sections, to reveal the complexity associated with the interaction of social, ecological and hydrological components of groundwater on Nauru.
2.3 Analytical Software
The CLD was developed using the Vensim software (Version 6.4). Vensim is a system dynamics simulation software for developing, analyzing, and packaging dynamic feedback models. Within Vensim, CLDs are created by adding variables and creating causal links between relevant variables. Once the causal relationships have been defined in the CLD, feedbacks can be revealed using the feedback function to identify reinforcing and balancing feedbacks. CLDs are not system dynamics models. They are conceptual models and as such, the relationship between each variable is defined as a causal link (i.e. + or −) determined from multiple lines of evidence in existing data. Thus, the relationship between each variable is not quantified for the CLD and Vensim is only used to draw and reveal the feedback loops in the system based on the manually defined relationships between the variables.
2.4 Data
The Nauru CLD was developed using existing data. The Water Sanitation and Climate Outlook Nauru (WSCON) (Bouchet, 2011) is the main source of “mental data” guiding the construction of relationships in the CLD. The WSCON used a participatory research process with community groups and two inter-disciplinary technical and advisory groups to review past, current and forecasted issues within the Nauru water sector. These data are of particular relevance because they were collected through a participatory process and reflect the views of various stakeholders about the water sector.
The WSCON data were also captured 2 years prior to the reopening of the Nauru Regional Processing Centre (NRPC). The NRPC, an Australian government migration detention centre, generates substantial revenue for the Nauruan government and creates better-paid employment opportunities which in turn stimulate the economy. At the time of the WSCON data collection, the government’s annual revenue was $20 million. In 2016, during the NRPC operations, it was estimated at $115 million, a 550% increase. By stimulating the economy and providing technical assistance in the energy and water sector, the NRPC significantly improved the access to water for many Nauruan households. However, the NRPC it is not a sustainable source of revenue for the island and the centre is likely to close in the foreseeable future. After the closure of the first NRPC (2001–2008) the local economy quickly declined (Davies and Doherty, 2018). As many groundwater issues are linked to water sector performance and household income, it is important to acknowledge the role of the local economy.
A review of available data provided supplementary data on the current and possible future of the water and sanitation sector. This written and numerical data includes: national statistics; national laws, policies and plans; water production, storage and distribution data; groundwater quality and abstraction data; groundwater investigation reports and hydrogeological data; water sector governance; and, management report data.
3 Results
3.1 System Desirability
System desirability was inferred from the WSCON study. Multiple issues directly related to groundwater or affecting groundwater at various scales have been reported in the WSCON, reflecting community desire for improved ecosystem services. The desired state for the Ewa freshwater lens is to retain the same average size, or to continue to provide freshwater all year round, and offer a maximum amount of stored water during drought periods. A desirable state for most of the aquifer is one that offers groundwater of a better quality (i.e. reduction in salinity and pollution levels). A desirable state for the dozens of private wells affected by hydrocarbon contamination is one that will allow them to use their groundwater, at least for secondary use. The reduction in pollution level from anthropogenic activities applies to the entire aquifer. However, a distinction must be made between the freshwater lens, whose freshwater volume is a critical characteristic, and the rest of the aquifer, whose salinity levels are the main criteria for desirability. The desirability of the groundwater system in Nauru can thus be defined using three criteria conveying groundwater quality and quantity, where the system is one that:
• Can yield a sufficient amount of water to meet demand in combination with other sources;
• Contains a freshwater lens of the largest possible volume;
• Has a coastal aquifer of the lowest possible level of salinity; and,
• Is free of all types of contamination.
3.2 System Identity
3.2.1 Function
As described in Section 2.1.2, the identity of the groundwater system includes system function and structure. In Nauru, three main groundwater system functions can be observed: 1) Drinking water for a handful of households that are located above the Ewa freshwater lens; 2) Secondary water for the entire island (i.e. all uses except drinking), either directly through private wells or through community wells; 3) Sustaining coastal vegetation, including deep rooted trees and shrubs of high cultural importance to Nauruans, such as Cocos nucifera (coconut), Pandanus tectorius (pandanas), Musa spp. (banana), Mangifera indica (mango), Atrocarpus altilis (breadfruits), Carica papaya (pawpaw) and Morinda citrifolia (noni) (Thaman et al., 2008; Bouchet and Sinclair, 2010; Bouchet, 2011; Bouchet, 2014b). It is noted that for a dozen private wells located in the area affected by hydrocarbon contamination, the groundwater is unusable. Long term adverse effects of hydrocarbon contamination on the health of the coastal vegetation are also likely (Novakovskiy et al., 2021). Thus, for the area affected by hydrocarbon pollution, the current system function is limited to the provision of contaminated water to coastal vegetation.
3.2.2 Boundaries
From the desirability criteria above, desirability is considered subjective, dynamic and affected by cross scale interactions. Operationalising desirability criteria requires system boundaries to be defined and to include variables and drivers that affect the ability of the system to meet desirability criteria, as well as variables and drivers that may alter desirability criteria. Cross-scale interactions are an important factor when assessing desirability and in Nauru the desirability factors for groundwater are linked to the entire water sector. One can appreciate that if every household in Nauru was to be provided with a sufficient supply of safe freshwater free of charge, there would be little desire for Nauruans to access significant volumes of groundwater free of contamination. The system boundaries were thus defined to include the entire water sector and any other factors that impact, and are impacted by, change in groundwater quality or quantity.
3.2.3 Variables
An inventory of key drivers (i.e., exogenous variables) and endogenous variables (i.e., variables within the system) was completed based on indicators primarily from the WSCON (Bouchet 2011), national groundwater reports and publications (Bouchet and Sinclair, 2010; Castelletti et al., 2012; Alberti et al., 2017) and relevant national policies and plans (Republic of Nauru, 2011; Republic of Nauru, 2015). Variables were sorted by subsystem (eco-hydrogeological and social) and drivers were characterised similarly as environmental or human. Finally, variables were differentiated by their fast or slow dynamic (Table 3). This differentiation is important because slow variables generally control system states and cohesion (Walker et al., 2012). Four variables were identified for the Narau groundwater SES:
• Groundwater lens volume;
• Brackish groundwater salinity levels;
• Domestic demand for groundwater; and,
• Groundwater E-coli levels.
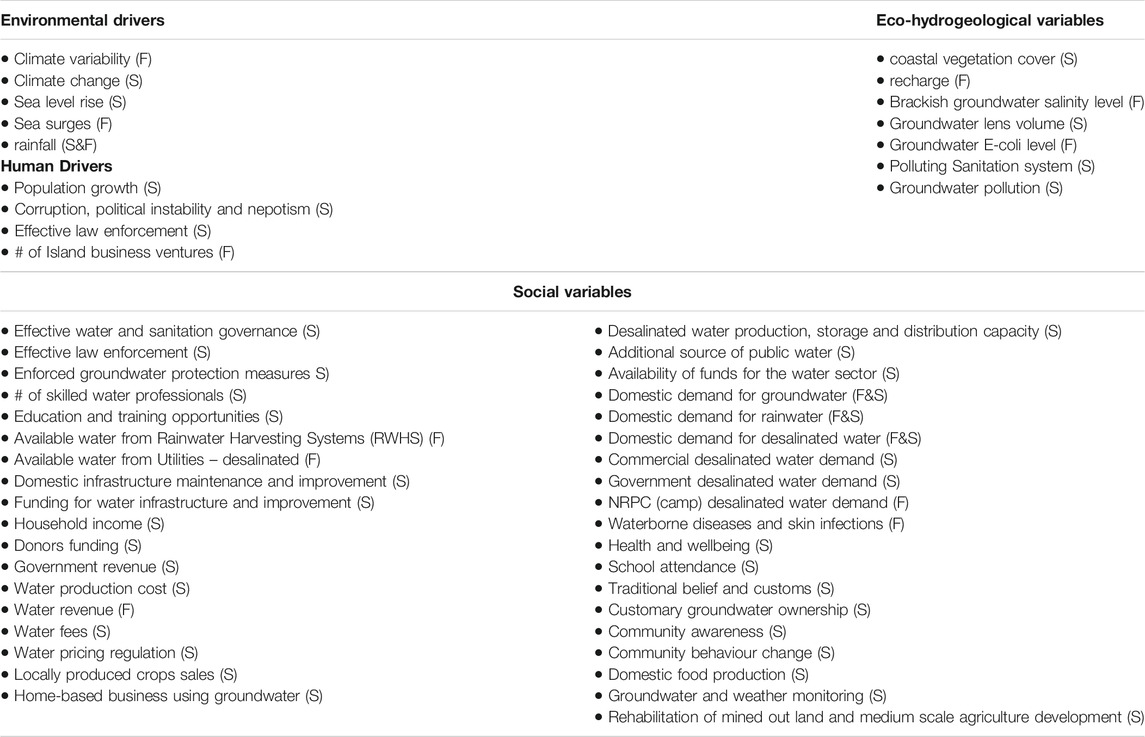
TABLE 3. Nauru groundwater SES drivers and variables. (S) represents slow variables and (F) fast variables.
Key variables are different for the brackish aquifer and the groundwater lens, because we consider the lens separately, and because the lens volume is an earlier indicator of saltwater intrusion and is thus preferred to reflect the lowest possible level of salinity in the groundwater.
As the CLD is an investigation of causal relationships between each variable, some variables must be excluded if they are not of high importance and will likely need many more variables to explain their behaviour. For example, hydrocarbon pollution is an issue for a dozen wells in Aiwo district. However, this is site-specific and does not have the same causal behaviour as the E-coli pollution from sanitation systems. The presence of E-coli, which is known to be an island wide issue was thus selected as the key variable for contamination. The key variables selected are in line with Bouchet et al. (2019) who suggest the use of groundwater quality and quantity variables to conceptualize groundwater SES, along with social and ecological variables associated with the use of the resource.
3.2.4 Rules in Place
Formal sets of rules relevant to groundwater in Nauru include plans, policies and laws from the water, public infrastructure, environment and energy sectors. However, there are currently no laws, policies or plans that regulate the use of groundwater resources. Therefore, informal and customary laws are prime in defining how the resource is used. Customary land ownership applies to groundwater resources and thus the resource is privately owned. Additionally, government participation in maintenance and replacement of water assets at domestic (private) level is ill defined but substantial. This participation is mainly funded through foreign aid, which also provides a significant input into the funding and regulation of the Nauru water and energy sectors.
3.2.5 Disturbances
Disturbances include climate change, population growth and politics. Climate-related change in average rainfall, sea level and increased climate variability (sea surges and drought/heavy rainfall events) have been reported by the Australian Bureau of Meteorology BOM and CSIRO (2014). Population growth is an important driver that puts pressure on the system both from direct demand for groundwater and through land use change and surface pollution. Finally, politics plays a major role in setting up priority areas for funding and policy development, and influences decision making about recipients of domestic fundings. Foreign politics also plays an important role in securing aid funding.
3.3 System States
System states are defined by variation in the key (slow) variables. These are groundwater lens volume, brackish groundwater salinity levels, domestic demand for groundwater and groundwater E-coli levels. Although there are limited data to investigate past system states, anecdotal recollections from elders collecting groundwater from karst caves are evidence that groundwater has been used in Nauru for centuries. Considering that there is no surface water on Nauru and that rainwater storage would have been very limited prior to the introduction of large rainwater tanks, it is evident that groundwater would have played an important role in meeting Nauruan basic water needs. Prior to the introduction of flushing toilets, the contamination of the groundwater by faecal bacteria (such as E-coli) would have been very limited. The much smaller population, coupled with no pumping of groundwater, would have also limited saltwater intrusion. It is thus likely that in the past the coastal aquifer would have supported several freshwater lenses providing freshwater during drought periods. The steady increase in population coupled with well development, introduction of groundwater pumping (manual and then electric) and introduction of flushing toilets have progressively degraded the naturally fragile groundwater SES.
Future system states may include further degradation of the resource (pollution and salinity) and reduced usability. But it could also include reduced pressures and pollution and thus increase usability.
3.4 Causality and Feedbacks
Once all variables were included and their causality to other variables mapped , the CLD revealed a total of 104 potential links of which 87 (83.6%) were directly related to the social component of the CLD and the remaining 27 (16.4%) related to the hydrodynamic and ecological component of the SES (Figure 4). Although there were only two key variables associated with the social system (groundwater E-coli level and domestic demand for groundwater), there were 42 variables associated with the social system illustrating that, within the groundwater SES, the complexity of the system resides primarily with the social sub-system. This is coherent considering that the social sub-system is central to the groundwater SES, which defines system desirability and system identity.
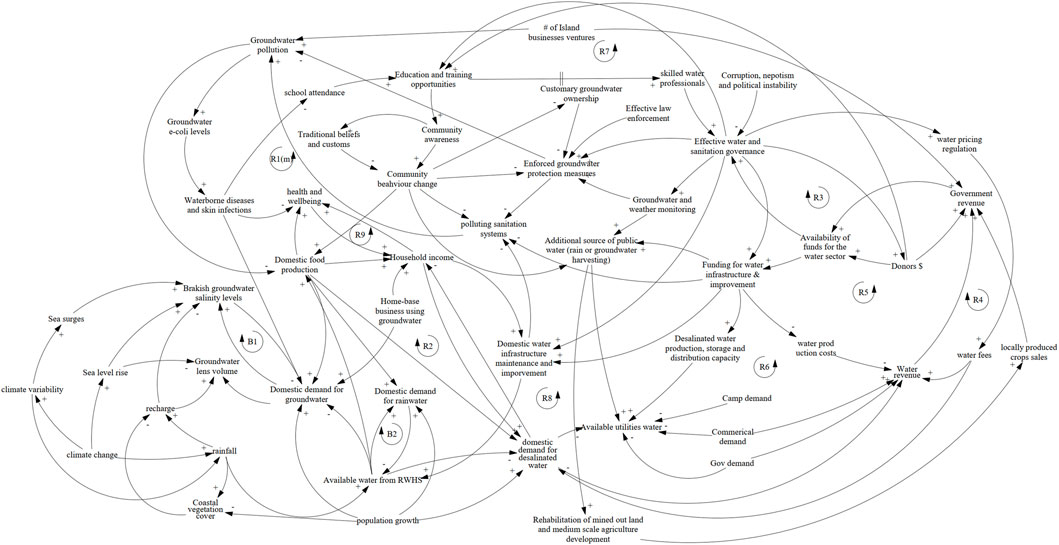
FIGURE 4. Causal loop diagram of the groundwater social-ecological system in Nauru. Balancing feedbacks are labelled with the letter B and reinforcing feedbacks are labelled with the letter R.
Furthermore, the CLD shows that with the groundwater SES, all reinforcing feedbacks are within the social system while balancing feedbacks appear to exist between the hydro-ecological system and the social system. This illustrates that while the system state is precariously maintained by balancing feedbacks between the ecological and social feedbacks, the social subsystem is consistently adding pressure to the system through reinforcing feedbacks generated within the social system and through social drivers. The two balancing (B) and nine reinforcing (R) feedbacks uncovered in the Nauru groundwater SES are described in the following sections.
3.4.1 (B1) Salinity, Groundwater Extraction and Groundwater Demand
Balancing feedback 1 (B1) represents the feedback between the salinity level of the groundwater extracted by private dwellings and the demand for groundwater. An increase in groundwater demand leads to more groundwater extraction which in turn may lead to an increase in salinity. However, as the salinity increases, groundwater use becomes more limited (i.e. too salty for stock and domestic use) and dwellings may reduce their groundwater usage. It is notable that this feedback effect will be marginal during a drought or for a house with very little rainwater storage. If no other source of water is available, groundwater will inevitably be used for all usages except drinking, even at high salinity.
3.4.2 (B2) Available Rainwater and Demand for Rainwater
Balancing feedback 2 (B2) represents the feedback between the available rainwater at domestic level and the demand for rainwater. Logically, when rainwater tanks are full, dwellings are more likely to worry less about water conservation as rainwater supply increases. In the absence of sufficient rainfall, high rainwater demand will quickly deplete the stored water and dwellings are likely to reduce their water demand as the water in the tank diminishes.
3.4.3 (R1) Multiple Feedbacks Associated With Groundwater Pollution and Household Income and Domestic Water Assets, School Disengagement and Trained Professionals
Multiple reinforcing feedback 1 (R1(m)) represents the multiple feedbacks originating from groundwater pollution. The first negative feedback from groundwater pollution is its effect on food production: polluted groundwater cannot be used for food production and thus reduces the potential for households to grow crops or raise pigs and chicken, which would in turn reduce their reliance on expensive imported food. It thus doesn’t offer potential savings on the household income that could be used to improve the household’s water infrastructure, including septic tanks and the groundwater pollution issue remains. Also, waterborne diseases that may occur from the use of contaminated groundwater have a strong feedback effect in the system as the occurrence of diseases such as diarrhoea can regularly disable parents and children to work or attend school, respectively. For parents, it may lead to a reduced household income or loss of employment, which has a ripple effect on household ability to develop and maintain water infrastructure (including sanitation systems) or purchase desalinated water. For children, it may result in increased disengagement from school which in the long term reduces their chances to access higher education and to play a positive role in developing effective water and sanitation governance.
3.4.4 (R2) Feedback Between Domestic Food Production, Household Income and Domestic Rainwater Systems
Reinforcing feedback 2 (R2) represents the feedback between domestic food production, household income and domestic rainwater systems: an increase in domestic food production enables income saving and provides more available income to improve domestic water system and thus improve rainwater harvesting capacity. In turn, it provides more water available for food production.
3.4.5 (R3) Feedback Associated With Increased in Water and Sanitation Governance Effectiveness and Availability of Donor Funding
Reinforcing feedback 3 (R3) represents the feedback between an effective water and sanitation sector and donor funding: an increase in the effectiveness of the water and sanitation sector in reaching defined goals (e.g. increased access to clean water, reduced pollution) demonstrates willingness and commitment to improve the sector and is likely to attract more donor funding, which in turn will provide funding to improve the water and sanitation sector.
3.4.6 (R4) Feedback Associated With Water Pricing Regulation and Availability of Funds for the Water Sector
Reinforcing feedback 4 (R4) represents the feedback between water pricing regulation and availability of funds for the water sector. An effective water pricing regulation sets water fees to cover production, distribution and maintenance costs as well as generating some profit as an income source for the government (water utility is 100% government owned). The increased revenue provides greater funding opportunity for the water sector to sustain water and sanitation governance initiatives.
3.4.7 (R5) Feedback Between Funding Available for Maintenance and Development of Water Asset and the Cost of Water Production
Reinforcing feedback 5 (R5) represents the feedback between funding availability for the water sector and water production costs: an increase in available funding for the water sector provides opportunities to effectively maintain and/or upgrade the desalination plant(s) and distribution mechanisms. In turn, this reduces the cost of desalinated water production (i.e. well maintained and/or newer technologies and/or bigger facilities generally reduce the production cost per cubic metre).
3.4.8 (R6) Feedback Between Rehabilitation of Mined out Land and the Generation of Government Revenue
Reinforcing feedback 6 (R6) represents the feedback between rehabilitation of mined out land and the generation of government revenue. Phosphate mining has been operating in Nauru since early 1900 with most of the island surface mined out by 1990. Rehabilitation of mined out land is a complicated matter, since a lot of funding has been provided to the Nauru Rehabilitation Corporation (NRC) since its establishment but there are currently no significant rehabilitated areas (Davies and Doherty, 2018). It is thus clear that this is a political and economic issue before a water issue. Nonetheless, rehabilitation of mined out land would require vast amounts of freshwater. From a water source point a view, an alternative source of water for the government would have to be developed since desalinated water would be prohibitively expensive for the project. A likely solution would be a conjunctive rainwater-groundwater system. Once all costs of levelling the land have been met (most likely from outside funding), the government could turn the rehabilitation into a profitable enterprise if they are able to generate revenue from the sale of crops, that could in turn be reinjected in the rehabilitation effort.
3.4.9 (R7) Feedback Between Effective Governance and Skilled Water Professionals
Reinforcing feedback 7 (R7) represents the feedback between effective governance and skilled water professionals: Currently, the lack of effective governance does not include the provision of training and education opportunities that are tailored to tackle current water issues in Nauru. This does not enable developing local skills or interest to work in the water sector. Finally, it reduces the likelihood of the emergence of leaders that will champion water and sanitation issues and thus improve the governance of the water sector.
3.4.10 (R8) Feedback Between Asset Maintenance and Development at Domestic Level and Desalinated Water Demand
Reinforcing feedback 8 (R8) represents the feedback between infrastructure maintenance and development at domestic level and desalinated water demand. Infrastructure maintenance and development at domestic level reduces the pressure on desalinated water (i.e. except during droughts). It provides more desalinated water for commercial ventures that is charged a commercial fee and thus generates more profit for the government.
3.4.11 (R9) Feedback Between Health and Wellbeing and Household Income
Reinforcing feedback 9 (R9) represents the feedback between health and wellbeing and household income. Logically, higher incomes offer a better access to care and expensive imported food such as fruits and vegetables. The local hospital is limited and patients in urgent need of medical attention (e.g., cancer treatment, surgery) are sent to partner countries such as Thailand. Families with high income can send ill household members overseas to countries where they can receive a high level of medical care, such as Australia.
4 Discussion
The development of causal loop diagrams revealed the complexity of groundwater as a SES in Nauru. The groundwater SES is strongly dominated by social feedbacks. All nine social feedbacks are reinforcing, thus highlighting the strong potential for the social system to alter the SES structure and function (i.e. identity) and shift from one stable state to another. Complexity is contributed by the 42 social variables interconnected through non-linear relationships. The boundaries of the groundwater SES are clearly beyond the physical boundaries of the aquifer. They extend to the entire water sector and include many socio-economic processes and variables that govern how the water and sanitation sector is funded, operated, used and how the availability of safe water affects the health and livelihood of local communities. The groundwater-related ecosystem services within the SES are diverse but site specific. Even in such a small island the interactions between aquifer properties, vegetation density and human pressures have created a spatial pattern in ecosystem services. The desired state of the groundwater system and the ecosystem services that it provides is strongly influenced by other parameters within the water sector, as the community’s main priority is to access sufficient amounts of safe drinking water. The slow variables are associated with groundwater quality, quantity and demand, as suggested by the framework for groundwater as a SES. These variables are strongly influenced by environmental drivers and social variables within the system. Social variables within the system are linked through feedbacks that shape the system behaviour and maintain slow variables within their current range.
Investigating feedback mechanisms for Nauru’s groundwater system has yielded important information for the management of the resource. First, because all abstraction is done at dwelling level for private use, there is a natural balancing feedback that “protects” groundwater from over abstraction. However, this is mostly true for the freshwater lens, where increases in salinity are rare and with high consequences for houses that rely solely on groundwater. It is not always true for most of the coastal aquifer, where variations in salinity are frequent and with less consequences for households using conjunctive water sources. Consequently, if the lens can be considered in a desirable state, with balancing feedbacks at work, most of the coastal aquifer is not in a desirable state. Second, the entire water sector is linked through strong dynamic interactions and feedbacks. Consequently, all three water resources on Nauru (i.e. groundwater, rainwater and desalinated water) and sanitation services must be managed together. Currently all three sources are managed independently by different government departments and landowners. Finally, because groundwater, rainwater and wastewater systems are mostly managed privately, at a household or dwelling level, planning efforts for the water sector must be done in close collaboration with communities. Currently, the government and its donor partners are supporting households and community on an ad-hoc basis, through the provision of infrastructure such as rainwater tanks for houses and community groundwater wells with solar pumps. Instead, the role of the government and aid partners for the provision and maintenance of water assets at domestic level must be clarified and integrated in a whole of island approach.
The framework to study and manage groundwater as a social-ecological system has three components or building blocks: CAS; resilience thinking; and SAM (Bouchet et al., 2019) By unpacking the complex system properties of Nauru’s groundwater system, the CLD has operationalised the first building block of the framework: Complex Adaptive Systems. Furthermore, and in line with the framework objectives, these properties provide a wide, qualitative baseline assessment of system behaviour, which informs the third building block of the framework: Strategic Adaptive Management. To operationalise the second building block of the framework, resilience thinking, requires causal relationships between the most important variables in the system to be quantified. In this building block, the sustainability of the system and its ability to safeguard ecosystem services in the face of change is reviewed, using principles of resilience thinking. To understand for which values in its slow variables the system is likely to re-organise and change the type and level of ecosystem services it can provide, the relationship between key variables must be quantified. In the field of system dynamics, CLDs are generally followed by the development of dynamic models that can simulate various scenarios and quantify how a change in one variable affects the entire system. For groundwater systems, the specific nature of interaction between the resource and its environment, which is governed by physical and chemical equations, is best represented using a numerical groundwater flow and transport model. The development of a numerical model for the hydro-ecological sub-model will thus provide critical information in regard to the relationship between the system slow variables, environmental drivers and direct social pressures (i.e., abstraction, pollution). Following, a system dynamics model will operationalise the social and the water management and governance sub-model.
The CLD reveals that inputs for a numerical groundwater flow and transport model for Nauru should include:
• Climate change data—recharge rate variation through long term change in rainfall pattern and change in drought frequency and duration;
• Sea level rise; and,
• Population growth—increase in groundwater abstraction due to increased population. Increase in abstraction points (i.e. wells) is likely but less significant than an increase in volume at existing wells due to existing high density dwelling around the coastline.
Running mutliple combination scenarios of these three inputs should allow defining empirical relationships between these inputs and two key system variables: groundwater lens volume and brackish groundwater salinity levels. These empirical relationships will allow including these variables in the system dynamic model. The third key variable, domestic demand for groundwater will be assessed through a system dynamics model.
It is noted that E-coli contamination is only an issue as long as current sanitation practices exit. E-coli and associated faecal bacteria would naturally die off within weeks if not sustained by current sanitation practices (Wang and Doyle, 1998). Thus, modelling of E-coli transport in a numerical groundwater transport model is not relevant and this last key variable should also be modelled through the system dynamic model (i.e. as directly associated with the sanitation system in place).
5 Conclusion
Using a CLD to conceptualise the complexity of groundwater as a SES provides valuable insights. In our case study, the CLD has demonstrated that the complexity of the system resides primarily with the social sub-system. The CLD has revealed that reinforcing feedbacks are all within the social system while balancing feedbacks appear to exist between the hydro-ecological system and the social system. The system state is maintained by balancing feedbacks between the ecological and social feedbacks, while the social sub-system adds pressure to the system through reinforcing feedbacks generated within the social system and through social drivers. This demonstrates why a holistic approach to groundwater management and planning is necessary, even in a small island such as Nauru.
The strength of the CLD rests on two key aspects. First, it conveys a clear understanding of the complexity of the groundwater SES to multiple audiences. It can facilitate stakeholder collaboration, from various disciplines and backgrounds, in a research or management project. This is a crucial aspect as the lack of input from social sciences and ecology into groundwater studies has been widely acknowledged as a reason for the poor state of groundwater resources worldwide. Second, the CLD identifies meaningful measurable components and processes. These processes form inputs into empirical models such as system dynamics and groundwater flow and transport models, effectively creating holistic modelling approaches for the groundwater SES.
The ability of CLD to capture the properties of the complex system and the prioritization of stakeholder perception as a first data source makes it a relevant tool toward the operationalization of groundwater SES. Causal loop diagrams are commonly used to study SES and have been applied to water resource systems as part of system dynamics approaches. However, CLD have seldom been used for groundwater systems. Causal loop diagrams are a relevant tool to study groundwater systems on small-island developing states in the Pacific, for several reasons. First, they are relatively easy to develop and do not require the hiring of experts or consultants. As skilled water professionals are often scarce, the process can be led by individuals with no technical training in groundwater studies. Software to build system dynamics models and CLD, such as Venisim, is available to download online. Venisim operates like a tool box and does not require any complex (i.e. programming) computer skills. Secondly, CLD allow a holistic representation of groundwater systems, as conceptualised in the framework for groundwater as a SES. Using CLD to conceptualise groundwater as a SES breaks away from the traditional mechanistic approach to groundwater study and provides opportunities to foster transdisciplinary work and for non-groundwater specialists to take a leadership role in groundwater studies. It provides insights to assess the resilience of the system and provides the necessary understanding to develop comprehensive numerical models (Kemper, 2004; Re et al., 2017).
Data Availability Statement
The data analyzed in this study is subject to the following licenses/restrictions: Data are stored at the University of New England data repository and are available upon request. Requests to access these datasets should be directed to www.une.edu.au
Author Contributions
All authors listed have made a substantial, direct, and intellectual contribution to the work and approved it for publication.
Funding
LB was financially supported through an Australian Government Research Training Program Scholarship and the University of New England.
Conflict of Interest
The authors declare that the research was conducted in the absence of any commercial or financial relationships that could be construed as a potential conflict of interest.
Publisher’s Note
All claims expressed in this article are solely those of the authors and do not necessarily represent those of their affiliated organizations, or those of the publisher, the editors and the reviewers. Any product that may be evaluated in this article, or claim that may be made by its manufacturer, is not guaranteed or endorsed by the publisher.
References
Alberti, L., La Licata, I., and Bouchet, L. (2019). Assessment of Groundwater Resources: Nauru Project 2010–2019. Acque Sotterranee-Italian J. Groundwater 8 (1), 380–385. doi:10.7343/as-2019-393
Alberti, L., La Licata, I., and Cantone, M. (2017). Saltwater Intrusion and Freshwater Storage in Sand Sediments along the Coastline: Hydrogeological Investigations and Groundwater Modeling of Nauru Island. Water 9 (10), 788. doi:10.3390/w9100788
Barreteau, O., Caballero, Y., Hamilton, S., Jakeman, A. J., and Rinaudo, J. D. (2016). “Disentangling the Complexity of Groundwater Dependent Social-Ecological Systems,” in Integrated Groundwater Management. Editors J. K. Jakeman, O. Barreteau, R. J. Hunt, J-D. Rinaudo, and A. Ross (Basel: Springer), 49–73. doi:10.1007/978-3-319-23576-9_3
Betancur, T., Palacio Tobon, C., and Escobar, J. (2012). “Conceptual Models in Hydrogeology, Methodology and Results,” in Hydrogeology - A Global Perspective. Editor G. A. Kazemi (London: IntechOpen), 203–222. doi:10.5772/28155
BOM and CSIRO (2014). Climate Variability, Extremes and Change in the Western Tropical Pacific: New Science and Updated Country Reports (Pacific‐Australia Climate Change Science and Adaptation Planning Program Technical Report). Australian Bureau of Meteorology and Commonwealth Scientific and Industrial Research Organisation.
Bouchet, L. (2014b). Guidelines for the Design of a Conjunctive Water Supply System in Nauru. PACC Technical Report. Apia, Samoa: Secretariat of the Pacific Regional Environment Programme.
Bouchet, L., and Sinclair, P. (2010). Assessing the Vulnerability of Shallow Groundwater Domestic wells in Nauru. SOPAC Technical Report. Suva, Fiji: Pacific Island Applied Geo-Science Commission SOPAC.
Bouchet, L., Thoms, M. C., and Parsons, M. (2019). Groundwater as a Social-Ecological System: A Framework for Managing Groundwater in Pacific Small Island Developing States. Groundwater Sust. Dev. 8, 579–589. doi:10.1016/j.gsd.2019.02.008
Bouchet, L. (2014a). “Transboundary Water Assessment Programme - Groundwater Component SIDS: SPC Consultancy Report for the Pacific Region,” in Secretariat of the Pacific Community. Editor P. Sinclair.
Bouchet, L. (2011). Water Sanitation and Climate Outlook Nauru, an Overview of Water and Sanitation Management in Nauru. Suva, Fifji: Government of Nauru and SOPAC.
Carpenter, S., Walker, B., Anderies, J. M., and Abel, N. (2001). From Metaphor to Measurement: Resilience of what to what. Ecosystems 4, 765–781. doi:10.1007/s10021-001-0045-9
Castelletti, A., Pianosi, F., Alberti, L., and Oberto, G. (2012). “Planning Infrastructural Measures for Controlling Saltwater Intrusion in a Coastal Aquifer by Global Interactive Response Surfaces: the Nauru Island Case Study,” in International Environmental Modelling and Software Society (iEMSs), 2012 International Congress on Environmental Modelling and Software, Managing Resources of a Limited Planet, Leipzig, Germany (Manno, Switzerland: Sixth Biennial Meeting).
Collier, J. D., and Hooker, C. A. (1999). Complexly Organised Dynamical Systems. Open Syst. Inf. Dyn. 6 (3), 241–302. doi:10.1023/a:1009662321079
Comte, J. C., Join, J. L., Banton, O., and Nicolini, E. (2015). The Role of Vegetation on Freshwater Lens Sustainability in Small Coral Islands Facing Climate Change. Vienna, Austria: EGU General Assembly Conference Abstracts.
Cumming, G. S., and Collier, J. (2005). Change and Identity in Complex Systems. Ecol. Soc. 10 (1), 29. doi:10.5751/es-01252-100129
Curtin, C. G., and Parker, J. P. (2014). Foundations Of Resilience Thinking. Conser. Biol. 28 (4), 912–923.
Davies, A., and Doherty, B. (2018). Corruption, Incompetence and a Musical: Nauru's Cursed History. Sydney, Australia: The Guardian: Australia Edition. Available from: https://www.theguardian.com/world/2018/sep/04/corruption-incompetence-and-a-musical-naurus-riches-to-rags-tale.
Elshall, A. S., Arik, A. D., El-Kadi, A. I., Pierce, S., Ye, M., Burnett, K. M., et al. (2020). Groundwater Sustainability: A Review of the Interactions between Science and Policy. Environ. Res. Lett. 15 (9), 093004. doi:10.1088/1748-9326/ab8e8c
Ford, F. A. (1999). Modeling the Environment: An Introduction to System Dynamics Models of Environmental Systems. Washington DC: Island Press.
Forrester, J. W. (1993). “System Dynamics and the Lessons of 35 years. A Systems-Based Approach to Policymaking,” in A Systems-Based Approach to Policymaking. Editor K. B. De Greene (Boston: Springer), 199–240.
Haraldsson, H. V. (2004). Introduction to Systems Thinking and Causal Loop Diagrams. Rep. Ecol. Environ. Eng. 8, 1–49.
Heitzig, J., Kittel, T., Donges, J. F., and Molkenthin, N. (2016). Topology of Sustainable Management of Dynamical Systems with Desirable States: from Defining Planetary Boundaries to Safe Operating Spaces in the Earth System. Earth Syst. Dynam. 7 (1), 21–50. doi:10.5194/esd-7-21-2016
Hirsch, R., Levine, R., and Miller, R. L. (2007). Biographies of Selected Photographers from the 20th Century. Am. J. Community Psychol. 39 (3-4), 239–294. doi:10.1016/b978-0-240-80740-9.50027-1
Holling, C. S. (1973). Resilience and Stability of Ecological Systems. Annu. Rev. Ecol. Syst. 4, 1–23. doi:10.1146/annurev.es.04.110173.000245
Hynds, P., Regan, S., Andrade, L., Mooney, S., O’Malley, K., DiPelino, S., et al. (2018). Muddy Waters: Refining the Way Forward for the "Sustainability Science" of Socio-Hydrogeology. Water 10 (9), 1111. doi:10.3390/w10091111
Jacobson, G. (1997). “Geology and Hydrogeology of Nauru Island,” in Geology and Hydrogeology of Carbonate Islands. Editors H. L. Vacher, and T. M. Quinn (Amsterdam: Elsevier), 707–743.
Jacobson, G., and Hill, P, J. (1988). Hydrogeology and Groundwater Resources of Nauru Island, central Pacific Ocean. Cambera, Australia: Division of Continental Geology, Bureau of Mineral Resources, Geology and Geophysics, Department of Resources and Energy.
Janssen, M. (2011). Resilience and Adaptation in the Governance of Social-Ecological Systems. Int. J. Commons 5 (2), 340–345. doi:10.18352/ijc.320
Kemper, K. E. (2004). Groundwater?from Development to Management. Hydrogeology J. 12 (1), 3–5. doi:10.1007/s10040-003-0305-1
Kiani, B., Gholamian, M. R., Hamzehei, A., and Hosseini, S. H. (2009). Using Causal Loop Diagram to Achieve a Better Understanding of E-Business Models. Int. J. Electron. Business Manag. 7 (3), 159–167.
Kirkwood, C. W. (1998). System Dynamics Methods: A Quick Introduction. Tempe: Arizona State University.
Ladyman, J., Lambert, J., and Wiesner, K. (2013). What Is a Complex System? Euro Jnl Phil Sci. 3, 33–67. doi:10.1007/s13194-012-0056-8
Mielby, S., and Henriksen, H. J. (2020). Hydrogeological Studies Integrating the Climate, Freshwater Cycle, and Catchment Geography for the Benefit of Urban Resilience and Sustainability. Water 12 (12), 3324. doi:10.3390/w12123324
Mitleton-Kelly, E. (2003). “Ten Principles of Complexity and Enabling Infrastructures in Mitleton-Kelly,E.,” in Complex Systems and Evolutionary Perspectives on Organisations: The Application of Complexity Theory to Organisations (Elsevier), 23–50.
Novakovskiy, A. B., Kanev, V. A., and Markarova, M. Y. (2021). Long-term Dynamics of Plant Communities after Biological Remediation of Oil-Contaminated Soils in Far north. Sci. Rep. 11 (1), 4888–4912. doi:10.1038/s41598-021-84226-5
Pacific Island Applied Geoscience Commission (Sopac), (2007). Integrated Water Resources Management in Pacific Island Countries: A Synopsis, Pacific Islands Applied Geoscience Commission (SOPAC).
Paniconi, C., Khlaifi, I., Lecca, G., Giacomelli, A., and Tarhouni, J. (2001). Modeling and Analysis of Seawater Intrusion in the Coastal Aquifer of Eastern Cap-Bon, Tunisia. Transport Porous Media 43, 3–28. doi:10.1023/a:1010600921912
Re, V., Sacchi, E., Kammoun, S., Tringali, C., Trabelsi, R., Zouari, K., et al. (2017). Integrated Socio-Hydrogeological Approach to Tackle Nitrate Contamination in Groundwater Resources. The Case of Grombalia Basin (Tunisia). Sci. Total Environ. 593-594, 664–676. doi:10.1016/j.scitotenv.2017.03.151
Republic Of Nauru (RON) (2011). National Water, Sanitation and Hygiene Implementation Plan. Nauru: Republic of Nauru.
Richardson, G. P. (1997). Problems in Causal Loop Diagrams Revisited. Syst. Dyn. Rev. 13, 247–252. doi:10.1002/(sici)1099-1727(199723)13:3<247::aid-sdr128>3.0.co;2-9
Schulze, P. C. (1996). Engineering within Ecological Constraints. Washington DC: National Academy Press.
Sterman, J. D. (2000). Business Dynamics: Systems Thinking and Modeling for a Complex World. Engineering System Division (ESD) Working Papers; ESD-WP-2003-01.13-ESD Internal Symposium. Cambridge: Massachusetts Institute of Technology.
Thaman, R. R., Hassall, D. C., and Takeda, S. (2008). Plants of Nauru. Forests and Trees Programme, Secretariat of the Pacific Community (SPC).
Walker, B., Holling, C. S., Carpenter, S., and Kinzig, A. (2004). Resilience, Adaptability and Transformability in Social–Ecological Systems. Ecol. Soc. 9 (2), 5. doi:10.5751/es-00650-090205
Walker, B. H., Carpenter, S. R., Rockstrom, J., Crépin, A. S., and Peterson, G. D. (2012). Drivers," Slow" Variables," Fast" Variables, Shocks, and Resilience. Ecol. Soc. 17 (3), 30. doi:10.5751/es-05063-170330
Wang, G., and Doyle, M. P. (1998). Survival of Enterohemorrhagic Escherichia coli O157:H7 in Water. J. Food Prot. 61 (6), 662–667. doi:10.4315/0362-028x-61.6.662
Keywords: complex adaptive systems, Nauru, causal loop diagrams, conceptual modelling, feedbacks
Citation: Bouchet L, Thoms MC and Parsons M (2022) Using Causal Loop Diagrams to Conceptualize Groundwater as a Social-Ecological System. Front. Environ. Sci. 10:836206. doi: 10.3389/fenvs.2022.836206
Received: 15 December 2021; Accepted: 10 February 2022;
Published: 08 March 2022.
Edited by:
Arianna Azzellino, Politecnico di Milano, ItalyReviewed by:
Marco Petitta, Sapienza University of Rome, ItalyJosep Mas-Pla, Catalan Institute for Water Research, Spain
Copyright © 2022 Bouchet, Thoms and Parsons. This is an open-access article distributed under the terms of the Creative Commons Attribution License (CC BY). The use, distribution or reproduction in other forums is permitted, provided the original author(s) and the copyright owner(s) are credited and that the original publication in this journal is cited, in accordance with accepted academic practice. No use, distribution or reproduction is permitted which does not comply with these terms.
*Correspondence: Louis Bouchet, bGJvdWNoZTJAbXl1bmUuZWR1LmF1
†ORCID: Louis Bouchet, orcid.org/0000-0002-2152-1353; Martin C. Thoms, orcid.org/0000-0002-8074-0476; Melissa Parsons, orcid.org/0000-0002-3918-7306