 Fujun Zhou1,2†
 Xingwen Fan
 Zhanju Lin
95% of researchers rate our articles as excellent or good
Learn more about the work of our research integrity team to safeguard the quality of each article we publish.
Find out more
ORIGINAL RESEARCH article
Front. Environ. Sci. , 21 February 2022
Sec. Atmosphere and Climate
Volume 10 - 2022 | https://doi.org/10.3389/fenvs.2022.836085
This article is part of the Research Topic Permafrost Environment Changes in a Warming Climate View all 12 articles
The Qinghai–Tibet Plateau (QTP) is characterized by its extreme climate and dominated by periglacial processes. Permafrost conditions vary greatly, and the recent changes on the QTP are not well known in the hinterland. Here, we examine the changes in climate and permafrost temperatures in several different regions. Climate data were obtained from three weather stations from 1957 to 2019. Annual mean air temperature (Ta) has gradually increased at .031°C/yr–.039°C/yr. Climate warming has been more rapid in the past two decades, particularly during the cold season (November to February). Precipitation has also been slowly increasing during the instrumental record. However, there is pronounced heterogeneity in the seasonal distribution of precipitation, with very little falling between October and April. Ground temperatures and active-layer thickness (ALT) have been investigated over ∼20 years at five sites representative of the hinterland of the QTP. These sites are located along the Qinghai–Tibet Highway, which crosses the permafrost zone and traverses the mountainous area and basin areas. Annual mean ground temperatures within the active layer (Tal ∼ 1 m depth) indicate recent ground warming at all sites, at rates near .05°C/yr. The ALT at five sites has been increasing steadily by 2–9 cm/yr, with an average of 4.6 cm/yr. The temperature near the permafrost table (Tps) has been increasing at .01°C/yr and .06°C/yr, with an average of .03°C/yr. Permafrost temperatures at 15 m depth (Tg) have been increasing by about .01°C/yr–.02°C/yr. The southern boundary (AD site) of the permafrost has warmed the least among the five locations. In high mountainous areas where permafrost temperatures are low (e.g., KLS site), the annual mean Tg has increased by nearly .02°C/yr. The rate of permafrost warming at a basin site (BLH), with relatively high ground temperatures, was approximately .01°C/yr. The GIPL2.0 model simulation results indicate that the annual mean permafrost temperature at 1 m depth at these sites will increase by .6°C–1.8°C in the next 100 years (to 2100) and that ALT will increase by ∼40–100 cm. We also discuss the impacts of permafrost changes on the environment and infrastructure on the QTP. This study provides useful information to understand observed and anticipated permafrost changes in this region, under different shared socioeconomic pathways, which will allow engineers to develop adaptation measures.
Permafrost is ground that remains at or below 0°C for at least 2 years and is primarily a consequence of climate (Henry and Smith, 2001; Smith and Riseborough, 2002). Permafrost constitutes a critical component of the global cryosphere and underlies approximately 24% of the land surface of the Northern Hemisphere (Anisimov and Nelson, 1996). Permafrost terrain comprises a seasonally thawed active layer underlain by perennially frozen ground. Permafrost is particularly sensitive to climate change due to the presence of ground ice (Haeberli and Hohmann, 2008; Chen et al., 2021). Climate warming increases the active-layer thickness and ground temperature (Wolfe et al., 2000; Smith and Burgess, 2004). Consequently, permafrost thaw may cause disequilibrium in terrestrial hydrologic cycles (Serreze et al., 2000; Hinzman et al., 2005; Walsh et al., 2005; White et al., 2007; Fedorov and Konstantinov, 2008), significant landscape and ecosystem changes (Lewkowicz, 1992; Osterkamp et al., 2000; Jorgenson et al., 2001; Pullman and Shur, 2007; Luo et al., 2019), and damage to infrastructure (U.S. Arctic Research Commission Permafrost Task Force, 2003). Changes in permafrost conditions associated with climate warming have also resulted in widespread thermokarst development (Lin et al., 2010; Niu et al., 2011; Luo et al., 2015), thaw slump (Niu et al., 2014b; 2016), and increased rates of solifluction. During the 20th century, permafrost warming was documented in the mountains of Eurasia (Harris et al., 2003; Isaksen et al., 2007), Northern Canada (Mackay, 1975; Kwong and Gan, 1994; Burn and Zhang, 2009), and Alaska, USA (Lachenbruch and Marshall, 1986; Osterkamp, 2007; Osterkamp and Romanovsky, 2015).
The Qinghai–Tibet Plateau (QTP) (Figure 1) is the largest body of permafrost at high elevation and low latitudes on the earth (Wang and French, 1994; Qiu and Cheng, 1995; Zhou et al., 2000). In the 1950s, the Qinghai–Tibet Highway was built across the plateau to Lhasa, and between 2001 and 2006, a single-track railway (Qinghai–Tibet Railway) was also built up to and over the QTP to Lhasa (Zhang et al., 2008). The total length from Golmud to Lhasa is about 1,120 km; ∼630 km are underlain by permafrost, with around 550 km in continuous permafrost and 80 km in discontinuous permafrost. The plateau is characterized by high elevation, periglacial processes, and a cold and arid continental climate (Li et al., 1996; Jin et al., 2008).
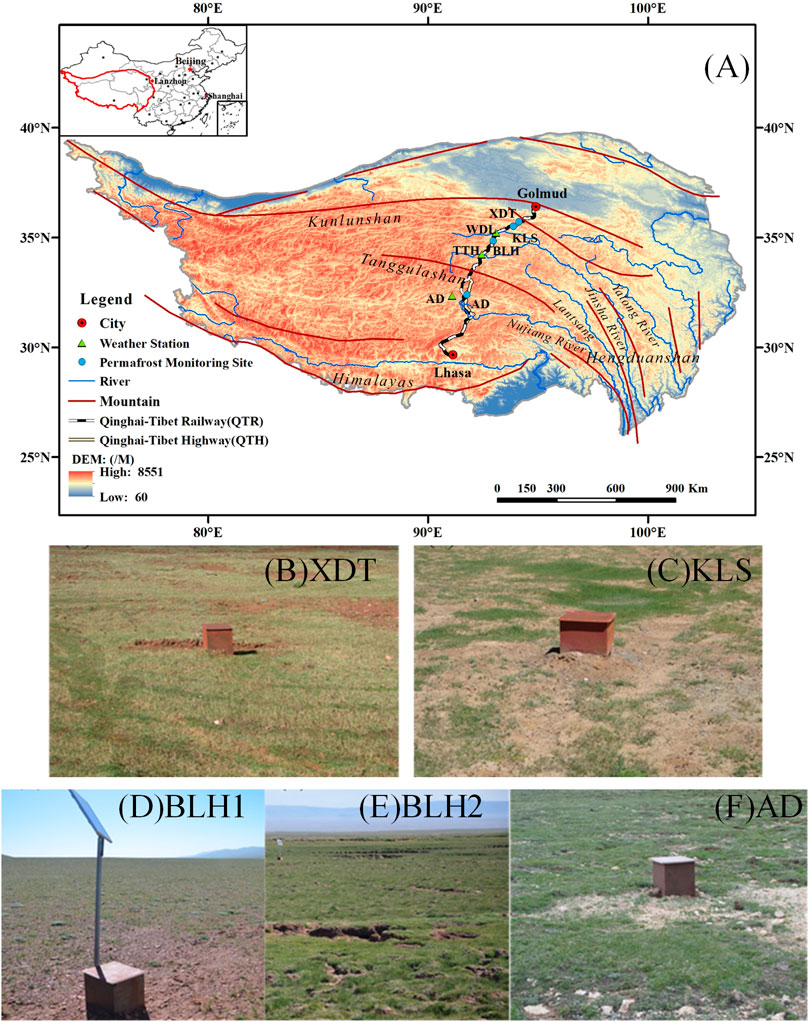
FIGURE 1. Locations of the five permafrost monitoring sites and three weather stations along the highway (A) and the topography conditions at the five permafrost monitoring sites along the highway (B–F).
With recent climate warming and steadily increasing human activities (Jin et al., 2008; Lin et al., 2011), the permafrost along the highway and railway has been warming rapidly (Wang, 1993; Wang et al., 2000; Wu and Zhang, 2008; Luo et al., 2019). Mean annual ground temperature (MAGT) in seasonally frozen soil and sporadic permafrost has increased by .3°C–.5°C and by .1°C–.3°C in continuous permafrost from the 1970s to 1990s (Wang et al., 2000; Cheng and Wu, 2007). The permafrost distribution has retreated .5–1.0 km at the northern boundary and 1–2 km at the southern boundary from 1975 to 1995 (Niu et al., 2008). Wu and Zhang (2008; 2010) also reported permafrost warming along the Qinghai–Tibetan Highway from 1996 to 2006. The results showed that mean annual permafrost temperatures at 6.0 m depth have increased by .12°C–.67°C and the maximum active-layer thickness (ALT) with an average increasing rate of ∼7.5 cm/yr over the same period. However, long-term climate and permafrost changes in recent decades are unclear. In addition, owing to the vast area and complex terrain conditions on the QTP, the climate and permafrost changes have great spatial heterogeneities under the influence of high mountains, plains, valleys, etc.
Therefore, we analyzed the long-term climate and permafrost temperatures in different terrain regions on the QTP. Based on the records of meteorological and ground temperature, the objectives of this study are to (I) define the climatic changes in the past ∼60 years in the hinterland of the QTP; (II) examine permafrost changes in the past 20 years at five typical sites; (III) estimate the potential change in permafrost temperature in the next 100 years, and (IV) discuss the possible negative influences of permafrost warming on the environment and engineering in this area.
The topography in the hinterland of the QTP is generally complex. Over 90% of the railway underlain by permafrost is above 4,500 m a.s.l. Three major east–west mountain ranges (Kunlunshan, Fenghuoshan, and Tanggula) and three major rivers (Chumaerhe, Tuotuohe, and Tongtianhe) cross the region, dividing it into five general geomorphological units: high mountain areas, foothills or moderately high mountainous areas, upland plateaus, valleys, and basins. Periglacial landforms are widely distributed due to the severe climatic conditions. Near the base of many higher-elevation slopes, strong frost action causes downslope mass movements and creeping gelifluction. Many retrogressive thaw slumps were found on the slopes of lower mountains and hills, and the recorded maximum retrogression rate was 4.5 m/yr in 2000–2002 (Niu et al., 2005; Niu et al., 2012). At upland plains and basins between 4,500–4,700 m elevation, e.g., the Beiluhe Basin and Tuotuohe Basin, there are thousands of thermokarst lakes covering approximately 2–3% of the land surface, and about 1/3 of thermokarst lakes on the high plateau have dried up (Niu et al., 2014a). Climate warming and increasing permafrost temperatures have coincided with an increase in frequency and magnitude of thermokarst in permafrost regions (Luo et al., 2015). Near river valleys and on gentle piedmont slopes, ice domes and frozen mounds are common periglacial landforms in winter.
Most plants in the permafrost regions are herbaceous perennials less than .15 m tall. Alpine grassland covers about 50% of the land surface, and alpine meadow comprises about 20%. Stipa purpurea, Carex moorcroftii, and Littledalea racemose are the dominant species in alpine grassland, while Kobresia pygmaea and Kobresia littledalea are dominant in alpine meadows (Li et al., 1996; Wang et al., 2016; Chen et al., 2020). Alpine grassland is distributed in dry environments on mountains, hills, and upland plains at higher elevation, and the vegetation cover is generally less than 30%. Alpine meadows with >50% of vegetation coverage are found in valleys or basins with higher soil moisture content (Wang et al., 2004; Jin et al., 2008).
The climate here is cold and dry. The surface soil is loose, so there is little resistance to erosion by runoff or aeolian processes. Freeze–thaw cycles also facilitate erosion. Consequently, soil erosion and desertification are common in the hinterland of the QTP. A soil sample test from the Beiluhe Basin shows that the ground surface is typically covered by gravel or sandy silt. Most of the near-surface soil were sand dominated (>60%), with only ∼40% silt and clay combined. The soil organic matter (SOM) content is very low (Liu et al., 2014).
The permafrost in the hinterland of the plateau has a relatively warm temperature and is characterized by high ground ice content. Permafrost with >20% volumetric ice content underlies about 221 km of the region (∼40% of the total length), while the portion with MAGT > −1.0°C is 227 km in length. Warm and ice-rich permafrost underlies 124 km of the line (∼25%) (Niu et al., 2008). The mean annual ground temperature (MAGT) in most high plains or valleys is reported as above −1.5°C, and the permafrost thickness is less than 70 m (Wu and Zhang, 2010). In hills and mountains at higher elevations, the MAGT is less than −1.5°C and permafrost thickness exceeds 130 m (Zhou et al., 2000). The active layer thickness in most areas is between 1.5 and 3 m, with a maximum of ∼5.0 m below or near the roadbed (Wu and Zhang, 2010). The warm permafrost on the QTP commonly includes 2–3 m thickness massive ground ice below the active layer to depths of 5 m (Lin et al., 2015).
Three weather stations (WDL, TTH, and AD) record the climatic conditions along the QTP (Figure 1). WDL and TTH weather stations have been operating since October 1956, and the AD station has been operating since November 1965. All weather data are managed by the China Meteorological Data Sharing Service System and available to users for downloading (http://cdc.cma.gov.cn/home.do). The data were provided as monthly averages. Data in May 1958 at the TTH station was missed, and the gap was filled by using linear regression.
For this study, we selected five typical sites at four locations (Table 1; Figure 1A) with ∼20 boreholes in undisturbed ground at least 20 m from the road. From the north to the south, the XDT site is near the northern boundary of permafrost, which is the discontinuous permafrost island with a relatively high ground temperature (Figure 1B). The KLS site on the south slope of the Kunlun Mountains represents the middle-to-high mountainous area with low permafrost temperature (<−3°C) (Figure 1C). The BLH1 and BLH2 sites are in the basin with high permafrost temperature (>−1.5°C). The difference between them is that BLH1 drilled early in a sparse vegetation cover ground, and BLH2 is in a alpine meadow area with good vegetation (Figures 1D,E). Both KLS and BLH sites lie in the continuous permafrost zone. The AD site is located near the southern boundary of permafrost, where the degraded melting area or discontinuous permafrost zone is present (Figure 1F).
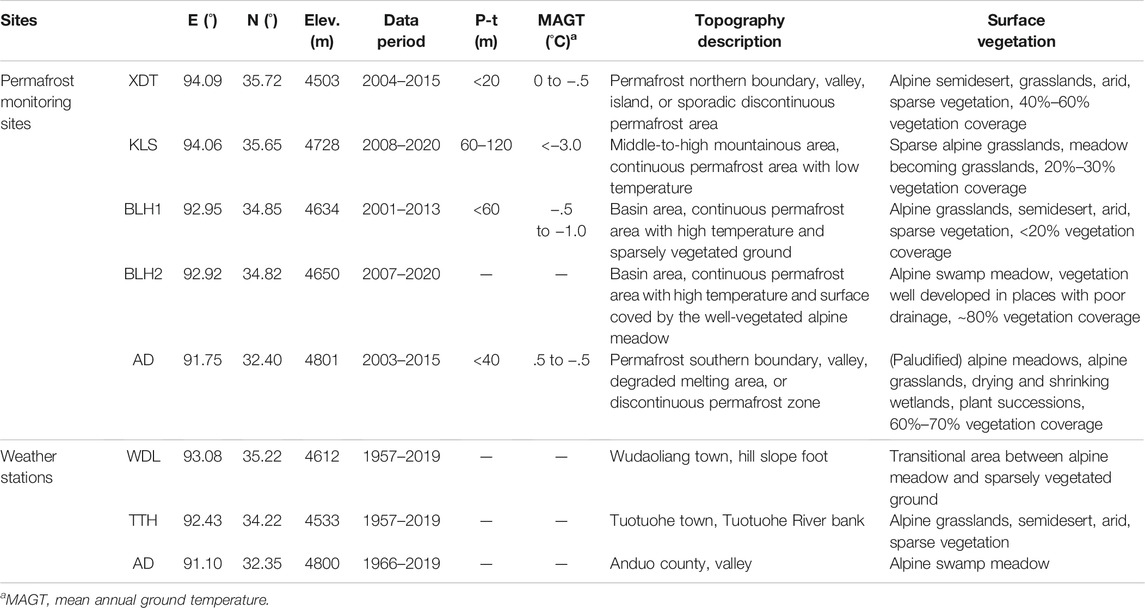
TABLE 1. Locations of permafrost monitoring sites and weather stations and their surface conditions in the study region [P-t: permafrost thickness (m)].
Boreholes at each site were drilled to monitor the ground thermal regime from the surface to a depth of 15 m. Thermistor cables with sensors were cased in a steel tube (D = 3–5 cm) and installed in each borehole. The tube was sealed at the bottom and top to prevent moisture from entering and reduce air convection. The boreholes were filled with dry sand to provide conductive contact between the tubes and the ground. The depth interval of the sensors was .5 m in the upper 5 m of the ground, 1 m between 5 and 10 m, and 2 m below 10 m. The cables were assembled at the State Key Laboratory of Frozen Soil Engineering, Chinese Academy of Sciences (CAS). The measurement accuracy of the sensors, calibrated in the laboratory, was estimated at ±.05°C. Several cables were replaced in 2015 because the sensors were damaged during the long work. The data were recorded on a CR3000 logger (Campbell Scientific, Edmonton, AB, Canada) powered by solar-charged batteries. Temperatures were recorded every 4 h, and instrument malfunction caused some data loss (<10%) during the study period. The treatment was by linear regression estimation completion. Mean annual values were calculated for each sensor to determine soil temperature, active layer thickness, freezing degree days, etc.
The ground temperature record from the borehole profile was divided into three critical layers. The first was characterized by the temperature within the active layer. Here, the temperatures from the upper sensors (∼1 m depth) at five sites were used to examine thermal conditions within the active layer (Tal). The second critical layer was described by the ground temperature at near the permafrost surface or bottom of the active layer (Tps). This temperature is important in characterizing the thermal state of permafrost, and the depth was generally around 2–2.5 m in this study. The third layer was called the depth of zero annual amplitude, and the temperature at this depth represents the annual mean permafrost temperature (Tg). We generally consider the ground temperature at ∼15 m as Tg on the QTP because the annual thermal cycle generally penetrates to a depth of 15–20 m. Although the larger perturbation in surface temperature may penetrate much deeper, it takes much longer periodicity to do so (such as a hundred-year scale or longer). Therefore, the variations in annual mean Tg provide a record of the recent permafrost temperatures.
In mountain permafrost regions, the geothermal profiles are generally in a transient state, continually adjusting to changes in the upper boundary temperature that propagate downward into the ground (Beltrami and Harris, 2001; Harris et al., 2009). Therefore, the interpretation of measured temperature profiles should be undertaken carefully, with particular attention being paid to the strong effects of complex surface geometry and rugged alpine topography (Gruber et al., 2010).
The active layer is the layer of ground above the permafrost that freezes and thaws each year. The base of the active layer is at the maximum depth of penetration of the 0°C isotherm (Burn, 1998). In this study, the maximum ALT during each thaw season was estimated by linear interpolation of the daily ground temperatures records obtained in each borehole (Lin et al., 2015).
We used the Geophysical Institute Permafrost Laboratory (GIPL2.0) transient numerical model to assess the possible permafrost temperature (T, °C) change over time (t, s) and depth (z, m) in the next 100 years (Marchenko et al., 2008; Jafarov et al., 2012). The core of the GIPL2.0 model is based on the one-dimensional heat conduction equation (Sergueev et al., 2003):
where k(z, t) (W m−1 K−1) denotes the soil thermal conductivity, C(T, z) (J m−3 K−1) is the volumetric heat capacity, and
where a and b are empirical constants for specific soil (Xu et al., 2010) and n(z) is the soil water content.
The solution domain of the model in each site was a one-dimensional soil profile from 0–100 m depth containing 139 computational grid nodes. The node spacing increased from .001 m at the ground surface to 10 m at the bottom of the simulation. The model input parameters were the mean monthly air temperature, thermal properties of the soil column, and water content for each site. Snow was not considered in the simulations because there is negligible snow cover along the highway in winter (Lin et al., 2015). Ground thermal properties, including thermal conductivity and volumetric water content, were assigned to each soil layer according to the observed borehole stratigraphy. The volumetric water content was considered a constant.
The ground surface temperature (Ts) was used as the upper boundary condition in the simulations, determined using the air temperatures (Ta) and surface n-factors (Lin et al., 2019; Yin et al., 2021). Monthly air temperatures for each site over the period 1979–2018 were obtained from three weather station records. Concerning the future air temperature series for the model projections, we used the latest two Shared Socioeconomic Pathways (SSP) (O’Neill et al., 2016): 2–4.5 (hereafter SSP245, representing the midrange of future pathways) and 5–8.5 (hereafter SSP245, high end) from the global climate model (GCM) EC-Earth3-Veg (Zhu and Yang, 2020). Monthly GCM air temperatures from 2015 to 2100 were first downscaled to the site location based on the monthly atmospheric lapse rates (ALR, .5°C/100 m; Guo and Wang, 2016; Zhang et al., 2018). The monthly air temperatures were then modified according to the linear regressions between measured monthly temperatures during 2015 and 2018 and the downscaled data for each corresponding location. Finally, we obtained the monthly ground surface temperature series based on the n-factors for the modeling runs. The geothermal gradient (g, ∼.14°C m−1) was set as the lower boundary condition (Wu et al., 2000).
Simulations were initialized from the observed ground temperature profiles. The observed ground temperature data were separated into two stages: the first period (2001–2005) was for model calibration, and the second (2005–2018) was for model verification. The model was calibrated and verified using annual borehole temperatures measured at different depths. The simulated values reasonably reproduced the measured values (R2 > .85). For most of the boreholes, the difference between simulated and measured ground temperature was <.5°C.
The plateau has a continental climate, characterized by a long cold season and short warm season. The mean monthly air temperatures were above 0°C from June to September at three weather stations in most years over the last 60 years. Over 90% of the annual precipitation arrives between May and September, so the hinterland of the QTP is cold and dry in the winter (Figure 2).
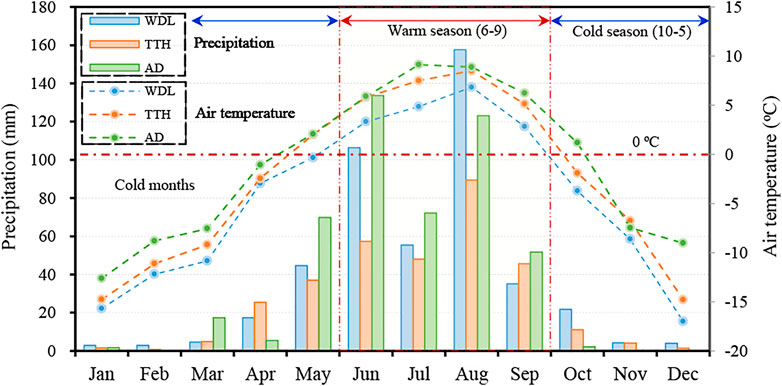
FIGURE 2. Monthly mean air temperature and precipitation for WDL, TTH, and AD weather stations in 2019. The mean annual temperatures at WDL (1957–2019), TTH (1957–2019), and AD (1966–2019) were −5.1°C, −3.8°C, and −2.4°C, respectively, and mean annual precipitation totals were 299, 293, and 445 mm in the same period (China Meteorological Data Sharing Service System, http://cdc.cma.gov.cn/home.do).
In 1957–2019, the air temperature at WDL was on average 1.3°C lower than at the TTH station (WDL–TTH). The average differences in monthly mean temperature were lower between November and January (below 1.0°C) than in other months (over 1.0°C). Between 1966 and 2019, the air temperatures at WDL were on average 2.7°C lower than at the AD station (WDL–AD), despite the higher elevation of AD. There were large temperature differences (close to 2–3°C) between the sites in all months of the year (Table 2). Air temperatures at the AD station were higher (∼1.4°C) than at the TTH station, so the air temperatures gradually increase along the QTP from the north to the south.
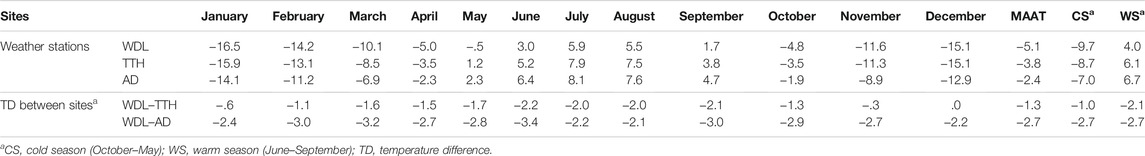
TABLE 2. Mean monthly, mean annual (MAAT), cold season (CS), and warm season (WS) air temperature (°C) at WDL and TTH stations over January 1957 to December 2019 and the AD station over January 1966 to December 2019.
The monthly mean air temperatures at three stations are highly correlated:
where Twdl, Ttth, and Tad are the monthly mean air temperatures at WDL, TTH, and AD stations, respectively; n is the total number of months in the study period.
The precipitation regime varies along the QTP. Annually, the AD (445 mm) receives more precipitation than both TTH (293 mm) and WDL (299 mm) stations. Precipitation is generally related to the air temperature. On average, only 5–8% of the annual precipitation at three stations falls as snow between October and April, and the most rain falls between May and September (Figure 2).
Precipitation along the QTP has fluctuated and generally increased over the record. Annual precipitation at WDL and TTH stations is correlated for 63 years (r2 = .59, p < .01). In 1957, the annual precipitation at WDL (302 mm) and TTH (309 mm) was similar, but in 2019, the values were greater (457 and 327 mm, respectively). The average rate of precipitation increase was ∼2.0 mm/yr at the WDL station and 1.1 mm/yr at TTH. Annual precipitation at WDL and AD was less strongly correlated over the 54-year record overlap (r2 = .26, p < .01). The annual precipitation at AD in 1966 was 354 mm, and in 2019, it was 468 mm, a total increase of
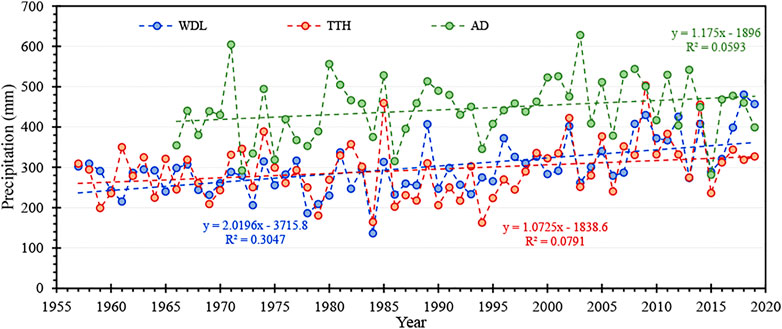
FIGURE 3. Long-term records in annual total precipitation at WDL and TTH (1957–2019) and AD (1966–2019) weather stations.
The climate along the railway has been steadily warming over the past 60 years. Annual mean temperatures at WDL and TTH stations were highly correlated for the 63 years of common record between 1957 and 2019 (r2 = .87, p < .01). In 1957, the annual mean air temperatures at WDL and TTH stations were −6.6°C and −5.1°C, respectively, but rose to −4.5°C and −2.7°C after 63 years. The increase in annual mean air temperature at WDL and TTH between 1957 and 2019 was ∼2°C, with an average rate of ∼32°C/yr. Annual mean air temperatures at WDL and AD stations were also well correlated over 54 years from 1966 to 2019 (r2 = .88, p < .01). The annual mean air temperatures at the AD station in 1966 and 2019 were −3.0 and −1.2°C, respectively, a total increase of ∼1.8°C with an average rate of ∼0.038°C/yr. The warming rates at WDL and TTH near the northern end of the permafrost were lower than those at AD further south (Figure 4).
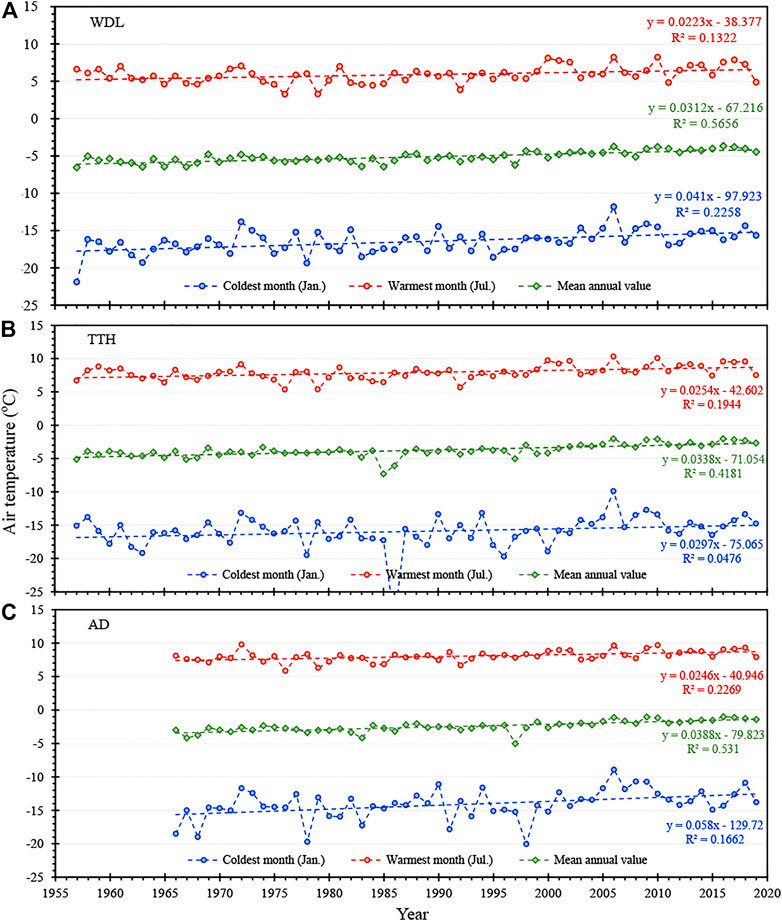
FIGURE 4. Long-term records in annual mean, coldest month (January), and warmest month (July) air temperatures at three weather stations. (A) and (B) WDL and TTH (1957–2019), and (C) AD (1966–2019).
The results of linear regression analysis indicate that the air temperature warming rate in the coldest month was significantly more rapid than that in the warmest month and mean annual value at the three stations. The warming rate along the highway in the warmest month steadily remained at .022°C/yr–.025°C/yr. However, the increase rate in the coldest month closed to .03°C/yr–.04°C/yr, even up to .058°C/yr at the AD station (Figure 4).
Climate change rates may change across time periods, which are mainly influenced by the intensity of human activity. Therefore, we have divided the past 60 years into three stages (e.g., before 1979, 1980–1999, and 2000–2019) to estimate decadal-scale patterns in climate change. Mean monthly, mean annual, cold season, and warm season air temperatures from three stations during three periods of the record are presented in Table 3. We evaluate the periodic warming of the air temperature by the increment of the latter stage subtracting the previous stage (Figure 5). It is very obvious that the second stage (S2, 1980–1999) increased less than 1°C than the first stage (S1, before 1979) (Figure 5A) and even did not show a significant increase in some months (e.g., April). By contrast, the increase in air temperature was very surprising in the last 20 years (S3, 2000–2019) than the previous 20 years (S2, 1980–1999), and the air temperature warming rate in most months was over 1°C, even up to 2–3°C in November–January (Figure 5B). These data indicate that climate warming has been more rapid in the recent 20 years.
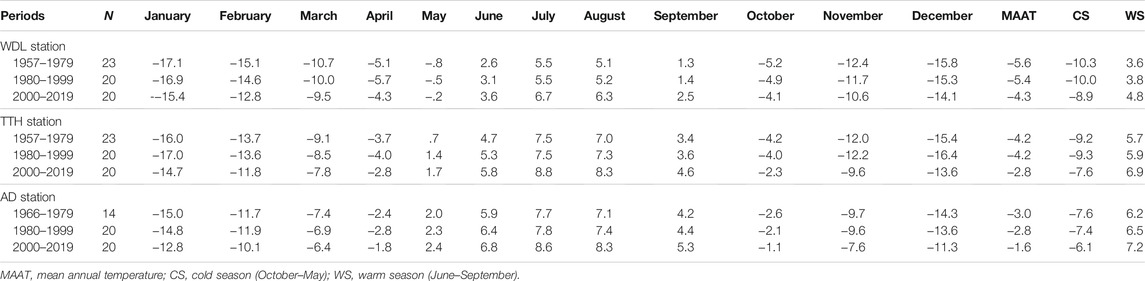
TABLE 3. Mean monthly, mean annual (MAAT), cold season (CS), and warm season (WS) air temperatures (°C) for three periods at WDL, TTH, and AD weather stations.
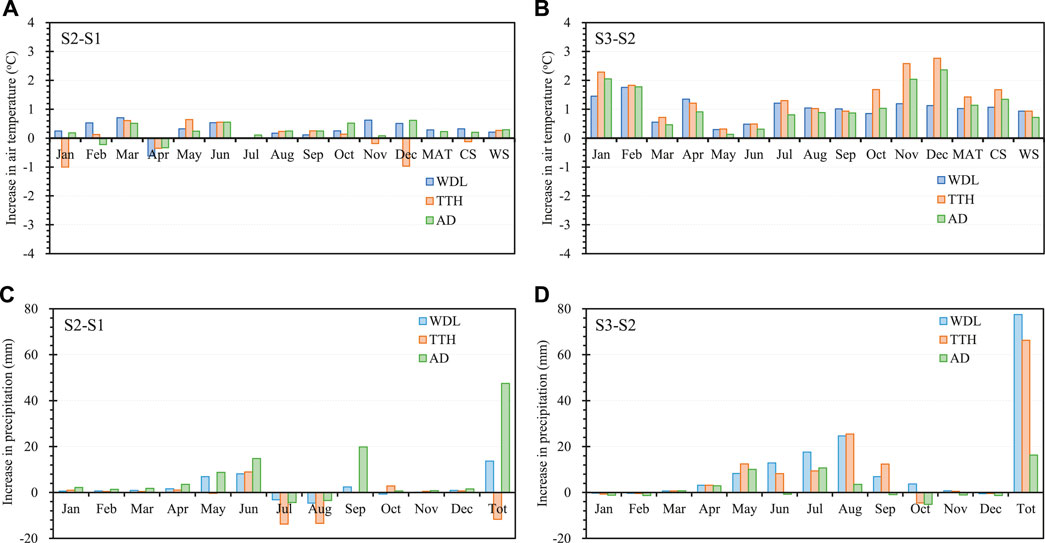
FIGURE 5. Periodic changes in mean monthly, mean annual (MAT), cold season (CS), and warm season (WS) air temperature at the three weather stations. (A) Temperature changes from stage 1 (S1, before 1979) to stage 2 (S2, 1980–1999) and (B) from stage 2 (S2, 1980–1999) to stage 3 (S3, 2000–2019). Periodic changes in mean monthly and total precipitation (Tot) at the three weather stations. (C) Precipitation changes from stage 1 (S1, before 1979) to stage 2 (S2, 1980–1999) and (D) from stage 2 (S2, 1980–1999) to stage 3 (S3, 2000–2019).
The precipitation change of three stages was similar to the air temperature (Figure 5). Except for the AD station, the precipitation from stage 1 (before 1980) to stage 2 (1980–1999) did not increase significantly; on the contrary, a dry warm season was seen in July–August (Figure 5C). By comparison, the precipitation moderately increased from stage 2 (1980–1999) to stage 3 (2000–2019) and increased by ∼10 mm in May–September (Figure 5D). There was still little precipitation between October and April over the period of record. Overall, the warm and wet summers actually occurred only in the last 10–20 years. Although the plateau has been warming in winter, the dry situation remains unchanged.
The maximum ALT has been consistently increasing at almost all sites and boreholes during the past 20 years (Figure 6; Table 4). In general, the active layer near the boundary of the permafrost (XDL and AD sites) was thicker than that in the continuous permafrost zone (e.g., BLH and KLS sites). The ALT varied between 4.2–5.5 m at the AD site in 2002–2015 owing to the warm air temperature and more rainfall. The increase of maximum ALT at the AD site was ∼9 cm/yr, showing the strong permafrost degradation near the southern limit of the permafrost. The increase rate of maximum ALT at the XDT site was ∼2 cm/yr near the northern limit of the permafrost, which is the minimum value among five sites. At the moderately high or alpine areas with the thinnest active layer, such as the KLS site, the increase rate of the maximum active layer was ∼4 cm/yr. In the Beiluhe Basin, the boreholes were drilled more at the natural surface. Although the maximum ALT at both sites of BLH1 and BLH2 differed approximately by 20–30 cm, the increase rate of 3–4 cm/yr was basically similar during the past nearly 20 years (Figure 6; Table 4).
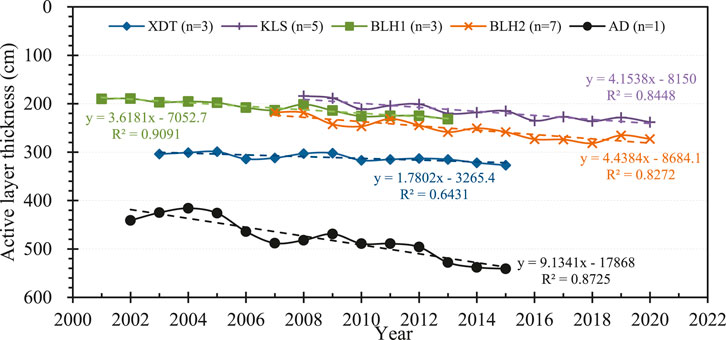
FIGURE 6. Recent variations in active layer thickness (ALT) at four sites for nearly 20 years. The data are an average value of several boreholes (n) at each site.
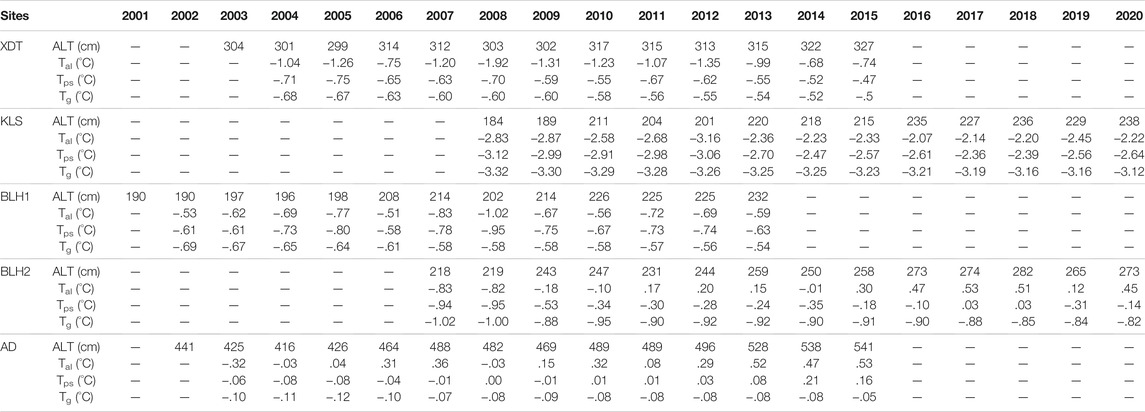
TABLE 4. Maximum active layer depths recorded for nearly 20 years at the five sites in the permafrost areas of the hinterland QTP.
Overall, for all ∼20 boreholes at the five sites, the mean increase rate of maximum ALT was 4.6 cm/yr, the median value was 4.2 cm/yr, and the maximum and minimum values were 9.1 and 1.8 cm/yr, respectively.
Annual mean ground temperatures at 1 m depth (Tal) at five sites over the last nearly 20 years are shown in Figure 7A; Table 4. Although the temperatures fluctuated, the increased pattern can still be noticed. The annual mean Tal at the BLH1 site did not show an increase over 2002–2013, and a relatively constant temperature of ∼−.6°C was maintained for more than 10 years. However, the BLH2 site showed a continuous and rapid warming pattern, and the increase rate exceeds .08°C/yr. At the northern and southern limit of the permafrost, the annual mean Tal has been gradually increasing at a moderate rate of .03–.05°C/yr. Although the ground at KLS is the coldest, the increase rate of annual mean Tal (∼.06°C/yr) also reached twice the climate warming rate. The annual mean Tal has been increased at four sites among the total five sites, showing an incontestable changing pattern within the active layer. The data series of both sites (BLH1 and BLH2) at the Beiluhe Basin have the longest period of record (19 years) and so may more reliably represent climatic warming rather than interannual temperature fluctuations. The variation in annual mean Tal did not faithfully follow the pattern of air temperature changes because it may be influenced by changes in local surface conditions and soil moisture content at the sites.
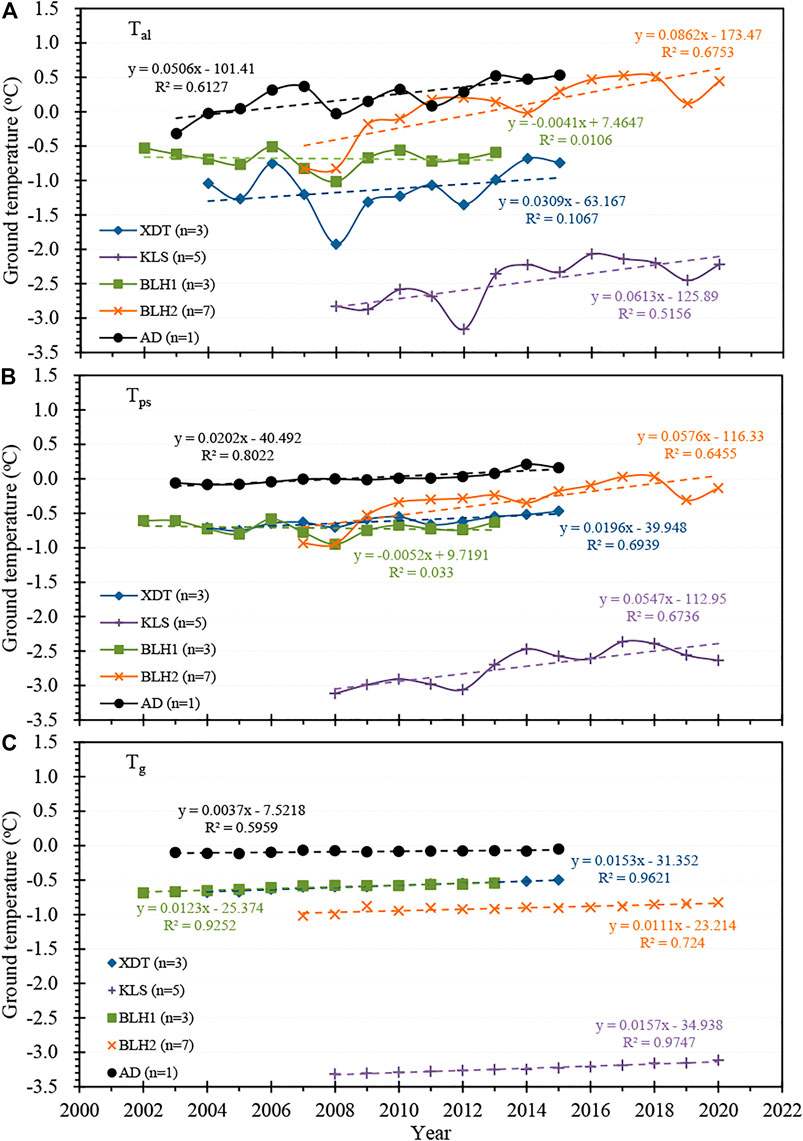
FIGURE 7. Recent variations in annual mean Tal (A), Tps (B), and Tg (C) at the five sites for nearly 20 years. The data are an average value of several boreholes (n) at each site.
Annual mean Tps during the past nearly 20 years at five sites is shown in Figure 7B; Table 4, and the patterns of continued increase were still significant at almost all sites. The warming rates of the annual mean Tps at the northern (XDT site) and southern (AD site) limit of the permafrost were approximately .02°C/yr. At moderately high or alpine areas with the coldest permafrost (KLS site), the warming rate was ∼.05°C/yr. At the Beiluhe Basin (BLH1 and two sites), the change of annual mean Tps was similar to the pattern of the Tal. The result of monitoring was that annual mean Tps at the BLH1 site basically remained constant and a rapid increase rate of ∼.06°C/yr was seen at the BLH2 site. For all five sites and 19 boreholes in the center of the QTP, the mean increase rate of annual mean Tps was .03°C/yr, the median was .02°C/yr, and the maximum was ∼.06°C/yr.
Unlike the fluctuant variations of Tal and Tps, the annual mean Tg has been steadily increasing at the five sites (Figure 7C; Table 4). At the northern (XDT) and southern (AD) limit of the permafrost, the increase rates in annual mean Tg were approximately .01°C/yr–.02°C/yr, and it was a little greater at XDT than at the AD site. In moderately high or alpine areas of the Kunlun Mountains, the annual mean Tg warming was about .02°C/yr, which was the most rapid warming rate among the five sites. At Beiluhe Basin, the warming rate of annual mean Tg at both sites was ∼.01°C/yr. For all five sites, the mean increase rate of annual mean Tg was .012°C/yr, the median was .011°C/yr, and the maximum and minimum values were .016°C/yr and .004°C/yr, respectively.
The profiles clearly show increasing annual mean ground temperatures over time at all sites, although the temperature profiles are highly disturbed by topography on the QTP (Figure 8). However, the profiles exhibit significantly different characteristics between the sites. At the XDT site near the northern limit of the permafrost, the near-surface ground temperatures changed little, but warming of about .2°C/yr occurred from 2–14 m depth over 10 years (Figure 8A). Here, the permafrost degradation showed an upward pattern and the temperature gradient below 2 m was close to zero. In contrast, at the AD site near the southern limit of the permafrost, the warming was in the upper 5 m, while almost no change was registered deeper into the ground (Figure 8E). This difference is probably due to the lower air temperatures, lower precipitation, and thicker permafrost near the northern limit than at the southern limit. At the KLS site in moderately high or alpine areas, the increase of ground temperature was also more significant in shallower than deeper layers (Figure 8B). Approximately 1–2°C total warming happened mainly within the active layer (above 2.5 m depth), and the warming rate was close to .15°C/yr. The thermal profiles from the KLS site suggest a general common effect, that is, a warming of the upper permafrost surface.

FIGURE 8. Ground temperature profiles at the five sites. (A) XDT, the northern limit of the permafrost, (B) KLS, the moderately high or alpine areas, (C,D) BLH1-2, the Beiluhe Basin, and (E) AD, the southern limit of the permafrost.
At the BLH1 site in Beiluhe Basin, the near-surface ground temperatures were lower than at depth, indicating thermal equilibrium with surface conditions (Figure 8C). The mean warming rate was ∼.02°C/yr from the ground surface to a depth of 15 m. However, the profile shows a reversed thermal offset near the ground surface (∼1 m depth) so that the mean annual surface temperature is lower than annual mean ground temperatures at both the permafrost surface and between 10–15 m depth. By comparison, the profile at the BLH2 site did not show the reversed thermal offset over 10 years (Figure 8D), and it may be related to the well-vegetated alpine meadow and wet soil environment. The profile at BLH2 also implies a process of a heat absorption state because the obvious feature is that the ground temperature descends with the depth and a negative thermal gradient above the depth of zero annual amplitude. Although the profiles at BLH sites were different, the gradual increase of ground temperature (∼.02°C/yr) was similar over 10–20 years.
The potential response of the permafrost to climate change in the hinterland of the QTP in the future has been simulated using the GIPL2.0 model. The simulated maximum ALT, the mean annual Tal, and the mean annual Tg under the SSP5-8.5 situation were first compared to measured mean data from boreholes at each site of the four sites, and the results are exhibited in Figure 9. There is close correspondence between the measured and simulated values from 2001 to 2020. Unfortunately, the maximum ALT is slightly underestimated when the active layer thickness is large, as in the AD site (Figure 9A). In contrast, the simulated ground temperature was very close to the measured values, with the RMSE < 1, and R2 > .9 for all sites (Figures 9B,C).
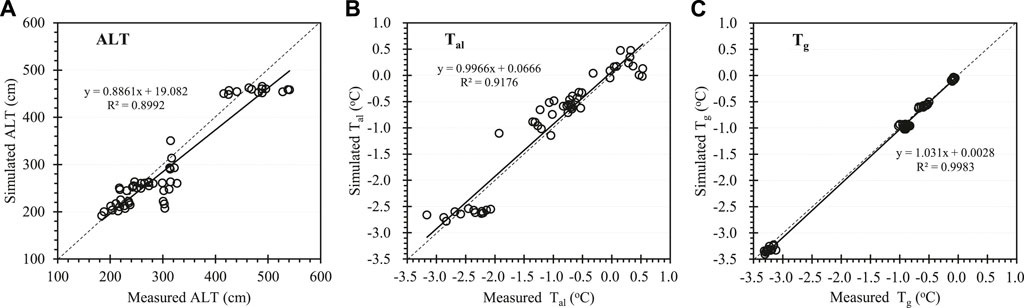
FIGURE 9. Comparison between the measured and simulated values in one of borehole at the four sites. (A) Relationship of the measured and simulated ALT, (B) annual mean Tal, and (C) annual mean Tg.
We also simulated the possible changes in maximum ALT and annual mean temperature for depths of 1 m (Tal) and 15 m (Tg) to 2100 years (Figure 10). The simulation shows that, at the XDT site with island discontinuous permafrost, the max ALT will increase by over 1 m (3–4 m, Figure 10A), while the mean annual temperature at 1 m depth was greater in 2100 than in 2020 by ∼1.7°C (−.8°C–.9°C, Figure 10B). The increase in annual mean Tg appears to be slower than in the previous 20 years, with a rising of ∼.5°C (−.7°C to −.2°C, Figure 10C). At the KLS site with a continuous and cold permafrost area, the max ALT will increase by about 60 cm, with ∼.6°C increase in annual mean Tal and ∼.4°C increase in annual mean Tg. Meanwhile, at the BLH site with a continuous and warm permafrost area, the max ALT will possibly increase by about 50 cm, with ∼1.8°C increase in annual mean Tal and ∼.2°C increase in annual mean Tg. However, for the AD site of the permafrost south boundary, this is a lower estimate for the change in maximum ALT because the variations in soil moisture clearly have a significant impact on the temperature in the permafrost at a warm and wet region. Even so, the simulated results indicate that the max ALT will increase by about 40 cm, with ∼1.5°C increase in annual mean Tal and ∼.2°C increase in annual mean Tg.
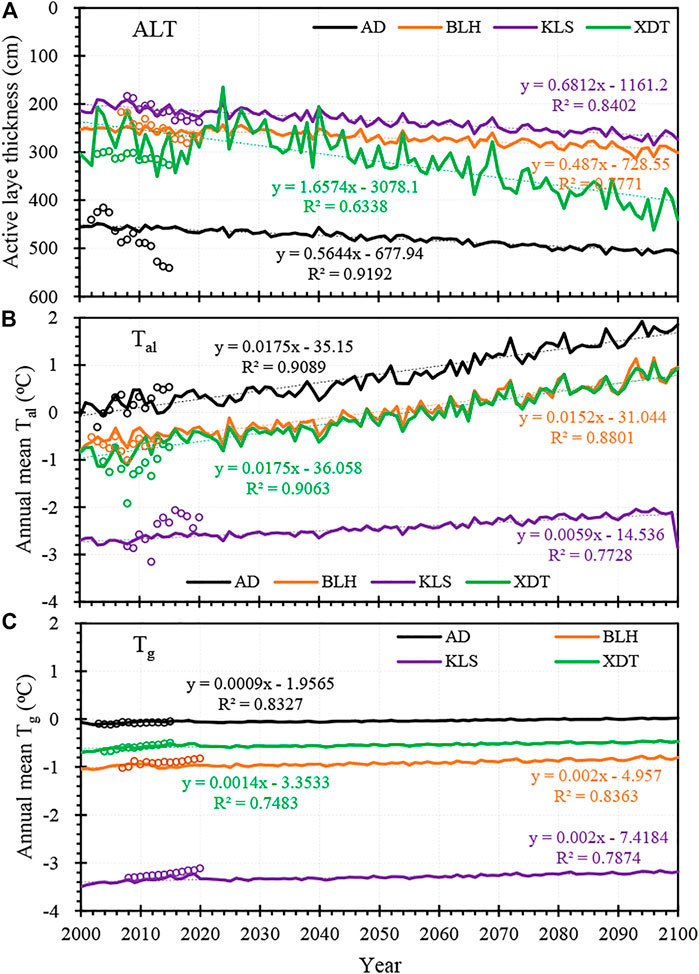
FIGURE 10. Simulated possible changes of ALT (A), annual mean Tal (B), and Tg (C) at the four sites over the next 100 years under the SSP585 climate change situation. Circles represent the measured values before 2020.
The climate of the QTP is characterized by low mean annual temperatures (<0°C), large daily temperature variability, and low seasonal temperature variability. Climate warming on the plateau was more rapid than the global average (IPCC, 2013). There is little interannual variation in annual mean air temperatures, making the QTP a good region to assess climate change. It has experienced significant warming since the 1950s (Zhao et al., 2004), with temperatures increasing at an average rate of .021°C/yr–.025°C/yr. Air temperatures from 1970 to 2019 show rapid warming, and the most dramatic warming occurred in the 1990s (Gao et al., 2015). The warming trend accelerated after 1997 (.025°C/yr), compared to the warming rate during 1980–1997 (.021°C/yr) (Duan and Xiao, 2015; Bibi et al., 2018). The warming trend of the minimum temperature (.041°C/yr) was about twice as high as that of the rate of maximum temperature (.018°C/yr) (You et al., 2016). The QTP has experienced a slight increase in precipitation since the 1960s (Bibi et al., 2018). Summer precipitation at the QTP increases with altitude (1,000–4,500 m) at a rate of .83% decade−1km−1 (Li et al., 2017; Zhang et al., 2017).
Air temperatures at the three stations were highly correlated throughout the year, with coefficients of determination (r2) above .9 for all months. The increasing trend of precipitation along the highway is 1.1–2.0 mm/yr, with the highest being 2 mm/yr at WDL. The trend is consistent with the increasing trend of rainfall at higher altitudes (Li et al., 2017; Zhang et al., 2017), which also shows the warming and humidification process at the QTP (Yao et al., 2018). The increase in air temperature has been concentrated mainly in the cold season, and the warming rate was above .05°C/yr in November–January. The result is consistent with other studies on the QTP (Zhao et al., 2004) and in Yukon Territory, Canada (Burn and Zhang, 2009). Measured and simulated results both indicate the climate has been warming rapidly in the hinterland of the QTP, which is also consistent with the climate change in the QTP and globally.
The permafrost warming is primarily because of a disruption of the thermal equilibrium of the permafrost. This is usually the result of an increase in active-layer depth and ground temperature. Cheng et al. (2019) found an average warming rate of .048°C/yr at the base of the active layer and .002°C/yr–.031°C/yr at a depth of 10 m based on borehole observation studies along the highway from 2004 to 2018. In all five sites and 19 boreholes in the central QTP, the average annual mean Tps growth rate was .003°C/yr, with a maximum of about .006°C/yr. The near-surface ground temperature fluctuated significantly because of the strong influence from the air temperature, precipitation, and surface conditions, and the changed trend in decadal scale was not significant. Therefore, our results show a small bias.
Hu et al. (2019) found that the ALT increased by 1.95 cm/yr. The changes in the active layer showed spatial heterogeneity, and the steady increases in maximum ALT have coincided with climatic changes. Although the boreholes at each site were at similar elevation and had similar permafrost conditions, the ALT changes varied, likely due to site-specific variation in microtopography, the presence of rock grids, and moisture content. Also, along the railroad line, the ALT increased by nearly 1 m on average since 1980 (Zhao et al., 2004). The fastest increase in active layer thickness was observed at the southern boundary of the permafrost, and the result was documented by Wu and Zhang (2010).
The observed permafrost warming at each site is linked to recent climate change. The results of statistics indicate that the permafrost warming was also significantly correlated with the local factors, e.g., elevation, ice content, or vegetation coverage. The change of annual mean Tg is negatively correlated with the temperature of the permafrost itself, indicating that the permafrost is warming more rapidly in regions with colder permafrost (KLS site) than warmer permafrost regions (BLH site). The significant correlation between the annual mean Tg change and ice content indicates that ground temperature increases are more rapid in regions with less ground ice. The positive correlation between annual mean Tg increase and elevation indicates that warming is greater at sites with higher elevation. Finally, vegetation cover was negatively correlated with the annual mean Tg change, and the more the vegetation is, the less the warming due to buffering effect.
Considering the driving factors of permafrost warming on the QTP, in general, the causes are classified as natural and human-induced factors (Figure 11). The natural factors on the QTP include mainly the increasing annual mean air temperature and precipitation, the rising water of rivers or lakes caused by glacial meltwater, coverage reduction caused by vegetation degradation, surface erosion, and earthquake disturbance. Undoubtedly, the most important causes of permafrost warming are associated with long-term changes of climate (Shur and Osterkamp, 2007). The increase of air temperature and precipitation plays a direct and major role, and it was also confirmed by the climate records of 60 years on the QTP. The effect of natural factors on the permafrost warming is usually a large-scale, long-term, and slow process. The water increase of rivers or lakes supplied by glacial meltwater is gradually becoming another dominant natural factor affecting permafrost warming (Luo et al., 2015; Xie et al., 2020).
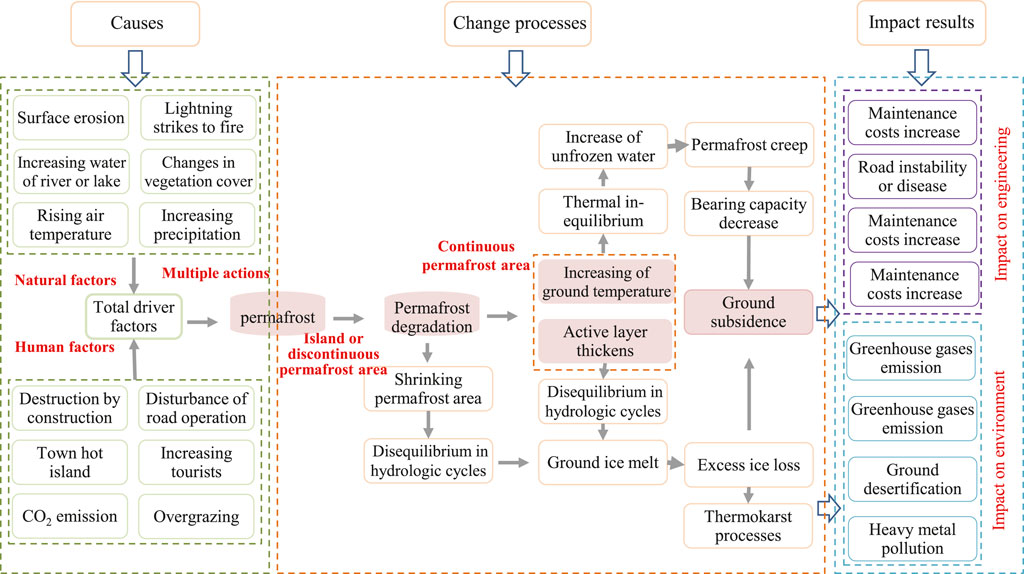
FIGURE 11. The driving factors that caused permafrost warming and degradation and its impacts on the engineering and environment in a high-altitude permafrost area, the QTP.
The human factors mainly include cuts or destruction by construction projects (e.g., Qinghai–Tibet Railway, highway, oil products pipeline, and fiber-optic cables), disturbance of vehicle movement on road, town or village hot island effect, increasing tourists, CO2 emission, and overgrazing. In contrast, the anthropogenic perturbations are characterized by the short-term, quick, and regional scale. It can also be demonstrated by an example of construction of the Qinghai–Tibet Highway in the 1970s. The cut in both sides of the road led to the rapidly developing thermokarst processes, vegetation degradation, and significant permafrost warms (Niu et al., 2014b; 2016).
The result of the permafrost warming is rapid permafrost degradation. In continuous permafrost areas, such as the KLS and BLH sites in this study, the permafrost degradation has mainly four modes, e.g., downward, upward, lateral, and composite (Jin et al., 2021). The prominent features indicate mainly the increase of ALT and the rising of annual mean ground temperature, while in discontinuous, sporadic, or island permafrost areas, such as the XDT and AD sites located at the permafrost boundary, the permafrost degradation is mainly in the lateral mode with the characteristics of permafrost continuity decrease and shrinking permafrost area (Figure 11).
Permafrost degradation often causes thermal inequilibrium and disequilibrium in hydrologic cycles within the active layer, the seepage of suprapermafrost water, the thaw of ground ice, the increase of unfrozen water content in the permafrost layer, and the decrease of bearing capacity (French 2018; Jin et al., 2021). These changes usually result in serious damage to the infrastructure stability and environment in permafrost areas. For the existing engineering, the ground subsidence or compaction caused by permafrost warming will decrease the subgrade stability and increase the frequency of subgrade secondary disease, leading to requirement of expensive maintenance. Meanwhile, the difficulty of line design and planning will increase for new projects.
The impact of permafrost degradation on the environment also involves many aspects. The melting of ground ice caused by permafrost warming often induces a series of thermokarst activities, such as thermokarst lake, thaw slump, and thaw pit (Lin et al., 2010; Niu et al., 2012). The thermokarst process may release chemical solute previously preserved in the permafrost, resulting in higher ionic concentration and pH value of soil in a degenerative area (Lantz et al., 2009). Under the influence of thermokarst processes, the ground temperature status, vegetation structure, and biological community in the adjacent area will be changed (Mesquita et al., 2010). Moreover, the occurrence of thermokarst will also lead to the release of carbon from the near-surface into the atmosphere, which will then affect the regional carbon cycle process and climate change (Woods et al., 2011).
1) A 60-year meteorological record from three weather stations in the hinterland of the Qinghai–Tibet Plateau indicates that the climate is becoming warmer and wetter. The air temperature warming rate of ∼.03°C/yr–.04°C/yr is two times the mean global value during the same period. Warming has been most pronounced during winter in the last two decades.
2) Ground temperature measurements were recorded over nearly 20 years at ∼20 boreholes at five sites. The top of the permafrost has warmed at ∼.03°C/yr, and active layer thickness has increased on average by 4 cm/a. Ground temperature profiles indicate rapid permafrost degradation.
3) Numerical simulations indicate that permafrost temperatures will increase by ∼1.7°C in the next 100 years under the SSP5-8.5 climate change scenario. The model indicates that ALT will increase by 1 m.
4) The results of this study indicate the necessity of i) strengthening the monitoring of permafrost change and hazards associated with thawing and ii) carrying out studies for adapting to permafrost changes along this critical transportation corridor.
The raw data supporting the conclusion of this article will be made available by the authors, without undue reservation.
FZ: writing—original draft, formal analysis. MY: data curation, writing. GY: conceptualization, methodology, software. XF: conceptualization, methodology, validation, writing—review and editing. ZL: writing—review and editing, resources, supervision, project administration, funding acquisition. XM: project administration, funding acquisition.
This work was supported by the National Key Research and Development of China (no. 2017YFA0603101) and the Second Tibetan Plateau Scientific Expedition and Research (STEP) program (grant no. 2019QZKK0905).
FZ and XM were employed by the company China Railway First Survey and Design Institute Group Co., Ltd.
The remaining authors declare that the research was conducted in the absence of any commercial or financial relationships that could be construed as a potential conflict of interest.
All claims expressed in this article are solely those of the authors and do not necessarily represent those of their affiliated organizations, or those of the publisher, the editors, and the reviewers. Any product that may be evaluated in this article, or claim that may be made by its manufacturer, is not guaranteed or endorsed by the publisher.
We would like to thank the editor and two anonymous reviewers who provided insightful suggestions and Brendan O’Neill for his constructive comments.
Anisimov, O. A., and Nelson, F. E. (1996). Permafrost Distribution in the Northern Hemisphere under Scenarios of Climatic Change. Glob. Planet. Change 14, 59–72. doi:10.1016/09218181(96)00002-1
Beltrami, H., and Harris, R. N. (2001). Foreword: Inference of Climate Change from Geothermal Data. Glob. Planet. Change 29, 149–152. doi:10.1016/S0921-8181(01)00085-6
Bibi, S., Wang, L., Li, X., Zhou, J., Chen, D., and Yao, T. (2018). Climatic and Associated Cryospheric, Biospheric, and Hydrological Changes on the Tibetan Plateau: a Review. Int. J. Climatol 38 (1), e1–e17. doi:10.1002/joc.5411
Burn, C. R. (1998). The Response (1958-1997) of Permafrost and Near-Surface Ground Temperatures to forest Fire, Takhini River valley, Southern Yukon Territory. Can. J. Earth Sci. 35, 184–199. doi:10.1139/e97-105
Burn, C. R., and Zhang, Y. (2009). Permafrost and Climate Change at Herschel Island (Qikiqtaruq), Yukon Territory, Canada. J. Geophys. Res. 114, F02001. doi:10.1029/2008JF001087
Chen, L., Voss, C. I., Fortier, D., and Mckenzie, J. M. (2021). Surface Energy Balance of sub‐Arctic Roads with Varying Snow Regimes and Properties in Permafrost Regions. Permafrost and Periglac Process 32 (4), 681–701. doi:10.1002/ppp.2129
Chen, L., Yu, W., Han, F., Lu, Y., and Zhang, T. (2020). Effects of Desertification on Permafrost Environment in Qinghai-Tibetan Plateau. J. Environ. Manage. 262, 110302. doi:10.1016/j.jenvman.2020.110302
Cheng, G. D., Zhao, L., Li, R., Wu, X. D., Sheng, Y., Hu, G. J., et al. (2019). Characteristic, Changes and Impacts of Permafrost on Qinghai-Tibet Plateau. Chin. Sci. Bull. 64 (27), 2783. doi:10.1360/TB-2019-0191
Cheng, G., and Wu, T. (2007). Responses of Permafrost to Climate Change and Their Environmental Significance, Qinghai-Tibet Plateau. J. Geophys. Res. 112, F02S03. doi:10.1029/2006JF000631
Duan, A., and Xiao, Z. (2015). Does the Climate Warming Hiatus Exist over the Tibetan Plateau. Sci. Rep. 5, 13711. doi:10.1038/srep13711
Fedorov, A. N., and Konstantinov, P. Y. (2008). Recent Changes in Ground Temperature and the Effect on Permafrost Landscapes in Central Yakutia. 9th Int. Conf. Permafrost. Editors L. K. Douglas, and K. M. Hinkel (Alaska, USA: Fairbanks), 433.
French, H. M. (2018). The Periglacial Environment. Fourth Edition. Hoboken, NJ: John Wiley & Sons, Inc..
Gao, Y., Li, X., Ruby Leung, L., Chen, D., and Xu, J. (2015). Aridity Changes in the Tibetan Plateau in a Warming Climate. Environ. Res. Lett. 10 (3), 034013. doi:10.1088/1748-9326/10/3/034013
Gruber, S., King, L., Kohl, T., Herz, T., Haeberli, W., and Hoelzle, M. (2004). Interpretation of Geothermal Profiles Perturbed by Topography: the Alpine Permafrost Boreholes at Stockhorn Plateau, Switzerland. Permafrost Periglac. Process. 15, 349–357. doi:10.1002/ppp.503
Guo, D., and Wang, H. (2016). CMIP5 Permafrost Degradation Projection:A Comparison Among Different Regions. J. Geophys. Res. Atmos. 121 (9), 4499–4517. doi:10.1002/2015JD024108
Guoqing, Q., and Guodong, C. (1995). Permafrost in China: Past and Present. Permafrost Periglac. Process. 6, 3–14. doi:10.1002/ppp.3430060103
Haeberli, W., and Hohmann, R. (2008). “Climate, Glaciers and Permafrost in the Swiss Alps 2050: Scenarios, Consequences and Recommendations,” in 9th Int. Conf. Permafrost. Editors L. K. Douglas, and K. M. Hinkel (Alaska, USA: Fairbanks), 607. June 29–July 3
Harris, C., Arenson, L. U., Christiansen, H. H., Etzelmüller, B., Frauenfelder, R., Gruber, S., et al. (2009). Permafrost and Climate in Europe: Monitoring and Modelling thermal, Geomorphological and Geotechnical Responses. Earth-Science Rev. 92, 117–171. doi:10.1016/j.earscirev.2008.12.002
Harris, C., Mühll, D. V., Isaksen, K., Haeberli, W., Sollid, J. L., King, L., et al. (2003). Warming Permafrost in European Mountains. Glob. Planet. Change 39 (3-4), 215–225. doi:10.1016/j.gloplacha.2003.04.001
Henry, K., and Smith, M. (2001). A Model-Based Map of Ground Temperatures for the Permafrost Regions of canada. Permafrost Periglac. Process. 12 (4), 389–398. doi:10.1002/ppp.399
Hinzman, L. D., Bettez, N. D., Bolton, W. R., Chapin, F. S., Dyurgerov, M. B., Fastie, C. L., et al. (2005). Evidence and Implications of Recent Climate Change in Northern Alaska and Other Arctic Regions. Climatic Change 72 (3), 251–298. doi:10.1007/s10584-005-5352-2
Hu, G., Zhao, L., Li, R., Wu, X., Wu, T., Xie, C., et al. (2019). Variations in Soil Temperature from 1980 to 2015 in Permafrost Regions on the Qinghai-Tibetan Plateau Based on Observed and Reanalysis Products. Geoderma 337, 893–905. doi:10.1016/j.geoderma.2018.10.044
IPCC (2013). Fifth Assessment ReportThe Intergovernmental Panel on Climate Change. Cambidge, United Kingdom and New York, NY: Cambridge University Press.
Isaksen, K., Sollid, J. L., Holmlund, P., and Harris, C. (2007). Recent Warming of Mountain Permafrost in Svalbard and Scandinavia. J. Geophys. Res. 112, F02S04. doi:10.1029/2006JF00052210.1029/2006jf000522
Jafarov, E. E., Marchenko, S. S., and Romanovsky, V. E. (2012). Numerical Modeling of Permafrost Dynamics in Alaska Using a High Spatial Resolution Dataset. The Cryosphere 6, 613–624. doi:10.5194/tc-6-613-2012
Jin, H.-J., Wu, Q.-B., and Romanovsky, V. E. (2021). Degrading Permafrost and its Impacts. Adv. Clim. Change Res. 12, 1–5. doi:10.1016/j.accre.2021.01.007
Jin, H.-j., Yu, Q.-h., Wang, S.-l., and Lü, L.-z. (2008). Changes in Permafrost Environments along the Qinghai-Tibet Engineering Corridor Induced by Anthropogenic Activities and Climate Warming. Cold Regions Sci. Techn. 53, 317–333. doi:10.1016/j.coldregions.2007.07.005
Jorgenson, M. T., Racine, C. H., Walters, J. C., and Osterkamp, T. E. (2001). Permafrost Degradation and Ecological Changes Associated with a Warming Climate in Central Alaska. Clim. Change 48 (4), 551–579. doi:10.1023/A:1005667424292
Kwong, Y. T. J., and Gan, T. Y. (1994). Northward Migration of Permafrost along the Mackenzie Highway and Climatic Warming. Climatic Change 26, 399–419. doi:10.1007/BF01094404
Lachenbruch, A. H., and Marshall, B. V. (1986). Changing Climate: Geothermal Evidence from Permafrost in the Alaskan Arctic. Science 234, 689–696. doi:10.1126/science.234.4777.689
Lantz, T. C., Kokelj, S. V., Gergel, S. E., and Henry, G. H. R. (2009). Relative Impacts of Disturbance and Temperature: Persistent Changes in Microenvironment and Vegetation in Retrogressive Thaw Slumps. Glob. Change Bio 15 (7), 1664–1675. doi:10.1111/j.1365-2486.2009.01917.x
Lewkowicz, A. G. (1992). “Factors Influencing the Distribution and Initiation of Active-Layer Detachment Slides on Ellesmere Island, Arctic Canada,” in Periglacial Geomorphology. Editors J. C. Dixon, and A. D. Abrahams (Hoboken, N. J: John Wiley), 223–250.
Li, B. Y., Gu, G. A., and Li, S. D. (1996). The Series of the Comprehensive Scientific Expedition to the Hoh Xil Region-Physical Environment of Hoh Xil Region. QinghaiBeijing, China: Science Press. (in Chinese).
Li, X., Wang, L., Guo, X., and Chen, D. (2017). Does Summer Precipitation Trend over and Around the Tibetan Plateau Depend on Elevation. Int. J. Climatol 37, 1278–1284. doi:10.1002/joc.4978
Lin, Z., Burn, C. R., Niu, F., Luo, J., Liu, M., and Yin, G. (2015). The thermal Regime, Including a Reversed thermal Offset, of Arid Permafrost Sites with Variations in Vegetation Cover Density, Wudaoliang Basin, Qinghai-Tibet Plateau. Permafrost Periglac. Process. 26, 142–159. doi:10.1002/ppp.1840
Lin, Z., Gao, Z., Niu, F., Luo, J., Yin, G., Liu, M., et al. (2019). High Spatial Density Ground thermal Measurements in a Warming Permafrost Region, Beiluhe Basin, Qinghai-Tibet Plateau. Geomorphology 340, 1–14. doi:10.1016/j.geomorph.2019.04.032
Lin, Z., Niu, F., Liu, H., and Lu, J. (2011). Disturbance-related Thawing of a Ditch and its Influence on Roadbeds on Permafrost. Cold Regions Sci. Techn. 66, 105–114. doi:10.1016/j.coldregions.2011.01.006
Lin, Z., Niu, F., Xu, Z., Xu, J., and Wang, P. (2010). Thermal Regime of a Thermokarst lake and its Influence on Permafrost, Beiluhe Basin, Qinghai-Tibet Plateau. Permafrost Periglac. Process. 21, 315–324. doi:10.1002/ppp.692
Liu, W., Chen, S., Zhao, Q., Sun, Z., Ren, J., and Qin, D. (2014). Variation and Control of Soil Organic Carbon and Other Nutrients in Permafrost Regions on central Qinghai-Tibetan Plateau. Environ. Res. Lett. 9, 114013. doi:10.1088/1748-9326/9/11/114013
Luo, J., Niu, F., Lin, Z., Liu, M., and Yin, G. (2015). Thermokarst lake Changes between 1969 and 2010 in the Beilu River Basin, Qinghai-Tibet Plateau, China. Sci. Bull. 60 (5), 556–564. doi:10.1007/s11434-015-0730-2
Luo, J., Yin, G., Niu, F., Lin, Z., and Liu, M. (2019). High Spatial Resolution Modeling of Climate Change Impacts on Permafrost Thermal Conditions for the Beiluhe Basin, Qinghai-Tibet Plateau. Remote Sensing 11, 1294. doi:10.3390/rs11111294
Mackay, J. R. (1975). The Stability of Permafrost and Recent Climatic Change in the Mackenzie Valley, N.W.T. Pap. 75–1, Part B, Pp. 173– 176. Ottawa, Ont: Geol. Surv. of Can.
Marchenko, S., Romanovsky, V., and Tipenko, G. (2008). Numerical Modeling of Spatial Permafrost Dynamics in Alaska, 9th Int. Conf. Permafrost. Editors L. K. Douglas, and K. M. Hinkel (Alaska, USA: Fairbanks). June 29–July 3.
Mesquita, P. S., Wrona, F. J., and Prowse, T. D. (2010). Effects of Retrogressive Permafrost Thaw Slumping on Sediment Chemistry and Submerged Macrophytes in Arctic Tundra Lakes. Freshw. Biol. 55 (11), 2347–2358. doi:10.1111/j.1365-2427.2010.02450.x
Niu, F., Cheng, G., Ni, W., and Jin, D. (2005). Engineering-related Slope Failure in Permafrost Regions of the Qinghai-Tibet Plateau. Cold Regions Sci. Techn. 42, 215–225. doi:10.1016/j.coldregions.2005.02.002
Niu, F. J., Xu, J., Lin, Z. J., and Wang, P. (2008). “Engineering-induced Environmental Hazards in Permafrost Regions of Qinghai–Tibet Plateau,” in 9th Int. Conf. Permafrost. Editors L. K. Douglas, and K. M. Hinkel (Alaska, USA: Fairbanks). June 29–July 3.
Niu, F., Lin, Z., Liu, H., and Lu, J. (2011). Characteristics of Thermokarst Lakes and Their Influence on Permafrost in Qinghai-Tibet Plateau. Geomorphology 132, 222–233. doi:10.1016/j.geomorph.2011.05.011
Niu, F., Luo, J., Lin, Z., Fang, J., and Liu, M. (2016). Thaw-induced Slope Failures and Stability Analyses in Permafrost Regions of the Qinghai-Tibet Plateau, China. Landslides 13 (1), 55–65. doi:10.1007/s10346-014-0545-2
Niu, F., Luo, J., Lin, Z., Liu, M., and Yin, G. (2014a). Morphological Characteristics of Thermokarst Lakes along the Qinghai-Tibet Engineering Corridor. Arctic, Antarctic, Alpine Res. 46, 963–974. doi:10.1657/1938-4246-46.4.963
Niu, F., Luo, J., Lin, Z., Liu, M., and Yin, G. (2014b). Thaw-induced Slope Failures and Susceptibility Mapping in Permafrost Regions of the Qinghai-Tibet Engineering Corridor, China. Nat. Hazards 74 (3), 1667–1682. doi:10.1007/s11069-014-1267-4
Niu, F., Luo, J., Lin, Z., Ma, W., and Lu, J. (2012). Development and thermal Regime of a Thaw Slump in the Qinghai-Tibet Plateau. Cold Regions Sci. Techn. 83-84, 131–138. doi:10.1016/j.coldregions.2012.07.007
O'Neill, B. C., Tebaldi, C., van Vuuren, D. P., Eyring, V., Friedlingstein, P., Hurtt, G., et al. (2016). The Scenario Model Intercomparison Project (ScenarioMIP) for CMIP6. Geosci. Model. Dev. 9 (9), 3461–3482. doi:10.5194/gmd-9-3461-2016
Osterkamp, T. E. (2007). Characteristics of the Recent Warming of Permafrost in Alaska. J. Geophys. Res. 112, F02S02. doi:10.1029/2006JF000578
Osterkamp, T. E., and Romanovsky, V. E. (2015). Evidence for Warming and Thawing of Discontinuous Permafrost in Alaska. Permafrost Periglacial Proc. 10, 172–374. doi:10.1002/(SICI)1099-1530(199901/03)10:13.0.CO
Osterkamp, T. E., Viereck, L., Shur, Y., Jorgenson, M. T., Racine, C., Doyle, A., et al. (2000). Observations of Thermokarst and its Impact on Boreal Forests in Alaska, U.S.A. Arctic, Antarctic, Alpine Res. 32 (3), 303–315. doi:10.2307/155252910.1080/15230430.2000.12003368
Pullman, E. R., Torre Jorgenson, M., and Shur, Y. (2007). Thaw Settlement in Soils of the Arctic Coastal Plain, Alaska. Arctic, Antarctic, Alpine Res. 39 (3), 468–476. doi:10.2307/2018171810.1657/1523-0430(05-045)[pullman]2.0.co;2
Sergueev, D., Tipenko, G., Romanovsky, V., and Oomanovskii, N. (2003). "Mountain Permafrost Thickness Evolution under Influence of Long-Term Climate Fluctuations (Results of Numerical Simulation)," in Proceedings of the 8th International Conference on Permafrost, July 21‐25, 2003, Zurich, Switzerland. Editors M. Phillips, S. M. Springman, and L. U. Arenson (Lisse: A. A. Balkema Publishers), 1017–1021.
Serreze, M. C., Walsh, J. E., Chapin III, F. S., Osterkamp, T., Dyurgerov, M., Romanovsky, V., et al. (2000). Observational Evidence of Recent Change in the Northern High-Latitude Environment. Clim. Change 46 (1), 159–207. doi:10.1023/A:1005504031923
Shur, Y., and Osterkamp, T. E. (2007). Thermokarst. Fairbanks, Alaska: Institute of Northern EngineeringUniversity of Alaska, 50. Report INE06.11.
Smith, M. W., and Riseborough, D. W. (2002). Climate and the Limits of Permafrost: A Zonal Analysis. Permafrost Periglac. Process. 13, 1–15. doi:10.1002/ppp.410
Smith, S. L., and Burgess, M. M. (2004). Sensitivity of Permafrost to Climate Warming in Canada Bull. 579. Ottawa, Ont: Geol. Surv. of Can. doi:10.4095/216137
U.S. Arctic Research Commission Permafrost Task Force (2003). Climate Change, Permafrost, and Impacts on Civil Infrastructure. Special Report 01-03. Arlington, Virginia: U.S. Arctic Research Commission.
Walsh, J., Anisimov, O., Hagen, J. O. M., Jakobsson, T., and Oerlemans, J. (2005). “Cryosphere and Hydrology,” in Arctic Climate Impact Assessment (New York: Cambridge Univ. Press), 183.
Wang, B., and French, H. M. (1994). Climate Controls and High-Altitude Permafrost, Qinghai-Xizang (Tibet) Plateau, China. Permafrost Periglac. Process. 5, 87–100. doi:10.1002/ppp.3430050203
Wang, G. X., Yao, J. Z., Guo, Z. G., and Cheng, G. D. (2004). Changes of Permafrost Eco-Environments under the Influences of Human Activities, and Their Significance for the Construction of the Qinghai–Tibet Railway. Chin. Sci. Bull. 49, 1556–1564. (in Chinese). doi:10.1007/bf03184309
Wang, J., Zhong, M., Wu, R., Dong, Q., Wang, K., and Shao, X. (2016). Response of Plant Functional Traits to Grazing for Three Dominant Species in alpine Steppe Habitat of the Qinghai-Tibet Plateau, China. Ecol. Res. 31 (4), 515–524. doi:10.1007/s11284-016-1360-0
Wang, S. L., Jin, H. J., Li, S. X., and Zhao, L. (2000). Permafrost Degradation on the Qinghai-Tibet Plateau and its Environmental Impacts. Permafrost Periglacial Proc. 11, 43–53. doi:10.1002/(SICI)1099-1530(200001/03)11:13.0.CO;2-H
Wang, S. L. (1993). Recent Change of Permafrost along Qinghai-Xizang Highway. Arid Land Geogr. 16, 1–7. (in Chinese).
White, D., Hinzman, L., Alessa, L., Cassano, J., Chambers, M., Falkner, K., et al. (2007). The Arctic Freshwater System: Changes and Impacts. J. Geophys. Res. 112 (G4), a–n. doi:10.1029/2006JG000353
Wolfe, S. A., Kotler, E., and Nixon, F. M. (2000). Recent Warming Impacts in the Mackenzie delta, Northwest Territories, and Northern Yukon Territory Coastal Areas. Ottawa, Ont: Geol. Surv. of Can.
Woods, G. C., Simpson, M. J., Pautler, B. G., Lamoureux, S. F., Lafrenière, M. J., and Simpson, A. J. (2011). Evidence for the Enhanced Lability of Dissolved Organic Matter Following Permafrost Slope Disturbance in the Canadian High Arctic. Geochimica et Cosmochimica Acta 75, 7226–7241. doi:10.1016/j.gca.2011.08.013
Wu, Q. B., Li, X., and Li, W. J. (2000).The Prediction of Permafrost Change along the Qinghai-Tibet Highway, China. Permafrost Periglacial Proc. 4, 371–376. doi:10.1002/1099-1530(200012)11:4<371:AID-PPP354>3.0
Wu, Q., and Zhang, T. (2010). Changes in Active Layer Thickness over the Qinghai-Tibetan Plateau from 1995 to 2007. J. Geophys. Res. 115, D09107. doi:10.1029/2009JD01297
Wu, Q., and Zhang, T. (2008). Recent Permafrost Warming on the Qinghai-Tibetan Plateau. J. Geophys. Res. 113, D13108. doi:10.1029/2007JD009539
Xie, C. W., Zhang, Y. X., Liu, W. H., Wu, J. C., Yang, G. Q., Wang, W., et al. (2020). Environmental Changes Caused by the Outburst of Zonag Lake and the Possible Outburst Mode of Yanhu Lake in the Hoh Xil Region. J. Glaciology Geocryology 42 (4), 1344–1352. doi:10.7522/j.issn.1000-0240.2019.0051
Xu, X. Z., Wang, J. C., and Zhang, L. X. (2010). Physics of Permafrost. Beijing: Chinese Science Press.
Yao, T., Xue, Y., Chen, D., Chen, F., Thompson, L., Cui, P., et al. (2019). Recent Third Pole's Rapid Warming Accompanies Cryospheric Melt and Water Cycle Intensification and Interactions between Monsoon and Environment: Multidisciplinary Approach with Observations, Modeling, and Analysis. B. Am. Meteorol. Soc. 100, 423–444. doi:10.1175/BAMS-D-17-0057.1
Yin, G.-A., Niu, F.-J., Lin, Z.-J., Luo, J., and Liu, M.-H. (2021). Data-driven Spatiotemporal Projections of Shallow Permafrost Based on CMIP6 across the Qinghai‒Tibet Plateau at 1 Km2 Scale. Adv. Clim. Change Res. 12, 814–827. doi:10.1016/j.accre.2021.08.009
You, Q., Min, J., Jiao, Y., Sillanpää, M., and Kang, S. (2016). Observed Trend of Diurnal Temperature Range in the Tibetan Plateau in Recent Decades. Int. J. Climatol. 36, 2633–2643. doi:10.1002/joc.4517
Zhang, C., Tang, Q., and Chen, D. (2017). Recent Changes in the Moisture Source of Precipitation over the Tibetan Plateau. J. Clim. 30, 1807–1819. doi:10.1175/JCLI-D-15-0842.1
Zhang, H., Zhang, F., Zhang, G., Che, T., and Yan, W. (2018). How Accurately Can the Air Temperature Lapse Rate over the Tibetan Plateau Be Estimated from MODIS LSTs. J. Geophys. Res. Atmos. 123, 3943–3960. doi:10.1002/2017JD028243
Zhang, T., Baker, T. H. W., Cheng, G.-D., and Wu, Q. (2008). The Qinghai-Tibet Railroad: A Milestone Project and its Environmental Impact. Cold Regions Sci. Techn. 53, 229–240. doi:10.1016/j.coldregions.2008.06.003
Zhao, L., Ping, C.-L., Yang, D., Cheng, G., Ding, Y., and Liu, S. (2004). Changes of Climate and Seasonally Frozen Ground over the Past 30 Years in Qinghai-Xizang (Tibetan) Plateau, China. Glob. Planet. Change 43, 19–31. doi:10.1016/j.gloplacha.2004.02.003
Zhou, Y. W., Cheng, G. D., and Qiu, G. Q. (2000). Permafrost in China. Beijing: Science. Press, 403–404pp. (in Chinese).
Keywords: climate change, permafrost warming, active-layer thickness, ground temperature, Qinghai–Tibet Plateau
Citation: Zhou F, Yao M, Fan X, Yin G, Meng X and Lin Z (2022) Evidence of Warming From Long-Term Records of Climate and Permafrost in the Hinterland of the Qinghai–Tibet Plateau. Front. Environ. Sci. 10:836085. doi: 10.3389/fenvs.2022.836085
Received: 15 December 2021; Accepted: 24 January 2022;
Published: 21 February 2022.
Edited by:
Xiaodong Wu, Chinese Academy of Sciences (CAS), ChinaReviewed by:
Hao Zheng, Hokkaido University, JapanCopyright © 2022 Zhou, Yao, Fan, Yin, Meng and Lin. This is an open-access article distributed under the terms of the Creative Commons Attribution License (CC BY). The use, distribution or reproduction in other forums is permitted, provided the original author(s) and the copyright owner(s) are credited and that the original publication in this journal is cited, in accordance with accepted academic practice. No use, distribution or reproduction is permitted which does not comply with these terms.
*Correspondence: Xingwen Fan, ZmFueGluZ3dlbjE4QG1haWxzLnVjYXMuYWMuY24=; Zhanju Lin, emhhbmp1bGluQGx6Yi5hYy5jbg==
†These authors share first authorship
Disclaimer: All claims expressed in this article are solely those of the authors and do not necessarily represent those of their affiliated organizations, or those of the publisher, the editors and the reviewers. Any product that may be evaluated in this article or claim that may be made by its manufacturer is not guaranteed or endorsed by the publisher.
Research integrity at Frontiers
Learn more about the work of our research integrity team to safeguard the quality of each article we publish.