 Zhiguo Wang
 Lufei Huang
 Linsen Yin2
94% of researchers rate our articles as excellent or good
Learn more about the work of our research integrity team to safeguard the quality of each article we publish.
Find out more
ORIGINAL RESEARCH article
Front. Environ. Sci., 22 February 2022
Sec. Environmental Economics and Management
Volume 10 - 2022 | https://doi.org/10.3389/fenvs.2022.836002
This article is part of the Research TopicCircular Economy Business Models for Sustainable ProductionView all 5 articles
Sustainable agriculture is a vital part of the UN Sustainable Development Goals. While tremendous achievements in the agriculture sector in China have been made, a series of problems are challenging the sustainable development of the agriculture management and agriculture economy. In this paper, the level of sustainable agriculture development was evaluated by constructing an entropy-TOPSIS model. The sustainable agricultural development level evaluation system was subsequently established, including 4 first-level criteria (economy, society, environment and resources) and 25 second-level criteria. Corresponding data on 13 cities in Jiangsu Province, China (from 2016 to 2019) were collected. Moreover, the main obstacle factors restricting the sustainable agriculture development level were analyzed through the obstacle diagnosis model. The Tobit regression model was established for an empirical study on its influencing factors. The results showed that the agricultural sustainable development level in Jiangsu Province is going upward, and the development level gaps between various prefecture-level cities are narrowing; the output values in agriculture, forestry, animal husbandry and fishery services, per capita disposable income of farmers and other aspects are the main obstacle factors for agricultural sustainable development. The research objective of this paper was to improve the index system of agricultural sustainable development, analyze the influencing mechanism and obstacle factors, and explore the promotion path of agricultural sustainable development in Jiangsu by optimizing the spatial layout. The main innovation of this paper was bringing the five interrelated and interactive dimensions of “economy, society, environment, ecology, and resources” into the same analytical framework to analyze the concept and connotation of agricultural sustainable development.
Industrial technologies such as chemical fertilizers, insecticides and mechanical equipment have been introduced into agricultural production to meet the growing population’s demand for food (Ashraf et al., 2021). However, this kind of integrated operations damage the soil, water, air and native habitats for the agricultural sector (Sharma et al., 2018). The Sustainable Development Goals (SDGs) approved by the United Nations in 2015 set forth the indispensable of sustainable agriculture (SA) to global sustainable development (Sachs et al., 2019). While ensuring food security, SA enhances the environmental friendliness of various agricultural operations and performance (Nowak et al., 2019; Sharma et al., 2020). Many SA practices maximize productivity while minimizing environmental damage (Raliya et al., 2017; Adegbeye et al., 2020). SA has played a notable role in sustaining all human activities (Barrios et al., 2020).
The initiative of SA is a farming idea that is more environmentally, economically, and socially (Mwalupaso et al., 2019). More specifically, SA refers to an agricultural system that adopts a way of rational use and maintenance of natural resources and implements technological and institutional reforms to ensure the sustainable development of the demand for agricultural products of contemporary humans and their future generations (Tsani et al., 2020; Khan et al., 2021). With the emerging of SA practices, the research from the academic community is gradually deepening. Nanofertilizers (Fatima et al., 2021), high yielding rice (Tseng et al., 2020), biotechnology (Zhao et al., 2020) and other new technologies are all focusing on sustainable agricultural development. For example, Tian et al. (2018) developed an integrated decision support system of the food, energy and water nexus for SA to simulate the interactions and feedback in the ecosystem–human–climate systems.
Similarly, Zulfiqar et al. (2019) summarized the application prospects of nanofertilizers in sustainable agriculture, biotechnology and horticulture. Skaf et al. (2019) developed a multi-criteria analysis framework to investigate the environmental performance and sustainability of agricultural production activities in Lebanon at the farm and national levels. Mikhno et al. (2021) considered the effective indices and instruments of influence on the level of ecological and economic development. Adegbeye et al. (2020) proposed some methods such as the shift in management systems of crop production, implementation of integrated farming system, enabling nutrient recycling or recovery for the resource efficiency improvement. Sharma et al. (2020) conducted a systematic review of machine learning applications in sustainable agricultural supply chains and presented a machine learning applications framework for sustainable agricultural supply chains management.
China is the most populous country in the world, and the agricultural sector plays a vital role in economic development and food security (Liu et al., 2020c). Especially, remarkable achievements have been made in China’s agricultural development since the implementation of the policy of reform and opening up (Zhou et al., 2019). Subsequently, SA development has been strengthened by institutional arrangements nationally in China (Sanders, 2006), such as rural revitalization strategy (Zhu et al., 2021), green food certification (Ul Hassan et al., 2020) and beautiful rural construction (Zeng et al., 2021). Accordingly, research on SA in China is emerging among the academic community. Cheng et al. (2018) collected research literature to analyze the main concerns and conceptual structure of SA development in the case study area based on topic modelling. Liu X. et al. (2020) developed a coordinated development model to evaluate both the SA coordination and its coordination degree for three villages in the Shenfu coalfield, China. Zhang et al. (2021) collected the data of daily rainfall in the Wei River Basin in China and analyzed the spatial and temporal variation characteristics of rainfall and rainfall erosivity in the context of sustainable agriculture.
Among those discussions in the research of SA development, the evaluation of sustainable development is the most essential one. Construction of SA evaluation index system is the fundamental work to explore the current status and promote the comprehensive development of agricultural sustainability (Diaz-Sarachaga et al., 2018). Latruffe et al. (2016) argued that SA owns three dimensions, which are society, environment and economy. Rahman et al. (2017) collected groundwater data and evaluated the groundwater quality of sustainable agriculture in Bangladesh. Liu et al. (2020b) systematically measured China’s agricultural green production goal from five aspects: ecosystem maintenance, supply capacity, environmental quality, farmers’ life and resource utilization.
However, the measurement of SA level faces challenges as previously described. Typically, multi-attribute requirements of economy, environment and society make the sustainability evaluation complicated and diverse (Liu et al., 2019). Jonathan Brooks and Giner (2021) emphasized the triple challenge of SA measurement. Accordingly, multiple evaluation indicators also lead to the difficulty of data collection and data processing (Niemeijer and de Groot, 2008). Moreover, the method selection of comprehensive evaluation indicators and the trade-off of national and regional research scales was also largely debated (Gafsi et al., 2006; Deguines et al., 2014; Kanter et al., 2018).
In response to the challenges above, this paper intends to discuss the following questions: 1) It sorts out the connotation of agricultural green development, summarizes green development status, challenges and typical facts of Jiangsu agriculture and discusses “what is the problem?”; 2) It constructs the “MADM–obstacle diagnosis–TOBIT” model, measures the sustainability of Jiangsu agricultural green development, analyzes main obstacle factors and influential mechanisms and discusses “what are the causes?” 3) From the perspective of spatial arrangement optimization, it studies the design of sustainable development policy of Jiangsu agriculture green development from aspects of “resource efficiency upgrading, environment improvement, ecology recovery, circular agriculture promotion” and discusses “how to do?”
Aimed at improving the sustainable development standard of Jiangsu agriculture, this paper sorts out the green development status of Jiangsu agriculture and establishes a comprehensive measure model to explore the path for the sustainable development of Jiangsu agriculture by completing an index system, analyzing obstacle factors and influential mechanism and optimizing spatial arrangement. Besides, it designs policies to support the system from aspects of “resource efficiency upgrading, environment improvement, ecology recovery, circular agriculture promotion”. Contributions of this paper might include three aspects: 1) Based on the concept and connotation of agricultural green development, SDGs of the United Nations and the development status of Jiangsu agriculture, it refers to the sustainable and circular development philosophy to further improve the sustainability measurement index system for Jiangsu agricultural green development from dimensions of economy, society, environment, ecology and resource. 2) It makes in-depth analysis on the unique resources, environmental capacity, ecologic type and economic development basis in “lakeside (Weishan Lake-Hongze Lake-Tai Lake), riverside (Yangtze River), coastal (the Yellow Sea) areas” and “south Jiangsu, central Jiangsu and south Jiangsu area”, in order to establish the spatial arrangement for the agricultural green development matching the ecological carrying capacity of resource environment. 3) It discusses the temporal evolution trend, spatial arrangement difference, main obstacle factors and influential mechanism of Jiangsu agricultural green development, so as to establish more targeted agricultural green development policies with greater adaptability.
Following the introduction section, the details of the study area and methodology are presented. The third section illustrates the results and analysis of sustainable agriculture development and obstacle factors in the case area. The conclusions and suggestions of this article are summarized in the final section.
Jiangsu Province locates in the middle of the eastern coastal area of mainland China and its lower reaches of the Yangtze River. The province is a major agricultural province and has much natural resources. The detailed information about the study area is shown as Figure 1.
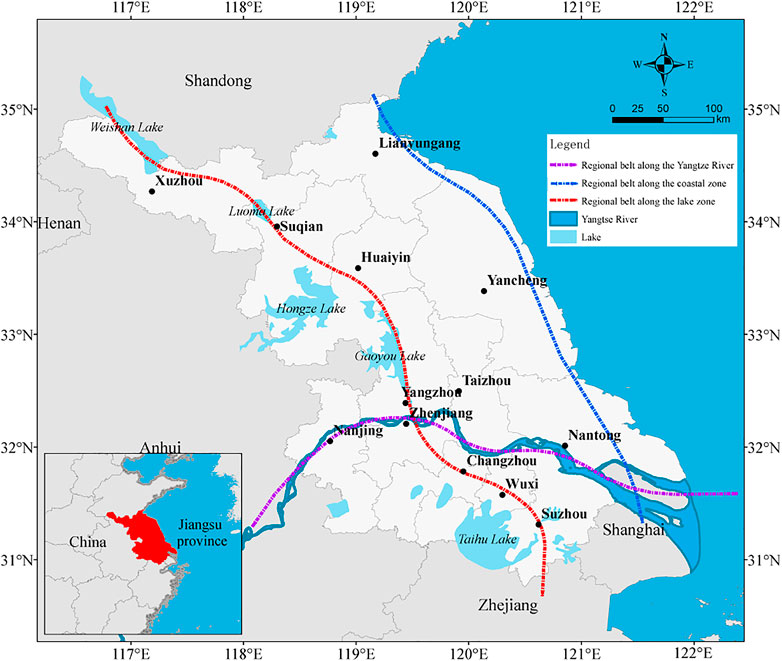
FIGURE 1. Location of jiangsu province in China.
There are three requirements to comprehensively promote rural revitalization and accelerate the modernization of agriculture in rural areas in Jiangsu Province: ensuring the effective supply of grain and other important agricultural products; improving rural infrastructure and public services; improving the rural beauty and livability level and sustainable agricultural development (General Office of Jiangsu Province, 2021).
In this paper, the period from 2016 to 2019 was taken as the time interval to study; and the 13 cities under the jurisdiction of Jiangsu Province were used as study objects. The basic index data came from Jiangsu Statistical Yearbook; and the Environmental index data came from the announcement of environmental conditions of cities.
Considering the availability, among the environmental indexes, the environmental data of Huai’an in 2016, 2017 and 2018 utilized the data in December of each year; the CO data of Zhenjiang in 2016 utilized the data from the environmental quality report for the fourth quarter of 2016. Geographically similar, these two prefecture-level cities, Nantong and Yangzhou, are 80 km apart. In terms of the SO2 emission, a tailpipe emission indicator, in 2016, 2017 and 2018, Yangzhou’s measurements are 23μg/m3, 18μg/m3 and 13μg/m3, respectively, while Nantong’s are 25μg/m3, 21μg/m3 and 13μg/m3 respectively, revealing a similar trend. So, the CO data among the environmental indexes of Nantong in 2016, 2017 and 2018 utilized the data of Yangzhou, a neighboring city, in those years respectively. Suqian and Lianyungang are two prefectural-level cities bordering each other. In 2016, 2017 and 2018, Lianyungang’s PM2.5 of Lianyungang was 46μg/m3, 45μg/m3 and 48μg/m3 respectively, while Suqian’s PM2.5 index was 56μg/m3, 55μg/m3 and 53μg/m3, respectively, revealing a similar trend. So the NO2, SO2 and CO data among the environmental indexes of Suqian in 2016, 2017 and 2018 utilized the data of Lianyungang, a neighboring city, in those years respectively. The PM10 data among the environmental indexes of Suqian in 2016 utilized the data of Lianyungang, a neighboring city, of the year.
The numerical values of indexes, the total output values of “scientific research and technical services”, “water conservancy, environment and public facility management industry”, “education”, “health and social work”, “culture, sports and entertainment industry” and “public management, social security and social organization”, were calculated by moving average method (Hao et al., 2018; Michna et al., 2020).
As one of the methods widely used in operations research, multi-attribute decision-making is used to solve various management problems (Zavadskas et al., 2014). In this paper, the TOPSIS method in multi-attribute decision-making was used to calculate the SADL in Jiangsu Province.
The accuracy of evaluation index weight calculation is directly related to the overall evaluation effect. The change of weighted index weight values may produce a butterfly effect. How to choose a better weighting method is one of the key problems to be solved in evaluation. The weight of evaluation indexes can be determined by subjective and objective methods. In the subjective weighting method, the importance of each indicator is analyzed to obtain their weights based on the experience of decision makers. It includes Delphi, AHP and other methods (Zeshui and Cuiping, 1999). However, the subjective weighting method depends on decision-maker’s preference and is subjective. As a quantitative weighting method, the objective weighting method calculates the weight of the evaluation indexes, and effectively transmits the data information of the evaluation indexes. The entropy method is the most used method to determine the objective weight. In this paper, the entropy was used to calculate the degree to which the evaluation indexes influence the pros and cons of the scheme. It ensures more realistic results of weight determination. Dong et al. (2021) calculated the weights of the indices within the evaluation system via the entropy weight method. The degree of interaction among system indexes is quantified to establish a comprehensive medical evaluation system, so as to promote the medical service system. Therefore, this paper uses the entropy method to determine the weight of the evaluation index, so as to get a better evaluation effect. The main steps are as follows (Chen and Wang, 2003):
1. To standardize the decision-making matrix: A decision-making matrix
where,
2. To calculate the contribution degree of the ith evaluation object of the sustainable development level evaluation system in the jth index:
where, Pij means the contribution degree of the ith evaluation object in the jth index.
3. To calculate the entropy of the jth index in the nth evaluation object and the mth evaluation index:
where, Ej is the entropy of the jth index in the evaluation index, K is a constant (
4. To calculate the information utility value of the jth index:
5. To calculate the weight of sustainable development level evaluation indexes:
where, ωj is the weight of the jth index.
Information entropy is a very important concept in information theory. It is a measure for the degree of disorder of the system, which is defined as
The TOPSIS method proposed by Hwang and Yoon (1981) is a method used in dealing with the selection problem. Peng and Xiao (2013) proposed that TOPSIS is an appropriate tool for dealing with selection problems. Since TOPSIS has a very clear logic, it can handle qualitative and quantitative information well (Mousavi-Nasab and Sotoudeh-Anvari, 2017). TOPSIS sorts the decision-making objects by evaluating the distance from the evaluation object to the optimal and the worst solutions (Chu, 2002). It makes full use of the original data, and has good applicability, so it is widely used in multi-attribute evaluation (Lai et al., 1994). Moreover, the TOPSIS method can be used for the pros and cons evaluation of different levels of the evaluation system. Therefore, TOPSIS is applicable to the evaluation of the agricultural service system evaluation system for agricultural sustainable development proposed in this paper. Vassoney et al. (2021) provided helpful support to achieve more sustainable solutions for complex water management problems by applying the TOPSIS method. The main calculation steps of TOPSIS include (Zheng et al., 2020):
1. To normalize decision-making matrix
where, Zij is the normalized decision-making matrix; yij is the value of the jth evaluation index of the ith evaluation object in the standardized decision-making matrix.
2. To construct the sustainable development weighted decision-making matrix.
where, xij is the weighted decision-making matrix, while ωj means the weight of the jth index.
3. To determine the positive ideal solution X+ and the negative ideal solution X−.
where, X+ is the standardized weighted target positive ideal solution; X− is the standardized weighted target negative ideal solution, J is positive index; and J′ is negative index.
4. To measure the distance from any feasible solution
where,
5. To calculate the relative proximity of the feasible solution to the ideal solution:
where, Ci is the proximity of the feasible solution to the ideal solution.
In this paper, a multi-level index evaluation model was used; the initial matrix of the upper level was generated from the relative proximity of the single level evaluation index Ci to calculate the relative proximity of the index of the upper level, obtaining the evaluation results off the upper level (Sun et al., 2019).
6. To sort and calculate the category of the SADL in Jiangsu Province according to the calculated relative proximity Ci. Category classification was is performed based on the arithmetic mean value and standard deviation of Ci(Nowak et al., 2019). It was is classified into four categories:
where,
The sustainability evaluation of agriculture in Jiangsu Province is not only the evaluation of the sustainable development level, but also the analysis of the obstacle factors for agricultural sustainable development, so as to better formulate targeted strategies and measures to improve the SADL. In this paper, the obstacle diagnosis model for agricultural sustainable development was used as a tool (Chen et al., 2020) to analyze the obstacle factors for the SADL in Jiangsu Province.
where, Oij is the degree of obstacle of the jth index of the ith evaluation object; ωj is the weight of obstacle factors; 1 − yij is the gap between index and target.
The efficiency value of TOPSIS calculated by Eq. 13 is censored data and balanced panel data. To avoid possible bias due to least squares estimation (OLS) and utilize the cross-sectional and time series information contained in the panel data, the confined Tobit random effects panel model is used herein for regression analysis (Frenzen and Davis, 1990) and to establish the following model:
where,
The evaluation system of sustainable agriculture constructed in this study can be summarized into four aspects: agricultural economy B1, agricultural society B2, agricultural environment B3 and agricultural resources B4. Especially, the idea of agriculture resource is introduced to promote more extensive assessment. The evaluation index system for the SADL in Jiangsu Province was constructed as showed in Figure 2 from the four first-level indexes. The detailed description of the four first-level indexes is as follows:
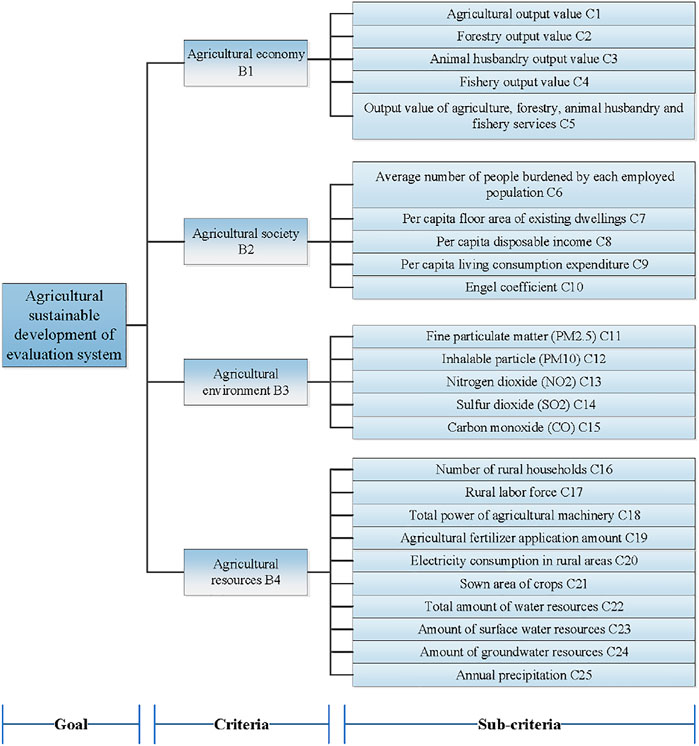
FIGURE 2. Evaluation index system for sustainable agriculture in jiangsu province.
The first-level index agricultural economy reflects the total scale and total results of agricultural production. The second-level indexes that reflect agricultural economy, agricultural output value C1, forestry output value C2, animal husbandry output value C3, fishery output value C4 and output value of agriculture, forestry, animal husbandry and fishery services C5, were set.
C1 = output of agricultural products and their by-products × unit price. It is a positive index; C2 = output of forest products and their by-products × unit price. It is a positive index; C3 = animal husbandry products and their by-products × unit price. It is a positive index; C4 = fishery products and their by-products × unit price. It is a positive index; C5 refers to the total amount of supporting service activities for agricultural production and is a positive index.
The second-level indexes that reflect agricultural society, the average number of people burdened by each employed population C6, per capita floor area of existing dwellings C7, per capita disposable income C8, per capita living consumption expenditure C9 and Engel coefficient C10, were set.
C6 = total population ÷ total number of agricultural laborers. It reflects the degree of agricultural employment. It and is a negative index; C7 = area of dwelling structure ÷ resident population. It is an index of residential floor space per capita. It and is a positive index; C8 = per capita wage income + per capita net operating income + rper capita net property income + per capita net transfer income. It reflects the per capita income that can be used for free disposal. It and is a positive index; C9 = per capita expenditure on consumer goods + per capita expenditure on service consumption. It reflects the per capita expenditure that meets the needs of daily consumption. It and is a positive index; C10 = expenditure on food in rural households ÷ total consumption expenditure of rural households. It is an index of family affluence. It is an index of family affluence and is a negative index.
The mean annual concentration of such air pollutants as fine particulate matter (PM2.5) C11, inhalable particle (PM10) C12, nitrogen dioxide (NO2) C13, sulfur dioxide (SO2) C14 and carbon monoxide (CO) C15 in the ambient air are used as environmental indexes. They are negative indexes.
The second-level indexes that reflect agricultural resources, number of rural households C16, rural labor force C17, total power of agricultural machinery C18, agricultural fertilizer application amount C19, electricity consumption in rural areas C20, sown area of crops C21, total amount of water resources C22, amount of surface water resources C23, amount of groundwater resources C24, annual precipitation C25, and land area C26, were set.
C16 reflects the number of permanent households in rural areas. It is a positive index; C17 reflects the labor force in the rural population who participate in cooperative economic organizations and household production. It is a positive index; C18 reflects the total power of all kinds of power machinery used in agriculture, forestry, animal husbandry and fishery. It is a positive index; C19 reflects the actual amount of chemical fertilizer (including nitrogen, phosphate, potash and compound fertilizers) used in agricultural production this year. It is a positive index; C20 reflects the electricity required for agricultural production and farmers’ lives. It is a positive index; C21 reflects the area of land actually sown or transplanted with crops. It is a positive index; C22 is an important and indispensable natural resource for the development of the national economy. It is a positive index; C23 refers to the general term of water in rivers, lakes, swamps, glaciers, ice sheets and other water bodies. It is a positive index; C24 refers to the water stored in saturated rock and soil pores, fissures and caves below the ground. It is a positive index; C25 is the liquid water that falls from the sky to the ground; annual precipitation is obtained by summing up the monthly precipitation of 12 months. It is a positive index; C26 reflects the area within the boundaries of ownership. It is a positive index.
Explained variable Y: SADL in 13 cities in Jiangsu Province from 2016 to 2019.
Explanatory variable:
1. Total output value of scientific research and technical services X1
2. Total output value of water conservancy, environment and public facility management industry X2
3. Total output value of education X3
4. Total output value of health and social work X4
5. Total output value of culture, sports and entertainment industry X5
6. Total output value of public management, social security and social organization X6
In this section, Eqs 1, 13 were calculated to evaluate the SADL in Jiangsu Province and partition the sustainable development according to Eq. 14; afterwards, a diagnostic model was established according to Eq. 15 to analyze the obstacle factors for agricultural sustainable development; besides, the Tobit regression model was established according to Eq. 16 for the empirical study of influencing factors for agricultural sustainable development.
The SADL in cities in Jiangsu Province was measured to evaluate and rank it from the perspective of time series evolution.
For the SADL in Jiangsu Province, it increased from 0.461 in 2016 to 0.539 in 2019. Except in 2017 when it decreased, it showed a trend of steady growth in the remaining years. The variation coefficient decreased from 0.342 in 2016 to 0.328 in 2019, indicating that the difference in the sustainable development level of agriculture among cities decreased. According to the analysis of first-level indexes of SADL in Jiangsu Province, agricultural economy, agricultural society, agricultural environment and agricultural resources, from 2016 to 2019, agricultural economy, agricultural society and agricultural environment, especially agricultural society and agricultural environment, showed a trend of gradual increase, and increased by about 90%. The SADL in Jiangsu Province benefited from the growth of the agricultural economy, society and environment. However, the indexes of agricultural resources decreased by about 95%. As can be seen from the analysis above, although the SADL in Jiangsu Province showed a trend of gradual growth, agricultural resources showed a sharp downward trend, which is a problem that deserves our attention. Considering the decrease of agricultural resources in Jiangsu Province, the efficient utilization of natural resources might be promoted by intensifying land use, economizing land use, reducing water resource consumption, and rationally utilizing renewable resources, so as to achieve the sustainable utilization of natural resources. The measured sustainable development level of agriculture in Jiangsu Province is shown in Figure 3.
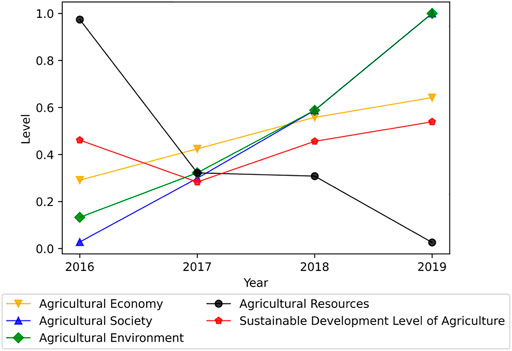
FIGURE 3. Time evolution of SADL in jiangsu province from 2016 to 2019.
From the SADL in cities in Jiangsu Province from 2016 to 2019, there have been small changes in the ranking of cities over time. The sustainable development level of agriculture in Xuzhou and Taizhou tended to increase, while that in Suzhou and Yangzhou tended to decrease. This is because the agricultural economic index of Xuzhou increased steadily every year, while that of Suzhou declined every year. The agricultural environmental index of Taizhou increased from 0.41 in 2016 to 0.54 in 2019, while that of Yangzhou decreased from 0.28 to 0.24 in 2019. The SADL in Yancheng ranked first in all years, while that in Suqian ranked last over the years. The reason for this is that the agricultural economic index in Yancheng was much higher than that in other cities, while that in Suqian was far below that in other cities. The level and first-level indexes of measured sustainable agriculture in cities in Jiangsu Province are shown in Table 1 and Table 2.
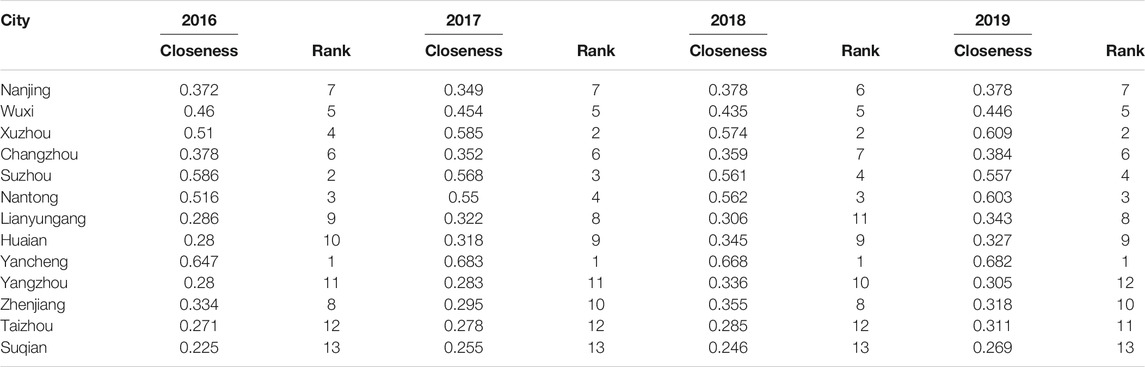
TABLE 1. SADL in cities in jiangsu province from 2016 to 2019.
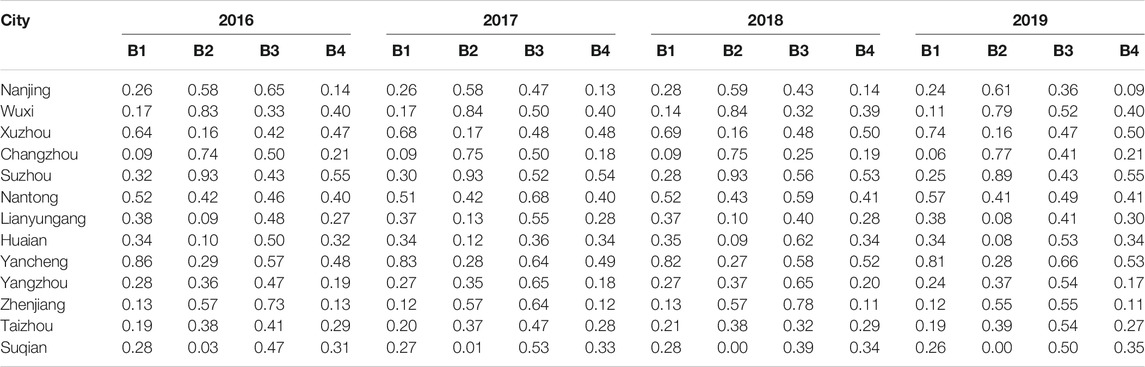
TABLE 2. First-level indexes of SADL in cities in jiangsu province from 2016 to 2019.
In this section, the SADL in cities in Jiangsu Province was analyzed from the perspective of spatial pattern evolution. Spatial pattern evolution analysis is an effective way to reflect the spatial differences in the SADL in cities. According to the calculated rating of sustainable development in Table 3, the sustainable development level is divided into four grades and four grade areas from high to low (Nowak et al., 2019), i.e. Grades I, II, III and IV, as shown in Table 3. On this basis, Figure 4 was drawn with GeoDa.
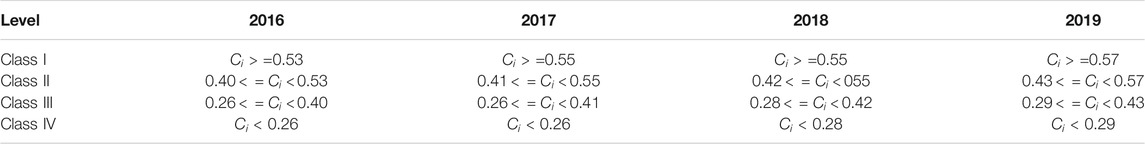
TABLE 3. Synthetic measure Ci.
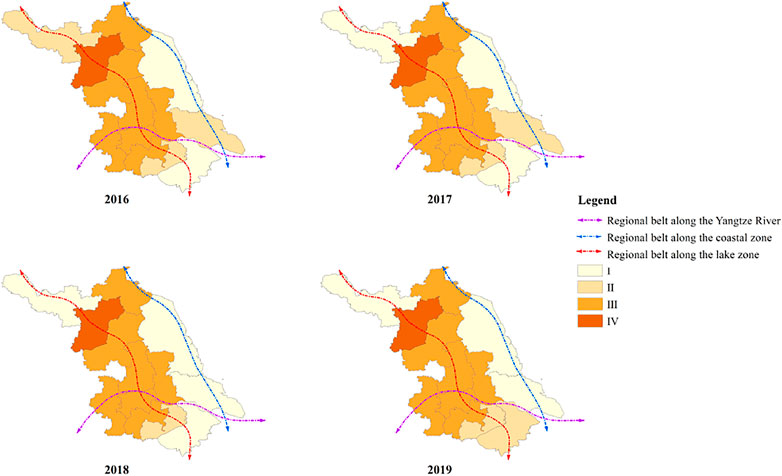
FIGURE 4. Spatial evolution of SADL in jiangsu province from 2016 to 2019.
It can be seen that the SADL in areas along the lake (the Weishan Lake), the sea (the Yellow Sea) and the river (the Yangtze River) was significantly higher than that of other areas. This is because the agricultural resource endowment along the lake, the sea and the river were higher than other areas.
In 2016, the SADL in Yancheng and Suzhou was 0.647 and 0.586 point in Area I, respectively, forming the Yancheng - Nantong - Suzhou high value belt of sustainable agriculture along the sea and the river. The SADL in most regions not along the sea or the river was at the levels of Areas II and III.
In 2017, the SADL in Xuzhou was improved to 0.585 points, which entered Area I and reached the level of areas along the sea and the river, forming a high value area along the lake, the sea and the river. The SADL in other areas remained unchanged.
In 2018, the SADL in Jiangsu Province was improved again. Nantong entered Area I with 0.562 points, maintaining the high value area along the lake, the sea and the river composed of four Area I cities of Xuzhou, Yancheng, Nantong and Suzhou. Nevertheless, Suqian was still in Area IV.
In 2019, except for Suzhou, where the SADL dropped to Area II, other cities remained unchanged and remained the high value area along the lake, the sea and the river. There still is much room for improvement in the future.
In this section, the SADL in cities in Jiangsu Province was analyzed according to the classification of southern Jiangsu, central Jiangsu and northern Jiangsu.
According to the geographical location of each city, the cities in the south of Jiangsu Province belong to southern Jiangsu; the cities in the middle of Jiangsu Province belong to central Jiangsu; and those in the north of Jiangsu Province belong to northern Jiangsu. Southern Jiangsu includes 5 cities: Nanjing, Suzhou, Wuxi, Changzhou and Zhenjiang; central Jiangsu includes 3 cities: Yangzhou, Taizhou, Nantong; and northern Jiangsu includes 5 cities: Xuzhou, Lianyungang, Suqian, Huai’an and Yancheng.
According to the calculation of SADL in cities in Jiangsu in Table 1, the sustainable development level of agriculture in cities in central Jiangsu from 2016 to 2019 was at the relatively low level, with an average development level of 0.356, 0.370, 0.394 and 0.406, respectively. From 2017 to 2019, the level of cities in northern Jiangsu was relatively high, with an average development level of 0.433, 0.428 and 0.446, respectively; the level of cities in southern Jiangsu was at an intermediate level, with an average development level of 0.404, 0.418 and 0.417, respectively. The analysis results showed that, the agricultural mechanization level in northern Jiangsu has been continuously improved; the improvement on science and technology service level has improved agricultural economy level; the increase in farmers’ per capita disposable income and expenditure has improved the agricultural society level. The sustainable development of agriculture in northern Jiangsu was at a relatively high level. Southern Jiangsu is a pilot area of rural industrialization in China. Rural industrialization has promoted the rapid development of the rural economy. However, as time goes by, such problems as the gradual decrease in cultivated land resources and the decline of the status of agricultural industry brought about by rural industrialization, have restricted the development of agriculture in southern Jiangsu. The SADL in central Jiangsu has been restricted by agricultural resources and agricultural economic level. The sustainable development level of agriculture in different areas in Jiangsu Province is shown in Figure 5.
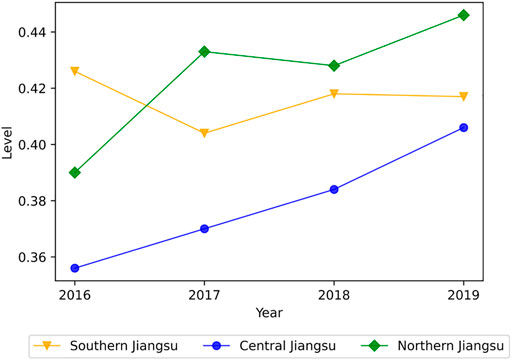
FIGURE 5. Sadl in different areas in jiangsu province.
The key to observe the changes in the SADL in different areas in Jiangsu Province and realize the high-quality development of agriculture in Jiangsu Province is to adhere to the combination of regional planning and regional governance, and to realize the goal of sustainable agriculture in Jiangsu Province according to local conditions.
The main obstacle factors for second-level indexes of sustainable agriculture in Jiangsu Province and the rank of obstacle degree were calculated based on the obstacle diagnosis model, as shown in Table 4 and Table 5(only the top 5 main obstacle factors and the rank of obstacle degree from 2016 to 2019 were listed). The sum of obstacle degree of the top 5 obstacle factors was above 42%, indicating that these factors had the most significant effect among the 24 indexes. According to the analysis of the number of times of obstacle and the average obstacle degree, the most common obstacle factors are C5 (44, 18.57%), C3 (42, 10.37%), C8 (35, 11.35%), C1 (32, 9.82%) and C13 (25, 9.03%).
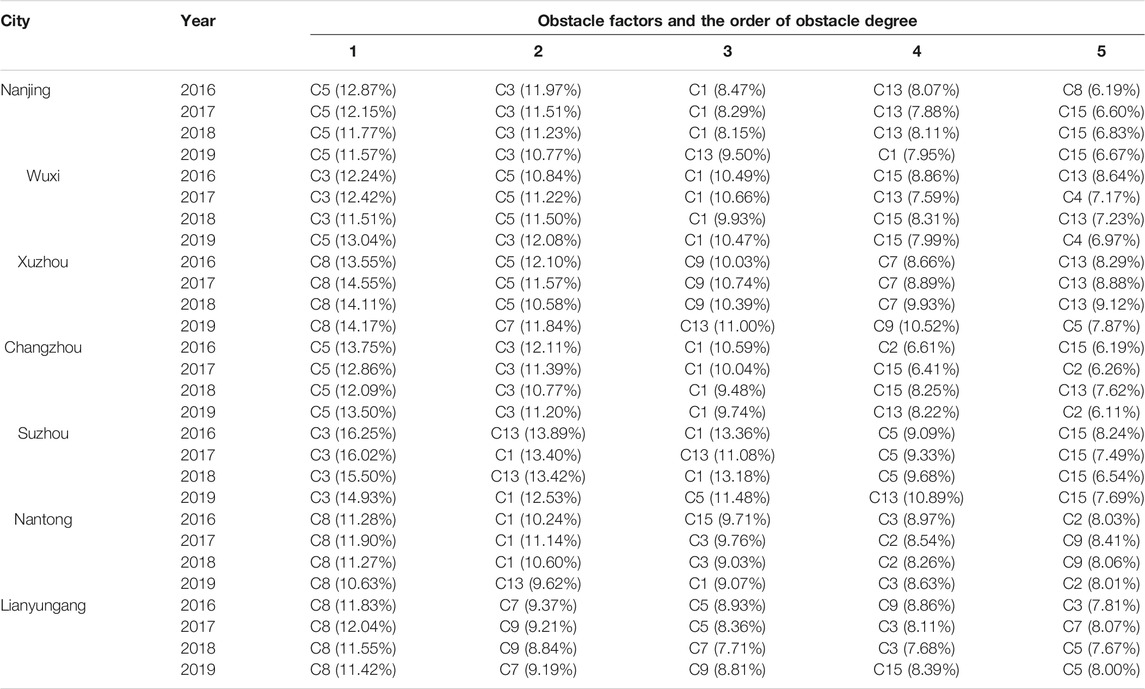
TABLE 4. Main Obstacle Factors for Sustainable Agriculture in Jiangsu Province and Rank of Obstacle Degree from 2016 to 2019 (Part slowromancapi@)
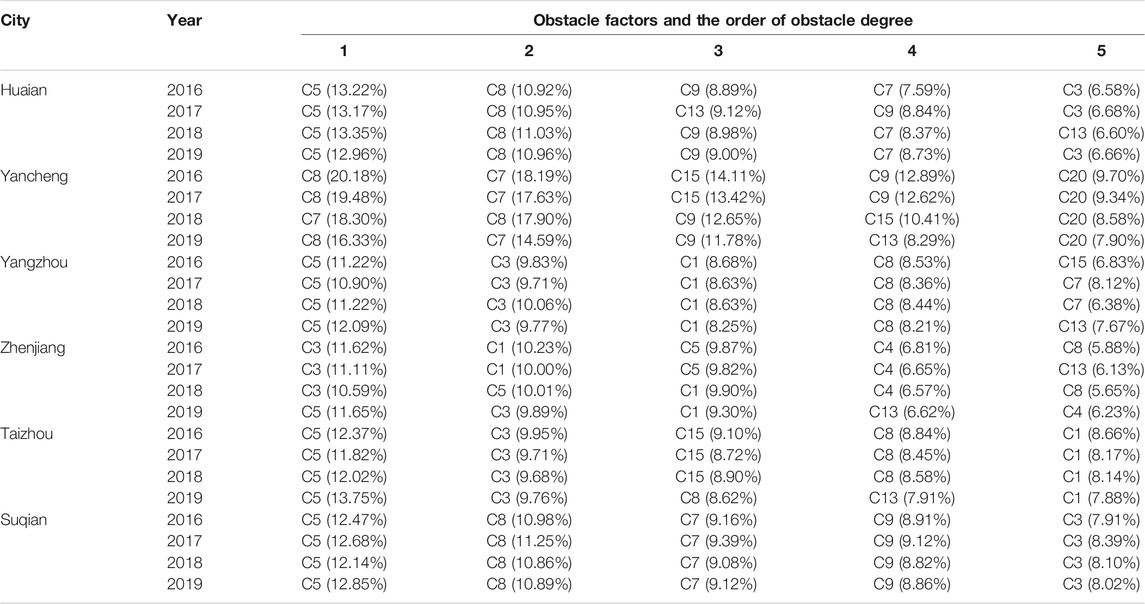
TABLE 5. Main Obstacle Factors for Sustainable Development of Agriculture in Jiangsu Province and Rank of Obstacle Degree from 2016 to 2019 (Part slowromancapii@)
C5 reflects all kinds of supporting service activities in agricultural production, including transportation, fishing, agricultural and sideline products processing and agricultural technical support and other services. The obstacle degree of C5, which appeared in the annual obstacle factor list as a main obstacle factor, was 8.36–13.75% in cities like Nanjing, Wuxi, Xuzhou, Changzhou, Suzhou, Lianyungang, Huai’an, Yangzhou, Zhenjiang, Taizhou and Suqian. These cities should gradually incline from agriculture to agriculture, forestry, animal husbandry and fishery services, perfect industrial infrastructure and carry out reasonable industrial structure layout.
C3 provides food such as meat, milk and eggs. Besides, developing the animal by-product processing industry increases employment opportunities and provides organic fertilizers for agricultural production. The obstacle degree of C3, which appeared for 4 times as a main obstacle factor, was 7.91–16.25% in cities like Nanjing, Wuxi, Changzhou, Suzhou, Nantong, Yangzhou, Zhenjiang, Taizhou and Suqian. With the improvement of the development level of the social economy, the demands for animal by-products have increased. Therefore, animal husbandry must maintain the trend of rapid development, strengthen the development of poultry production and further processing industries such as pig breeding, and improve the level of industrialized operation.
C8 means the per capita income that farmers can spend freely and reflects the living standard of rural residents. The obstacle degree of C8, which appeared for 4 times as a main obstacle factor, was 8.53–20.18% in cities like Xuzhou, Nantong, Lianyungang, Huai’an, Yancheng, Yangzhou, Taizhou and Suqian. The cities with relatively low farmers’ per capita disposable income are mainly located in central and northern Jiangsu, showing a spatial distribution characteristic of low in the north and high in the south. The employment structure should be adjusted, the rural industrialization level improved and the income level of rural residents raised.
C1 reflects the scale of agricultural production. The obstacle degree of C1, which appeared for 4 times as a main obstacle factor, was 7.95–13.40% in Nanjing, Wuxi, Changzhou, Suzhou, Nantong, Yangzhou, Zhenjiang and Taizhou. The cities with relatively low farmers’ per capita disposable income are mainly located in southern Jiangsu and central Jiangsu where rural industrialization is developed, which has caused the reduction of agricultural resources and limited the development of agriculture.
C13 reflects the mean annual concentration of the pollutant nitrogen dioxide in the air. Nitrogen dioxide is an important pollutant that affects air quality. In agricultural production, crop straw burning converts the nitrogen, sulfur and other elements in the crop straw into volatile matters or particles that enter the atmosphere and pollute the air. Open crop straw burning should be prohibited and the comprehensive utilization of crop straw might be promoted to gradually improve the rural living environment and straw fertilizer for soil improvement might be implemented.
The obstacle degree of obstacle factors for the first-level indexes of sustainable agriculture in Jiangsu Province was calculated on the basis of the obstacle diagnosis model, see Figure 6. The factors with an obstacle degree greater than 10% were taken as the key obstacle factors for evaluation objects (Chen et al., 2020). The key first-level indexes that restrict the sustainable development of agriculture in Jiangsu Province include B1 (agricultural economy), B2 (agricultural society) and B4 (agricultural resources).
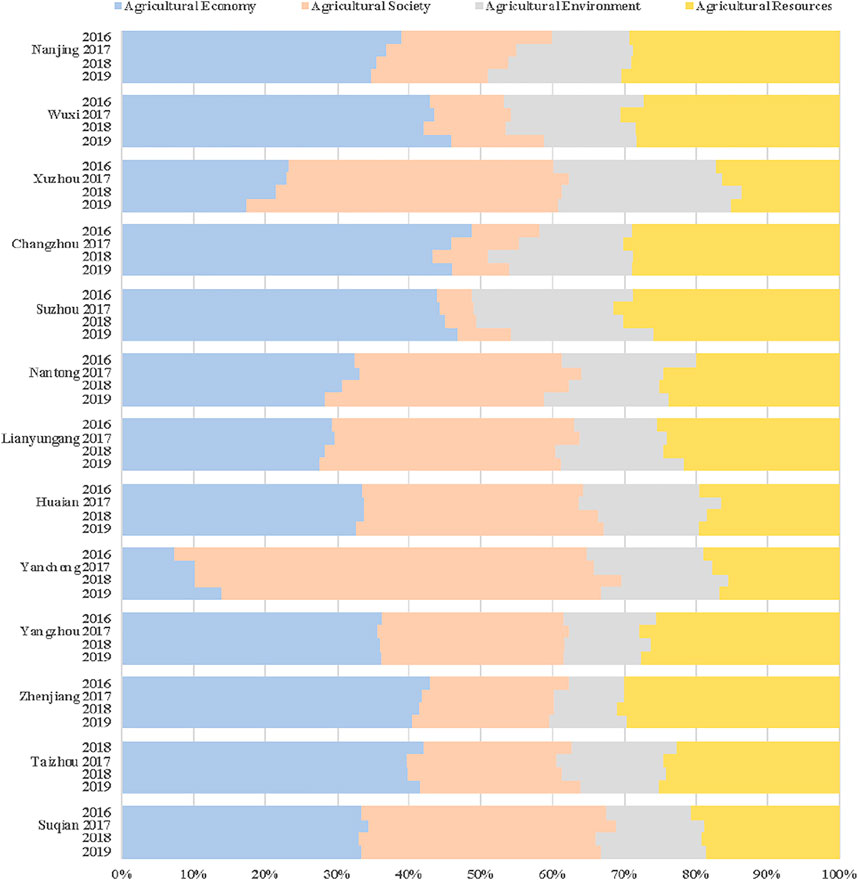
FIGURE 6. Obstacle degree of first-level indexes for sustainable agriculture in jiangsu province.
From the perspective of main obstacle factors for different areas, in areas along the sea and the river, rural industrialization has promoted the rapid development of rural economy, but the development of the rural economy has caused such problems as the gradual decrease in cultivated land and other agricultural resources and the decline of the status of the agricultural industry. While great achievements have been made in the agricultural and rural economy in areas along the sea and the river, a series of problems, such as the over-exploitation of agricultural resources, the overuse of agricultural inputs, the over-exploitation of groundwater and the superposition of pollution from internal and external sources of agriculture have become prominent. In these areas the occupation of cultivated land and the development and utilization of water resources might be strictly controlled, new technologies and new products for the protection and efficient utilization of resources should be implemented, so as to keep improving the utilization efficiency of land and water resources. Besides, in such areas, benefit compensation mechanism and reward and punishment mechanism for agricultural resources might also be established, agricultural resources recuperation might be carried out in an appropriate and orderly manner, the protection and construction of agricultural ecology might be strengthened, the sustainable utilization of resources might be promoted, improving the level of agricultural economy to cope with the challenges facing the sustainable agriculture in areas along the sea and the river. The index agricultural society of such cities in northern Jiangsu as Xuzhou and Yancheng is a key factor restricting the sustainable development of agriculture. The integrated and coordinated development of agricultural rural economy in southern Jiangsu - central Jiangsu - northern Jiangsu should be realized. Finance might be made full of to narrow the income gap and promote social progress. Vocational training and employment assistance might be provided to the rural labor force and people with difficulty in finding jobs to effectively ensure people’s well-being and increase employment. The sustainable agriculture in northern Jiangsu might be improved by improving farmers’ per capita disposable income and the quality of social public services.
Table 5 shows the measuring results of the random effect panel regression model obtained by Stata statistical software. The LR test results at the bottom of Table 6 strongly reject H0: σu = 0. Therefore, it is considered that there is an individual effect; and the panel Tobit regression with random effect should be used.
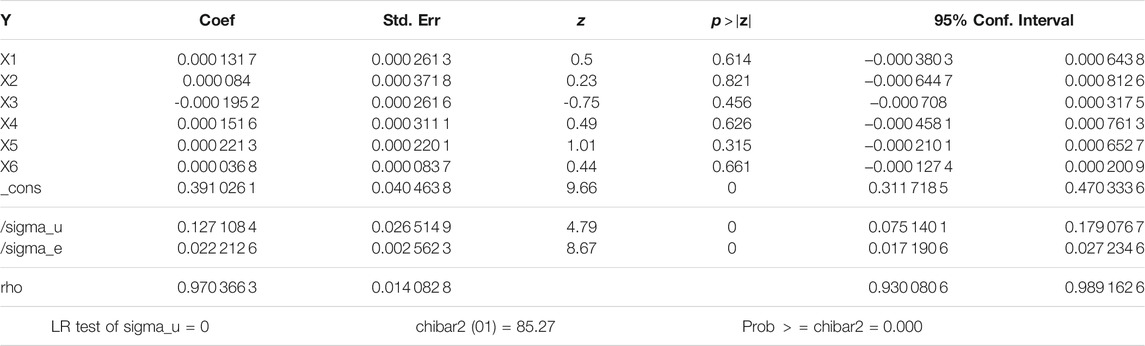
TABLE 6. Output of tobit regression.
According to the measuring results in Table 5, X1, X2, X4, X5 and X6 have positive effect on the SADL in Jiangsu Province, indicating that improving the local science and technology, water conservancy, environment, health, culture and social security services is vital for improving the SADL in cities in Jiangsu Province; the total output value of education X3, however, has negative effect on the SADL in Jiangsu Province, but this effect is not significant; in other words, cities with higher education service level do not have higher SADL; the reason for this is that locally educated students do not stay local upon their graduation. Among influencing factors of sustainable agriculture in Jiangsu Province, the coefficient of the effect of the total output value of culture, sports and entertainment industry X5 on the sustainable agriculture is greatest, followed by that of the total output value of health and social work X4 and the total output value of scientific research and technical services X1. The results showed that vigorously developing cultural and health services and strengthening scientific research and technical service construction in Jiangsu Province can effectively improve the SADL in Jiangsu Province.
In this paper, the data of 13 cities in Jiangsu Province from 2016 to 2019 and the entropy weight-TOPSIS model were used to evaluate the sustainable development level of agriculture in Jiangsu Province; besides, the obstacle diagnosis model was used to find out the main obstacle factors for the sustainable development of agriculture in Jiangsu Province, calculateing their obstacle degree; moreover, the Tobit regression model was established to analyze the main influencing factors for the sustainable agriculture development level (SADL) in Jiangsu Province. Conclusions are as follows:
1. From the perspective of time series evolution, from 2016 to 2019, the SADL in Jiangsu Province showed an upward trend; the difference in the SADL between cities in Jiangsu Province narrowed slightly, but the overall gap was still large.
2. From the spatial pattern evolution, the SADL in areas along the lake, the sea and the river were significantly higher than that in other areas. A high value belt of sustainable development of agriculture in Xuzhou - Yancheng - Nantong - Suzhou, where there is a higher agricultural resource endowment than that in other areas, was formed.
3. From the evolution of the SADL in different areas in Jiangsu Province, a U-shaped regional difference characteristic with the highest level in northern Jiangsu, the medium in southern Jiangsu and the lowest in central Jiangsu was formed. Rural industrialization caused the gradual decrease of agricultural arable land resources, resulting in a lower level of sustainable development of agriculture.
4. The output value of agriculture, animal husbandry and agriculture, forestry, animal husbandry and fishery services, farmers’ per capita disposable income and the content of NO2 in the air are the main obstacles influencing sustainable agriculture in Jiangsu Province.
5. Cultural and health services, scientific research and technical service construction have the greatest influence on the sustainable agriculture in Jiangsu Province.
The following policy suggestions are proposed herein based on the conclusions above:
1. Attention might be paid to the sharp downward trend of agricultural resources in Jiangsu Province. In Jiangsu Province, the efficient utilization of natural resources might be promoted by intensifying land use, economizing land use, reducing water resource consumption and rationally utilizing renewable resources, and equal importance to protection and development might be attached, so as to realize the sustainable utilization of natural resources.
2. The difference in the SADL between different areas in Jiangsu Province has limited the high-quality development of agriculture in Jiangsu Province. For that reason, the combination of regional overall planning and regional governance and formulate policies might be advocated to realize the goal of sustainable development of agriculture in Jiangsu Province according to local conditions.
3. While great achievements have been made in the agricultural and rural economy in areas along the sea and the river, a series of problems, such as the over-exploitation of agricultural resources, the overuse of agricultural inputs, the over-exploitation of groundwater and the superposition of pollution from internal and external sources of agriculture have become prominent. In these areas, the occupation of cultivated land and the development and utilization of water resources might be strictly controlled, new technologies and new products such as water recycling, soil and water resource restoration, soil conservation and water storage and soil improvement, implementation of integrated farming system for the protection and efficient utilization of resources might be implemented, so as to keep improving the utilization efficiency of land and water resources. Besides, in such areas, beneficial compensation mechanism and reward and punishment mechanism for agricultural resources might also be established, agricultural resources recuperation might be carry out in an appropriate and orderly manner, the protection and construction of agricultural ecology might be strengthened, the sustainable utilization of resources might be promoted, improving the level of agricultural economy to cope with the challenges facing the sustainable agriculture in areas along the sea and the river.
4. Since the index agricultural society in northern Jiangsu is a key obstacle restricting the sustainable development of agriculture, finance should be made full of to narrow the income gap and promote social progress. Vocational training and employment assistance should be provided to the rural labor force and people with difficulty in finding jobs to effectively ensure people’s well-being and increase employment. The SADL in northern Jiangsu should be improved by improving farmers’ per capita disposable income and the quality of social public services.
5. In Jiangsu Province, scientific research and technical service construction might be strengthened, input into cultural and health services might be increased, the social security service system might be improved, the level and area of social security might be raised, the quality and efficiency of public relations management might be improved and the gap between urban and rural areas might be narrowed.
Publicly available datasets were analyzed in this study. This data can be found here: http://tj.jiangsu.gov.cn/col/col83749/index.html.
Conceptualization, ZW and LH; methodology, ZW; investigation, ZW and LH; resources and data curation, ZW and LH; writing—original draft preparation, LH and ZW; writing—review and editing, LH and ZW; Proofreading—LY and DZ; All authors have read and agreed to the published version of the manuscript.
This work was supported by the Nantong Social Science Fund (No. 2021BNT009); Shanghai Innovation Center of Reverse Logistics and Supply Chain (Shanghai Polytechnic University) (No.A30DB212103-06); Key Undergraduate Education Reform Project in Shanghai: Exploration and practice of new fintech major construction from the perspective of fintech industry development; and the Shanghai Financial Technology Research Center (No. 2021-JK01-C).
The authors declare that the research was conducted in the absence of any commercial or financial relationships that could be construed as a potential conflict of interest.
All claims expressed in this article are solely those of the authors and do not necessarily represent those of their affiliated organizations, or those of the publisher, the editors and the reviewers. Any product that may be evaluated in this article, or claim that may be made by its manufacturer, is not guaranteed or endorsed by the publisher.
Adegbeye, M. J., Ravi Kanth Reddy, P., Obaisi, A. I., Elghandour, M. M. M. Y., Oyebamiji, K. J., Salem, A. Z. M., et al. (2020). Sustainable Agriculture Options for Production, Greenhouse Gasses and Pollution Alleviation, and Nutrient Recycling in Emerging and Transitional Nations - an Overview. J. Clean. Prod. 242, 118319. doi:10.1016/j.jclepro.2019.118319
Ashraf, S. A., Siddiqui, A. J., Elkhalifa, A. E. O., Khan, M. I., Patel, M., Alreshidi, M., et al. (2021). Innovations in Nanoscience for the Sustainable Development of Food and Agriculture with Implications on Health and Environment. Sci. Total Environ. 768, 144990. doi:10.1016/j.scitotenv.2021.144990
Barrios, E., Gemmill-Herren, B., Bicksler, A., Siliprandi, E., Brathwaite, R., Moller, S., et al. (2020). The 10 Elements of Agroecology: Enabling Transitions towards Sustainable Agriculture and Food Systems through Visual Narratives. Ecosyst. People 16, 230–247. doi:10.1080/26395916.2020.1808705
Chen, L., and Wang, Y.-z. (2003). Research on Topsis Integrated Evaluation and Decision Method Based on Entropy Coefficient. Control. Decis. 18, 456–459.
Chen, Y., Zhu, M., Lu, J., Zhou, Q., and Ma, W. (2020). Evaluation of Ecological City and Analysis of Obstacle Factors under the Background of High-Quality Development: Taking Cities in the Yellow River basin as Examples. Ecol. Indicators 118, 106771. doi:10.1016/j.ecolind.2020.106771
Cheng, X., Shuai, C., Liu, J., Wang, J., Liu, Y., Li, W., et al. (2018). Modelling Environment and Poverty Factors for Sustainable Agriculture in the Three Gorges Reservoir Regions of china. Land Degrad. Dev. 29, 3940–3953. doi:10.1002/ldr.3143
Chu, T.-C. (2002). Facility Location Selection Using Fuzzy Topsis under Group Decisions. Int. J. Unc. Fuzz. Knowl. Based Syst. 10, 687–701. doi:10.1142/s0218488502001739
[Dataset] Jonathan Brooks, K. D., and Giner, C. (2021). Three Key Challenges Facing Agriculture and How to Start Solving Them - Oecd.
[Dataset] General Office of Jiangsu Province (2021). Jiangsu Province’s Policy Plan to Comprehensively Promote Rural Revitalization and Accelerate Agricultural and Rural Modernization during the ”14th Five-Year Plan” Period. Available at: http://www.zgjssw.gov.cn/fabuting/shengweiwenjian/202110/t20211027_7287408.shtml (Accessed January 29, 2022).
Deguines, N., Jono, C., Baude, M., Henry, M., Julliard, R., and Fontaine, C. (2014). Large-scale Trade-Off between Agricultural Intensification and Crop Pollination Services. Front. Ecol. Environ. 12, 212–217. doi:10.1890/130054
Diaz-Sarachaga, J. M., Jato-Espino, D., and Castro-Fresno, D. (2018). Is the Sustainable Development Goals (Sdg) index an Adequate Framework to Measure the Progress of the 2030 Agenda? Sustain. Develop. 26, 663–671. doi:10.1002/sd.1735
Dong, L., Shang, J., Ali, R., and Rehman, R. U. (2021). The Coupling Coordinated Relationship between New-type Urbanization, Eco-Environment and its Driving Mechanism: A Case of Guanzhong, china. Front. Environ. Sci. 9, 20. doi:10.3389/fenvs.2021.638891
Fatima, F., Hashim, A., and Anees, S. (2021). Efficacy of Nanoparticles as Nanofertilizer Production: a Review. Environ. Sci. Pollut. Res. 28, 1292–1303. doi:10.1007/s11356-020-11218-9
Frenzen, J. K., and Davis, H. L. (1990). Purchasing Behavior in Embedded Markets. J. Consum Res. 17, 1–12. doi:10.1086/208532
Gafsi, M., Legagneux, B., Nguyen, G., and Robin, P. (2006). Towards Sustainable Farming Systems: Effectiveness and Deficiency of the French Procedure of Sustainable Agriculture. Agric. Syst. 90, 226–242. doi:10.1016/j.agsy.2006.01.002
Hao, H., Zhang, Q., Wang, Z., and Zhang, J. (2018). Forecasting the Number of End-Of-Life Vehicles Using a Hybrid Model Based on Grey Model and Artificial Neural Network. J. Clean. Prod. 202, 684–696. doi:10.1016/j.jclepro.2018.08.176
Hwang, C.-L., and Yoon, K. (1981). “Methods for Multiple Attribute Decision Making,” in Multiple Attribute Decision Making (Berlin, Germany: Springer), 58–191. doi:10.1007/978-3-642-48318-9_3
Kanter, D. R., Musumba, M., Wood, S. L. R., Palm, C., Antle, J., Balvanera, P., et al. (2018). Evaluating Agricultural Trade-Offs in the Age of Sustainable Development. Agric. Syst. 163, 73–88. doi:10.1016/j.agsy.2016.09.010
Khan, I. S., Ahmad, M. O., and Majava, J. (2021). Industry 4.0 and Sustainable Development: A Systematic Mapping of Triple Bottom Line, Circular Economy and Sustainable Business Models Perspectives. J. Clean. Prod. 297, 126655. doi:10.1016/j.jclepro.2021.126655
Lai, Y.-J., Liu, T.-Y., and Hwang, C.-L. (1994). Topsis for Modm. Eur. J. Oper. Res. 76, 486–500. doi:10.1016/0377-2217(94)90282-8
Latruffe, L., Diazabakana, A., Bockstaller, C., Desjeux, Y., Finn, J., Kelly, E., et al. (2016). Measurement of Sustainability in Agriculture: a Review of Indicators. Stud. Agr. Econ. 118, 123–130. doi:10.7896/j.1624
Liu, A., Xiao, Y., Lu, H., Tsai, S.-B., and Song, W. (2019). A Fuzzy Three-Stage Multi-Attribute Decision-Making Approach Based on Customer Needs for Sustainable Supplier Selection. J. Clean. Prod. 239, 118043. doi:10.1016/j.jclepro.2019.118043
Liu, X., Liu, Y., Rui, Y., Zhang, J., and Zhao, X. (2020a). Evaluation of Sustainable Agriculture and Rural Development in Agro-Pastoral Ecotone under Climate Change: A Comparative Study of Three Villages in the Shenfu coalfield, china. J. Rural Stud. In Press. doi:10.1016/j.jrurstud.2019.12.016
Liu, Y., Sun, D., Wang, H., Wang, X., Yu, G., and Zhao, X. (2020b). An Evaluation of China's Agricultural green Production: 1978-2017. J. Clean. Prod. 243, 118483. doi:10.1016/j.jclepro.2019.118483
Liu, Y., Zou, L., and Wang, Y. (2020c). Spatial-temporal Characteristics and Influencing Factors of Agricultural Eco-Efficiency in china in Recent 40 Years. Land Use Policy 97, 104794. doi:10.1016/j.landusepol.2020.104794
Michna, Z., Disney, S. M., and Nielsen, P. (2020). The Impact of Stochastic lead Times on the Bullwhip Effect under Correlated Demand and Moving Average Forecasts. Omega 93, 102033. doi:10.1016/j.omega.2019.02.002
Mikhno, I., Koval, V., Shvets, G., Garmatiuk, O., and Tamošiūnienė, R. (2021). Green Economy in Sustainable Development and Improvement of Resource Efficiency. Cent. Eur. Business Rev. 10, 99–113. doi:10.18267/j.cebr.252
Mousavi-Nasab, S. H., and Sotoudeh-Anvari, A. (2017). A Comprehensive Mcdm-Based Approach Using Topsis, Copras and Dea as an Auxiliary Tool for Material Selection Problems. Mater. Des. 121, 237–253. doi:10.1016/j.matdes.2017.02.041
Mwalupaso, G. E., Korotoumou, M., Eshetie, A. M., Essiagnon Alavo, J.-P., and Tian, X. (2019). Recuperating Dynamism in Agriculture through Adoption of Sustainable Agricultural Technology - Implications for Cleaner Production. J. Clean. Prod. 232, 639–647. doi:10.1016/j.jclepro.2019.05.366
Niemeijer, D., and de Groot, R. S. (2008). A Conceptual Framework for Selecting Environmental Indicator Sets. Ecol. indicators 8, 14–25. doi:10.1016/j.ecolind.2006.11.012
Nowak, A., Krukowski, A., and Różańska-Boczula, M. (2019). Assessment of Sustainability in Agriculture of the european union Countries. Agronomy 9, 890. doi:10.3390/agronomy9120890
Peng, A.-H., and Xiao, X.-M. (2013). Material Selection Using Promethee Combined with Analytic Network Process under Hybrid Environment. Mater. Des. 47, 643–652. doi:10.1016/j.matdes.2012.12.058
Rahman, M. S., Saha, N., Islam, A. T., Shen, S., and Bodrud-Doza, M. (2017). Evaluation of Water Quality for Sustainable Agriculture in bangladesh. Water Air Soil Pollut. 228, 1–16. doi:10.1007/s11270-017-3543-x
Raliya, R., Saharan, V., Dimkpa, C., and Biswas, P. (2017). Nanofertilizer for Precision and Sustainable Agriculture: Current State and Future Perspectives. J. Agric. Food Chem. 66, 6487–6503. doi:10.1021/acs.jafc.7b02178
Sachs, J. D., Schmidt-Traub, G., Mazzucato, M., Messner, D., Nakicenovic, N., and Rockström, J. (2019). Six Transformations to Achieve the Sustainable Development Goals. Nat. Sustain. 2, 805–814. doi:10.1038/s41893-019-0352-9
Sanders, R. (2006). A Market Road to Sustainable Agriculture? Ecological Agriculture, green Food and Organic Agriculture in china. Develop. Change 37, 201–226. doi:10.1111/j.0012-155x.2006.00475.x
Sharma, B., Dangi, A. K., and Shukla, P. (2018). Contemporary Enzyme Based Technologies for Bioremediation: a Review. J. Environ. Manag. 210, 10–22. doi:10.1016/j.jenvman.2017.12.075
Sharma, R., Kamble, S. S., Gunasekaran, A., Kumar, V., and Kumar, A. (2020). A Systematic Literature Review on Machine Learning Applications for Sustainable Agriculture Supply Chain Performance. Comput. Operations Res. 119, 104926. doi:10.1016/j.cor.2020.104926
Skaf, L., Buonocore, E., Dumontet, S., Capone, R., and Franzese, P. P. (2019). Food Security and Sustainable Agriculture in lebanon: An Environmental Accounting Framework. J. Clean. Prod. 209, 1025–1032. doi:10.1016/j.jclepro.2018.10.301
Sun, B., Yang, X., Zhang, Y., and Chen, X. (2019). Evaluation of Water Use Efficiency of 31 Provinces and Municipalities in china Using Multi-Level Entropy Weight Method Synthesized Indexes and Data Envelopment Analysis. Sustainability 11, 4556. doi:10.3390/su11174556
Tian, H., Lu, C., Pan, S., Yang, J., Miao, R., Ren, W., et al. (2018). Optimizing Resource Use Efficiencies in the Food-Energy-Water Nexus for Sustainable Agriculture: from Conceptual Model to Decision Support System. Curr. Opin. Environ. Sustainability 33, 104–113. doi:10.1016/j.cosust.2018.04.003
Tsani, S., Koundouri, P., and Akinsete, E. (2020). Resource Management and Sustainable Development: A Review of the European Water Policies in Accordance with the United Nations' Sustainable Development Goals. Environ. Sci. Pol. 114, 570–579. doi:10.1016/j.envsci.2020.09.008
Tseng, M. C., Roel, A., Deambrosi, E., Terra, J. A., Zorrilla, G., Riccetto, S., et al. (2020). Towards Actionable Research Frameworks for Sustainable Intensification in High-Yielding rice Systems. Sci. Rep. 10, 9975. doi:10.1038/s41598-020-63251-w
Ul Hassan, M., Wen, X., Xu, J., Zhong, J., and Li, X. (2020). Development and Challenges of green Food in china. Front. Agr. Sci. Eng. 7, 56–66. doi:10.15302/j-fase-2019296
Vassoney, E., Mammoliti Mochet, A., Desiderio, E., Negro, G., Pilloni, M. G., and Comoglio, C. (2021). Comparing Multi-Criteria Decision-Making Methods for the Assessment of Flow Release Scenarios from Small Hydropower Plants in the alpine Area. Front. Environ. Sci. 9, 20. doi:10.3389/fenvs.2021.635100
Zavadskas, E. K., Turskis, Z., and Kildienė, S. (2014). State of Art Surveys of Overviews on Mcdm/madm Methods. Technol. Econ. Dev. economy 20, 165–179. doi:10.3846/20294913.2014.892037
Zeng, X., Zhao, Y., and Cheng, Z. (2021). Development and Research of Rural Renewable Energy Management and Ecological Management Information System under the Background of Beautiful Rural Revitalization Strategy. Sustain. Comput. Inform. Syst. 30, 100553. doi:10.1016/j.suscom.2021.100553
Zeshui, X., and Cuiping, W. (1999). A Consistency Improving Method in the Analytic Hierarchy Process. Eur. J. Oper. Res. 116, 443–449. doi:10.1016/s0377-2217(98)00109-x
Zhang, Y., Chao, Y., Fan, R., Ren, F., Qi, B., Ji, K., et al. (2021). Spatial-temporal Trends of Rainfall Erosivity and its Implication for Sustainable Agriculture in the Wei River basin of china. Agric. Water Manage. 245, 106557. doi:10.1016/j.agwat.2020.106557
Zhao, L., Lu, L., Wang, A., Zhang, H., Huang, M., Wu, H., et al. (2020). Nano-biotechnology in Agriculture: Use of Nanomaterials to Promote Plant Growth and Stress Tolerance. J. Agric. Food Chem. 68, 1935–1947. doi:10.1021/acs.jafc.9b06615
Zheng, G., Li, C., and Feng, Y. (2020). Developing a New index for Evaluating Physiological Safety in High Temperature Weather Based on Entropy-TOPSIS Model - A Case of Sanitation Worker. Environ. Res. 191, 110091. doi:10.1016/j.envres.2020.110091
Zhou, Y., Guo, L., and Liu, Y. (2019). Land Consolidation Boosting Poverty Alleviation in china: Theory and Practice. Land use policy 82, 339–348. doi:10.1016/j.landusepol.2018.12.024
Zhu, C., Lin, Y., Zhang, J., Gan, M., Xu, H., Li, W., et al. (2021). Exploring the Relationship between Rural Transition and Agricultural Eco-Environment Using a Coupling Analysis: A Case Study of Zhejiang Province, china. Ecol. Indicators 127, 107733. doi:10.1016/j.ecolind.2021.107733
Keywords: agriculture resources evaluation, sustainable agriculture management, entropy-TOPSIS approach, obstacle diagnosis model, tobit regression model
Citation: Wang Z, Huang L, Yin L, Wang Z and Zheng D (2022) Evaluation of Sustainable and Analysis of Influencing Factors for Agriculture Sector: Evidence From Jiangsu Province, China. Front. Environ. Sci. 10:836002. doi: 10.3389/fenvs.2022.836002
Received: 15 December 2021; Accepted: 31 January 2022;
Published: 22 February 2022.
Edited by:
Viktor Koval, National Academy of Sciences of Ukraine, UkraineReviewed by:
Luigi Aldieri, University of Salerno, ItalyCopyright © 2022 Wang, Huang, Yin, Wang and Zheng. This is an open-access article distributed under the terms of the Creative Commons Attribution License (CC BY). The use, distribution or reproduction in other forums is permitted, provided the original author(s) and the copyright owner(s) are credited and that the original publication in this journal is cited, in accordance with accepted academic practice. No use, distribution or reproduction is permitted which does not comply with these terms.
*Correspondence: Lufei Huang, bHVmZWkuaHVhbmdAb3V0bG9vay5jb20=
Disclaimer: All claims expressed in this article are solely those of the authors and do not necessarily represent those of their affiliated organizations, or those of the publisher, the editors and the reviewers. Any product that may be evaluated in this article or claim that may be made by its manufacturer is not guaranteed or endorsed by the publisher.
Research integrity at Frontiers
Learn more about the work of our research integrity team to safeguard the quality of each article we publish.