 Yunpeng Sun
 Ying Li
 Yujing Wang
 Qun Bao
- 1School of Economics, Tianjin University of Commerce, Tianjin, China
- 2School of Economics, Nankai University, Tianjin, China
This article used data from 1980 to 2019 to examine the relationship between financial annexation, financial development, green innovation, and CO2 emissions in China. This review provides vital information to policymakers on how to go to preventative and therapeutic measures to reduce CO2 discharges in many sectors and demonstrates that innovation in the energy sector may help alleviate environmental change through energy productivity. The review used an autoregressive disseminated slack (ARDL) model to determine the dynamic coefficients for both the study’s long- and short-term periods. This study used the autoregressive circulated slack (ARDL) approach since it performs better than any alternative strategies in small cases, as was the case in this research. The ARDL and DARDL models show that CO2 emissions in China are increasing as a result of increased energy consumption and economic growth. Based on the findings, it is advised that China’s approach creators take on such sustainable power sources and improve them so that they may help meet the growing need for energy by replacing outdated traditional energy sources like coal, gas, and oil with them.
Introduction
Since the 1950s, increasing air and water pollution levels have become a major source of public concern in developed nations. Although natural solutions have improved air and water quality, CO2 emissions have increased, and biodiversity has been lost, proving that economic mobility is still impracticable. According to the Paris report, global, territorial, and public finance tools should be developed to support bankable low-carbon initiatives, particularly in the creation of economies of scale (Paris COP21, 2015). According to the 2021 CAT report for China, there are structures in place for horizontal and vertical climate coordination. China has institutional frameworks in place to mobilize and manage climate finance. However, to date, the government has struggled to raise adequate funding for climate action, China has no long-term strategy for de-carbonization. Contrastingly, FA can be beneficial to the environment via emission mitigation. For instance, FA can assist businesses to gain access to low-cost financial products and services to boost their investments in green technologies (Le et al., 2020; Sun et al., 2021). Moving green advancement innovation and knowledge allows greater green advancement to increase their income and reduce their outside development costs (Fernando and Wah, 2017). In Central China, the problem of growing pollution and squanders is more fundamental. Several factors contribute to China’s GDP growth rate of 9.7% per year, including high asset utilization and toxins ageing rates (Zhang and Wen, 2008). Renzhi and Baek (2020) postulated that inclusive financial systems contribute to economic expansion by boosting ecological quality. Theoretically, FA can exert both negative and positive effects on environmental quality. Since the mid-1980s, China has seen an increase in environmental pollution due to development projects, which has been widely praised (Zeng et al., 2005). According to Usman et al. (2021), inclusive financial services attract research and development and FDI inflows that help to boost ES. While the connection between economic growth (FD) and ES has been expansively explored, for instance, Zeeshan et al. (2021) for developed high-income countries; Jalil and Feridun (2011) for BRI countries, the number of studies on the association between FA and ES are extremely scarce.
We contributed to the literature by adopting the dynamic ARDL estimator of Jordan and Philips (2018) to explore the marginal impacts of the predictors on the criterion variable. This technique is advantageous because it builds on the conventional ARDL estimator and thus offers more valid and reliable outcomes. Finally, aside from foreign direct investment (FDI) that was included in the model to test whether the hypothesis of pollution haven or pollution halo existed for China, the study also controlled for trade openness (TO), population growth (POP) and energy consumption (EC) to help minimize omitted variable bias (OVB) issues. The DARDL approach is also advantageous to other econometric methods in that it can automatically plot the graphs of the positive and negative influences of predictors on the explained variable (Qin et al., 2021) that also investigated the connexion amidst FA, FD and ES, failed to use this robust econometric technique. Zaidi et al. (2021) affirmed FA as detrimental to ES. Despite the growing interest in the topic of late, empirical evidence within the context of China is lacking to the best of the researcher’s knowledge. Therefore, an exploration to examine the FA and ES connection in China was essential. China’s attempt to mitigate CO2 emissions capacity to climate-related impacts is ineffective compared to other developing economies. Therefore, it was worthwhile to undertake this study to help the country contribute to the global fight against climate change and its adversities. This study bridges the above gap by examining the nexus amidst the series in China. Appropriate policy options help the country attain low CO2 emissions. The study is sought to explore the influence of FA, FD on ES in China after a thorough review of the literature. Secondly, unlike prior studies that measured FA by only a variable, this research employed the PCA technique to construct a FA index (FAI) for the analysis. This study is essential because it comes out with recommendations to help combat climate change and promote sustainable development in the country that expanding FA effectively improves the climate resilience of vulnerable groups (Renzhi and Baek, 2020).
The rest of the paper is divided into parts. In Literature Review, the results of previous researchers are summarized as a literature review. Research Methodology discussed the study’s methodology and econometric explanation. Results and Discussions summarizes the findings and subsequent discussions. Conclusion discussed the results and future strategies for the research.
Literature Review
Financial Annexation
Renzhi and Baek (2020) examined that improvements in green financial services helped boost ecological quality in the countries at the later stages. Due to a lack of resources, a rapidly growing population, financial anxieties, and environmental damage, policymakers find it difficult to develop policies that can be supported (Ji and Chen, 2017). Usman et al. (2021) determined a strong connection between FA and environmental degradation in the fifteen highest CO2 emitting nations globally. Le et al. (2020) chose the diverse proxies of FA and reasonable adjustments to the specified model. They advocated for incorporating the variable into the emission mitigation strategies of the nations to help advance ecological quality. Sun et al. (2021) environmental degradation encouraged by the FA was found to link carbon dioxide emissions into the atmosphere directly. Financial progress cannot occur without financial inclusion. According to Maity (2019), FA is a system that makes it possible for individuals and enterprises to acquire financial goods and services that are acceptable, reasonable, and available when they need them. The goal of financial actions is to speed up economic growth, which raises more energy demand, increasing CO2 emissions, which harms people’s lives and well-being. Efforts to make financial goods and services available and cheap to everyone, regardless of personal wealth or company size, are referred to as financial annexation (FA) by Sun and Razzaq (2022) used five proxies of FA to study the link between FA and CO2 emissions in China. Four out of the five indices of FA were shown to have an impact on ES in the country, according to ARDL estimations. There is a strong case to be made that FA played an important part in the global effort to combat climate change. Studies on the FD-ES relationship were also included in the FA and ES literature, following Qin et al. (2021).
Financial Development
Yao and Zhang (2021) used the ARDL approach to conduct a study of China. According to the survey, FD’s income and substitution impacts on CO2 emissions were categorized. Discoveries show FD’s substitution effect worsens ES, while the income effect promotes environmental quality in the country. As Musa et al. (2021) found, the environmental performance of the nations they studied was positively linked to financial development (FD). Szymczyk et al. (2021) examined the FD-ES link in OECD nations, and FD worked to reduce emissions around the world. According to Hayat et al. (2021) two-step system GMM estimates, FD decreased the countries of concern’s effective standard deviation (ES). Environmental quality in the country degraded due to FD, Akinsola et al. (2021). Sun et al. (2020), FD harms ES across nations. In China, Zahoor et al. (2021) found that FD boosted economic growth at the expense of ES, which is consistent with previous research. DARDL estimations that FD damaged ES in the nation were examined (Khan et al., 2020).
Green Innovation and CO2 Emissions
Murad et al. (2019) determined that the CO2 emissions reduced due to green technology advancements that focus on transportation, building and farming. According to Khan et al. (2021), growth in the population directly impacts energy consumption, which in turn has a direct impact on fossil fuel byproducts. Khan et al. (2020) financial annexation, foreign direct investment (FDI), and the use of oil speeding up environmental pollution rate. In addition, the use of dirty energy in manufacturing, industry, and other economic activities is stimulated by inclusive financial services, leading to additional emissions (Zaidi et al., 2021). Ecological pollution is outer conduct in modern creation and utilization, and contamination discharges conduct dictated by market systems is ineffective. Using the environmental innovation patent as an indicator of China’s level of green innovation development, Sun et al. (2007) were able to assess the regional disparities between natural mechanical advancement levels in China using the core part inquiry technique. Antonioli and Mazzanti (2017) described that a green economy and green industry might exceed automatic progress, with both good and bad effects on the environment pollution. Green development is an outstanding mechanical improvement that may reduce pollution discharges, expedite asset utilization, and endeavour to manage natural resources (Braun and Wield, 1994). An important part of economic growth is expanding the financial sector and institutions in a country through financial annexation (Le et al., 2020). Companies may be compelled by environmental agreements to reduce their usage of low-warming-value and high-contamination assets and switch to environmentally-friendly electricity, which aids in energy conservation and reduces discharges (Sohag et al., 2015). Far-reaching analysis techniques are being used to evaluate a particular water environmental development pilot city (Tian et al., 2021). According to Li and Du (2021), the spatial overflow effect of natural guidelines on green development proficiency is based on Chinese city-level information.
Foreign Direct Investment Impact and CO2 Emissions
One of the most important and often-examined aspects of foreign direct investment (FDI) is the possibility of unaffordable climate-related expenditures (Zhu et al., 2016). Lee (2009) used the ARDL bound test to investigate the link between FDI and Malaysia’s fossil fuel byproducts. Internal foreign direct investment (IFDI) may harm the environment if it occurs simultaneously as a rise in natural resource extraction (Cole et al., 2011). The EKC was authorized for use as an example since Hitam and Borhan (2012) found that FDI has a detrimental impact on fossil fuel byproducts. According to, foreign direct investment (FDI) stimulates trendsetting technologies and creates a clean environment. For environmental change strategies to be successful, we must focus on reducing climate-warming emissions by increasing renewable energy, energy efficiency, and foreign direct investment (FDI). Chinese researchers have discovered a favourable correlation between the monetary turn of events and energy consumption, as measured by the proportion of credit in economic organizations to GDP and the fraction of FDI (Xu, 2012).
Research Methodology
Data Collection Procedure
For the convenience of 450 firms’ statistical data from 1980 to 2019 related to financial annexation index (FAI), economic development (FD), foreign direct investment (FDI) collected from China Statistical Yearbook, China Stock Market & Accounting Research Database (CSMAR), and Shenzhen stock exchange. The environmental sustainability (ES), Green Innovation (GI), energy sources are collected from China Statistical Yearbook on Environment, China Statistical Yearbook on Science and Technology and China Energy Statistical Yearbook. FDI and ES information advantages were further from their mean characteristics because they had big standard deviations than were CO2 emissions, FA, PU, and ES information advantages. In addition, the flow of lnCO2 skew to the right. The left tail of the variable’s dispersion was longer and included a large portion of the variable’s information. Although the distributions of various variables were slanted to the left, a greater part of their information was on the right, and the left tail of their conveyances was lengthier. In addition, there was no evidence of collinearity between the indicators according to the FA and resistance tests. Long overdue, the CO2 emissions of FA, ES, FDI, and FD were categorically linked to the CO2 emissions.
Model Specifications and Econometric Descriptions
Human and industrial activity is the primary source of climate change worldwide. Greenhouse gas emissions. China’s carbon-intensive activities are a major contributor to this scourge. To our knowledge, there has been no study that specifically examined the link between financial annexation (FA) and environmental sustainability (ES) in China, despite the numerous studies on ES in the country. Because of this, an investigation into the relationship between FI and ES was deemed necessary to come up with recommendations for improving environmental quality in the country. Here is a function that was presented to achieve that goal:
Environmental sustainability (ES) is the explained variable epitomized by CO2 emissions, while the financial annexation index (FAI) is the main predictor of concern. Also, foreign direct investment (FDI) was incorporated into the function for China. Finally, financial development (FD), Green innovation (GI) and environment sustainability (ES) were included in the function as control variables to help mitigate omitted variable bias. The above process is expressed in a linear form as;
In equation-2, β1, β2, β3, β4 and β5 are the parameters of FAI, FDI, FD, GI and ES respectively, while t symbolizes the studied country. also, a0 is the constant term, while μt represents the stochastic error term. Ruzi et al. (2021), natural logarithm takes on both sides of equation-2 resulting in the ensuing specification;
Where lnCO2, lnFAI, lnFDI, lnFD, lnGI and lnES are the log conversions of the output and the input variables correspondingly, and all earlier definitions still hold. FAI was incorporated into the analysis in line with Renzhi and Baek (2020). The coefficient of FAI was expected to be greater than zero
Econometric Metaphors
Because certain econometric methods require variables to be integrated of a certain order before they could be employed, our exploration primarily examined the integration order of the series via the DF-GLS, PP, ADF and the KPSS unit root tests. Secondly, the ARDL bound test alongside the Johansen test was conducted to assess the cointegration attributes of the series. Following Pesaran et al. (2001), the model developed for the bound test was specified as;
Where ϕ0 is the intercept and ∆ denotes the change operator. Also, t − 1 symbolizes the lags selected based on the AIC, while the parameters to be estimated are represented by ϕ and β. Under the bond test, the null and the alternative hypothesis are expressed as;
The rule of the bound test is that if the upper determined value is lesser than the F-value computed, then the series are co-integrated. Contrastingly, if the lower bound value supersedes the F-statistic, the series are not co-integrated. Finally, if the computed F-statistic lies within the lower and the upper bounds, the decision becomes inconclusive. To assess the vigorousness of the bound test, the Johansen cointegration test was also conducted. This test, named after Søren Johansen, allows more than one cointegration association amidst series and is more applicable than other tests based on only one cointegration relationship. Another key feature of this test is that it treats every variable as an endogenous variable. This test comprises two tests, namely the maximum Eigenvalue test and trace test. The hypothesis of the trace test is stated as;
Where K0 is set to zero to examine will not validate the null hypothesis, and if not validated, Co-integration exists amidst the series. The maximum Eigenvalue test hypothesis, on the other hand, is stated as;
There is only one possibility for the series to be stationary in the above if K = K0 and the null hypothesis is not validated. There are M probable linear countries if K0 = m − 1, and the null hypothesis is rejected. After the tests for cointegration, we then estimated the short and the long-run parameters of the series via the dynamic ARDL (DARDL) estimator of Jordan and Philips (2018) and the ARDL estimator. Notably, the ARDL technique was employed to test the vigorousness of the DARDL estimator. The ARDL approach is beneficial because it performs better for small sample-sized datasets and also accommodates very large general lag structures (Pesaran et al., 2001) and the ARDL model formulated to explore the long-run affiliation amidst the series was expressed as;
Where σ symbolizes the long-run variance and t−1 are the lags chosen via the AIC. For the short-run ARDL model, developed the following specification.
The short-run variance is denoted by σ and IRSt−1 is the error correction term with ϕ being its coefficient. ARDL models are commonly used to investigate the relationship between variables, but their results can be difficult to understand and interpret because they generally contain multiple or differential lags. Also, sampling uncertainty could be high if the rate of convergence towards the long-run relation is slow and the time dimension is not long enough. The DARD can also plot the graphs of the positive and negative influences of predictors on the explained variable (Jordan and Philips, 2018. There should also be a cointegration association between the variables of concern (Jordan and Philips, 2018). The DARDL technique uses up to 5,000 simulations and is specified by Sarkodie et al. (2019) as;
In Eq. 13, Δ(y) denotes the change in the output variable, α0 is the intercept, t − 1 represents the lag of all predictors, p and q symbolize the lags of the first difference of the response variable and the regressors respectively, Δ is the operator of change, and u is the stochastic error term. Concerning Equation #13, developed the ensuing DARDL error correction specification to explore the connotation amidst the series;
Where Δ and α0 denote, the difference operator is the intercept. Also, θ′S and β′S are the long-run and the short-run coefficients to be estimated respectively. Finally, u is the residual term at time t. Therefore following Qamruzzaman and Jianguo (2020), the VECM of, which generates reliable results in time series analysis, was adopted to unearth the causations amidst the series. In exploring the causal connections amidst the series, utilized the following dynamic error correction models;
A vital attribute is lacking by the conventional ARDL technique. According to Jordan and Philips (2018), the DARDL approach applies if the criterion variable has an I(1) integration order. The predictors may, however, possess an I(1) or I(0) integration order or both but must not exceed demand I(1).
The parameter of the IRS measures the adjustment speed from the disequilibrium to the equilibrium association and usually falls within the range of -1 to 0 (Khan et al., 2020). According to Khan et al. (2020), the disequilibrium or the volatility is adjusted when the error correction coefficient becomes negative and significant.
Also, serial correlations in the error terms were assessed via the Breusch-Godfrey LM test, while the Ramsey RESET test was performed to check for model accuracy. According to Qin et al. (2021), regression estimators do not comment on causal associations amidst series.
Moreover, if a dataset has a random trend, the dynamics in an ARDL model will approximate this trend instead of modelling the true dynamics (Pesaran et al., 2001).
Various diagnostic tests were conducted to authenticate the validity of the model. In line with Khan et al. (2020), the ARCH and the Breusch-Pagan-Godfrey trials assessed heteroscedasticity in the residual terms while undertaking the Jarque-Bera test to check for residual normality.
Jordan and Philips (2018) detected loopholes in the ARDL technique and came out with the DARDL approach to improve the situation. Aside from estimating the long and the short-run connections amidst series.
In the equations above,
Results and Discussions
Table 1 shows the descriptive statistics for the variables. ES had the greatest average value in the table, whereas CO2 emissions had the lowest. Data values for CO2, FAI, FD, GI were all close to their mean values, whereas FDI and ES data values were distant from their mean values due to substantial standard deviations in these data sets. LnCO2 absorptions were also found to be biased to the right. A big portion of the variable’s data was on the left, while the tails of its distribution were longer on the right side.
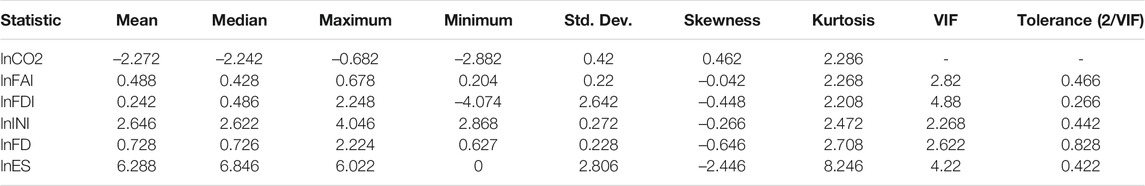
TABLE 1. Descriptive statistics.
Their data was more likely to be found on the right side of the distribution, and they had a longer left tail than the other variables. Additional data showed that the dataset of ES had larger tails than the normal distribution. In contrast, the dataset of the other variables had lighter tails than the normal distribution due to their kurtosis values being less than and shows in correlation analysis in Table 2 as follows.
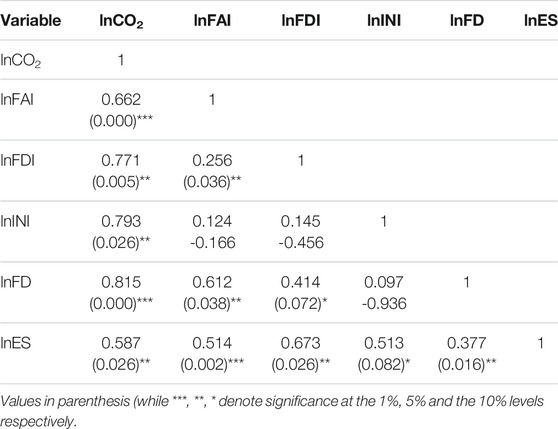
TABLE 2. Correlational analysis.
Government projects supported by green money are large-scale speculations with more risks and more complicated framework cooperation, making it difficult to achieve extraordinary returns on green investment, as shown in Table 3. Positive external conditions and low project profitability increase investment risk in promoting green growth of the substance sector. The government’s role is to reduce the expense of consistency for businesses while defining natural standards. According to one perspective, the goal of the biological approach should be to keep up with the actions of the assembling industry by further creating frameworks for ecological data disclosure and honest management.
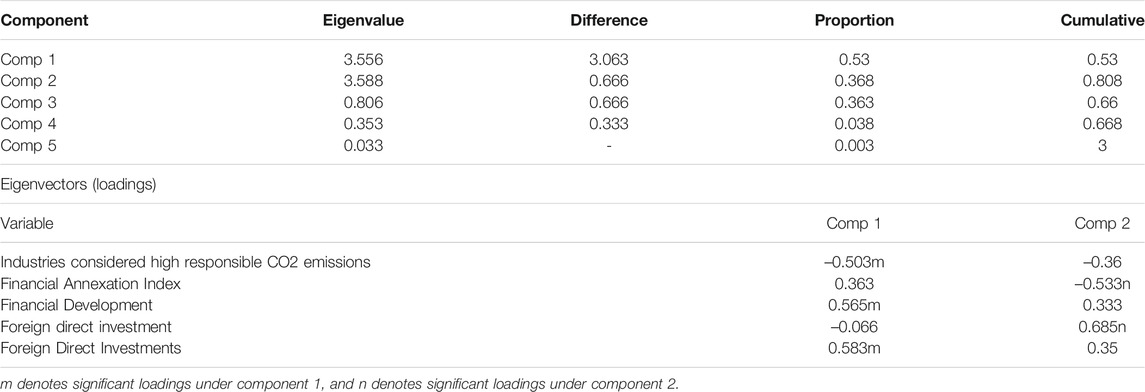
TABLE 3. Principal components analysis on financial Annexation index (FAI).
Unit Root and Cointegration Tests Results
Many statistical tests and models in time series analysis rely on static data. The DF-GLS, PP, KPSS and ADF unit root tests were used to get an idea of the series’ fixed qualities. The DARDL estimator may be used because, as shown in Table 4, all strings are stationary at the order I(1). A shift in time did not alter the form of the distributions of the variables after their first differentiation. This revelation is in agreement with Sun et al. (2021) investigations. The series may have a cointegration relationship if they have an integrated I order (1).
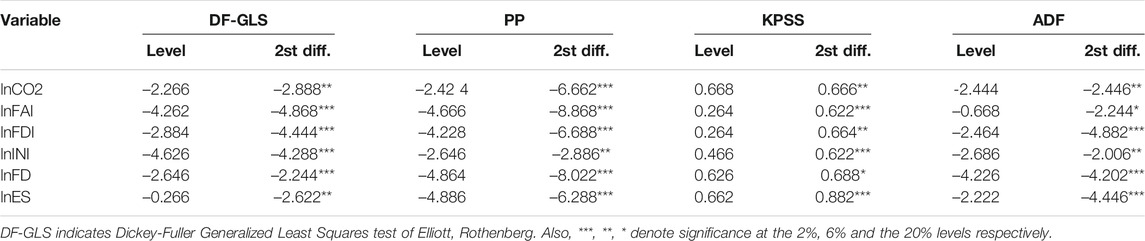
TABLE 4. Unit root tests results.
Thus, the tests in Table 5 were used to examine the cointegration characteristics of the series in the second stage of the experiment. The F-test and t-test values were significantly higher than the upper boundaries, confirmed by significant approximate p-values. The series had a long-term cointegration relationship.
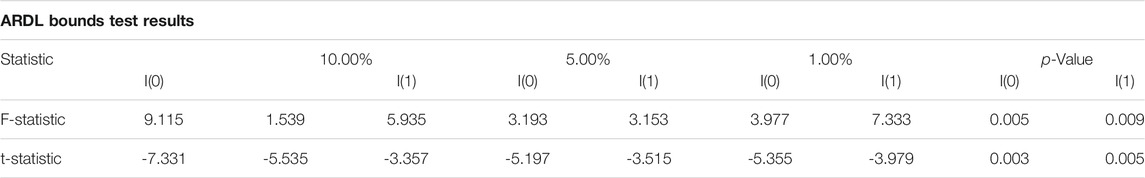
TABLE 5. Cointegration tests results.
Estimates from the Johansen test in Table 6 compared to the boundaries test to ensure that the results were accurate. All the cointegration equations To establish this long-term relationship between variables were statistically significant. Following this discovery, the next step was to investigate the predictors’ parameters parallel the results of Musah et al. (2020).
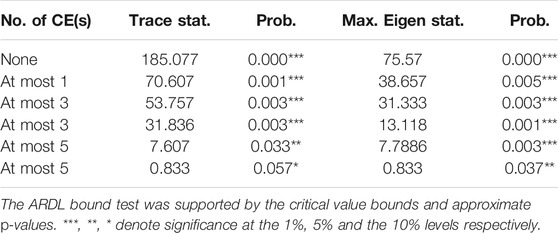
TABLE 6. Johansen cointegration test results.
Dynamic ARDL Recreations Results
To estimate the elasticity of regressors the cointegration of the series must be confirmed. As a third stage, the researchers used the DARDL estimator to examine the marginal effects of the predictors on the criterion variable. Table 7 shows that FAI’s growing carbon emissions in China affected ES. To put it another way, a one % increase in FAI impacted the long-term and short-term ES of 6.284 and 4.953%, respectively. Accessible financial services may boost industrial and manufacturing activity, which leads to an increase in emissions. Economic growth may lead to a rise in carbon dioxide emissions, according to Zhao et al. (2021). Findings suggest that financial inclusion allowed people to obtain low-cost financing for polluting household equipment, which eventually degraded the country’s environmental quality. Companies could get low-cost facilities to purchase energy-intensive equipment and machinery, which resulted in more emissions because of financial inclusiveness. Financial inclusiveness may have led to a rise in the nation’s gross fixed capital formation, resulting in increased energy consumption and an increase in the nation’s effluents. These results differ from previous research, which found an inverted U-shaped relationship between FA and carbon effluents in 103 countries. Depending on the stage of FA, its impact on the outflow of carbon varies, according to Renzhi and Baek (2020).
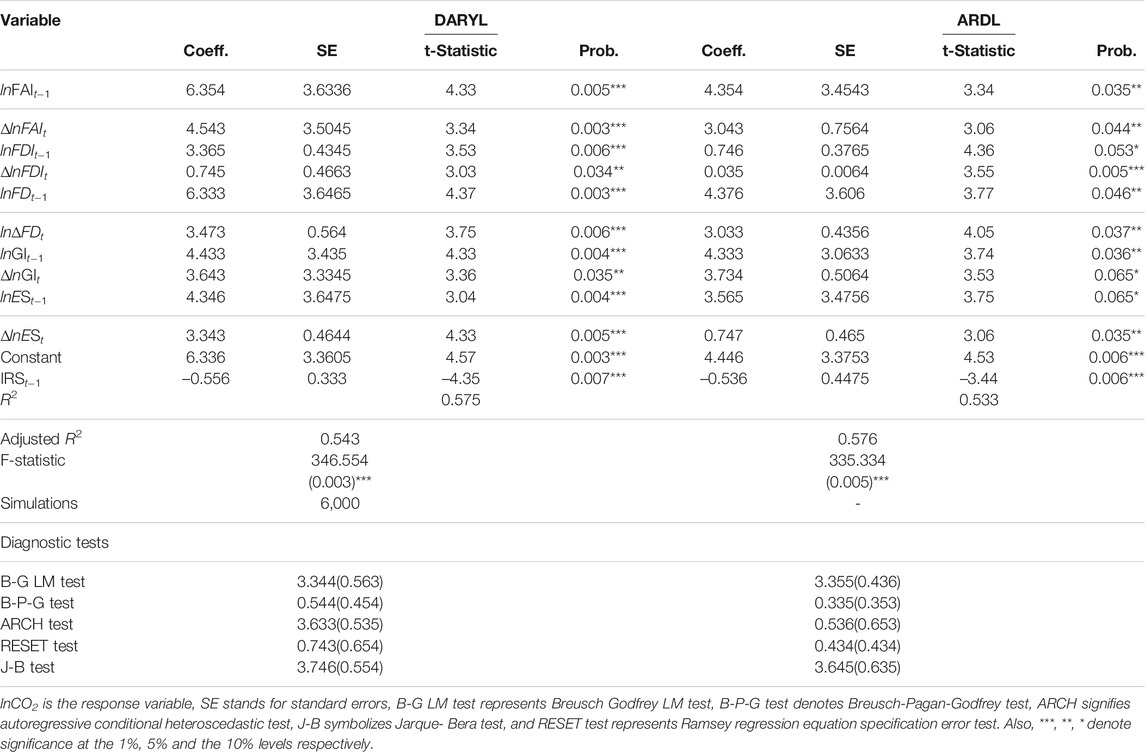
TABLE 7. DARDL and ARDL estimation results.
Furthermore, FDI contributed to China’s environmental damage. For every 1% increase in FDI, the country’s environment was worsened by 1.167 and 0.937% in both the long and short term (PHH). To escape the costs of rigorous environmental restrictions, polluting companies, according to the PHH, relocate their activities to jurisdictions with low ecological standards. Because of this, China’s environmental standards were inadequate, which enticed high-polluting firms to set up shop in China. It appears that FDI inflows boosted economic activity in the country, which led to an increase in the use of polluting energy sources and, as a result, emissions. FDI is critical to China’s economic survival; however, more environmental laws are needed to prevent toxic organizations from other countries. Incoming foreign direct investment (FDI) should be tied to environmentally friendly new technology and manufacturing methods. According to Gyamfi et al. (2021), the study’s findings support the halo theory. Halo theory claims that FDI inflows are linked to green technology, managerial skills, and high manufacturing standards that increase ES in the host nations invested. As a result, fluctuations in FDI can lead to reductions in emissions in the countries.
DARDL and ARDL Estimation Results
Furthermore, FD was unfriendly to China’s ecology. A 5% increase in foreign direct investment (FDI) impacts the country’s environment by 5.221% in the long term and 1.491% in the near term. The study suggests that China’s openness to trade with its allies has weakened trade-related environmental regulations. Carbon-intensive goods were imported, which led to increased emissions across the country. China’s economy grew in tandem with its increased commerce with other countries, increasing greenhouse gas emissions due to the scale effect exploratory studies of the data; in China, GI also aggravated ES. When all else is equal, a 1% increase in GI reduces the country’s environment by 5.532% over the long term and 3.721% over the short time. Human activities are largely to blame for growing pollution levels across all economies. Thus this revelation comes as no surprise. China’s GI rate was expected to climb, which would lead to an increase in pollution in the environment. Increased demand for fossil fuels has also contributed to environmental contamination in the country due to the growing rate of genetically modified organisms (GI). The long and short-term effects of a 1% increase in ES were 4.257 and 2.252%, respectively, when all other factors remained constant.
According to these findings, the nation’s industrial and commercial activity was powered by carbon emissions through dirty energy usage. China’s expanding environmental concerns necessitate the use of renewable energy sources deemed favourable to health and the environment. In addition to boosting the country’s economic growth, a shift to clean energy consumption might also help the country’s transition to a more sustainable economy. Renewable energy will help the country tackle climate change, but Lag error correction (IRSt-1) was also negative and substantial, as predicted. The first-1 score of -0.886 indicates that any divergence from long-run equilibrium was recovered at a rate of 88.6%. ARCH and Breusch-Pagan-Godfrey tests found that the residuals were homoscedastic. In addition, the Ramsey RESET test proved that the model was well-specified. Adjusted R2 indicates that 84.1% of the variation in ES can be assigned to the predictors, while the significant F-value reflects the model’s ability to explain the data accurately and efficiently. An enhanced version of the ARDL estimator, DARDL, has been developed in Table 7.
As a result, estimations of the ARDL approach were also examined for robustness purposes. In both the long and short term, FAI harmed ES. Also, FDI, FD, GI, and ES harm the country’s environmental health and the R2 value; the first-1 was statistically insignificant at the 1% level, whereas the regressions accounted for a considerable portion of the variance in the response variable. In addition, the F-statistic value using this technique indicated that the model had a very high predictive potential and the elasticity of the predictors under the two estimators varied in terms of weight and significance. Still, they were similar in terms of a sign. Because of this, it is clear that the findings are reliable and may be used to make policy choices. Table 8 shows the diagnostic tests used to verify the model’s validity.
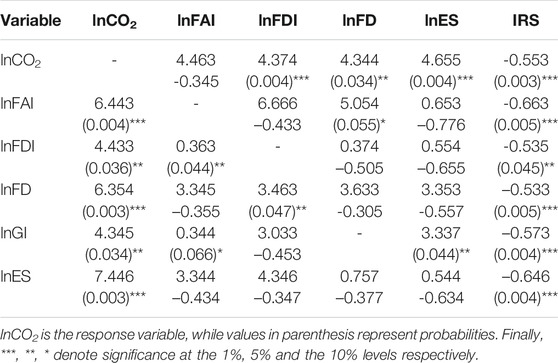
TABLE 8. Results of pairwise granger causality tests.
According to Qin et al. (2021), Relapse examinations do not provide granular data on the causative link in the middle of a series. Since all the IRS’s in Table 8 were negative and large, there was a long-term causal link between the series. FAI was shown to directly correlate with natural contamination in the short-term causation between the information and the result components. The inclusion of money into the economy boosted consumer interest, increasing utilization-based emissions. When enterprises could access cash flow, they used high-contaminating energy that weakened the country’s environmental quality, directly resulting from financial incorporation. It Showed the FDI and natural debasement to have a two-way concision. FDI inflows did not advance ES in China this correlation, which suggests that the series were unified, such that a flood in one variable triggered an increase in the other. As a result, not professionals’ natural laws are strictly controlled to attract FDI convergences with environmentally friendly technologies.
Furthermore, FD contaminated the country’s natural resources. China exchanged carbon-concentrated goods that harmed the country’s environmental sustainability (ES), and the expansion of dirty energy sources accelerated biological pollution in this country. China to switch to efficient power sources that have been proven to be environmentally friendly and the DARDL assessor that it can automatically draw the diagrams of the positive and negative consequences of regressors on the regressed individual.
Conclusion
This research examined the relationship between economic development, environmental progress, and CO2 emissions from 1980 to 2019. The study applied the ARDL and Dynamic ARDL methods to the long-term relationship between the components. Environmentally friendly green innovation was negatively impacted by high energy costs, which found that the country’s financial annexation and financial development had a substantial influence on CO2 emissions. The Chinese economy appears untouched by financial development or improvements in CO2 emissions. As the availability of alternative energy sources, a person’s ability to pay significantly impacts the type of energy. Renewable energy sources have a favourable environmental impact and considering the positive influence that economic advancement is having on environmentally friendly energy sources, policymakers of China. The effect of monetary rise on sustainable power usage varies by region and nation. The link between financial advancement and sustainable power utilization remains an important issue of debate in theoretical and experimental investigations. According to the contaminated safe house idea, foreign direct investment (FDI) damaged the country’s inherent character, and the country’s GI and ES methods should work in concert with one another.
Additionally, implementing energy conservation measures to help reduce the country’s increasing emissions levels will be advantageous. The government should incorporate FA, FDI, FD, GI, and GI into its efforts to reduce emissions of fossil fuel byproducts. Another factor to consider is that monetary improvement might enhance the creative movement and usefulness of financial substances, lower the use of conventional energy, and generate a desire for new forms of alternative energy.
Future Suggestions
To conclude, it is time to embrace mechanical advancements related to reducing the environmental pollution. One of the major limitations in this inquiry is the lack of easy access to data. The data for some of the variables didn’t go back far enough. In the end, the dataset’s missing data is filled in using the information interjection and extrapolation approach. Consequently, comparison studies might be conducted in the future to verify the validity of the findings of this analysis.
Data Availability Statement
The original contributions presented in the study are included in the article/supplementary material, further inquiries can be directed to the corresponding authors.
Author Contributions
YS: Conceptualization, Methodology, Writing–review and editing. YL: Writing–original draft YW:Visualization, Investigation. QB: Supervision, Writing–review and editing.
Conflict of Interest
The authors declare that the research was conducted in the absence of any commercial or financial relationships that could be construed as a potential conflict of interest.
Publisher’s Note
All claims expressed in this article are solely those of the authors and do not necessarily represent those of their affiliated organizations, or those of the publisher, the editors and the reviewers. Any product that may be evaluated in this article, or claim that may be made by its manufacturer, is not guaranteed or endorsed by the publisher.
Acknowledgments
The authors acknowledge the financial supports from the Social Science Fund of Zhejiang, China (22NDJC169YB).
Abbreviations
FA, financial annexation; FAI, financial annexation index; FD, financial development; ES, environmental sustainability; CO2 emissions, carbon dioxide emissions; GI, green innovation; FD, financial development; FDI, foreign direct investments; GI, green innovation; DARDL, dynamic autoregressive distributed lag; ARDL, autoregressive distributed lag; VECM, vector error correction model; PHH, pollution haven hypothesis; AMG, augmented mean group; CS-ARDL, cross-sectional autoregressive distributed lag; IRS, inaccuracy rectification stint; ADF, augmented Dickey-Fuller; WDI, world development indicators; DOLS, dynamic ordinary least squares.
References
Akinsola, G. D., Awosusi, A. A., Kirikkaleli, D., Umarbeyli, S., Adeshola, I., and Adebayo, T. S. (2021). Ecological Footprint, Public-Private Partnership Investment in Energy, and Financial Development in Brazil: a Gradual Shift Causality Approach. Environ. Sci. Pollut. Res. 29, 10077–10090. doi:10.1007/s11356-021-15791-5
Antonioli, D., and Mazzanti, M. (2017). Towards a green Economy through Innovations: The Role of Trade union Involvement. Ecol. Econ. 131, 286–299. doi:10.1016/j.ecolecon.2016.09.003
Braun, E., and Wield, D. (1994). Regulation as a Means for the Social Control of Technology. Techn. Anal. Strateg. Manage. 6 (3), 259–272. doi:10.1080/09537329408524171
Cole, M. A., Elliott, R. J. R., and Zhang, J. (2011). Growth, Foreign Direct Investment, and the Environment: Evidence from Chinese Cities. J. Reg. Sci. 51 (1), 121–138. doi:10.1111/j.1467-9787.2010.00674.x
Fernando, Y., and Wah, W. X. (2017). The Impact of Eco-Innovation Drivers on Environmental Performance: Empirical Results from the green Technology Sector in Malaysia. Sustainable Prod. Consumption 12, 27–43. doi:10.1016/j.spc.2017.05.002
Gyamfi, B., Adedoyin, F., Bein, M., Bekun, F., and Agozie, D. (2021). The Anthropogenic Consequences of Energy Consumption in E7 Economies: Juxtaposing Roles of Renewable, Coal, Nuclear, Oil and Gas Energy: Evidence From Panel Quantile Method. J. Clean. Prod. 295, 126373.
Hitam, M. B., and Borhan, H. B. (2012). FDI, Growth and the Environment: Impact on Quality of Life in Malaysia. Proced. - Soc. Behav. Sci. 50 (50), 333–342. doi:10.1016/j.sbspro.2012.08.038
Jalil, A., and Feridun, M. (2011). The Impact of Growth, Energy and Financial Development on the Environment in China: A Cointegration Analysis. Energ. Econ. 33, 284–291. doi:10.1016/j.eneco.2010.10.003
Ji, X., and Chen, B. (2017). Assessing the Energy-Saving Effect of Urbanization in China Based on Stochastic Impacts by Regression on Population, Affluence and Technology (STIRPAT) Model. J. Clean. Prod. 163, 306–S314. doi:10.1016/j.jclepro.2015.12.002
Jordan, S., and Philips, A. Q. (2018). Cointegration Testing and Dynamic Simulations of Autoregressive Distributed Lag Models. Stata J. 18 (4), 902–923. doi:10.1177/1536867X1801800409
Khan, H., Weili, L., and Khan, I. (2021). Institutional Quality, Financial Development and the Influence of Environmental Factors on Carbon Emissions: Evidence from a Global Perspective. Environ. Sci. Pollut. Res. 29, 13356–13368. doi:10.1007/s11356-021-16626-z
Khan, I., Hou, F., and Le, H. P. (2021). The Impact of Natural Resources, Energy Consumption, and Population Growth on Environmental Quality: Fresh Evidence from the United States of America. Sci. Total Environ. 754, 142222. doi:10.1016/j.scitotenv.2020.142222
Khan, M. I., Teng, J.-Z., Khan, M. K., Jadoon, A. U., and Khan, M. F. (2021). The Impact of Oil Prices on Stock Market Development in Pakistan: Evidence with a Novel Dynamic Simulated ARDL Approach. Resour. Pol. 70, 101899. doi:10.1016/j.resourpol.2020.101899
Le, T.-H., Le, H.-C., and Taghizadeh-Hesary, F. (2020). Does Financial Inclusion Impact CO2 Emissions? Evidence from Asia. Finance Res. Lett. 34, 101451. doi:10.1016/j.frl.2020.101451
Lee, C. G. (2009). Foreign Direct Investment, Pollution and Economic Growth: Evidence from Malaysia. Appl. Econ. 41, 1709–1716. doi:10.1080/00036840701564376
Li, J., and Du, Y. (2021). Spatial Effect of Environmental Regulation on green Innovation Efficiency: Evidence from Prefectural-Level Cities in China. J. Clean. Prod. 286, 125032. doi:10.1016/j.jclepro.2020.125032
Maity, S. (2019). Financial Inclusion and Multidimensional Poverty Reduction through Self-Help-Group-Led Microfinance: Evidence from Bodoland, Assam, India. Enterprise Develop. Microfinance 30 (3), 152–173. doi:10.3362/1755-1986.18-00012
Murad, M. W., Alam, M. M., Noman, A. H. M., and Ozturk, I. (2019). Dynamics of Technological Innovation, Energy Consumption, Energy price and Economic Growth in Denmark. Environ. Prog. Sust. Energ. 38 (1), 22–29. doi:10.1002/ep.12905
Musa, M. S., Jelilov, G., Iorember, P. T., and Usman, O. (2021). Effects of Tourism, Financial Development, and Renewable Energy on Environmental Performance in EU-28: Does Institutional Quality Matter. Environ. Sci. Pollut. Res. 28, 53328–53339. doi:10.1007/s11356-021-14450-z
Paris COP21 (2015). “(FCCC/CP/2015/10/Add.1) the United Nations Convention on Climate Change Conference of the Parties (COP 21),” in Report of the Conference of the Parties in its Twenty-first Session held in Paris from 30th November to 13th December; 2015.
Pesaran, M., Shin, Y., and Smith, R. (2001). Bounds Testing Approaches to the Analysis of Level Relationship. J. Appl. Econom. 16 (1), 289–326.
Qamruzzaman, M., and Jianguo, W. (2020). The Asymmetric Relationship between Financial Development, Trade Openness, Foreign Capital Flows, and Renewable Energy Consumption: Fresh Evidence from Panel NARDL Investigation. Renew. Energ. 159, 827–842. doi:10.1016/j.renene.2020.06.069
Qin, L., Raheem, S., Murshed, M., Miao, X., Khan, Z., and Kirikkaleli, D. (2021). Does Financial Inclusion Limit Carbon Dioxide Emissions? Analyzing the Role of Globalization and Renewable Electricity Output. Sust. Develop. 29, 1138–1154. doi:10.1002/sd.2208
Rahman, M. M., and Vu, X.-B. (2021). Are Energy Consumption, Population Density and Exports Causing Environmental Damage in China? Autoregressive Distributed Lag and Vector Error Correction Model approaches. Sustainability 13 (3749), 1–19.
Renzhi, N., and Baek, Y. J. (2020). Can Financial Inclusion Be an Effective Mitigation Measure? Evidence from Panel Data Analysis of the Environmental Kuznets Curve. Finance Res. Lett. 37, 101725. doi:10.1016/j.frl.2020.101725
Ruzi, S., Zalamea, P., Roch, D., Achury, R., Dalling, J., and Suarez, A. (2021). Can Variation in Seed Removal Patterns of Neotropical Pioneer Tree Species be Explained by Local Ant Community Composition?. Biotropica (53), 619–631.
Sarkodie, S. A., Strezov, V., Weldekidan, H., Asamoah, E. F., Owusu, P. A., and Doyi, I. N. Y. (2019). Environmental Sustainability Assessment Using Dynamic Autoregressive-Distributed Lag Simulations–Nexus Between Greenhouse Gas Emissions, Biomass Energy, Food and Economic Growth. Sci. Total Environ. 668, 318–322. doi:10.1016/j.scitotenv.2019.02.432
Sohag, K., Begum, R. A., Abdullah, S. M. S., and Jaafar, M. (2015). Dynamics of Energy Use, Technological Innovation, Economic Growth and Trade Openness in Malaysia. Energy 90, 1497–1507. doi:10.1016/j.energy.2015.06.101
Sun, H., Edziah, B. K., Kporsu, A. K., Sarkodie, S. A., and Taghizadeh-Hesary, F. (2021). Energy Efficiency: The Role of Technological Innovation and Knowledge Spillover. Technol. Forecast. Soc. Change, 120659. doi:10.1016/j.techfore.2021.120659
Sun, H., Kporsu, A. K., Taghizadeh-Hesary, F., and Edziah, B. K. (2021). Estimating Environmental Efficiency and Convergence: 1980 to 2016. Energy, 118224. doi:10.1016/j.energy.2020.118224
Sun, Y., Duru, O. A., Razzaq, A., and Dinca, M. S. (2021). The Asymmetric Effect Eco-Innovation and Tourism towards Carbon Neutrality Target in Turkey. J. Environ. Manage. 299, 113653. doi:10.1016/j.jenvman.2021.113653
Sun, Y. M., Lv, Y. L., Wang, T. Y., Ma, L., and Xing, Y. (2007). Spatial Discrepancy in Patent-Based Innovation of Environmental Technologies. Chin. J. Environ. Eng. 1 (03), 123–129.
Sun, Y., and Razzaq, A. (2022). Composite Fiscal Decentralization and Green Innovation: Imperative Strategy for Institutional Reforms and Sustainable Development in OECD Countries. J. Sustain. Dev., 1–14. doi:10.1002/sd.2292
Szymczyk, K., Şahin, D., Bağcı, H., and Kaygın, C. Y. (2021). The Effect of Energy Usage, Economic Growth, and Financial Development on CO2 Emission Management: an Analysis of OECD Countries with a High Environmental Performance index. Energies 14, 4671. doi:10.3390/en14154671
Tian, P., Wu, H., Yang, T., Jiang, F., Zhang, W., Zhu, Z., et al. (2021). Evaluation of Urban Water Ecological Civilization: A Case Study of Three Urban Agglomerations in the Yangtze River Economic Belt, China. Ecol. Indicators 123, 107351. doi:10.1016/j.ecolind.2021.107351
Usman, M., Makhdum, M. S. A., and Kousar, R. (2021). Does Financial Inclusion, Renewable and Non-renewable Energy Utilization Accelerate Ecological Footprints and Economic Growth? Fresh Evidence from 15 Highest Emitting Countries. Sust. Cities Soc. 65, 102590. doi:10.1016/j.scs.2020.102590
Xu, S. (2012). The Impact of Financial Development on Energy Consumption in China: Based on SYS-GMM Estimation. Adv. Mater. Res. 524–527, 2977–2981. doi:10.4028/www.scientific.net/amr.524-527.2977
Yao, S., and Zhang, S. (2021). Energy Mix, Financial Development, and Carbon Emissions in China: a Directed Technical Change Perspective. Environ. Sci. Pollut. Res. 28, 62959–62974. doi:10.1007/s11356-021-15186-6
Zaidi, S. A. H., Hussain, M., and Uz Zaman, Q. (2021). Dynamic Linkages between Financial Inclusion and Carbon Emissions: Evidence from Selected OECD Countries. Resour. Environ. Sustainability 4, 100022. doi:10.1016/j.resenv.2021.100022
Zahoor, N., Donbesuur, F., and Nwoba, A. C. (2001). Regional Expansion of Emerging Market SMEs: The Roles of Domestic Market Environmental Uncertainty and International Alliance Partner Diversity. Asia Pac. J. Manag. doi:10.1007/s10490-021-09799-1
Zeeshan, M., Han, J., Rehman, A., Ullah, I., and Alam Afridi, F. E. (2021). Exploring Determinants of Financial System and Environmental Quality in High-Income Developed Countries of the World: the Demonstration of Robust Penal Data Estimation Techniques. Environ. Sci. Pollut. Res. 28, 61665–61680. doi:10.1007/s11356-021-15105-9
Zeng, S. X., Tam, C. M., Tam, V. W. Y., and Deng, Z. M. (2005). Towards Implementation of ISO 14001 Environmental Management Systems in Selected Industries in China. J. Clean. Prod. 13 (7), 645–656. doi:10.1016/j.jclepro.2003.12.009
Zhang, K.-m., and Wen, Z.-g. (2008). Review and Challenges of Policies of Environmental protection and Sustainable Development in China. J. Environ. Manage. 88 (4), 1249–1261. doi:10.1016/j.jenvman.2007.06.019
Zhang, Z., Chen, Y.-H., and Wang, C.-M. (2021). Can CO2 Emission Reduction and Economic Growth Be Compatible? Evidence From China. Front. Energy Res. 9, 693767. doi:10.3389/fenrg.2021.693767
Keywords: financial annexation, green innovation, carbon neutrality, environmental quality, dynamic ARDL
Citation: Sun Y, Li Y, Wang Y and Bao Q (2022) Financial Annexation, Green Innovation and Carbon Neutrality in China. Front. Environ. Sci. 10:831853. doi: 10.3389/fenvs.2022.831853
Received: 09 December 2021; Accepted: 28 January 2022;
Published: 08 March 2022.
Edited by:
Huaping Sun, Jiangsu University, ChinaReviewed by:
Andrew Adewale Alola, Istanbul University, TurkeyAbdul Rauf, Nanjing University of Information Science and Technology, China
Tadiwanashe Muganyi, Shanghai University, China
Copyright © 2022 Sun, Li, Wang and Bao. This is an open-access article distributed under the terms of the Creative Commons Attribution License (CC BY). The use, distribution or reproduction in other forums is permitted, provided the original author(s) and the copyright owner(s) are credited and that the original publication in this journal is cited, in accordance with accepted academic practice. No use, distribution or reproduction is permitted which does not comply with these terms.
*Correspondence: Ying Li, eWluZ3ppamoyMDA2QDEyNi5jb20=; Yujing Wang, d3lqNzE0aXZ5QDEyNi5jb20=; Qun Bao, YmFvcXVuQG5hbmthaS5lZHUuY24=