 Xiyuan Deng
 Guoqing Wang
 Haofang Yan4
- 1State Key Laboratory of Hydrology-Water Resources and Hydraulic Engineering, Nanjing Hydraulic Research Institute, Nanjing, China
- 2Research Center for Climate Change, Nanjing, China
- 3Yangtze Institute for Conservation and Development, Nanjing, China
- 4Research Centre of Fluid Machinery Engineering and Technology, Jiangsu University, Zhenjiang, China
Agricultural drought disaster is a major natural disaster affecting economic and social development. It is of significance to investigate the spatial–temporal pattern and the dominant influence of natural and human factors on agricultural drought disasters for drought hazard relief. In this study, Mann–Kendall test was adopted to explore the evolution of agricultural drought disasters. Random forest algorithm, which integrates feature importance and accumulated local effects plot, was applied to quantify the effect of principal influencing factors on agricultural drought disasters. Results show that over the period from 1950 to 2019, agricultural drought disasters in China have undergone significant fluctuations. The spatial pattern of agricultural drought disaster tends to decrease in severity from north to south. The total sown area of crops, precipitation, effective irrigation area, domestic patent application authorization, and regional GDP are the top 5 dominant factors influencing agricultural drought disasters. It also found that agricultural drought disaster negatively correlates with precipitation, domestic patent application authorization, and regional GDP, and the nonlinear response of agricultural drought disaster to total sown area of crops and effective irrigation area can be basically divided into two stages. In the first stage, with the increase of feature value, agricultural drought disaster is also increasing. In the second stage, with the increase of feature value, agricultural drought disaster is growing slow or just decreasing. The results can deepen the understanding of agricultural drought disasters and provide scientific basis for drought event monitoring, evaluation, and early warning.
1 Introduction
Drought is one of the most frequent natural hazards in the world (Schwalm et al., 2017). Compared with other natural disasters, drought usually affects vast space with long period, and has great impact on hydrology and ecosystem (Orth and Destouni, 2018). Drought may bring about the reduction of soil moisture, river runoff, and crop yield; cause the degradation of river ecological function; and even affect regional water, food, and ecological security. Drought is a major natural disaster affecting economic and social development in China (Lv et al., 2011). From 2008 to 2018, the average area affected by drought in China was 12.8 million hectares, with an average grain loss of 18.7 billion kg (Ministry of Water Resources of China, 2019). In the context of global warming, agriculture production is affected by increasingly serious meteorological disasters. It is quite important to carry out the research on spatial–temporal pattern and evolution characteristics of agricultural drought disasters in China, so as to reduce the potential risk of drought hazard and formulate corresponding measures (Yan et al., 2016; Dayal et al., 2018; Ni et al., 2019; Wu et al., 2020; Zhao et al., 2020).
The selection of agricultural drought indicators is the basis of agricultural drought analysis. Agricultural drought involves atmosphere, soil, and crops. The commonly used indicators include standardized precipitation index (SPI), standardized soil moisture index (SSMI), water deficit index (WDI), crop moisture index (CMI), and Palmer Drought Severity Index (PDSI) (Cancelliere et al., 2006; Shah and Mishra, 2020; Tian et al., 2022). Most of the aforementioned agricultural indicators are composed of data of crop and soil (Hao et al., 2017; West et al., 2019). They mainly consider disaster drivers and disaster environment, without involving the actual loss of crops directly after drought events. Effective agricultural drought indicators should reflect the impacts of drought (Liu et al., 2019). Li et al. (2019) analyzed the temporal and spatial characteristics of drought in Heilongjiang, Jilin, and Liaoning provinces based on the statistical data of crop sown area, drought-affected area, drought-suffering area, area with no harvest, and grain loss due to severe drought in Northeast China from 1949 to 2017. Wu et al. (2018) adopted drought-affected area rate as drought risk index to establish the risk assessment and zoning model for regional drought disaster based on Cloud Model and Bootstrap Method (CMBM) in Anhui province.
Drought is a natural phenomenon, but it is also widely affected by human activities. For instance, hydrological drought may occur downstream of a reservoir; diversion irrigation may alleviate agricultural drought; long-term overexploitation of groundwater for domestic and production water use may cause ecological drought. Nowadays, human activities have deeply affected water cycle and energy cycle, and the influencing factors of agricultural drought disasters are becoming more and more complex. It is necessary to identify the influencing factors of agricultural drought disasters, screen key disaster-causing factors, and explore the relationship between agricultural drought disaster and various factors, to prevent and control agricultural drought disasters (Yang et al., 2020). Many researches have been carried out on driving factors of agricultural drought disasters (Blauhut et al., 2016; Huang et al., 2015; Pang et al., 2019; Zobeidi et al., 2021). Han et al. (2021) analyzed the influencing factors of agricultural drought in Loess Plateau (LP), and the result shows that significant increasing precipitation (p < 0.01) in the LP has not alleviated agricultural drought, whereas significant increasing temperature (p < 0.01) is the direct factor inducing agricultural drought, and the implementation of vegetation restoration project further aggravates the risk of agricultural drought. Hong (2017) calculated the information transmission direction and intensity between different types of drought indicators in Hanjiang River Basin, and analyzed the regular pattern of drought propagation and evolution; the result shows that the interaction between agricultural drought and hydrological drought is quite close, showing a high degree of synchronization. However, most of the previous studies on drought are conducted for a river basin or a region rather than the entire China (Huang et al., 2015; Cheng et al., 2017; Wu et al., 2017; Dai et al., 2020), and influencing factors only focus on natural attributes, with less consideration of the role of human activities on drought disasters (Javadinejad et al., 2020).
The response of hydrological and agricultural systems to meteorological conditions is nonlinear (Berghuijs et al., 2016; Konapala and Mishra, 2016); it is one of the sticky points to separate the role of individual natural or human factors and clarify their driving mechanism on agricultural drought disasters. As an algorithm that uses computers to imitate human learning, machine learning can develop learning strategies, analyze potential patterns, and predict target variables according to existing data (Kohavi and Provost, 1998; Liu et al., 2019; Apley and Zhu, 2016). In water cycle field, machine learning algorithm can capture the nonlinear relationship between input variables (e.g., precipitation, temperature) and output variables (e.g., runoff), and apply the functional relationship to target prediction (Nourani et al., 2014; Raghavendra and Deka, 2014). Although most machine learning algorithms cannot directly quantify the internal mechanism of the model behavior (Gupta and Nearing, 2015; Karpatne et al., 2017), the emergence of interpretable methods can improve the understanding of specific machine learning model or prediction (Guidotti et al., 2019; Ji et al., 2019; Liu. W et al., 2019). Based on interpretable methods, it is easier to quantify feature importance, and clarify the dependency between input features and output targets. Nowadays, machine learning algorithms have been widely used in drought prediction (Liu et al., 2018; Başakın et al., 2019; Shamshirband et al., 2020); interpretable methods also began to rise in hydro-meteorological area (Schwalm et al., 2017; Fienen et al., 2018; Koch et al., 2019), but the application of the aforementioned emerging technologies in the identification of key factors of agricultural drought disasters is still limited.
The previous discussion suggests that limited research has been conducted to investigate the dominant nonlinear influence of natural and human factors on agricultural drought disasters over China based on machine learning model. Therefore, the main objectives of this paper are
1) To explore the spatial–temporal pattern and evolution characteristics of agricultural drought disasters in China;
2) To identify the dominant natural and human factors and their effects on agricultural drought disasters in China based on machine learning model.
To achieve these aims, first, we selected drought-affected area and drought-suffering area as the indexes indicating agricultural drought disasters, and the spatial–temporal pattern and evolution characteristics of agricultural drought disasters were presented based on Mann–Kendall test. Second, an index system that consisted of natural and human factors of agricultural drought disasters with 22 indexes was established, and Random Forest algorithm derived from 4 datasets of 2011–2019, 2004–2019, 1987–2019, and 1979–2019 were trained and tested to explore the functional relationship between potential factors and agricultural drought disasters. Finally, Gini importance, permutation feature importance, and accumulated local effects (ALE) plot were applied to identify principal factors and their influence on agricultural drought disasters.
The remainder of the article is organized as follows: Section 2 provides an overview of study area and data sources, Section 3 presents the methods adopted in the study, Section 4 presents the results, Section 5 discusses the findings and outlook, and finally the article is concluded in Section 6.
2 Study Area and Data Sources
The paper selects China (excluding Hong Kong Special Administrative Region, Macao Special Administrative Region, and Taiwan Province) and its 31 provinces as the study area, and collects the annual data of 24 indicators at national or provincial spatial scale (Table 1). For national spatial scale, there are three indicators including drought-affected area, drought-suffering area, and total sown area of crops, whose data source is China Statistical Yearbook, with time scale from 1950 to 2020. For provincial scale, all the 24 indicators are included, but the time scale of different indicators is different, with the longest from 1979 to 2019 and the shortest from 2011 to 2019. Among the 24 indicators, data of 16 indicators of drought and social economy such as drought-affected area, regional GDP, and total book prints number are from China Statistical Yearbook; data of six indicators of water resources such as total water resources, total water use, and actual irrigation water use per mu of cultivated land are from China Water Resources Bulletin; data of two indicators including precipitation and temperature are from China Climate Bulletin and ERA5 (Hersbach et al., 2019). Previous studies indicated that ERA5 data have good suitability to China, which could reasonably depict regional difference of hydrological cycle elements (Su et al., 2020; Zhang et al., 2021; Zhou et al., 2021). However, we found that there is still a certain bias between original ERA5 products and in situ observations. We therefore corrected temperature and precipitation of the original ERA5 data by using bias correction method. It is found that the corrected ERA5 products are consistent with observations (Supplementary Figure S1).
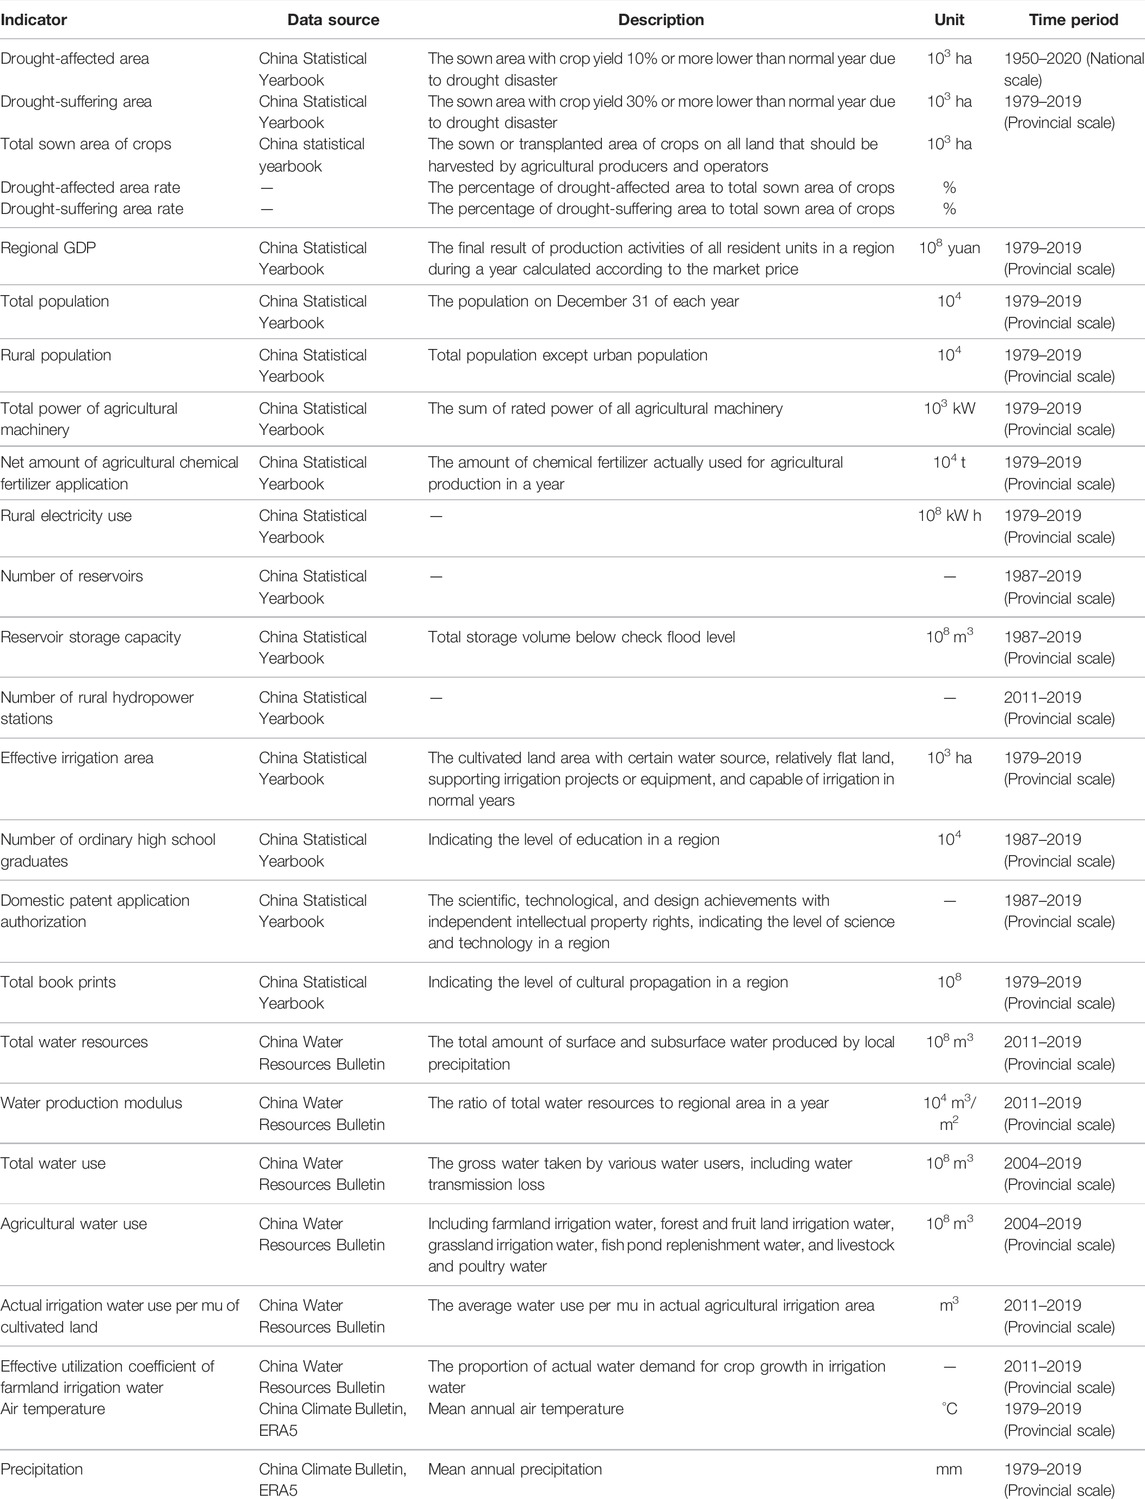
TABLE 1. List of indicators; their data sources and brief description are provided
Some data are missing for the 4 indicators of drought-affected area, drought-suffering area, number of reservoirs, and reservoir storage capacity. Among them, data of drought-affected area and drought-suffering area from 1967 to 1969 at national spatial scale are missing, and there are varying degrees of missing data for each province in each year. To ensure authenticity and objectivity, the paper does not deal with the missing data in drought-affected area and drought-suffering area. Data of reservoir number and reservoir storage capacity in 1999 are missing, and the arithmetic average values of 1998 and 2000 are used for interpolation.
3 Methods
3.1 Mann-Kendall Test
Among all the trend analysis methods for time series, Mann–Kendall test is a method recommended by the World Meteorological Organization and widely used around the world. As a nonparametric test method, Mann–Kendall test is an effective tool to diagnose the trend of a data sequence, which does not need data series to follow a specific distribution, and is not affected by sample values, distribution types, and a few outliers either. Mann–Kendall test has the advantages of relatively simple calculation, high degree of quantification, and wide detection range. It is widely used in the analysis of hydrological data series. The mathematical fundamentals of Mann–Kendall test are as follows:
For time series x1, x2, … , xn, dual number p is calculated by
where
Then, τ, Var (τ), and U are calculated based on p:
When the value of statistic U is positive, it indicates that the time series shows an upward trend, otherwise the time series shows a downward trend. Taking the significance level as 95%, U0.05 equals ±1.96. If |U|≥1.96, then the trend of the time series is significant, otherwise the trend of the time series is not significant.
3.2 Random Forest Model
Random Forest (RF) is a statistical learning theory proposed by Breiman (2001). Compared with other machine learning algorithms, Random Forest is insensitive to multicollinearity, robust to missing data and unbalanced data, does not need data preprocessing, and can provide reasonable prediction results for nonlinear relationships. It is one of the best algorithms for processing high-dimensional data based on machine learning.
Random Forest is a collection of decision trees, each of which is slightly different from another. Random Forest repeatedly extracts samples from the training set, and the unselected samples constitute the out-of-bag data. Each training sample set is used to construct a decision tree. During the growth of a decision tree, features are randomly selected at each node, and the error of a decision tree is estimated according to the data out of bag. The prediction result of a RF algorithm is the mean value of the prediction result of each decision tree, and the prediction accuracy of a RF algorithm is estimated by the average prediction accuracy of each decision tree. The model construction process is as follows:
1) Split the whole data set into training set (75%) and test set (25%) randomly.
2) The training set is used to construct the RF model, and the best parameters of the model are determined based on network search and cross-validation. The accuracy of RF algorithm output mainly depends on three parameters: a) the number of trees (n_estimators) to grow in the forest, b) the maximum number of randomly selected features (max_features) at each node, and c) the maximum depth of each tree to grow (max_depth). In this paper, we randomly resampled different combinations of parameter sets with max_features ranging from one to total variables considered, and max_depth ranging from one to ten to avoid overfitting. Besides, we set n_estimators to 1,000 as suggested by Hengl et al. (2018) and Probst et al. (2017). Determination coefficient R2 is adopted to measure the model training accuracy and then select the optimal parameters of the RF model. Calculation details are as follows:
where yi is the actual value in the validation set and ypred is the predicted value of a RF model in the validation set. R2 is between 0 and 1; the optimal value of R2 is 1. Generally, R2 greater than 0.6 would point to a model with good predictive power.
3) The test set is used to evaluate the generalization ability of the established RF model, and R2, root mean square error (RMSE), and percent bias (PBIAS) are adopted to be the evaluation index. Calculation details are as follows:
where n is the number of samples in the test set.
RMSE measures the average distance between predicted values and actual ones. The optimal value of RMSE is 0, with low-magnitude values indicating accurate model simulation.
PBIAS measures the average tendency of predicted values larger or smaller than their actual ones. The optimal value of PBIAS is 0, with low-magnitude values indicating accurate model simulation. Positive values represent underestimation bias, whereas negative values represent overestimation bias.
In this paper, Sklearn package in Python is used to realize the construction and verification of RF model.
3.3 Feature Importance
Two kinds of methods including Gini importance and permutation feature importance are adopted to filter out the significant features of target variables.
3.3.1 Gini Importance
Gini coefficient calculates the amount of probability of a specific feature that is classified incorrectly when selected randomly. Supposing there are K categories, the probability of i category is Pi, then the expression of Gini coefficient is
Gini coefficient reflects the impurity at a node in a decision tree. Each time a particular feature is used to split a node, the Gini coefficient for the child nodes are calculated and compared with that of the original node. If the reduction is large, it shows that the feature at the node has a great impact on the decision tree. The importance of a feature is computed as the normalized total reduction of the Gini coefficient brought by that feature in a Random Forest, and the sum of Gini importance of all features is equal to 1. In this paper, Sklearn package in Python is used to realize the Gini feature importance.
3.3.2 Permutation Feature Importance
Permutation feature importance, introduced by Breiman (2001) for Random Forests, measures the increase in the prediction error of the model after we permuted the feature’s values. Features with higher importance value likely have higher dominant control. Permutation feature importance provides a highly compressed, global insight into the model’s behavior. Detailed algorithm turns to Fisher et al. (2019) and Molnar (2021). In this paper, eli5 package in Python is used to realize permutation feature importance.
3.4 Accumulated Local Effects Plot
Accumulated local effects plot describes how features influence the prediction of RF model on average, which can present the nonlinear response of target variables to features. Compared with partial dependence plots (PDPs), ALE plots can still work when features are correlated. In addition, the value at each point of the ALE curve is the difference to the mean prediction, which makes their interpretation clearer. In this paper, we repeated the ALE algorithm in Monte Carlo simulation with 100 replicates, where on each replicate we generated a new training data set and refit the RF model with the same best parameters. Detailed algorithm turns to Grömping (2020) and Molnar (2021). In this paper, alepython package in Python is used to realize ALE plot.
4 Results
4.1 Spatial-Temporal Pattern of Agricultural Drought Disasters
4.1.1 Temporal Evolution
The temporal variations of drought-affected area and drought-suffering area, drought-affected area rate and drought-suffering area rate over the years from 1950 to 2020 are shown in Figure 1. It can be seen that drought-affected area and drought-suffering area, drought-affected area rate and drought-suffering area rate fluctuate since 1950, which can be roughly divided into three stages: 1950–1980, 1981–2000, and 2001–2020. By calculating the statistics of the time sequences of drought-affected area rate and drought-suffering area rate (Table 2), it can be found that the national multi-year average drought-affected area rate and drought-suffering area rate are 13.19 and 4.72% in 1950–1980, 17.12 and 8.44% in 1981–2000, and 10.35 and 5.51% in 2001–2020. Compared among the three stages, the national multi-year average drought-affected area rate and drought-suffering area rate are the largest in 1981–2000, which are about 1.3 times and 1.8 times as large as those in 1950–1980, and 1.7 times and 1.5 times as large as those in 2001–2020. The variation coefficients of drought-affected area rate and drought-suffering area rate are 0.57 and 0.75 in 1950–1980, 0.27 and 0.41 in 1981–2000, and 0.56 and 0.65 in 2001–2020. Compared among the three stages, the variation coefficients of drought-affected area rate and drought-suffering area rate are the smallest in 1981–2000. This indicates that the agricultural drought disasters in 1950–1980 and 2001–2020 are relatively gentle, but the interannual variation is relatively large; the agricultural drought disasters in 1981–2000 are relatively heavy, but the interannual variation is relatively small. The U statistics derived from the Mann–Kendall test of drought-affected area rate and drought-suffering area rate are 3.16 and 2.61 in 1950–1980 with significant upward trend, 0.84 and 1.3 in 1981–2000 with non-significant upward trend, and −4.48 and −4.54 in 2001–2020 with significant downward trend. Compared among the three stages, the downward trend is the most obvious in 2001–2020. In the past decade (2011–2020), drought-affected area rate and drought-suffering area rate have been decreasing continuously, with an average drought-affected area rate of 6.26% and an average drought-suffering area rate of 2.82%.
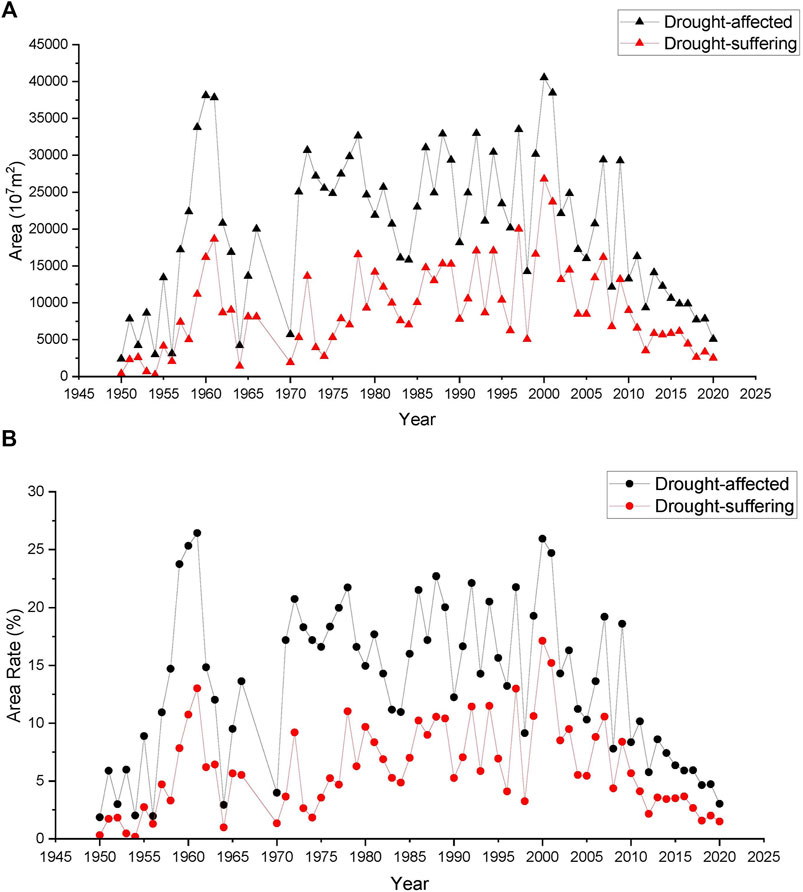
FIGURE 1. Temporal variation of agricultural drought disasters in China from 1950 to 2020. (A) Drought-affected area and drought-suffering area. (B) Drought-affected area rate and drought-suffering area rate.
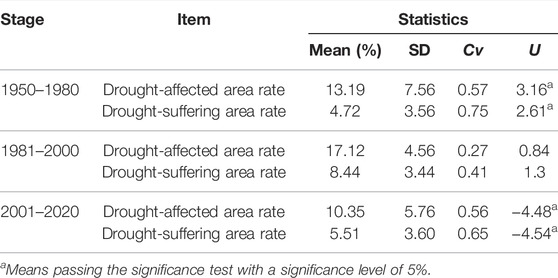
TABLE 2. Statistics of drought-affected area rate and drought-suffering area rate based on Mann–Kendall test in 1950–1980, 1981–2000, and 2001–2020
The frequency curves of drought-affected area rate and drought-suffering area rate are shown in Figure 2, and the frequency characteristic values are shown in Table 3. The variation of frequency curves of drought-affected area rate and drought-suffering area rate is overall gentle, but the variation of rare drought (p < 10%) is relatively heavy. For drought-affected area rate, there is a probability of 50% greater than 14.29%, 10% greater than 21.88%, and 5% greater than 24.37%. For drought-suffering area rate, there is a probability of 50% greater than 5.49%, 10% greater than 10.83%, and 5% greater than 12.47%. Under the probability of 50%, the value of drought-affected area rate is about 2.6 times as large as that of drought-suffering area rate, while under the probability of 10%, the value of drought-affected area rate is only about 2.0 times as large as that of drought-suffering area rate. This indicates that with the increase of drought intensity, it is more likely to evolve into a drought disaster of high impact with crop yield 30% or more lower than normal year. The years 1961, 2000, 1960, 2001, and 1959 are the 5 years with the highest drought-affected area rate in China from 1950 to 2020. Also, 2000, 2001, 1961, 1997, and 1994 are the 5 years with the highest drought-suffering area rate in China from 1950 to 2020. The reduction of grain yield in these years was over 5%, up to 11.5% (Zhang et al., 2008).
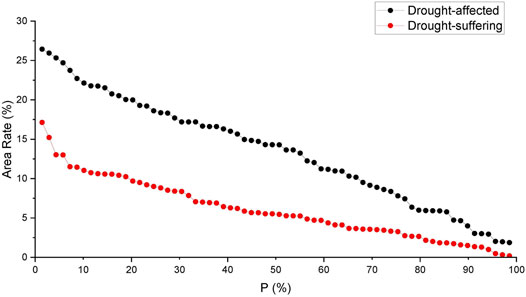
FIGURE 2. Frequency curves of drought-affected area and drought-suffering area in China.
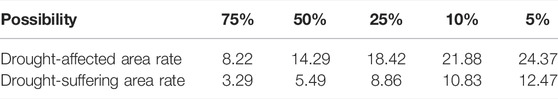
TABLE 3. Frequency characteristic value of drought-affected area and drought-suffering area in China
4.1.2 Spatial Pattern
The spatial distribution of the average drought-affected area rate and drought-suffering area rate from 1979 to 2019 in China is shown in Figure 3, and we can see that on the whole, drought-affected area rate and drought-suffering area rate in northern China are higher than those in southern China. In southern China, the southeast coastal provinces have the lowest drought-affected area rate and drought-suffering area rate. In Northern China, drought-affected area rate and drought-suffering area rate of Beijing, Tianjin, and Xinjiang are relatively low. The top five provinces with the highest drought-affected area rate are Shanxi (32.86%), Inner Mongolia (28.88%), Liaoning (24.5%), Gansu (24.33%), and Shaanxi (22.41%). The top five provinces with the highest drought-suffering area rate are Inner Mongolia (18.15%), Shanxi (17.21%), Gansu (14.04%), Liaoning (13.47%), and Shaanxi (12.33%). The two collections of provinces are exactly the same and all of them are located in northern China.
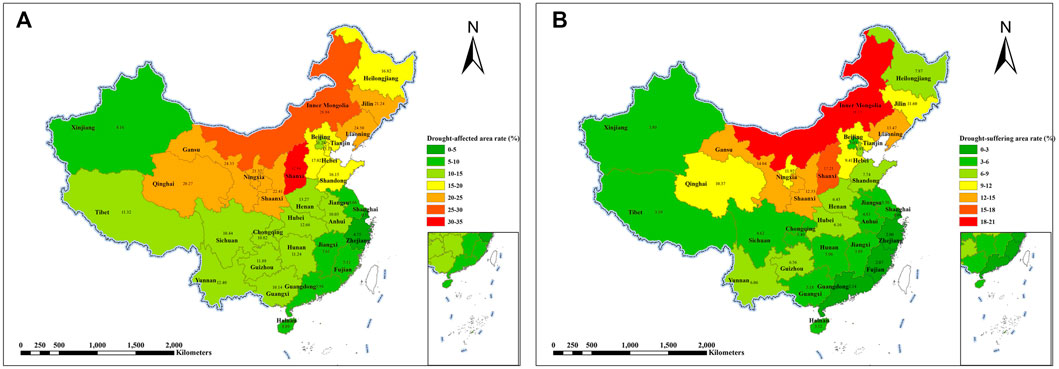
FIGURE 3. Spatial distribution of multi-year average agricultural drought disasters. (A) Drought-affected area rate. (B) Drought-suffering area rate.
Scatter plots of drought-affected area rate and drought-suffering area rate against sown area proportion are shown in Figure 4. Here, sown area proportion refers to the percentage of sown area of crops in a province in the total sown area of crops in China, which can reflect the contribution of agricultural production of a province to the whole country. The lines represent the 50% quantile of drought-affected area rate, drought-suffering area rate, and sown area proportion, which is 14.29, 5.49, and 2.93%, respectively. Among the four quadrants, the first quadrant indicates that agricultural drought disasters are relatively serious and sown area of crops accounts for a high proportion of the country. The second quadrant indicates that agricultural drought disasters are relatively serious but sown area of crops accounts for a low proportion of the country. The third quadrant indicates that sown area of crops accounts for a low proportion of the country and agricultural drought disasters are relatively light. The fourth quadrant indicates that sown area of crops accounts for a high proportion of the country but agricultural drought disasters are relatively light. Therefore, the provinces located in the first quadrant need to be paid enough attention. As we can see from the figure, seven provinces including Inner Mongolia, Gansu, Jilin, Shaanxi, Hebei, Heilongjiang, and Shandong account for a high proportion of sown area and high drought-affected area rate. Ten provinces including Inner Mongolia, Jilin, Shaanxi, Hebei, Heilongjiang, Shandong, Yunnan, Hubei, Hunan, and Henan account for a high proportion of sown area and high drought-suffering area rate.
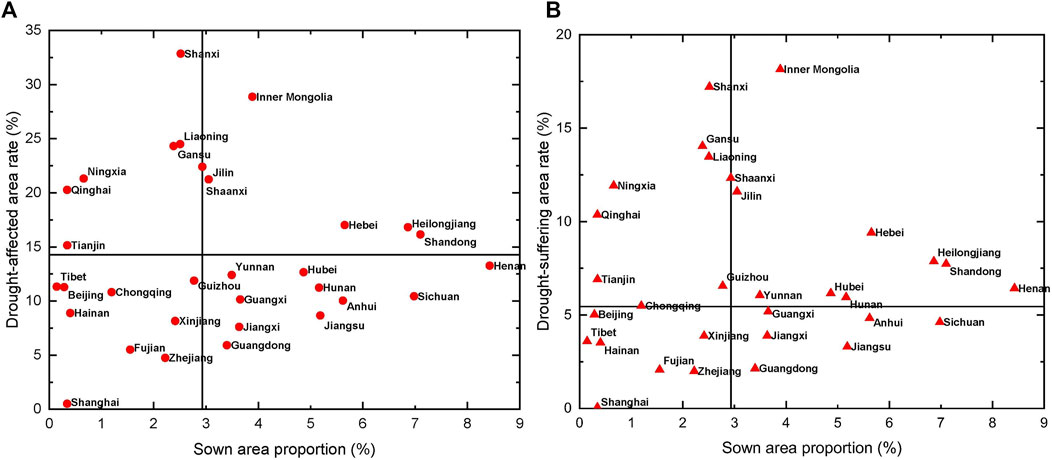
FIGURE 4. Agricultural drought disasters against sown area proportion. (A) Drought-affected area rate. (B) Drought-suffering area rate.
The trend of drought-affected area rate and drought-suffering area rate with time of each province was estimated based on Mann–Kendall test (Figure 5). The drought-affected area rate of all provinces presents a downward trend with time. Heilongjiang, Jilin, Liaoning, Inner Mongolia, Ningxia, Gansu, Qinghai, Xinjiang, Hubei, and Yunnan show a non-significant downward trend, mainly distributed in northeast China and northwest China. The rest of the provinces show a significant downward trend. The drought-suffering area rate of Xinjiang and Qinghai presents a non-significant upward trend with time, while the drought-suffering area rate of the other 29 provinces presents a downward trend with time. Heilongjiang, Jilin, Liaoning, Inner Mongolia, Ningxia, Gansu, Hubei, Anhui, Jiangxi, Fujian, and Yunnan show a non-significant downward trend, mainly distributed in northeast China, northwest China, and provinces in the middle and lower reaches of the Yangtze River. The rest of the provinces show a significant downward trend.
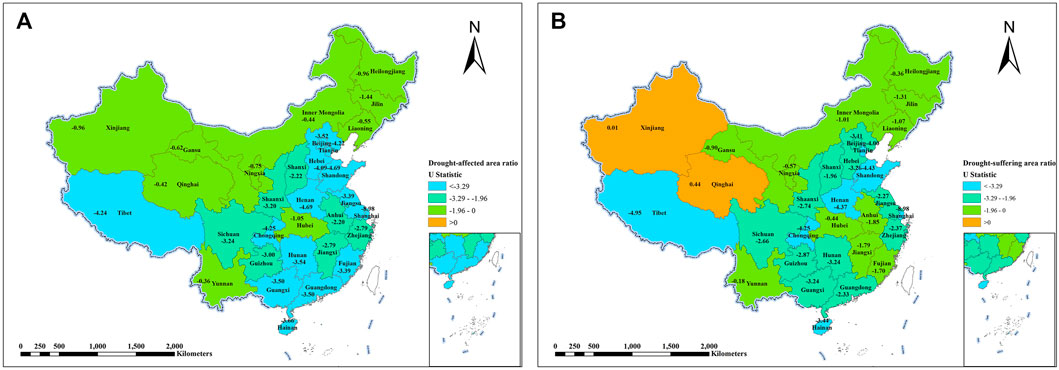
FIGURE 5. Spatial distribution of U statistic derived from Mann–Kendall test of agricultural drought disasters. (A) Drought-affected area rate. (B) Drought-suffering area rate.
4.2 Analysis on the Influencing Factors of Agricultural Drought Disasters
4.2.1 Index System
Agriculture drought disasters, impacted by many natural factors and human activities, are a complicated system. To explore the principal influencing factors and their effect on agriculture drought disasters, it is necessary to select operational indexes comprehensively and construct scientific multi-hierarchy index systems. Generally, agricultural drought disasters are affected by natural and human factors.
Natural factors are mainly divided into meteorological conditions and water resources conditions, including temperature, precipitation, total water resources, and water production modulus, which reflects the basic hydrothermal conditions of agricultural production in a region.
Human factors are mainly divided into 4 aspects: basic socio-economic conditions, agricultural development, water conservancy conditions, and water saving consciousness. Basic socio-economic conditions include three indexes, regional GDP, total population, and total water use, which represent the comprehensive socio-economic capacity in a region. Agricultural development includes six indexes, rural population, total sown area of crops, total power of agricultural machinery, net amount of agricultural chemical fertilizer application, agricultural water use, and rural electricity use, which shows the basic conditions of agricultural production in a region. Water conservancy conditions include six indexes, number of reservoirs, reservoir storage capacity, number of rural hydropower stations, effective irrigation area, actual irrigation water use per mu of cultivated land, and effective utilization coefficient of farmland irrigation water, which indicates the development and utilization level of water resources and the ability of drought prevention and reduction in a region. Water saving consciousness includes three indexes, number of ordinary high school graduates, domestic patent application authorization, and total book prints, which indirectly reflect the level of education, scientific research, and cultural propagation in a region, respectively.
Thus, an index system of influencing factors of agricultural drought disasters with 22 indexes was established (Table 4). Due to the limited time length of some indexes obtained from data sources (Table 1), a total of four datasets have been integrated. Dataset of 2011–2019 has the shortest time length (9 years), but contains all the 22 indexes. Dataset of 2004–2019 has time length of 16 years with 17 indexes. Dataset of 1987–2019 has time length of 33 years with 15 indexes. Dataset of 1979–2019 has the longest time length (41 years), but contains only 11 indexes. In the following paper, we will use these four datasets to explore the influence of sample number and feature number on the fit goodness of Random Forest algorithm.
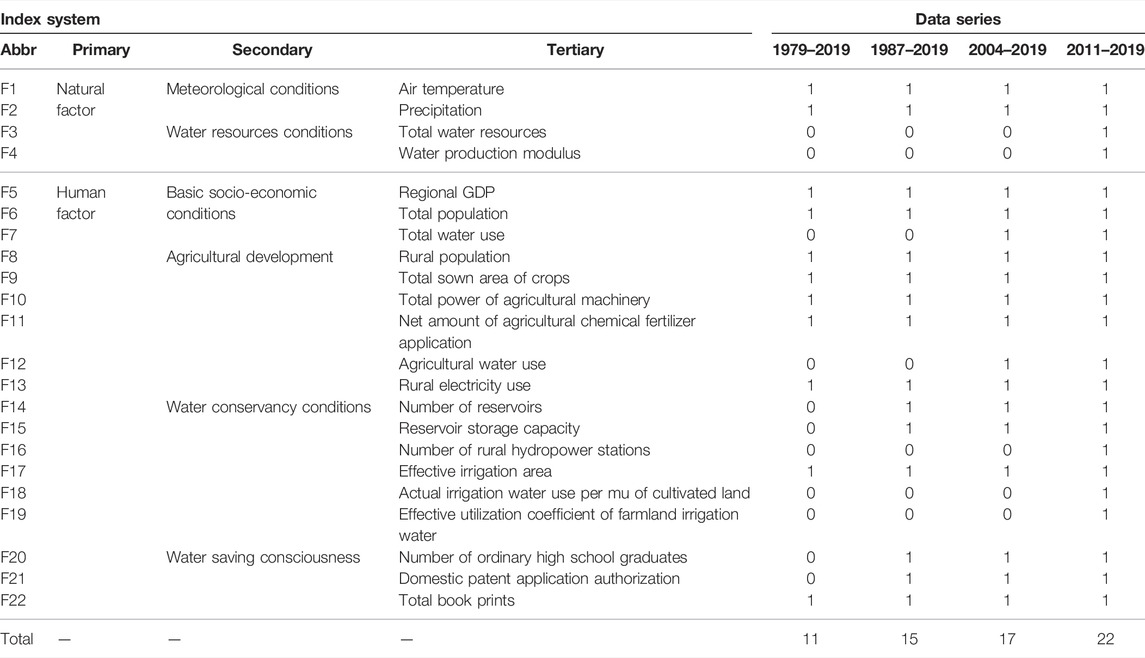
TABLE 4. Index system of influencing factors of agricultural drought disasters
4.2.2 RF Model Performance
Taking drought-affected area and drought-suffering area as target variables, and taking indexes in Table 4 as features, Random Forest model was constructed based on the method described in Section 3.4. It should be mentioned that log (y+1) transformation was carried out on target variables when building the RF model because both drought-affected area and drought-suffering area correspond to a positive skew distribution (Figure 2).
To explore the influence of sample number and feature number on the fit goodness of RF algorithm, the four datasets of 2011–2019, 2004–2019, 1987–2019, and 1979–2019 were used as the input data, respectively. Figure 6 and Supplementary Figure S2 present the results of parameter network search and cross-validation for drought-affected area and drought-suffering area in the training set. It can be found that when max_depth is small (1–4), R2 derived from all the four datasets is poor. When max_features is small (1–2), R2 derived from all the four datasets is poor. For the dataset of 2011–2019, R2 is poor when max_features is large (>7). For the datasets of 2004–2019, 1987–2019, and 1979–2019, R2 changes little with max_depth (>4) and max_features (>2) increasing.
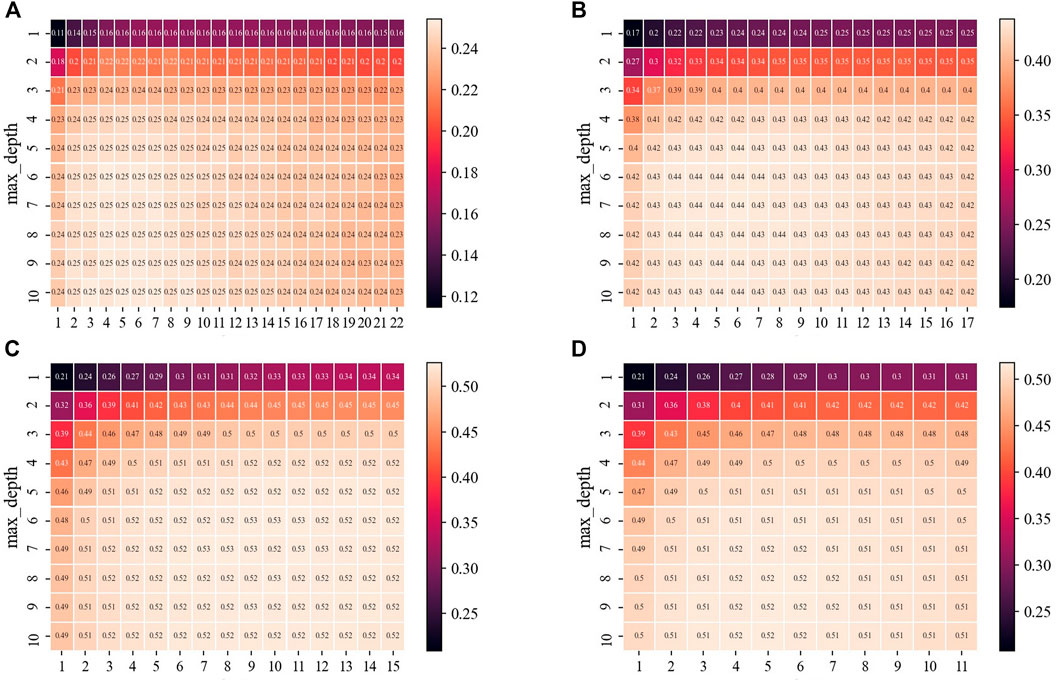
FIGURE 6. Heatmaps are provided with R2 of grid research and cross-validation in case of drought-affected area. (A) 2011–2019. (B) 2004–2019. (C) 1987–2019. (D) 1979–2019.
According to the best R2 of cross-validation, we obtain the optimal parameters of RF algorithms derived from the four datasets (Table 5). It shows that the optimal max_depth of all the algorithms is relatively large (5–10), and the optimal max_features of the algorithms varies greatly (from 3 to 10). For drought-affected area, the best R2 of dataset of 2011–2019 is the smallest (0.25), and that of 1979–2019 is the largest (0.52). For drought-suffering area, the best R2 of dataset of 2011–2019 is the smallest (0.26), and that of 1987–2019 is the largest (0.50). Generally speaking, the increase of sample numbers significantly improves the simulation accuracy of the RF algorithm.
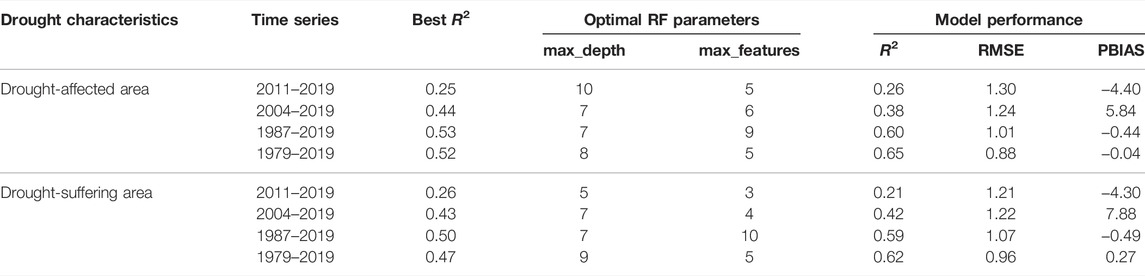
TABLE 5. Optimal parameters and the corresponding model performance metrics of RF algorithms for drought-affected area and drought-suffering area
We evaluated the performance of RF algorithm derived from the four datasets in the test set. The metrics of R2, RMSE, and PBIAS for the corresponding model configurations are listed in Table 5. Among the four datasets, the algorithm derived from the dataset of 1979–2019 performs best with the largest R2, smallest RMSE and PBIAS closest to 0, indicating that the RF algorithm driven by the dataset of 1979–2019 can explain the variance of drought-affected area and drought-suffering area to the greatest extent. It can also be seen from Figure 7D and Supplementary Figure S3D that the deviation between the actual values in the test set and the fitted values of the RF algorithm are the smallest. The RF algorithm driven by the dataset of 2011–2019 performs poorly with R2 smaller than 0.30 and overestimates the actual values (Figure 7A and Supplementary Figure S3A). While the RF algorithm driven by the dataset of 2004–2019 underestimates the actual values (Figure 7B and Supplementary Figure S3B) with R2 smaller than 0.45. The RF algorithm derived from the dataset of 1987–2019 has high prediction accuracy, but slightly overestimates the actual values (Figure 7C and Supplementary Figure S3C), especially drought with low intensity. The test result of the model also shows that the increase of sample numbers can improve the generalization ability of the RF algorithm compared with the increase of the number of features.
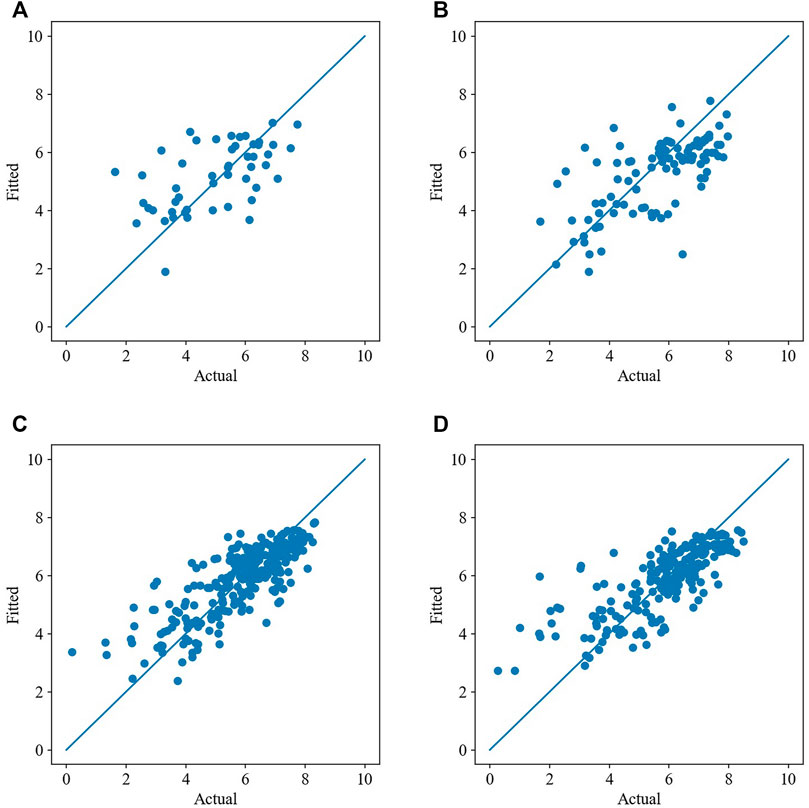
FIGURE 7. Comparison plots are provided with x-axis as the actual values in test set of drought-affected area and y-axis as the fitted values of the RF model. (A) 2011–2019. (B) 2004–2019. (C) 1987–2019. (D) 1979–2019.
4.2.3 Drought-Affected Area
Figure 8 shows the rank of natural and human factors that has potential influence on drought-affected area indicated by the two methods of Gini importance and permutation feature importance based on the four datasets. Red circles and top x-axis represent results derived from Gini importance, and blue triangles and bottom x-axis represent results derived from permutation feature importance. The line shows the average feature importance of Gini importance, which can be used as a threshold to determine the significant features of interest.
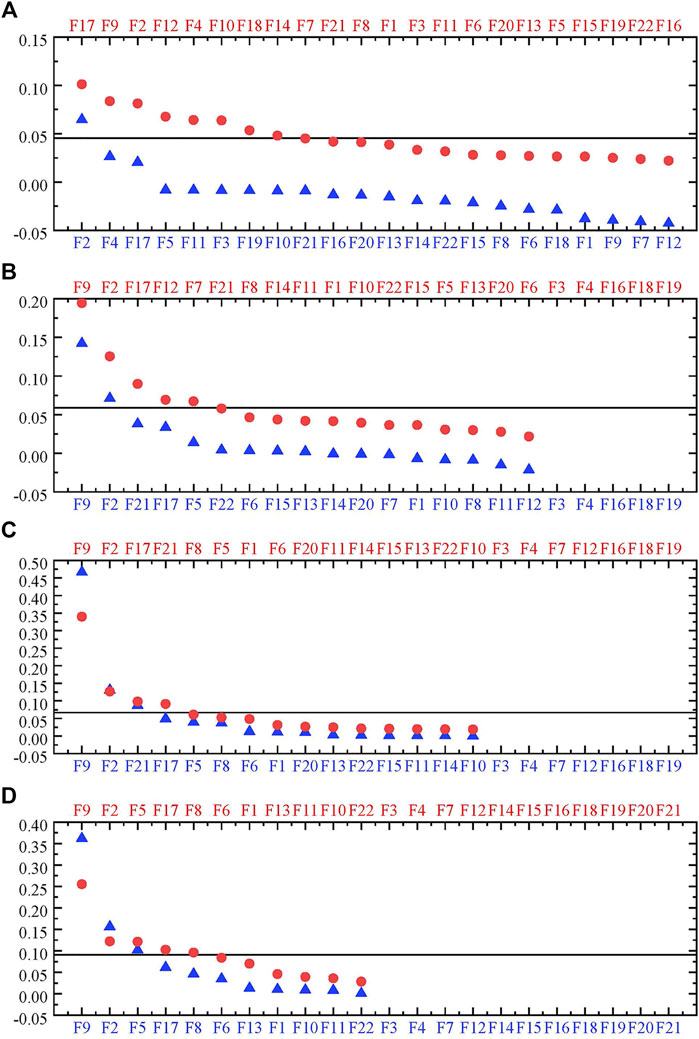
FIGURE 8. Rank plots are provided in descending order with features exhibiting maximum importance on the leftmost in case of drought-affected area based on datasets of (A) 2011–2019, (B) 2004–2019, (C) 1987–2019, and (D) 1979–2019. Red circles and top x-axis represent results derived from Gini importance, blue triangles and bottom x-axis represent results derived from permutation feature importance. The line shows the average feature importance, which can be used as a threshold to determine the significant features of interest for Gini importance.
For the dataset of 2011–2019, F17 (effective irrigation area), F9 (total sown area of crops), F2 (precipitation), F12 (agricultural water use), F4 (water production modulus), F10 (total power of agricultural machinery), F18 (actual irrigation water use per mu of cultivated land), and F14 (number of reservoirs) have more than average Gini importance, while F2, F4, and F17 show the top three permutation importance. It is worth noting that these three features are the only three features whose permutation importance value is over 0. For the dataset of 2004–2019, F9, F2, F17, F12, and F7 (total water use) have more than average Gini importance, while F9, F2, and F21 (domestic patent application authorization), and F17 and F5 (regional GDP) show the top five permutation importance. For the dataset of 1987–2019, F9, F2, F21, and F17 have more than average Gini importance; these four features are exactly the same as the top four features derived from permutation feature importance. For the dataset of 1979–2019, F9, F2, F5, F17, and F8 (rural population) have more than average Gini importance; these five features are exactly the same as the top five features derived from permutation feature importance.
We can find that the significant features screened by the two methods of Gini importance and permutation importance based on the datasets of 1979–2019 and 1987–2019 are identical, while the significant features screened by the two methods derived from the dataset of 2011–2019 show significant difference. Considering the performance of RF models, we can deduce that models with low prediction accuracy have high uncertainties, and the feature importance derived from the datasets of 1979–2019, 1987–2019, and 2004–2019 is more reliable.
In addition, F9, F2, and F17 dominate in controlling drought-affected area for all the four datasets. F21 dominates in controlling drought-affected area for datasets of 1987–2019 and 2004–2019. F5 dominates in controlling drought-affected area for datasets of 1979–2019 and 2004–2019. Based on the aforementioned facts, we can make a preliminary judgement that F9, F2, F17, F21, and F5 are the principal features influencing drought-affected area.
To further understand how these key features influence drought-affected area, the ALE plots of the top six features derived from the four datasets are plotted (Figure 9). Basically, drought-affected area is positively correlated with F9, and the nonlinear relation between F9 and drought-affected area can be divided into two stages at 4 million hectares. Before 4 million hectares, drought-affected area increases significantly with the increase of F9; after 4 million hectares, drought-affected area increases slightly or even decreases with the increase of F9. Drought-affected area is negatively correlated with F2 based on a linear behavior. A non-significant jump point can be observed at 1,000 mm, and the downward trend after 1,000 mm is steeper than that before 1,000 mm. The relation between drought-affected area and F17 is complicated, which can be roughly divided into two stages around 1 million hectares. Before 1 million hectares, drought-affected area increases significantly with the increase of F17; after 1 million hectares, drought-affected area decreases slightly with the increase of F17. Two-stage relationship can be observed between drought-affected area and F21. Before 20,000, drought-affected area decreases significantly over F21 increasing; after 20,000, drought-affected area decreases slightly over F21 increasing. Drought-affected area is negatively correlated with F5. A jump point can be observed around 150 trillion yuan, and the downward trend after 150 trillion yuan is gentler than that before 150 trillion yuan.
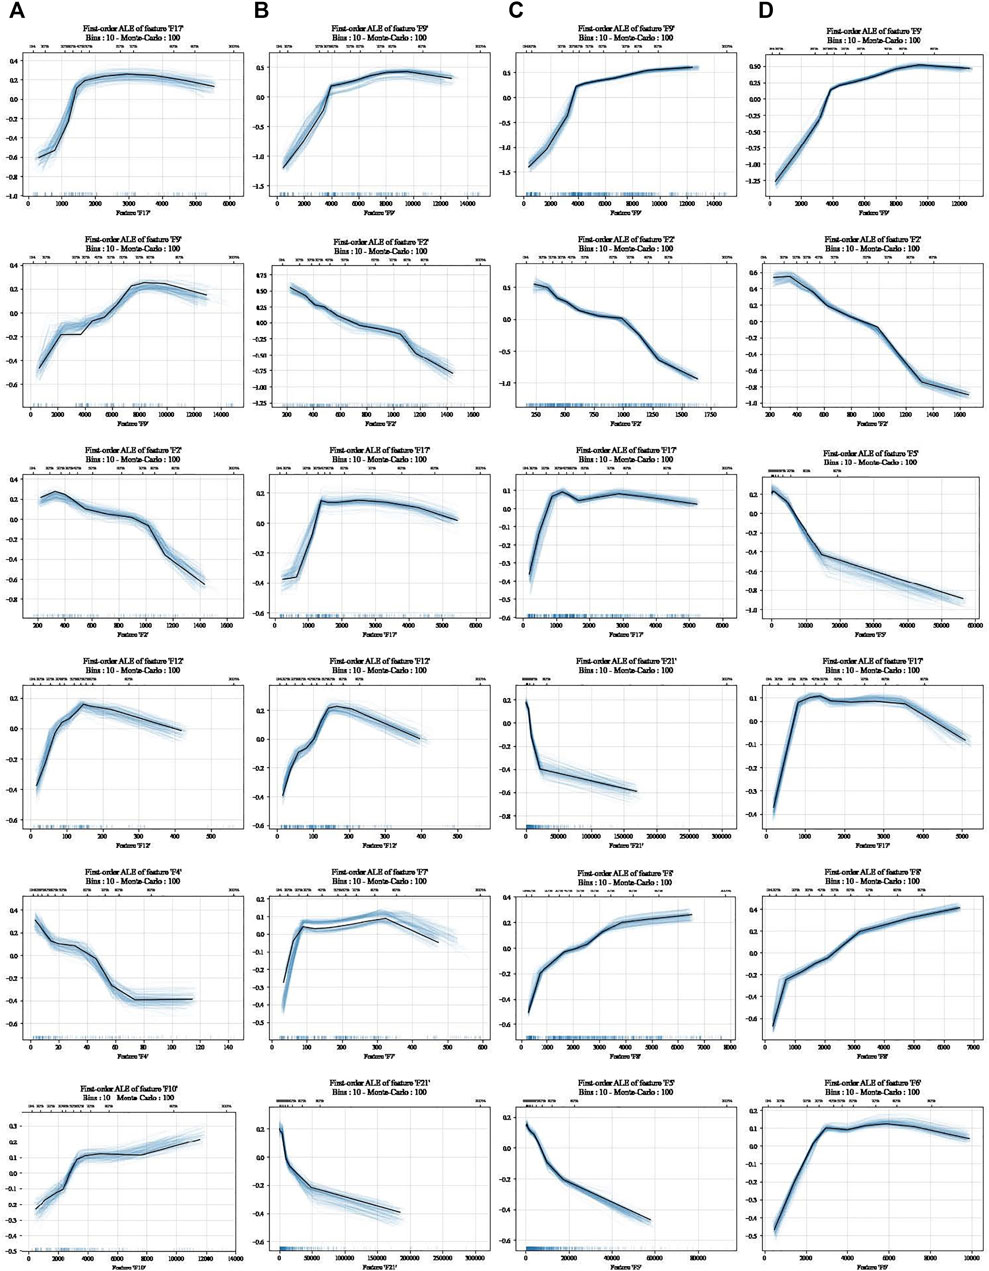
FIGURE 9. ALE plots of top six features controlling drought-affected area. (A) 2011–2019. (B) 2004–2019. (C) 1987–2019. (D) 1979–2019.
4.2.4 Drought-Suffering Area
Supplementary Figure S4 shows the rank of natural and human factors that has potential influence on drought-suffering area indicated by the two methods of Gini importance and permutation feature importance based on the four datasets. For the dataset of 2011–2019, F17, F9, F12, F2, F4, F10, F7, F1 (air temperature), and F14 have more than average Gini importance, while F4, F2, F17, and F3 (total water resources) show the top four permutation importance. It should be noted that these four features are the only four features whose permutation importance value is over 0. For the dataset of 2004–2019, F9, F2, F17, F7, F12, and F21 have more than average Gini importance, while F9, F21, F2, F17, F5, and F6 (total population) show the top six permutation importance. For the dataset of 1987–2019, F9, F2, F21, and F17 have more than average Gini importance; these four features are exactly the same as the top four features derived from permutation feature importance. For the dataset of 1979–2019, F9, F2, F5, and F17 have more than average Gini importance; these four features are exactly the same as the top four features derived from permutation feature importance.
In addition, F9, F2, and F17 dominate in controlling drought-suffering area for all the four datasets. F21 dominates in controlling drought-suffering area for datasets of 1987–2019 and 2004–2019. F5 dominates in controlling drought-suffering area for datasets of 1979–2019 and 2004–2019. Based on the aforementioned facts, we can make a preliminary judgement that F9, F2, F17, F21, and F5 are the key features influencing drought-suffering area. To further understand how these dominant features influence drought-suffering area, the ALE plots of top six features for the four datasets are plotted (Supplementary Figure S5). The nonlinear relation between drought-suffering area and F9, F2, F17, F21, and F5 is almost the same as drought-affected area, so we will not go into much detail here.
5 Discussion
Over the past 70 years, agricultural drought disasters in China have undergone significant fluctuations, and the spatial pattern of agricultural drought disasters varies from north to south. In terms of drought intensity characterized by the absolute value of drought-affected area and drought-suffering area, northern China is significantly higher than southern China. In terms of the impact of drought on agricultural production characterized by the relationship between drought-affected/suffering area rate against sown area proportion, eight northern provinces including Inner Mongolia, Gansu, Jilin, Shaanxi, Hebei, Heilongjiang, Shandong, and Henan and three southern provinces including Yunnan, Hubei, and Hunan are greatly affected by drought. In terms of the trend of drought characterized by the U statistics derived from Mann–Kendall test, among the aforementioned 11 provinces, drought in Inner Mongolia, Gansu, Jilin, Heilongjiang, Yunnan, and Hubei shows a non-significant downward trend, while drought in Shaanxi, Hebei, Shandong, Hunan, and Henan presents a significant downward trend. These results show that we should carry out regular monitoring, predicting, early warning, and risk management on drought in northern China. At the same time, we should also pay enough attention to the three southern provinces including Yunnan, Hubei, and Hunan. In addition, it should be noted that with the increase of drought intensity, it is more likely to evolve into a drought disaster of high impact with crop yield 30% or much lower than normal year, which indicates that all provinces should further improve their response ability to heavy drought disasters.
Wang et al. (2021a, 2021b) showed that standardized precipitation evapotranspiration index (SPEI) has the best correlation with drought-affected area in Northeast China, and by analyzing the trend of SPEI during the growing season, they found that there was an overall increasing trend, and the jump point was in 1983. Liao and Zhang (2017) found that from the perspective of drought-affected area rate, northern China is relatively high, while the middle and lower reaches of the Yangtze River are relatively low, and the spatial distribution of drought-affected area rate is basically consistent with that of meteorological drought days. These results show that sometimes drought indices derived from hydro-meteorological variables can be a good representation for agricultural drought disaster. In fact, drought-affected area and drought-suffering area are not only related to drought itself, but also closely related to the local agricultural distribution characteristics.
By analyzing the feature importance in each dataset based on the two methods of Gini importance and permutation feature importance, we can deduce that total sown area of crops, precipitation, effective irrigation area, domestic patent application authorization, and regional GDP are the top five dominant factors that influence agricultural drought disasters. These 5 factors correspond to 5 secondary indexes including agriculture development, meteorological conditions, water conservancy conditions, water saving consciousness, and basic socio-economic conditions, respectively. This also illustrates the complexity of the influencing factors of agricultural drought disasters and indicates the applicability of the index system constructed in this paper.
Qian et al. (2016) analyzed the relationships between agricultural drought and climate factors based on Pearson correlation coefficient using vegetation condition index data recorded from 1982 to 2010; they found that temperature and wind velocity were the main factors that influenced drought in the agricultural areas of China. Liu et al. (2021) analyzed meteorological factors on droughts in Xilinguole Grassland with a combination of Pearson correlation analysis and t-tests, and result shows that temperature, precipitation, water vapor pressure, and solar radiation are the key factors. These two studies only considered the effect of meteorological factors based on linear methods, and results showed that temperature and precipitation are the main influencing factors on agricultural drought, which is basically consistent with the results in our paper (Figure 8 and Supplementary Figure S4). However, they neglected the effect of human activities on agricultural drought, as Qian et al. (2016) discussed that the correlation between VCI and precipitation was low, possibly due to the widespread use of artificial irrigation technology, which reduces the reliance of agricultural areas on precipitation. Zhang et al. (2021) identified influencing factors of regional agricultural drought vulnerability during the period from 2012 to 2018 in Henan Province based on grey trend relational analysis method, and they found that the influencing factors mainly related to natural resources, agricultural industrial structure, agricultural attention, agricultural water efficiency, residents’ awareness of water conservation, and water and soil conservation measures. This study explored influencing factors of agricultural drought considering both natural and human factors based on a nonlinear method, which is quite similar to our research, and the important impact of natural resources, agricultural attention, agricultural water efficiency, and residents’ awareness of water conservation is also indicated in our results. All aforementioned studies explored the dominant influencing factors on agricultural drought, and the results are different since influencing factors considered are different. However, few research studies have investigated how these factors impact agricultural drought.
ALE plots were adopted to interpret RF algorithm for revealing how key factors impact agricultural drought disasters in our paper, and we find that there is a negative linear correlation between agricultural drought disasters and precipitation basically, but a non-significant jump point can still be observed at 1,000 mm, showing that when precipitation exceeds 1,000 mm, the intensity of agricultural drought disasters will decrease more significantly. This is an important reason for the low intensity of agricultural drought disasters in southeast coastal China, such as Jiangsu, Shanghai, Zhejiang, Fujian, Guangdong, and Hainan. Moreover, agricultural drought disaster negatively correlates with domestic patent application authorization and regional GDP, and we suppose that domestic patent application authorization is a quantifiable index indicating scientific and technological innovation, and that regional GDP is an excellent index indicating economic development. They play a great role in promoting the reduction of agricultural drought disasters at the beginning of the growth of scientific and technological innovation and economic development, while during the development of economy, science and technology reaches a certain level; for example, in our case, domestic patent application authorization equals 20,000, regional GDP equals 150 trillion yuan, and the promotion effect of economy, and science and technology on agricultural drought reduction will slow down. The responses of agricultural drought disasters to total sown area of crops and effective irrigation area are similar and can be basically divided into two stages. The first stage mainly corresponds to the stage when China’s economy and society have not yet developed rapidly. Total sown area of crops and effective irrigation area are low, and the ability of science and technology to support drought disaster response is also poor. Therefore, with the increase of total sown area of crops and effective irrigation area, agricultural drought disasters are also increasing. The second stage mainly corresponds to the stage of rapid economic and social development in China. Total sown area of crops and effective irrigation area are rising, and the ability of science and technology to support drought disaster response is also significantly enhanced. Therefore, with the increase of crop sown area, the growth rate of agricultural drought disasters slows down or even decreases. The implementation of irrigation measures also effectively mitigates drought events. With the increase of effective irrigation area, agricultural drought disasters are decreasing. Based on the aforementioned analysis, we can present the critical thresholds for agricultural drought disaster prevention and control in China: total sown area of crops >4 million hectares, effective irrigation area >1 million hectares, domestic patent application authorization >20,000, and regional GDP >150 trillion yuan.
Chen et al. (2018) explored the relationship between socioeconomic factors and grain vulnerability to drought in China covering the period of 1949–2015 using the method of locally weighted regression plots. Result shows that irrigated area rate and GDP in agriculture have a generally monotonous, linear, and positive relationship with grain sensitivity of drought, which means with the increase of irrigated area rate and GDP in agriculture, sensitive crop production to droughts decreases. This result is basically consistent with the effect of the second stage of effective irrigation area and regional GDP on agricultural drought disasters presented in our paper. Pogson et al. (2012) carried out sensitivity analysis based on a crop model in the UK, and results showed that with the increase of precipitation, relative crop yield is increasing with an S-curve shape. This result is close to the negative relationship between precipitation and agricultural drought disasters presented in our paper.
In addition, although other factors do not show significant influence on agricultural drought disasters, their ALE plots can still reflect their effect since ALE plots have already removed the interference of relevant factors. For example, as can be seen from Figure 9 and Supplementary Figure S5, agricultural drought disasters is negatively correlated with F4 (water production modulus), but positively correlated with F8 (rural population).
Furthermore, it is worth noting that although R2 of cross-validation and test for RF models are not high (<0.7), the relationship between influencing factors and target variables based on Monte Carlo simulation is relatively stable (Figure 9 and Supplementary Figure S5). The purpose of this paper is to filter out the principal influencing factors of agricultural drought disasters, so the constructed RF model can fully meet this requirement. However, the accuracy of cross-validation and test is not high, which also shows that the input features cannot fully explain the variance of drought-affected area and drought-suffering area. It is necessary to further improve the input features to predict agricultural drought disasters in the future.
From the analysis of agricultural drought disasters in China, we can perceive that the north–south spatial pattern of agricultural drought is remarkable. Next, we will use unsupervised learning method to further refine agricultural drought disaster zoning. On this basis, based on RF algorithm, we will explore the differences of the key influencing factors of agricultural drought disasters in different zones. In addition, we will further analyze the occurrence and development process of agricultural drought disasters from the perspective of physical causes, and explore the relationship between meteorological drought, hydrological drought, and agricultural drought in near-natural areas and areas affected by human activities, so as to deepen the understanding of drought disasters and provide scientific basis for drought event monitoring, evaluation, early warning, and prediction.
6 Conclusion
In this study, we analyzed the spatial–temporal pattern and evolution characteristics of agricultural drought disasters in China based on the Mann–Kendall test, and applied Random Forest algorithm by integrating Gini importance, permutation feature importance, and accumulated local effects plot to quantify the role of natural and human factors on agricultural drought disasters. The constructed RF model can adequately meet the requirement to filter out the key factors of agricultural drought disasters, reveal the nonlinear response of agricultural drought disasters to the principal drivers, and identify the critical thresholds for agricultural drought disaster prevention and control.
The following conclusions can be drawn from this study:
1) Agricultural drought disaster has been fluctuating since 1950, which can be roughly divided into three stages: 1950–1980 with a significant upward trend, 1981–2000 with a non-significant upward trend, and 2001–2020 with a significant downward trend.
2) The spatial pattern of agricultural drought disaster tends to decrease in severity from north to south. Eight northern provinces including Inner Mongolia, Gansu, Jilin, Shaanxi, Hebei, Heilongjiang, Shandong, and Henan and three southern provinces including Yunnan, Hubei, and Hunan are greatly affected by drought. Among them, agricultural drought disasters in Shaanxi, Hebei, Shandong, Hunan, and Henan present a significant downward trend, while drought in Inner Mongolia, Gansu, Jilin, Heilongjiang, Yunnan, and Hubei shows a non-significant downward trend.
3) Total sown area of crops, precipitation, effective irrigation area, domestic patent application authorization, and regional GDP are the top 5 dominant factors influencing agricultural drought disasters.
4) Agricultural drought disasters have a negative correlation with precipitation, domestic patent application authorization, and regional GDP, and the nonlinear responses of agricultural drought disasters to total sown area of crops and effective irrigation area can be basically divided into two stages. In the first stage, with the increase of feature value, agricultural drought disaster is also increasing. In the second stage, with the increase of feature value, agricultural drought disaster is growing slow or just decreasing.
5) The critical thresholds for agricultural drought disaster prevention and control in China are as follows: total sown area of crops >4 million hectares, effective irrigation area >1 million hectares, domestic patent application authorization >20,000, and regional GDP >150 trillion yuan.
From these insights, we propose that more attention should be paid in northern China and three southern provinces including Yunnan, Hubei, and Hunan, and all provinces should further improve their response ability to heavy drought disasters. Furthermore, to improve the prediction ability of the RF model, it is necessary to integrate more knowledge about agricultural drought disasters. This implies that a better understanding of the role of factors on agricultural drought disasters and a better understanding of the development process of agricultural drought disasters complement each other.
Data Availability Statement
The original contributions presented in the study are included in the article/Supplementary Material, further inquiries can be directed to the corresponding author.
Author Contributions
XD and GW contributed to conception and design of the study. XD organized the database. XD performed the statistical analysis. XD and GW wrote the first draft of the article. XD, JZ, and XL wrote sections of the article. XD, GW and HY contributed to article revision, read, and approved the submitted version.
Funding
This study was financially supported by the National Key R&D Program of China (2017YFA0605002, 2021YFC3201100), the National Natural Science Foundation of China (41830863, 52121006), the Belt and Road Fund on Water and Sustainability of the State Key Laboratory of Hydrology-Water Resources and Hydraulic Engineering, China (2020nkzd01, 2021490211), and the Special Fund for Basic Scientific Research of Nanjing Hydraulic Research Institute (Y522002).
Conflict of Interest
The authors declare that the research was conducted in the absence of any commercial or financial relationships that could be construed as a potential conflict of interest.
Publisher’s Note
All claims expressed in this article are solely those of the authors and do not necessarily represent those of their affiliated organizations, or those of the publisher, the editors, and the reviewers. Any product that may be evaluated in this article, or claim that may be made by its manufacturer, is not guaranteed or endorsed by the publisher.
Acknowledgments
Hersbach et al. (2019) was downloaded from the Copernicus Climate Change Service (C3S) Climate Data Store. The results contain modified Copernicus Climate Change Service information 2020. Neither the European Commission nor ECMWF is responsible for any use that may be made of the Copernicus information or data it contains. The authors would like to acknowledge editors and reviewers who proposed valuable comments that helped us to improve the article.
Supplementary Material
The Supplementary Material for this article can be found online at: https://www.frontiersin.org/articles/10.3389/fenvs.2022.820615/full#supplementary-material
References
Apley, D. W., and Zhu, J. Y. (2016). Visualizing the Effects of Predictor Variables in Black Box Supervised Learning Models. Available at: https://arxiv.org/abs/1612.08468.
Başakın, E. E., Ekmekci̇oğlu, Ö., and Ozger, M. (2019). Drought Analysis with Machine Learning Methods. Pamukkale J. Eng. Sci. 25 (8), 985–991. doi:10.5505/pajes.2019.34392
Berghuijs, W. R., Hartmann, A., and Woods, R. A. (2016). Streamflow Sensitivity to Water Storage Changes across Europe, European Geosciences Union General Assembly. Geophys. Res. Lett. 43, 1980–1987. doi:10.1002/2016gl067927
Blauhut, V., Stahl, K., Stagge, J. H., Tallaksen, L. M., De Stefano, L., and Vogt, J. (2016). Estimating Drought Risk across Europe from Reported Drought Impacts, Drought Indices, and Vulnerability Factors. Hydrol. Earth Syst. Sci. 20 (7), 2779–2800. doi:10.5194/hess-20-2779-2016
Cancelliere, A., Mauro, G. D., Bonaccorso, B., and Rossi, G. (2006). Drought Forecasting Using the Standardized Precipitation Index. Water Resour. Manage. 21 (5), 801–819. doi:10.1007/s11269-006-9062-y
Chen, H., Liang, Z., Liu, Y., Jiang, Q., and Xie, S. (2018). Effects of Drought and Flood on Crop Production in China across 1949-2015: Spatial Heterogeneity Analysis with Bayesian Hierarchical Modeling. Nat. Hazards 92, 525–541. doi:10.1007/s11069-018-3216-0
Cheng, J., Du, Z., Hu, J. L., and Li, C. S. (2017). Study on the Influencing Factors and Spatial Variation of Agricultural Drought Vulnerability: Based on Six Provinces and One City in the Middle and Lower Reaches of the Yangtze River. Ecol. Economy 33 (9), 188–194. in Chinese.
Dai, M., Huang, S., Huang, Q., Leng, G., Guo, Y., Wang, L., et al. (2020). Assessing Agricultural Drought Risk and its Dynamic Evolution Characteristics. Agric. Water Manag. 231, 106003. doi:10.1016/j.agwat.2020.106003
Dayal, K. S., Deo, R. C., and Apan, A. A. (2018). Spatio-temporal Drought Risk Mapping Approach and its Application in the Drought-Prone Region of South-East Queensland, Australia. Nat. Hazards 93 (2), 823–847. doi:10.1007/s11069-018-3326-8
Fienen, M. N., Nolan, B. T., Kauffman, L. J., and Feinstein, D. T. (2018). Metamodeling for Groundwater Age Forecasting in the Lake Michigan Basin. Water Resour. Res. 54 (7), 4750–4766. doi:10.1029/2017wr022387
Fisher, A., Rudin, C., and Dominici, F. (2019). All Models Are Wrong, but Many Are Useful: Learning a Variable's Importance by Studying an Entire Class of Prediction Models Simultaneously. J. Mach. Learn. Res. 20 (177), 1–81. arXiv:1801.01489.
Grömping, U. (2020). “Model-Agnostic Effects Plots for Interpreting Machine Learning Models.” Reports in Mathematics, Physics and Chemistry: Department II. Report 1/2020.
Guidotti, R., Monreale, A., Ruggieri, S., Turini, F., Giannotti, F., and Pedreschi, D. (2019). A Survey of Methods for Explaining Black Box Models. ACM Comput. Surv. 51 (5), 1–42. doi:10.1145/3236009
Gupta, H. V., and Nearing, G. S. (2015). Debates—the Future of Hydrological Sciences: A (Common) Path Forward? Using Models and Data to Learn: A Systems Theoretic Perspective on the Future of Hydrological Science. Water Resour. Res. 50, 5351–5359. doi:10.1002/2013wr015096
Han, Z., Huang, Q., Huang, S., Leng, G., Bai, Q., Liang, H., et al. (2021). Spatial-temporal Dynamics of Agricultural Drought in the Loess Plateau under a Changing Environment: Characteristics and Potential Influencing Factors. Agric. Water Manag. 244, 106540. doi:10.1016/j.agwat.2020.106540
Hao, Z., Yuan, X., Xia, Y., Hao, F., and Singh, V. P. (2017). An Overview of Drought Monitoring and Prediction Systems at Regional and Global Scales. Bull. Am. Meteorol. Soc. 98 (9), 1879–1896. doi:10.1175/bams-d-15-00149.1
Hengl, T., Nussbaum, M., Wright, M. N., Heuvelink, G. B. M., and Gräler, B. (2018). Random Forest as a Generic Framework for Predictive Modeling of Spatial and Spatio-Temporal Variables. PeerJ. 6, e5518. doi:10.7717/peerj.5518
Hersbach, H., Bell, B., Berrisford, P., Biavati, G., Horányi, A., Muñoz Sabater, J., et al. (2019). ERA5 Monthly Averaged Data on Single Levels from 1979 to Present. Copernicus Climate Change Service, Climate Data Store Reading. doi:10.24381/cds.f17050d7
Hong, X. (2017). Hydrological Drought Indices and Frequency Analysis Methods and Their Applications. Doctoral thesis. Wuhan (China): Wuhan University.
Huang, S., Huang, Q., Chang, J., Leng, G., and Xing, L. (2015). The Response of Agricultural Drought to Meteorological Drought and the Influencing Factors: A Case Study in the Wei River Basin, China. Agric. Water Manag. 159, 45–54. doi:10.1016/j.agwat.2015.05.023
Javadinejad, S., Dara, R., and Jafary, F. (2020). Analysis and Prioritization the Effective Factors on Increasing Farmers Resilience under Climate Change and Drought. Agric. Res. 10 (3), 497–513. doi:10.1007/s40003-020-00516-w
Ji, S. L., Li, J. F., Du, T. Y., and Li, B. (2019). Survey on Techniques, Applications and Security of Machine Learning Interpretability. J. Comp. Res. Dev. 56 (10), 2071–2096. in Chinese.
Karpatne, A., Atluri, G., Faghmous, J. H., Steinbach, M., Banerjee, A., Ganguly, A., et al. (2017). Theory-Guided Data Science: A New Paradigm for Scientific Discovery from Data. IEEE Trans. Knowledge Data Eng. 29, 2318–2331. doi:10.1109/tkde.2017.2720168
Koch, J., Stisen, S., Refsgaard, J. C., Ernstsen, V., Jakobsen, P. R., and Højberg, A. L. (2019). Modeling Depth of the Redox Interface at High Resolution at National Scale Using Random Forest and Residual Gaussian Simulation. Water Resour. Res. 55 (2), 1451–1469. doi:10.1029/2018wr023939
Kohavi, R., and Provost, F. (1998). Special Issue on Applications of Machine Learning and the Knowledge Discovery Process. Machine Learn. 30, 127–132.
Konapala, G., and Mishra, A. K. (2016). Three-parameter-based Streamflow Elasticity Model: Application to MOPEX Basins in the USA at Annual and Seasonal Scales. Hydrol. Earth Syst. Sci. 20 (6), 2545–2556. doi:10.5194/hess-20-2545-2016
Li, R., Xin, J. F., and Yang, Y. M. (2019). Analysis on the Temporal and Spatial Change of Drought in Northeast China from 1949 to 2017. Water Resour. Hydropower Eng. 50 (S2), 1–6. doi:10.13928/j.cnki.wrahe.2019.S2.001
Liao, Y. M., and Zhang, C. J. (2017). Spatio-temporal Distribution Characteristics and Disaster Change of Drought in China Based on Meteorological Drought Composite index. Meteorol. Monthly 43 (11), 1402–1409. in Chinese.
Liu, W. D., Tang, Z. P., Xia, Y., Han, M. Y., and Jiang, W. B. (2019). Identifying the Key Factors Influencing Chinese Carbon Intensity Using Machine Learning, the Random forest Algorithm, and Evolutionary Analysis. Acta Geographica Sinica 74 (12), 2592–2603. in Chinese.
Liu, X., Zhu, Z., Liu, X., and Yu, M. (2021). Thresholds of Key Disaster-Inducing Factors and Drought Simulation in the Xilinguole Grassland. Ecol. Inform. 64, 101380. doi:10.1016/j.ecoinf.2021.101380
Liu, Z., Li, Q., Nguyen, L., and Xu, G. (2018). Comparing Machine-Learning Models for Drought Forecasting in Vietnam's Cai River Basin. Pol. J. Environ. Stud. 27 (6), 2633–2646. doi:10.15244/pjoes/80866
Lv, J., Gao, H., and Sun, H. (2011). Analysis on the Characteristics and Causes of Drought Disasters in China since the 21st century. China Flood Drought Manag. 21 (05), 38–43. in Chinese. doi:10.16867/j.cnki.cfdm.2011.05.014
Ministry of water resources of China (2019). China Flood and Drought Disaster Bulletin, 2018. Beijing: China Water Power Press. in Chinese.
Molnar, C. (2021). Interpretable Machine Learning. Available at: https://christophm.github.io/interpretable-ml-book/.
Ni, S. H., Gu, Y., Peng, Y. J., Liu, J. N., and Wang, H. L. (2019). Spatio-temporal Pattern and Evolution Trend of Drought Disaster in China in Recent Seventy Years. J. Nat. Disasters 28 (06), 176–181. in Chinese. doi:10.13577/j.jnd.2019.0619
Nourani, V., Baghanam, A. H., Adamowski, J. K., and Kisi, O. (2014). Applications of Hybrid Wavelet-Artificial Intelligence Models in Hydrology: A Review. J. Hydrol. 514, 358–377. doi:10.1016/j.jhydrol.2014.03.057
Orth, R., and Destouni, G. (2018). Drought Reduces Blue-Water Fluxes More Strongly Than green-water Fluxes in Europe. Nat. Commun. 9 (1), 3602. doi:10.1038/s41467-018-06013-7
Pang, S. F., Wei, W., Guo, Z. C., Zhang, J., Jie, B. B., et al. (2019). Agricultural Drought Characteristics and its Influencing Factors in Gansu Province Based on TVDI. Chin. J. Ecol. 38 (06), 1849–1860. in Chinese. doi:10.13292/j.1000-4890.201906.035
Pogson, M., Hastings, A., and Smith, P. (2012). Sensitivity of Crop Model Predictions to Entire Meteorological and Soil Input Datasets Highlights Vulnerability to Drought. Environ. Model. Softw. 29 (1), 37–43. doi:10.1016/j.envsoft.2011.10.008
Probst, P., and Boulesteix, A. L. (2017). To Tune or Not to Tunethe Number of Trees in Random Forest?. arXiv preprint. arXiv:1705.05654.
Qian, X., Liang, L., Shen, Q., Sun, Q., Zhang, L., Liu, Z., et al. (2016). Drought Trends Based on the VCI and its Correlation with Climate Factors in the Agricultural Areas of China from 1982 to 2010. Environ. Monit. Assess. 188 (11), 639. doi:10.1007/s10661-016-5657-9
Raghavendra. N, S. S., and Deka, P. C. (2014). Support Vector Machine Applications in the Field of Hydrology: A Review. Appl. Soft Comput. 19, 372–386. doi:10.1016/j.asoc.2014.02.002
Schwalm, C. R., Anderegg, W. R. L., Michalak, A. M., Fisher, J. B., Biondi, F., Koch, G., et al. (2017). Global Patterns of Drought Recovery. Nature 548 (7666), 202–205. doi:10.1038/nature23021
Shah, D., and Mishra, V. (2020). Integrated Drought Index (IDI) for Drought Monitoring and Assessment in India. Water Resour. Res. 56, e2019WR026284. doi:10.1029/2019wr026284
Shamshirband, S., Hashemi, S., Salimi, H., Samadianfard, S., Asadi, E., Shadkani, S., et al. (2020). Predicting Standardized Streamflow index for Hydrological Drought Using Machine Learning Models. Eng. Appl. Comput. Fluid Mech. 14 (1), 339–350. doi:10.1080/19942060.2020.1715844
Su, B. D., Sun, H. M., Li, X. C., Li, Z. J., Zhang, J. P., Wang, Y. J., et al. (2020). Impact of Climate Change on Terrestrial Water Cycle in China. China J. Atmosphere Sci. 43 (06), 1096–1105. in Chinese. doi:10.13878/j.cnki.dqkxxb.20201014001
Tian, Q., Lu, J., and Chen, X. (2022). A Novel Comprehensive Agricultural Drought index Reflecting Time Lag of Soil Moisture to Meteorology: A Case Study in the Yangtze River basin, China. Catena 209, 105804. doi:10.1016/j.catena.2021.105804
Wang, W. D., Sun, L., Dong, M., Li, F. X., and Liu, M. (2021a). Analysis of Drought Characteristics of Crop Growing Season Based on SPEI in Northeast China. J. Anhui Agric. Sci. 49 (03), 64–68. in Chinese.
Wang, W. D., Sun, L., Pei, Z. Y., Ma, S. J., Chen, Y. Y., Sun, J. Y., et al. (2021b). Effect of Growing Season Drought and Flood on Yield of spring maize in Three Northeast Provinces of China. Smart Agric. 3 (02), 126–137. in Chinese.
West, H., Quinn, N., and Horswell, M. (2019). Remote Sensing for Drought Monitoring & Impact Assessment: Progress, Past Challenges and Future Opportunities. Remote Sensing Environ. 232, 111291. doi:10.1016/j.rse.2019.111291
Wu, B., Ma, Z., and Yan, N. (2020). Agricultural Drought Mitigating Indices Derived from the Changes in Drought Characteristics. Remote Sensing Environ. 244, 111813. doi:10.1016/j.rse.2020.111813
Wu, C. G., Bai, L., Bai, X., Jin, J. L., and Jiang, S. M. (2018). Risk Assessment and Division Model for Regional Drought Disaster Based on Cloud Model and Bootstrap Method. J. Nat. Resour. 33 (04), 684–695. in Chinese.
Wu, J., Lin, X., Wang, M., Peng, J., and Tu, Y. (2017). Assessing Agricultural Drought Vulnerability by a VSD Model: A Case Study in Yunnan Province, China. Sustainability 9 (6), 918. doi:10.3390/su9060918
Yan, H., Wang, S.-Q., Wang, J.-B., Lu, H.-Q., Guo, A.-H., Zhu, Z.-C., et al. (2016). Assessing Spatiotemporal Variation of Drought in China and its Impact on Agriculture during 1982-2011 by Using PDSI Indices and Agriculture Drought Survey Data. J. Geophys. Res. Atmos. 121 (5), 2283–2298. doi:10.1002/2015jd024285
Yang, Q., Luo, G., and Gao, C. (2020). Research Progress of Agricultural Drought from the Perspective of Geography. J. North China Univ. Water Resour. Electric Power (Natural Sci. Edition) 41 (01), 27–34. in Chinese. doi:10.19760/j.ncwu.zk.2020004
Zhang, D., Cao, W., and Qi, B. (2021). Identifying Influencing Factors of Regional Agricultural Drought Vulnerability Based on PSR-TGRC Method. Math. Probl. Eng. 2021, 1–13. doi:10.1155/2021/9933152
Zhang, S. F., Su, Y. S., Song, D. D., Zhang, Y. Y., Song, H. Z., Gu, Y., et al. (2008). The Drought in Chinese History 1949-2000. Nanjing: Hohai University Press. in Chinese.
Zhao, J., Zhang, Q., Zhu, X., Shen, Z., and Yu, H. (2020). Drought Risk Assessment in China: Evaluation Framework and Influencing Factors. Geogr. Sustainability 1 (3), 220–228. doi:10.1016/j.geosus.2020.06.005
Zhou, Z., Shi, H., Fu, Q., Ding, Y., Li, T., and Liu, S. (2021). Investigating the Propagation from Meteorological to Hydrological Drought by Introducing the Nonlinear Dependence with Directed Information Transfer index. Water Res. 57, e2021WR030028. doi:10.1029/2021WR030028
Keywords: agricultural drought disaster, drought impacts, spatial–temporal pattern, influencing factors, human activities, random forest, feature importance, ALE plots
Citation: Deng X, Wang G, Yan H, Zheng J and Li X (2022) Spatial–Temporal Pattern and Influencing Factors of Drought Impacts on Agriculture in China. Front. Environ. Sci. 10:820615. doi: 10.3389/fenvs.2022.820615
Received: 23 November 2021; Accepted: 03 February 2022;
Published: 31 March 2022.
Edited by:
Zhenzhong Zeng, Southern University of Science and Technology, ChinaReviewed by:
Shanlei Sun, Nanjing University of Information Science and Technology, ChinaJianfeng Li, Hong Kong Baptist University, Hong Kong SAR, China
Copyright © 2022 Deng, Wang, Yan, Zheng and Li. This is an open-access article distributed under the terms of the Creative Commons Attribution License (CC BY). The use, distribution or reproduction in other forums is permitted, provided the original author(s) and the copyright owner(s) are credited and that the original publication in this journal is cited, in accordance with accepted academic practice. No use, distribution or reproduction is permitted which does not comply with these terms.
*Correspondence: Guoqing Wang, Z3F3YW5nQG5ocmkuY24=