 Lifen Cheng
 Song Song
 Yufeng Xie1
- 1School of Geography and Remote Sensing, Guangzhou University, Guangzhou, China
- 2Southern Marine Science and Engineering Guangdong Laboratory (Guangzhou), Guangzhou, China
In this study, we examined the temporal and spatial trends of water utilization efficiency in the highly developed Guangdong Province based on a data envelopment analysis (DEA) model and Malmquist index, trying to evaluate and predict the water utilization status in prefecture-level cities from the input–output perspective. The results showed that the water utilization efficiency in Guangdong Province in 2012–2018 was on a fluctuating upward trend, although the utilization efficiency had not reached the DEA efficiency; spatially, the water utilization efficiency in Guangdong Province was relatively high in the Pearl River Delta and the surrounding cities, but low in the Western Guangdong region; in the perspective of efficiency decomposition factors, technological change was the most pervasive driving force of the water utilization efficiency. Pearl River Delta and Northern Guangdong made progress in productivity due to the advantages of scale expansion benefit. Eastern Guangdong achieved improvement in all-over parameters and made the largest growth in water utilization efficiency, while Western Guangdong basically profited from organizational management during the study period; the prediction analysis revealed a continuous increase in the water utilization efficiency in Guangdong Province during 2019–2025 with an average annual growth rate of about 0.6%, benefiting mainly from the technological innovation and secondly from management renewal, while scale expansion benefit tended to decline. Furthermore, spatial heterogeneity exhibited a decreasing tendency in the future owing to the rapid water utilization efficiency increase in the Western and Eastern Guangdong. It is suggested that the technological innovation and the integrated management capability in water use should be paid more attention to enhance the water utilization efficiency in Guangdong Province. Achieving a balance between economic growth and water resource protection, and promoting the sustainable development of the nature-economy-society compound system is of the utmost priority in Guangdong.
Introduction
Water is the fundamental resource for the living organism, and the indispensable ingredient of animate and non-animate systems on earth. Water resources serve as the basic element to the national social-economic production, and at the same time support the healthy evolution and beneficent circulation of ecological processes. Unreasonable water use will inevitably bring restrictions on ecosystem health, socioeconomic development, and even human survival. Water shortage has become a bottleneck problem restricting economic development and influencing the population’s livelihood in China and the world (Chen et al., 2020). It was estimated that more than two thirds of cities in China are in short supply of water resources, while half of them are confronting serious water shortages (Wan and Zhang, 2012), while globally around 4 billion people are bedeviled by severe water shortages (Khaskheli et al., 2021; Salehi, 2022). In the past decades, China has been suffering a series water related stress, including a sharp water demand surge, rapid water quality deterioration, and continuous water environment degradation due to long-term and high-intensity exploitation of water resources. Considering the integrated impact of climate change, population growth, and industrialization, the conflict between water demand and supply will be more acute, especially in the highly developed regions.
The United Nations’ 2030 Agenda for Sustainable Development clearly states the direction for the sustainable development of water resources, by emphasizing that “every country need to ensure the sustainable supply of fresh water, greatly reduce the number of people suffering from water stress, and improve water-use efficiency by 2030, ” to alleviate the ever-growing pressure in water resources and water environments (Adeel, 2017). Accurate evaluation and gradual improvement of the water utilization efficiency (WUE) are the basic steps to facilitate the sustainable development of water resources. The WUE is concomitant with labor and capital (Ding et al., 2019), and is defined as the economic value of products manufactured per unit of water resources consumed (Liu et al., 2020) WUE is closely associated with a country’s economic strength and scientific-technical advancement. The United Nations has listed China as one of the 13 countries with severe water shortage, due to the low per capita water availability (less than one-quarter of the world’s average level) and the inferior WUE compared with those of other countries. In the United States, however, the development, utilization, and management of water resources have reached the world’s leading level since the 1930s (Fan et al., 2008). How to improve the WUE has become one of the primary concern of researchers, policy makers, and business leaders to relieve China’s water resource crisis.
Researchers in China and worldwide have primarily evaluated WUE on a variety of spatial and temporal scales. Existing research mainly focuses on the comparation of WUE in different industrial sectors and the suitability of various evaluation methods (García-Valiñas and Muñiz, 2007; Sun and Yang, 2019; Qi and Song, 2020; Shi et al., 2021). WUE showed significant variation among regions and cities from different perspectives, and wide fluctuation over time can also be witnessed due to the productivity and economic structure alteration (Chen et al., 2018; Qiu and Sheng, 2020). Spatially, WUE is highest in eastern China, followed by central China, while western China was the lowest in efficiency (Han et al., 2018). WUE of cities is not only related to their economic strength, but also connected to the water management level and the local physical endowment (Zhu and Tang, 2020). In general, the WUE is significantly lower in the agriculture sector than the industry and service sectors (Geng et al., 2019; Huang et al., 2021), higher in water-deficient or vulnerable regions than in water-rich regions (Guo et al., 2019), and lower in cities and towns than in rural areas (Hai et al., 2018).
In recent years, researchers have continuously renewed the evaluation methods for WUE. They have adopted a variety of methods including data envelopment analysis (DEA), stochastic frontier analysis (SFA) (Mu et al., 2016), the technique for order preference by similarity to ideal solution (TOPSIS) entropy weight fuzzy matter-element model (Liu et al., 2018), and the projection pursuit method (Fu et al., 2012), etc.. Among all these methodologies, DEA tends to be superior in evaluating multi-input and multi-output decision-making units (DMUs) based on a mathematical programming method, without dimensionless processing of data, prior identification of functional relationships, or setting non-subjective weights to each parameters (Wang et al., 2018a). DEA and its modified methodology gained extensive application worldwide, to comprehensively evaluate water use and assist decision-making (Hu et al., 2018; Gautam et al., 2020; Laureti et al., 2021). The national, provincial, and catchment research of WUE based on the methodology mentioned above reached broad consensus in China that the WUE is steadily improving, but still remains at a low level in general (Mu et al., 2016; Hai et al., 2018; Geng et al., 2019; Guo et al., 2019). Much more effort should be made to promote the construction of a water-saving society.
The WUE in Guangdong Province is slightly lower compared with the eastern metropolitan area (Sun and Liu, 2009; Zhang and Wu, 2020). The average WUE in Guangdong was only 26.9% of the national average in 2000, which increased to 31.9% in 2011. The utilization degree and reliability of water resources in Guangdong Province are restricted by the frequent droughts and floods, the limited water supply facilities, as well as the inadequate adjustment capacity. Apart from that, the widespread unreasonable water utilization, such as backward water resources management, the huge water resources waste, and improper sewage treatment, pose unprecedent threats on Guangdong water management (Chen, 2014). In addition, the spatial mismatch of the water resources and social-economic power inside Guangdong Province make the optimization of water utilization more challenging. The comprehensive development and utilization rate of water resources was 1.3% in Xijiang River Basin with plenty of water resources but a relatively weak economy, while in Dongjiang Basin where the water is in shortage and the economy is strong, 38.3% of water resources have been exploited. The per capita water availability is less than half of the national average in the core cities such as Guangzhou, Shenzhen, and Zhuhai. Three major practical demands were highlighted in the Water Conservancy and Water Resources Blue Book 2020: Guangdong-Hong Kong-Macao Greater Bay Area Water Resources Research Report: 1) solving the uneven spatial distribution of water resources in the Pearl River Basin, 2) optimizing the allocation of regional water resources development and utilization, and 3) guaranteeing the high-quality economic and social development and construction of the Guangdong–Hong Kong–Macao Greater Bay Area (Gu, 2002; SOHU, 2020).
Altogether, the current status of water resources restricts the sustainable development of Guangdong Province. Researchers and policy makers should comprehensively and systematically analyze the local WUE, clarify the temporal and spatial differentiation and its development trends, and explore strategies for the WUE optimization. Therefore, in this study we examined the WUE in prefectural cities in Guangdong Province during 2012–2018 based on the integrated Data Envelopment Analysis and Malmquist (DEA–Malmquist) model from spatial and temporal perspectives. We revealed the temporal and spatial characteristics of WUE changes in Guangdong Province and made predictions for the years 2019–2025. The study results will provide a theoretical basis and guidance for the guarantee of regional water resources.
Methodology
Study Area
Located in the southernmost region of the Chinese mainland, Guangdong Province has the most abundant light, heat, and water resources in China (Figure 1A). The region is dominated by a subtropical monsoon climate, with an annual average precipitation of 1,789 mm. Owing to the monsoon stability and tropical circulation, the precipitation has considerable temporal and spatial variability (SLT, 2020a). The average multiyear total water resources include 182 billion m3 of surface water resources and 45 billion m3 of groundwater resources with unbalanced temporal and spatial distributions. The topography of Guangdong is high in the north and low-lying in the south, resulting in severe flooding risk in the highly developed southern region, and low water storage in coastal terraces and low hilly areas. Due to the extensive non-point source pollution and ever-growing waste water effluence, the middle and lower reaches of Pearl River Delta are confronting with quality-induced water shortage. Guangdong Province is covered by Pearl River and its branches the Xijiang River, Dongjiang River, and Beijiang River systems (SLT, 2020b). Correspondingly, the province can be divided into four regions based on territory: the Pearl River Delta, eastern Guangdong, western Guangdong, and northern Guangdong (Figure 1B).
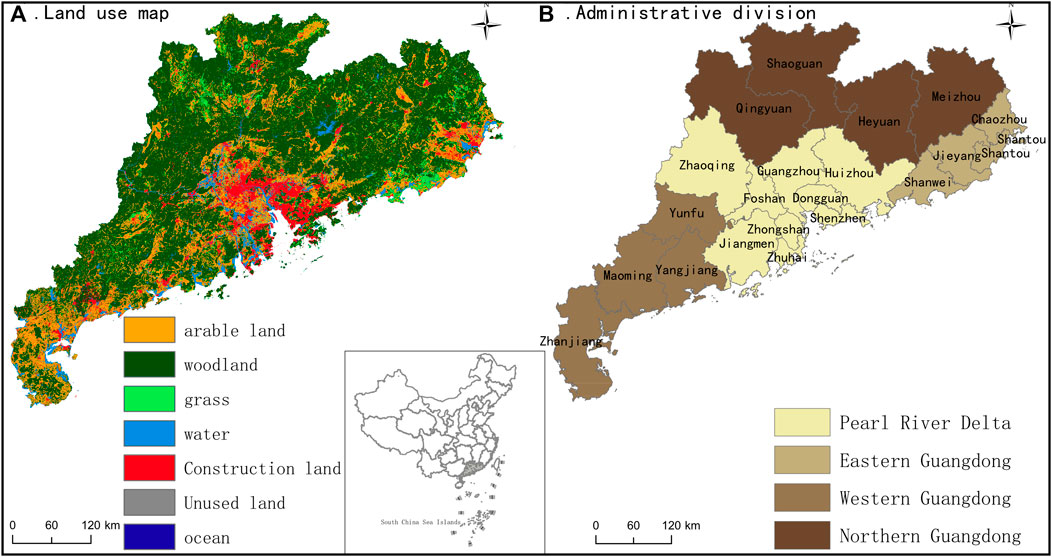
FIGURE 1. Land use (A) and administrative division (B) map in Guangdong Province.
Research Methods
In this study, we employed the integrated DEA–Malmquist model to evaluate the WUE of Guangdong Province and each prefecture-level city from the years 2012–2018. The spatial/temporal variations and patterns of WUE were then analyzed using GIS spatial analysis and mathematical statistical analysis. The WUE prediction from 2019 until the end of the 14th Five-Year Plan period was carried out based on the annual growth rate estimation and integrated ARIMA and grey prediction model.
DEA–BCC Model
The DEA-CCR model was proposed in 1978 by American operational research experts Charness, Coopor, and Rhodes (CCR is the abbreviation of the developers) analyzing the relative efficiency during production process. DEA-CCR model assumes the production exhibits constant returns to scale, which means, for example the increase of 1% input will result in 1% production growth. This is clearly contrary to realism considering the scale effect of most industry and energy sectors. In the middle of 1980s, Banker, Charnes, and Cooper established a renovated DEA-BBC model, indicating that the production tends to show variable returns to scale during the estimation of the Decision-Making Units (DMUs) technology efficiency (Banker et al., 1984). The comprehensive efficiency can be correspondingly expressed by the multiplication of technical efficiency and scale efficiency (crste = vrste*scale). In addition, researchers can set the DEA-BBC model into input-oriented, output-oriented, or non-oriented according to the specific research objectives, where the orientation classifies the variable into optimized inputs, undesirable outputs, and overall outputs. Classically, the non-oriented model was more frequently adopted in environmental analysis, owing to its ability to deal with both desirable and undesired outputs simultaneously. DEA-BBC model has been widely applied in various professions, including water resources, energy industry, medical care, education, and banking (Castano and Cabanda, 2007; Sala-Garrido et al., 2012; Othman et al., 2016; Siampour et al., 2021; Sun et al., 2021), and was proven to be highly stable and reliable. As a result, we analyzed the WUE of Guangdong Province based on the DEA–BCC model in this study, trying to find out how to realize the high-efficiency utilization of water resources by reducing water resources and other component inputs, optimizing the desirable output and minimizing the negative output (Li and Cui, 2009). The model formula is shown below:
Where, xij refers to the ith input of the jth decision-making unit (DMU), yrj means the rth output of the jth DMU, λj presents the planning decision variable, n is the DMU, ε demonstrates the non-Archimedean infinitesimal, and si- and sr+ indicate the slack variable vectors. The effective value of the DMU is θ.
Generally, the DMU is considered to be DEA-efficient when θ = 1, and si- = sr+ = 0. In such a situation, the DMU is optimal regardless of input or output perspective, and the production process reaches technical and scale efficiency. If θ = 1, and one of the slack variable vectors is greater that 0, then the DMU is considered to be weakly efficient, the production process is either technically inefficient or scale inefficient. If θ < 1, then the DMU is DEA-inefficient, neither technical efficiency nor scale efficiency is realized.
Malmquist Index Model
The Malmquist index model was developed based on the DEA model, which can reflect the dynamic change of the DMU efficiency by estimating the efficiency of input and output using the distance function. This model usually assumes that input elements remain unchanged and the output need to be optimized. Distance functions in different periods are established to represent the corresponding temporal efficiency, and each decision unit is compared with the optimized front plane to construct the dynamic model of productivity.
The Malmquist index can be decomposed into technological efficiency change (effch) and technological progress (techch) indices. The effch can be further divided into pure efficiency change (pech) and scale efficiency change (sech) indices. These decompositions indicate that the productivity growth is for one thing caused by the development of science and technology (techch), and for another comes from the organization and management progress (effch), including the pure efficiency change (pech) and scale effect improvement (sech). Thus, Effch represents the level of organization and management and the ability to comprehensively allocate resources across the region. The techch refers to the development and progress of science and technology related to the development and use of water resources. Pech primarily means the production efficiency of enterprises affected by factors such as management and technology, and the sech is the efficiency change caused by the expansion or reduction of production scale.
The indices were decomposed as follows:
where
Data Sources
The data we used in this study were primarily collected from the Guangdong Statistical Yearbook 2012–2020, the Water Resources Bulletin of Guangdong Province 2012–2020, and the statistical yearbooks of various prefecture-level cities in Guangdong Province of the corresponding year.
Index Selection
DEA evaluates the decision-making problem of water resource utilization with multiple inputs and outputs, showing high flexibility and simplicity, irrespective of the correlation between variables, the inefficiency distribution, and the type of production process (Nataraja and Johnson, 2011). It is not necessary to set a specific production function or to specify the distribution of the error term. It is worth mentioning that the ratio cannot serve as an input or output indicator, meanwhile the selected indicators should be authentic reflecting a basic production relationship. According to the connotation of WUE and the data accessibility of Guangdong, combined with the relevant studies, we took labor and water resource as input variables, and the economic benefit and wastewater as output index (Table 1) (Hu et al., 2019; Wang et al., 2021). In terms of water resource input, we primarily focus on the industrial water use, domestic water for residents and eco-environmental water use, considering the highly developed economy, densely concentrated population, and the environment-friendly development orientation of Guangdong province.

TABLE 1. Output-input indices of water-use efficiency.
Index Prediction
Population growth and socio-economic development in Guangdong Province are supposed to maintain at high rates during the 14th Five Year Plan Period (2021–2025), which will inevitably intensify the conflicts between water supply and demand among different regions and sectors. It is thus essential to forecast the WUE of the corresponding period. We estimated the various indices of Guangdong Province in 2019–2025 based on ARIMA and the grey prediction model, and then evaluated WUE in Guangdong Province for 2019–2025 using the DEA–Malmquist model (Table 2).
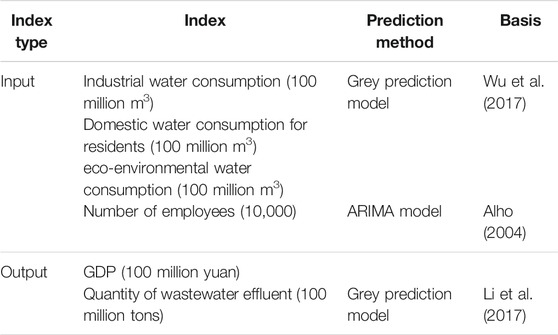
TABLE 2. Prediction methods and sources of index data.
The flow chart of this research is shown as Figure 2.
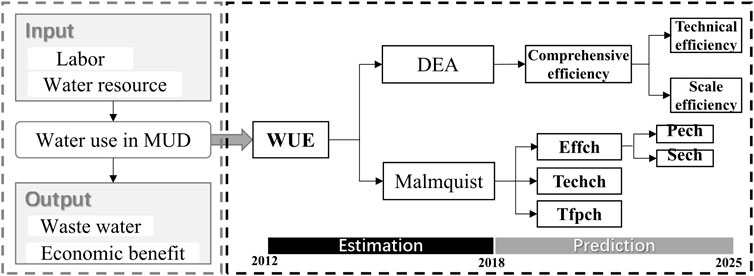
FIGURE 2. The flowchart of this study.
Results and Discussion
Temporal Variation of DEA Efficiency in Guangdong Province
DEA efficiency mainly represents the overall WUE of the entire region. According to the results of the DEA–Malmquist model, the annual overall WUE in Guangdong Province was on an increasing trend during the study period, from 0.896 in 2012 to 0.936 in 2018 (as shown in Figure 3). In terms of subregion, the WUE in the Pearl River Delta was the highest, followed by that in northern Guangdong, and eastern Guangdong, while western Guangdong showed the lowest in WUE. Apart from spatial variation, the WUE significantly fluctuated over time in different regions. The WUE in the Pearl River Delta kept to around 0.9, significantly higher than that in other regions during the whole study period. In northern Guangdong, the WUE was increased gradually to 0.943 in 2016 and then declined by nearly 9% in the following 2 years. The WUE in eastern Guangdong was relatively low and showed large fluctuations, while in western Guangdong the averaged WUE was 0.712, much lower than other sub regions. In perspective of the decomposed efficiency, all the regions reached technological efficiency except western Guangdong. Pearl River Delta and eastern Guangdong exhibited the highest and lowest scale efficiency respectively (Table 3).
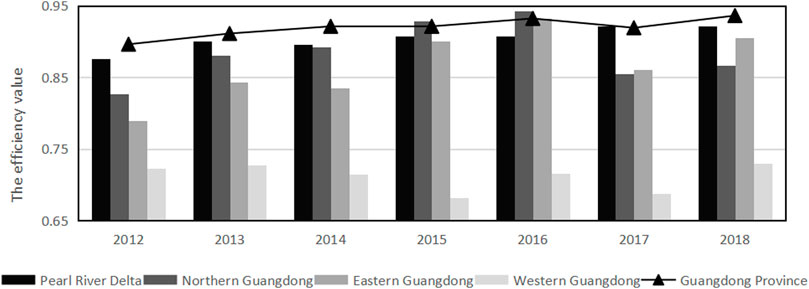
FIGURE 3. Average WUE in different regions of Guangdong Province.
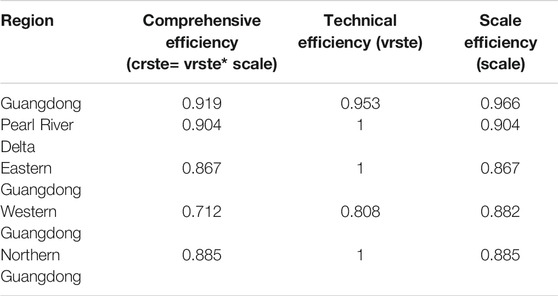
TABLE 3. Averaged decomposed WUE of various regions in Guangdong Province from 2012 to 2018.
According to the Malmquist decomposition model, the annual average water resources total factor productivity change (tfpch 1.005), the effch (1.008), pech (1.004), and sech (1.004) values in Guangdong Province were all larger than 1, while the annual averaged techch (0.997) were lower than 1 (Table 4). These results demonstrated that the overall growth of the WUE in Guangdong Province benefitted mainly from the promotion of the comprehensive ability of enterprise organization and management (Effch). Besides, the optimization of regional water allocation ability (pech) and expansion of scale (sech) made accessory contributions to the increasing WUE. In contrast, although the new technologies of water resource conservation and high efficient utilization were widely adopted, the technical limitations for the water resources utilization, indicated by the low techch, were still obvious in Guangdong. Currently, traditional manufacture of extensive type, represented by high water consumption, high water contamination, and high waste water emission still occupies a large proportion in Guangdong. Introduction and implementation of superior technology promoting industrial water resource saving, circulation, and pollution control are strongly recommended to improve the local WUE.
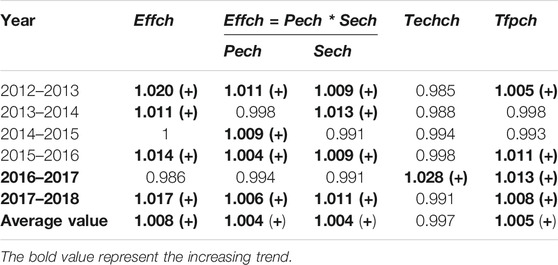
TABLE 4. Malmquist Index and its Decomposition Results in Guangdong Province from 2012 to 2018.
WUE Growth in Typical Years
2016–2017 was a typical period when the WUE growth was driven by strong technology progress, while in other stages the WUE increases were mainly conducive to scale expansion or management advantage. In 2016–2017, the water conservancy investment of Guangdong Province reached 31 billion yuan, creating a new record. Furthermore, the Provincial Water Resources Conservation and Protection Special Fund initiated by the Water Resources Department strongly promotes investment in water related research and development. Financial support and scientific research progress contributed to the construction of water conservancy facilities and the upgradation of water-saving technologies in Guangdong Province and promoted the techch to a large extent, thereby the improvement of WUE was achieved. As shown in Table 4, effch, pech, and sech values in 2016–2017 were all less than 1, which indicates that Guangdong Province made a deficient effort in the resource scale allocation, management methods, and management organization structure compared with scientific investment in this period. In 2018, the effch and other decomposition indices increased to greater than 1. The policies issued in 2018, Guangdong Province Urban Management Regulations (2018 Revision) and Strictest Water Resources Management Assessment Measures Implemented in Guangdong Province, greatly promoted the optimization of resource allocation, management strategy, and organization structure in Guangdong Province. In contrast, the techch value in 2017–2018 was less than 1, which meant the technological innovation was relatively less propulsive. According to the analysis of the typical periods from 2016 to 2018, it is clear that the technical innovation seems be harder to achieve in the annual slice, in contrast to the gradual management or scale effect, but the technical innovation can promote the WUE to a larger extent once it works.
Spatial Pattern of WUE
As shown in Figure 4, only five cities (Guangzhou, Shenzhen, Zhuhai, Zhongshan, and Shaoguan) reached the DEA efficiency in water utilization. As the leading forces of economic development in Guangdong Province, the Guangzhou, Shenzhen, Zhuhai, and Zhongshan were superior to other cities in terms of technological innovation and industrial structure configuration, and their average WUE was higher than surrounding regions. The water resources in western Guangdong were relatively abundant, but the average WUE was low because of many technical developments and physical restrictions.
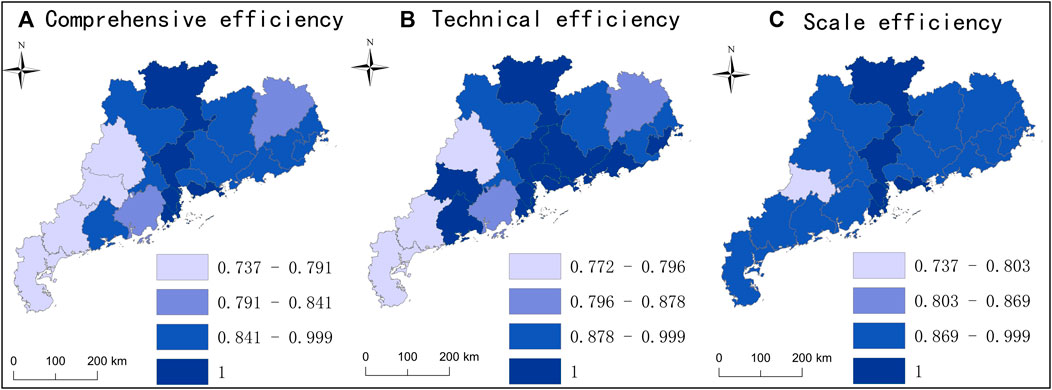
FIGURE 4. WUE of the prefecture-level cities in Guangdong Province in 2012–2018.
From the Malmquist index and its decomposition analysis, about half of the prefecture-level cities had made progress in the WUE during the study period. Among them, The WUE in Jieyang increased with the highest rate in the technological innovation, organizational management, water resource allocation, and scale expansion aspects. In addition, Jieyang was the only city which achieved the comprehensive progress. Despite the organizational management and scale effect of Guangzhou, Shenzhen and Shantou remained at a stable level, the remarkable technological innovation of the three cities promoted the WUE growth, especially Shenzhen, representing the most rapid technological advancement. The WUE increase of Foshan, Maoming, and Shanwei were integrally driven by technological progress and scale expansion. Chaozhou gained momentum from scale expansion, which helped the WUE to continue ascending. Excellent enterprise management, reasonable resources allocation, and stable technical development drove the WUE growth in Meizhou, Zhanjiang, and Qingyuan. Apart from the above mentioned cities, the WUEs of the rest of the regions were decreasing, mainly restricted by the technological degradation, except Zhaoqing, which is hindered by a combination of technological and organizational weakness (Table 5).
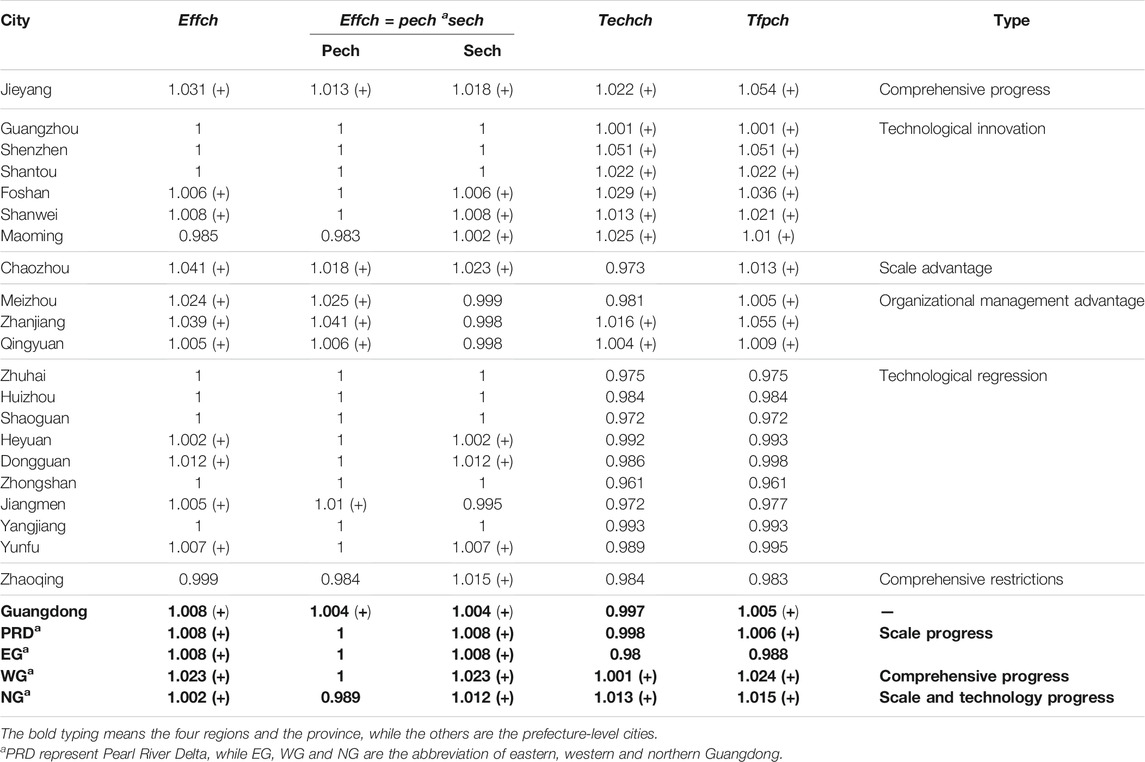
TABLE 5. Malmquist index and its decomposition of average water resources in prefecture-level cities and regions in the last 9 years.
In terms of subregion, the WUE growth of PRD and northern Guangdong were mainly dominated by scale expansion, while eastern Guangdong realized the comprehensive progress of the highest WUE increase due to a strong scale effect, slight technological progress, and stable organizational management. The rising WUE of western Guangdong was driven by similar scale and technological progress, despite the relative deficiency in enterprise management and resources allocation (Table 5).
In general, the technology innovation is the dominant factor controlling the water use efficiency and productivity. Nine and six prefectural cities improved and regressed their water use productivity, respectively, due to the technological parameters. Furthermore, the variation of prefecture city WUE showed strong spatial heterogeneity and spatial agglomeration effect in the study period. For example, the technological regression region was mainly concentrated in middle-east and middle-west region (Figure 5). In the sub region perspective, the Pearl River Delta and northern Guangdong regions were advantageous in the scale expansion effect, the Western Guangdong region had scale and technological preponderance, while the eastern Guangdong region made progress in all-round parameters.
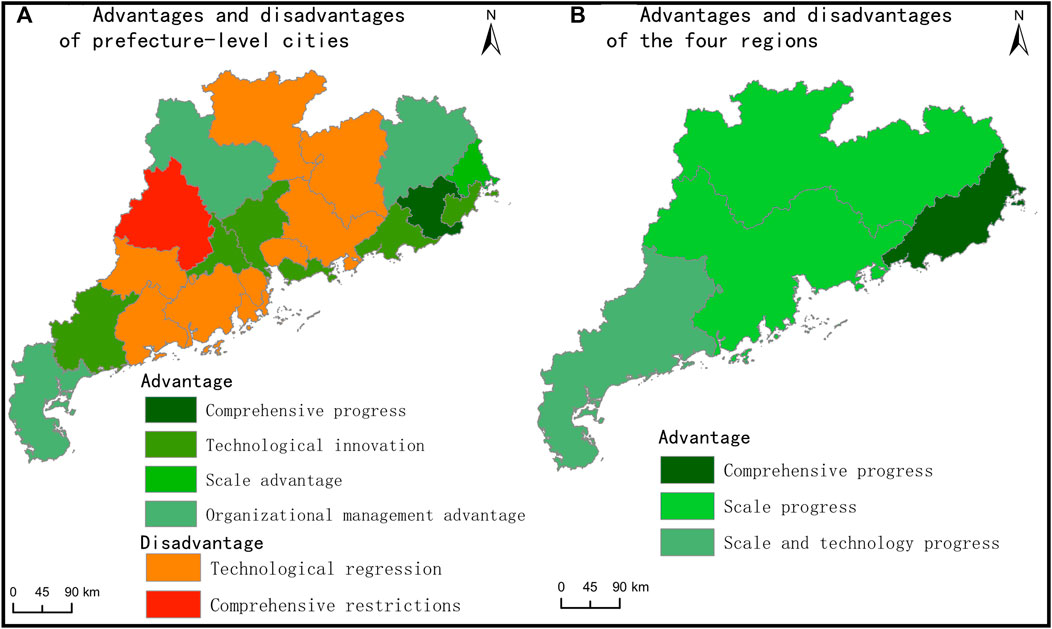
FIGURE 5. Malmquist index and decomposition trend map of water resource utilization in prefecture-level cities in Guangdong Province in the last 7 years.
Prediction on WUE
DEA Prediction
The predictions showed that the WUE in Guangdong Province will continue to improve over time. The average overall efficiency in 2019–2025 would reach 0.933, around 2% higher than the 2012–2018 level, although still falling behind DEA efficiency. With the continuous emphasis on science and technology investment, the technological efficiency would be largely improved. However, the scale efficiency would keep constant or grow slowly limited to the scale benefit decline principle. Spatially, the regions where WUE reached DEA efficiency would extend from the Pearl River Delta to the adjacent western and northern Guangdong regions during 2019–2025. The spatial heterogeneity tends to weaken with the promotion of the WUE (Figure 6).
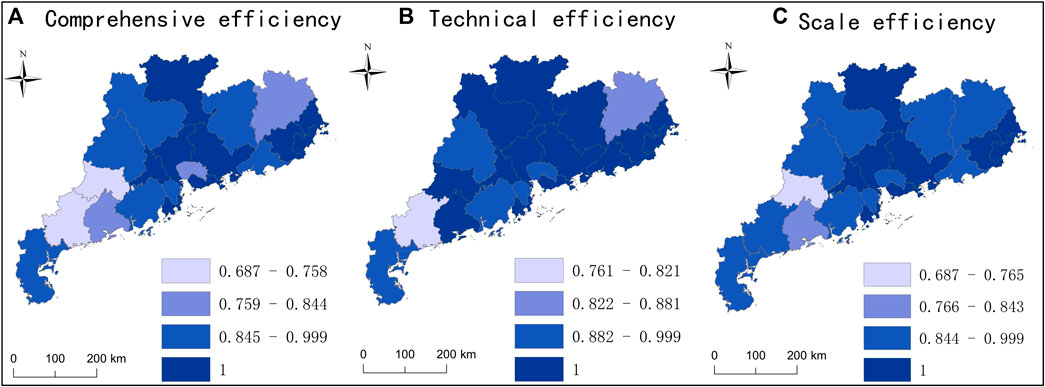
FIGURE 6. Efficiency distribution map in prefecture-level cities in 2019–2025.
Malmquist Prediction
As shown in Table 6, the water resource utilization productivity value was greater than 1, and the average annual growth rate was maintained at 0.4–0.5%, indicating the improvement of the total factor efficiency during the prediction period. On one hand, Techch and Pech serve as the main and secondary driving force for improving efficiency respectively, with the correlation coefficient between technological progress and total factor productivity of water resources reaching 0.863. On the other hand, the sech would improve at the beginning and then enter the scale benefit decline stage, which would restrict the upgrading of productivity. Guangdong Province would make progress in the implementation of water resource saving, protection, and recycle utilization technology. The regional comprehensive resource allocation and enterprise management capabilities are expected to be strengthened.
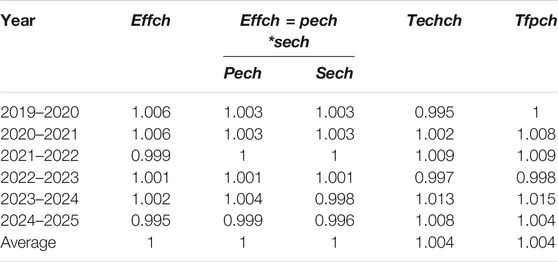
TABLE 6. Malmquist index and its decomposition results in Guangdong Province in 2019–2025.
In terms of spatial pattern, during the 14th Five-Year Plan period, rapid comprehensive growth of the productivity and WUE in Dongguan, Zhanjiang, and Heyuan would be witnessed. Coastal cities including Shenzhen, and Foshan would achieve innovative growth conducive to the development of science and technology. Traditional high water efficiency cities, Guangzhou, Shaoguan, and Zhuhai are threatened by the relatively declined technology innovation and the potential retrogress of the productivity and WUE. Although the organizational management, allocation capability and scale benefit tends to expansion in Jiangmen city, the low technology investment might hinder the local productivity and WUE. All the other cities would suffer a slight decline of overall productivity and WUE, owing to the combined weakness of the resource allocation, technology innovation, enterprise management, or shrinking scale return (Table 7 and Figure 7).
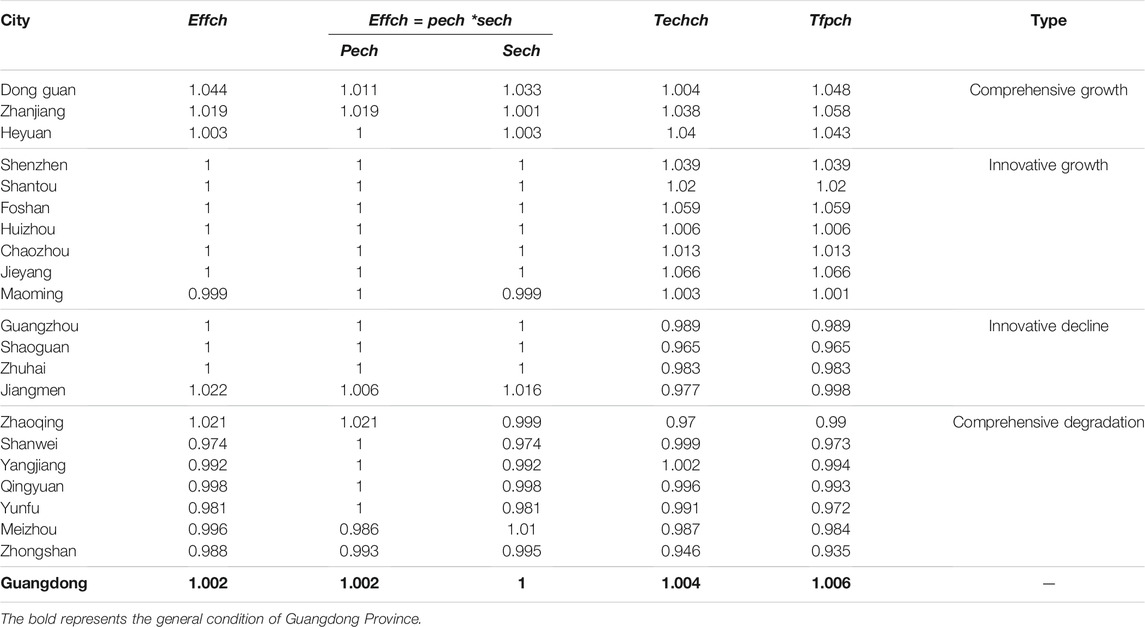
TABLE 7. Average Malmquist index and its decomposition value of cities in Guangdong Province in 2019–2025.
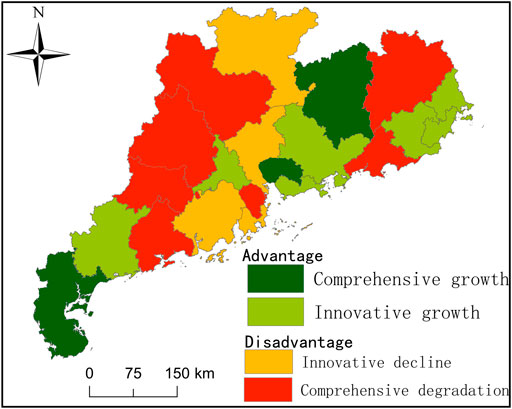
FIGURE 7. Development of predicted WUE in Guangdong Province during 2019–2025.
Significance of Parameters
We conducted correlation and automatic linear modeling regression to analyze the significance of the input and output parameters to the efficiency. The correlation results showed that the output parameter, GDP, and waste water discharge, were correlated with efficiency relatively higher compared to the input parameters. The increasing GDP and its investment to management renewal and technology upgrading promoted the growth of WUE (Table 8).
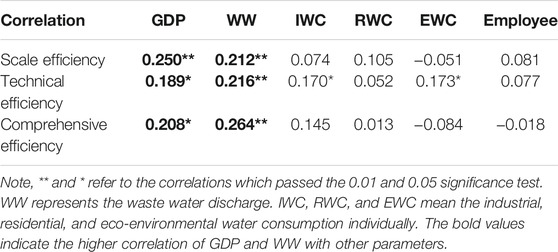
TABLE 8. Average Malmquist index and its decomposition value of cities in Guangdong Province in 2019–2025.
As shown in Figure 8, GDP, the amount of employees and the waste water discharge are the main influencing factors to the WUE. Specifically, scale efficiency was mainly controlled by GDP, while the amount of employees was the strongest influence to the technical and comprehensive efficiency. Waste water discharge and GDP played the secondary role in the technical and comprehensive WUE. New technical approach reducing the employee investment and waste water output would highly improve the technical and comprehensive efficiency in future endeavors. Maintaining the GDP growth under the same or lower water consumption would stimulate the WUE in all perspectives.
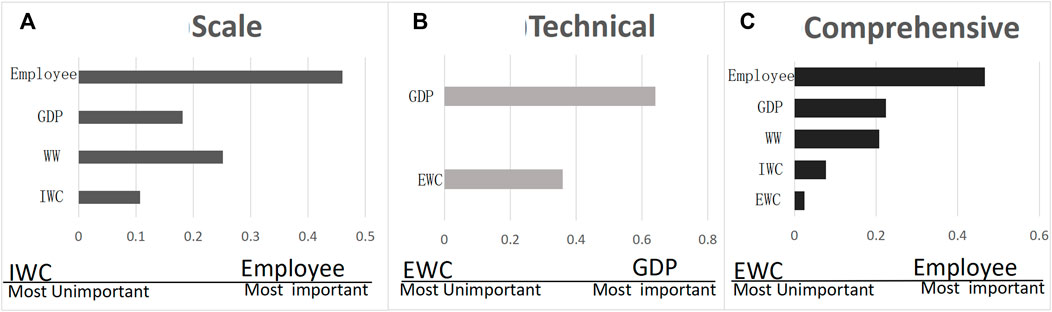
FIGURE 8. Significance of each parameter.
Management Implications
Substantial efforts toward water resource protection and water ecological/environmental control have been made on the national level, which improves the WUE overall. High developed metropolises like Jingjintang (JJT), Yangtze River Delta (YRD) and Peral River Delta (PRD) depict higher WUE index, owing to the more developed water allocation strategy and water utilizing technique. The WUE in Guangdong province is higher than the YRD (Shanghai and Jiangsu), but lower than the JJT region (Liu et al., 2020; Shi et al., 2020). Although some core PRD cities, such as Guangzhou, showed the best decoupling status between the urban economic output and water usage (Wang et al., 2018b), Guangdong Province is still enconfronting with low efficiency problems especially in industry water use. As the one of the leading industry provinces, waste water discharge of Guangdong Province ranks first among all the Chinese Provinces, strongly restricting the further improvement of WUE. Professional disposal techniques are in urgent need to effectively handle the huge wastewater discharge containing nitrogen and other harmful chemicals. Research and development investment in waste water treatment infrastructure and enhancement of wastewater treatment capacity are critical for WUE improvement. In addition, the regional disparities in industrial WUE make new demands on reliable and effective water allocation projects and up-down stream linkage water dispatch. With respect to urban and rural water use, adjusting supply structure, adopting discharge-reducing techniques, and reclaiming domestic waste water might be effective to promote the WUE.
Conclusion
Water is a significant resource supporting socio-economic growth and maintaining environmental health. The water utilization efficiency (WUE) reflected the intensity and potential of water utilization and development. Moreover, improving WUE is conducive to the sustainable development of the economic–social–ecological system on a regional and global scale. In this paper, we evaluate and predict the water utilization efficiency (WUE) in Guangdong Province based on the DEA–Malmquist model. The results revealed the gradual increase of the WUE, from 0.896 in 2012 to 0.936 in 2018. The WUE growth was for one thing stemmed from the scientific and technological progress, and for another driven by the improvement of regional resource allocation capability and the scale expansion benefit. The comprehensive promotion of the enterprise organization and management serves as an important factor affecting the total factor productivity of water resources. In terms of spatial distribution, the WUE in Pearl River Delta was higher than that of northern Guangdong and eastern Guangdong, while western Guangdong was lowest in WUE. Pearl River Delta made WUE progress due to the advantages of organization and management, as well as the scale benefit. WUE in eastern and western Guangdong were basically effective due to the integrated advantages of scale benefit, technological innovation, or organizational management. Northern Guangdong is relatively deficient in water resources, technological innovation, and the allocation of various resources. The spatial heterogeneity of WUE was on decline trend. Prediction analysis suggest that the technological innovation and the integrated management capability in Guangdong Province will be continuously promoted during the 14th Five Year Plan period, while the scale expansion benefit tends to diminish. The WUE and productivity will be comprehensively improved, and the spatial difference will be continually narrowed along time. This study responds to improve the WUE, to alleviate the water resource pressure, and to achieve optimal water use under the rapid regional socioeconomic development. The results provide important perspectives to policy-makers on how to balance the economic growth, the ecological health, and the human-water system, to ultimately pursue the sustainable development.
Data Availability Statement
The original contribution presented in the study are included in the article/Supplementary Material, further inquiries can be directed to the corresponding author.
Author Contributions
SS conceptualized the research and managed the funding; LC was responsible for the software, the calculation and organized the original manuscript; YX contributed in data collection and processing.
Funding
This research is supported by the Guangdong Province Universities and Colleges Pearl River Scholar Funded Scheme (2019), Natural Science Foundation of Guangdong Province (2020A1515011065) and Key Special Project for Introduced Talents Team of Southern Marine Science and Engineering Guangdong Laboratory (Guangzhou) (GML2019ZD0301).
Conflict of Interest
The authors declare that the research was conducted in the absence of any commercial or financial relationships that could be construed as a potential conflict of interest.
Publisher’s Note
All claims expressed in this article are solely those of the authors and do not necessarily represent those of their affiliated organizations, or those of the publisher, the editors and the reviewers. Any product that may be evaluated in this article, or claim that may be made by its manufacturer, is not guaranteed or endorsed by the publisher.
Supplementary Material
The Supplementary Material for this article can be found online at: https://www.frontiersin.org/articles/10.3389/fenvs.2022.819693/full#supplementary-material
References
Adeel, Z. (2017). A Renewed Focus on Water Security within the 2030 Agenda for Sustainable Development. Sustain. Sci. 12, 891–894. doi:10.1007/s11625-017-0476-7
Alho, J. M. (2004). Population Forecasting Theory, Methods and Assessments of Accuracy. The Magnitude of Error Due to Different Vital Processes in Population Forecasts. Int. J. Forecast. 8, 301–314. doi:10.1016/0169-2070(92)90049-f
Banker, R. D., Charnes, A., and Charnes, W. W. (1984). Some Models for Estimating Technical and Scale Inefficiencies in Data Envelopment Analysis. Manage. Sci. 30, 1078–1092. doi:10.1287/mnsc.30.9.1078
Castano, M. C. N., and Cabanda, E. C. (2007). Performance Evaluation of the Efficiency of Philippine Private Higher Educational Institutions: Application of Frontier Approaches. Int. Trans. Oper. Res. 14, 431–444. doi:10.1111/j.1475-3995.2007.00599.x
Chen, T. L. (2014). Changes, Problems and Suggestions of Water Resources in Guangdong Province. People's Tribune (34), 222–223. doi:10.16619/j.cnki.rmlt.2014.34.003 (in Chinese).
Chen, W., Du, J., and Chang, J. J. (2018). Utilization Efficiency of Water Resources in Wuhan Urban Agglomeration. Resour. Environ. Yangtze Basin 27 (06), 1251–1258. doi:10.11870/cjlyzyyhj201806008 (in Chinese).
Chen, X. X., Zhuang, Y. N., Liu, L., and Wang, L. N. (2020). Water Use Efficiency in Shanxi and Shanxi Province Ananlyzed Using the Super Efficiency DEA Model. J. Irrigation Drainage 39 (10), 138–144. doi:10.13522/j.cnki.ggps.2020029 (in Chinese).
Ding, X., Fu, Z., and Jia, H. (2019). Study on Urbanization Level, Urban Primacy and Industrial Water Utilization Efficiency in the Yangtze River Economic Belt. Sustainability 11, 6571. doi:10.3390/su11236571
Fan, X. Z., Chen, H. Z., Zhang, P. N., Chen, H., and Zhang, F. N. (2008). Investigation Report on Water Energy Resources Development and Utilization Management in USA and Canada. China Water Power & Electrification (04), 23–28+36. doi:10.3969/j.issn.1673-8241.2008.04.009 (in Chinese).
Fu, Q., Jiang, Q., and Wang, Z. (2012). “Sustainability Assessment of Regional Water Resources Use Based on PSO-PPE,” in Computer and Computing Technologies in Agriculture V. Editors D. Li, and Y. Chen (Beijing: Springer), 383–390. doi:10.1007/978-3-642-27275-2_43
García-Valiñas, M. A., and Muñiz, M. A. (2007). Is DEA Useful in the Regulation of Water Utilities? A Dynamic Efficiency Evaluation (A Dynamic Efficiency Evaluation of Water Utilities). Appl. Econ. 39 (2), 245–252. doi:10.1080/00036840500428054
Gautam, T. K., Paudel, K. P., and Guidry, K. M. (2020). An Evaluation of Irrigation Water Use Efficiency in Crop Production Using a Data Envelopment Analysis Approach: A Case of Louisiana, USA. Water 12 (11), 31–93. doi:10.3390/w12113193
Geng, Q., Ren, Q., Nolan, R. H., Wu, P., and Yu, Q. (2019). Assessing China's Agricultural Water Use Efficiency in a green-blue Water Perspective: A Study Based on Data Envelopment Analysis. Ecol. Indicators 96, 329–335. doi:10.1016/j.ecolind.2018.09.011
Gu, J. H. (2002). The Causes and Countermeasures of the Prominent Contradiction between Supply and Demand of Water Resources in Guangdong Province. Pearl River (1), 17–20. doi:10.3969/j.issn.1001-9235.2002.01.006 (in Chinese).
Guo, S.-D., Li, H., Zhao, R., and Zhou, X. (2019). Industrial Environmental Efficiency Assessment for China's Western Regions by Using a SBM-Based DEA. Environ. Sci. Pollut. Res. 26, 27542–27550. doi:10.1007/s11356-019-06062-5
Hai, X., Li, W. F., and Han, L. J. (2018). Study on the Domestic Water Use Efficiency between Urban and Rural Areas of Beijing-Tianjin-Hebei Urban Agglomeration, China. J. Water Resour. Water Eng. 29 (02), 27–33. doi:10.11705/j.issn.1672-643X.2018.02.05 (in Chinese).
Han, W. Y., Chen, X. P., Zhang, Z. L., Wang, N. F., and Yu, Y. H. (2018). Analysis on Spatiotemporal Structure of Water Resources Utilization Efficiency of the Orefecture Level Cities and beyond in China. Res. Soil Water Conservation 25 (02), 354–360. doi:10.13869/j.cnki.rswc.2018.02.051 (in Chinese).
Hu, M., Hu, Y., and Yuan, J. (2019). Benchmarking on Water Resource Utilization Efficiency of Prefecture-Level Cities in Jiangxi, China: A Bootstrap-DEA Approach with Three-Stage DEA Models. Environ. Nat. Resour. J. 9, 14. doi:10.5539/enrr.v9n3p14
Hu, Z., Yan, S., Yao, L., and Moudi, M. (2018). Efficiency Evaluation with Feedback for Regional Water Use and Wastewater Treatment. J. Hydrol. 562, 703–711. doi:10.1016/j.jhydrol.2018.05.032
Huang, Y., Huang, X., Xie, M., Cheng, W., and Shu, Q. (2021). A Study on the Effects of Regional Differences on Agricultural Water Resource Utilization Efficiency Using Super-Efficiency SBM Model. Sci. Rep. 11, 9953. doi:10.1038/s41598-021-89293-2
Khaskheli, M. A., Abro, M. I., Chand, R., Elahi, E., Khokhar, F. M., Majidano, A. A., et al. (2021). Evaluating the Effectiveness of Eggshells to Remove Heavy Metals from Wastewater. Desalination Water Treat 216, 239–245. doi:10.5004/dwt.2021.26807
Laureti, T., Benedetti, I., and Branca, G. (2021). Water Use Efficiency and Public Goods Conservation: A Spatial Stochastic Frontier Model Applied to Irrigation in Southern Italy. Socio-Economic Plann. Sci. 73, 100856. doi:10.1016/j.seps.2020.100856
Li, S., Meng, W., and Xie, Y. (2017). Forecasting the Amount of Waste-Sewage Water Discharged into the Yangtze River Basin Based on the Optimal Fractional Order Grey Model. Int. J. Environ. Res. Public Health 15, 20. doi:10.3390/ijerph15010020
Li, X., and Cui, J. (2009). “Real-Time Water Resources Allocation: Methodology and Mechanism,” in 2009 IEEE International Conference on Industrial Engineering and Engineering Management, Beijing, China, December 8–11, 2009, 1637–1641. doi:10.1109/ieem.2009.5373121
Liu, K.-D., Yang, G.-L., and Yang, D.-G. (2020). Investigating Industrial Water-Use Efficiency in mainland China: An Improved SBM-DEA Model. J. Environ. Manage. 270, 110859. doi:10.1016/j.jenvman.2020.110859
Liu, X., Qi, Y., Li, F., Yang, Q., and Yu, L. (2018). Impacts of Regulated Deficit Irrigation on Yield, Quality and Water Use Efficiency of Arabica Coffee under Different Shading Levels in Dry and Hot Regions of Southwest China. Agric. Water Manage. 204, 292–300. doi:10.1016/j.agwat.2018.04.024
Mu, L., Fang, L., Wang, H., Chen, L., Yang, Y., Qu, X. J., et al. (2016). Exploring Northwest China's Agricultural Water-Saving Strategy: Analysis of Water Use Efficiency Based on an SE-DEA Model Conducted in Xi'an, Shaanxi Province. Water Sci. Technol. 74, 1106–1115. doi:10.2166/wst.2016.286
Nataraja, N. R., and Johnson, A. L. (2011). Guidelines for Using Variable Selection Techniques in Data Envelopment Analysis. Eur. J. Oper. Res. 215 (3), 662–669. doi:10.1016/j.ejor.2011.06.045
Othman, F. M., Mohd-Zamil, N. A., Rasid, S. Z. A., Vakilbashi, A., and Mokhber, M. (2016). Data Envelopment Analysis: A Tool of Measuring Efficiency in Banking Sector. Int. J. Econ. Financ. Issues 6, 911–916.
Qi, Q., and Song, S. (2020). Measurement and Influencing Factors of Industrial Water Resource Utilization Efficiency in Yangtze River Economic Belt. Int. J. Des. Nat. Ecodynamics 15 (5), 653–658. doi:10.18280/ijdne.150506
Qiu, Y. Y., and Sheng, J. (2020). Study on Urban Water Resources Utilization Efficiency Based on SE-DEA and Malmquist Index. J. North China Univ. Water Resour. Electric Power (Natural Sci. Edition) 41 (05), 25–33. doi:10.19760/j.ncwu.zk.2020059 (in Chinese).
Sala-Garrido, R., Molinos-Senante, M., and Hernández-Sancho, F. (2012). How Does Seasonality Affect Water Reuse Possibilities? an Efficiency and Cost Analysis. Resour. Conservation Recycling 58, 125–131. doi:10.1016/j.resconrec.2011.11.002
Salehi, M. (2022). Global Water Shortage and Potable Water Safety; Today's Concern and Tomorrow's Crisis. Environ. Int. 158, 106936. doi:10.1016/j.envint.2021.106936
Shi, C., Zeng, X., Yu, Q., Shen, J., and Li, A. (2021). Dynamic Evaluation and Spatiotemporal Evolution of China's Industrial Water Use Efficiency Considering Undesirable Output. Environ. Sci. Pollut. Res. 28, 20839–20853. doi:10.1007/s11356-020-11939-x
Shi, Z., Huang, H., Wu, F., Chiu, Y.-h., and Zhang, C. (2020). The Driving Effect of Spatial Differences of Water Intensity in China. Nat. Resour. Res. 29, 2397–2410. doi:10.1007/s11053-019-09602-5
Siampour, L., Vahdatpour, S., Jahangiri, M., Mostafaeipour, A., Goli, A., Shamsabadi, A. A., et al. (2021). Techno-Enviro Assessment and Ranking of Turkey for Use of Home-Scale Solar Water Heaters. Sustainable Energ. Tech. Assessments 43, 100948. doi:10.1016/j.seta.2020.100948
SLT (2020a). Department of Water Resources of Guangdong Province- Overview of Water Resources. Available at: (in Chinese)http://slt.gd.gov.cn/szy8924/content/post_888844.html (Accessed 5 8, 2020).
SLT (2020b). Department of Water Resources of Guangdong Province- Overview of Water Resources. Available at: (in Chinese)http://slt.gd.gov.cn/szy8924/content/post_888844.html (Accessed 04 30, 2020).
SOHU (2020). Water Shortage in Guangdong-Hong Kong-Macao Bay Area- Water Resources. Available at: (in Chinese)www.sohu.com/a/404225825_120705352 (Accessed May 8, 2021).
Sun, B., and Yang, X. (2019). Analysis of Water Resources Utilization Efficiency in Jilin Province Based on DEA Method. Destech Trans. Comput. Sci. Eng., 700–704. doi:10.12783/dtcse/iteee2019/28828
Sun, C. Z., and Liu, Y. Y. (2009). Analysis of the Spatial-Temporal Pattern of Water Resources Utilization Relative Efficiency Based on DEA-ESDA in China. Resour. Sci. 31 (10), 1696–1703. doi:10.3321/j.issn:1007-7588.2009.10.010 (in Chinese).
Sun, Y., Ren, F., Liu, J., Shi, N., Wang, H., and You, X. (2021). Evaluation of Wastewater Pollution and Treatment Efficiencies in China during Urbanization Based on Dynamic Exogenous Variable Data Envelopment Analysis. Front. Environ. Sci. 9, 585718. doi:10.3389/fenvs.2021.585718
Wan, Y. H., and Zhang, G. Y. (2012). Thoughts on Accelerating the Development and Utilization of Unconventional Water Sources. China Water Resour. 17, 9–10. doi:10.3969/j.issn.1000-1123.2012.17.004 (in Chinese).
Wang, M., Huang, Y., and Li, D. (2021). Assessing the Performance of Industrial Water Resource Utilization Systems in China Based on a Two-Stage DEA Approach with Game Cross Efficiency. J. Clean. Prod. 312, 127722. doi:10.1016/j.jclepro.2021.127722
Wang, Q., Jiang, R., and Li, R. (2018). Decoupling Analysis of Economic Growth from Water Use in City: A Case Study of Beijing, Shanghai, and Guangzhou of China. Sustain. Cities Soc. 41, 86–94. doi:10.1016/j.scs.2018.05.010
Wang, S., Zhou, L., Wang, H., and Li, X. (2018). Water Use Efficiency and its Influencing Factors in China: Based on the Data Envelopment Analysis (DEA)-Tobit Model. Water 10 (7), 8–32. doi:10.3390/w10070832
Wu, H. A., Zeng, B., and Zhou, M. (2017). Forecasting the Water Demand in Chongqing, China Using a Grey Prediction Model and Recommendations for the Sustainable Development of Urban Water Consumption. Int. J. Environ. Res. Public Health 14 (11), 1386. doi:10.3390/ijerph14111386
Zhang, G. J., and Wu, H. Q. (2020). Measurement and the Spatial Interaction Analysis of the Water Resource Comprehensive Utilization Efficiency in China. J. Quantitative Tech. Econ. 37 (08), 123–139. doi:10.13653/j.cnki.jqte.2020.08.007 (in Chinese).
Keywords: water utilization efficiency, evaluation, prediction, DEA model, malmquist index model
Citation: Cheng L, Song S and Xie Y (2022) Evaluation of Water Resources Utilization Efficiency in Guangdong Province Based on the DEA–Malmquist Model. Front. Environ. Sci. 10:819693. doi: 10.3389/fenvs.2022.819693
Received: 22 November 2021; Accepted: 10 January 2022;
Published: 25 February 2022.
Edited by:
Chuanfu Zang, South China Normal University, ChinaReviewed by:
Mario Martín Gamboa, Rey Juan Carlos University, SpainEhsan Elahi, Shandong University of Technology, China
Copyright © 2022 Cheng, Song and Xie. This is an open-access article distributed under the terms of the Creative Commons Attribution License (CC BY). The use, distribution or reproduction in other forums is permitted, provided the original author(s) and the copyright owner(s) are credited and that the original publication in this journal is cited, in accordance with accepted academic practice. No use, distribution or reproduction is permitted which does not comply with these terms.
*Correspondence: Song Song, Z2Vvc3NvbmdAZ3podS5lZHUuY24=