 Zhan MingYue
 Wang Guojie
 Daniel Fiifi Tawia Hagan
 Ullah Waheed
 Kattel Giri2,3,4†
 Li ShiJie
94% of researchers rate our articles as excellent or good
Learn more about the work of our research integrity team to safeguard the quality of each article we publish.
Find out more
ORIGINAL RESEARCH article
Front. Environ. Sci., 26 May 2022
Sec. Atmosphere and Climate
Volume 10 - 2022 | https://doi.org/10.3389/fenvs.2022.819277
Evapotranspiration (ET) bridges the hydrological and energy cycle through vegetation transpiration (T), soil evaporation (ES), and canopy interception evaporation (EI). Transpiration to evapotranspiration ratio (T/ET) quantifies the water use efficiency of terrestrial ecosystems explaining the mechanism of vegetation water transport and water–carbon interactions. This study employed GIMMS LAI3g data to improve the CLM4.5 land surface scheme of RegCM4.6. We designed two simulation experiments, each with control (CTL) and sensitivity (SEN), simulating the interannual variability of vegetation on ET and T/ET in China from 1982 to 2015. Studies show China has experienced a greening trend, especially in mid-south China and South China. Leaf area index (LAI) increased significantly (0.002 m2m−2yr−1). ∆LAI (SEN input LAI data minus CTL input LAI data) and ∆T/ET (T/ET data output by SEN minus T/ET data output by CTL) have shown significant positive correlations. The impacts of LAI on T/ET are more prominent during spring and winter than in autumn and summer. Compared with T/ET and LAI (R = 0.70), the correlation between ET and LAI is moderate (R < 0.5), indicating that vegetation has a higher impact on T/ET than ET. The impact of vegetation anomalies (positive and negative LAI anomalies) on T/ET and ET is spatially different, mainly due to dominant factors affecting ET and T/ET changes. In spring, summer, and autumn, &T (transpiration changes corresponding to vegetation anomalies) is the leading factor affecting both ET and T/ET regionally, and &T has a stronger influence on T/ET than ET, especially in summer. Vegetation anomalies have a stronger influence on T/ET than ET; and the influence of positive vegetation anomalies on ET and T/ET is greater than that of negative vegetation anomalies, especially in spring and autumn. This study reveals the mechanisms behind vegetation processes and their influences on the water and heat fluxes at the land–atmosphere interface and provides a strong scientific basis for studying the water cycle under climate warming.
The sixth assessment report of the Intergovernmental Panel on Climate Change (IPCC) pointed out that the global average temperature has increased by 1°C from 1880 to the present and is projected to reach or exceed 1.5°C in the next 20 years (Masson-Delmotte et al., 2021). Extreme weather events can disrupt water balance (Samantha et al., 2012; Pachauri and Meyer, 2014), eventually reducing the net primary productivity of the terrestrial system (Melillo et al., 1993). Vegetation interacts with the atmosphere by exchanging moisture and energy fluxes, impacting the changes in regional climate (Notaro et al., 2013; Bonan, 2008; Duveiller et al., 2018). Conversely, climate change can also affect regional land biodiversity and ecosystems (Walther et al., 2002; Seddon et al., 2016). How vegetation has adapted to regional climate change has been widely debated (Sudhof, 2009).
Evapotranspiration (ET) links the soil, vegetation, and atmosphere through its critical role in the water cycle (Lu et al., 2003; Xu et al., 2005; Wang et al., 2007; Lixin Wang et al., 2013). T/ET characterizes the contribution of transpiration to evapotranspiration (Niu et al., 2019), describing the water vapor transport through plants to the atmosphere (Lian et al., 2018). Therefore, quantifying the response of ET and T/ET to vegetation is essential for understanding the role of vegetation in the water cycle (Fatichi and Pappas, 2017; Li et al., 2019). In recent decades, a large area of China has shown significant vegetation greening (Piao et al., 2010; Miao-miao Li et al., 2012; Chen et al., 2012; Chen et al., 2014; Piao et al., 2015), which has profound implications for hydrological processes (Li et al., 2018; Hagan et al., 2019; Ullah et al., 2020).
Lately, several studies have been conducted to understand the ET variability in responses to global warming and vegetation changes. Yin et al. (2012) used an improved Lund–Potsdam–Jena (LPJ) dynamic vegetation model to simulate land ET on the Qinghai–Tibetan Plateau, showing an upward trend from 1981 to 2010. The remote sensing-based records showed a decreasing trend of global land ET from 1998 to 2008 and an increasing trend after 2008 (Zhang et al., 2015). Vegetation transpiration and consequently regional ET dynamics are strongly related to leaf area index (LAI) (Good et al., 2014; Schlesinger and Jasechko, 2014; Liu et al., 2016); and it has been shown that the greening/browning of vegetation in China during 2000–2014 has led to increasing/decreasing annual ET, respectively (Liu et al., 2016). Wang et al. (2014) estimated that LAI could explain about 43% of the global T/ET spatial variability. Niu et al. (2019) have shown that vegetation greening and climate change are the main reasons for the increase of T/ET in China, explaining 57.89% and 36.84%, respectively. Li et al. (2019) showed a strong correlation between T/ET and LAI on the seasonal scales, whereas T/ET increase is relatively nonlinear concerning LAI. A strong and nonlinear relationship between LAI and T/ET may suggest that LAI is a first-order factor affecting the regional division of ET in China (Wang et al., 2014; Liu et al., 2016). At present, there are many studies on ET and T/ET. However, many of them simply analyze the impact of vegetation change on ET or T/ET (Scanlon and Kustas, 2012; Chang et al., 2014; Wang et al., 2014; Zhou et al., 2016; Fatichi and Pappas, 2017; Scott and Biederman, 2017; Song et al., 2018; Zhou et al., 2018; Sullivan et al., 2019), while there is no unified conclusion on whether vegetation change has a significant impact on ET or T/ET (Gu et al., 2018). At the same time, there are very few studies on the impact of abnormal vegetation changes on ET and T/ET. To fill the gaps in this part of scientific research, we use the regional climate model (RegCM) to assess these potential impacts. This study uses the long-term vegetation data of GIMMS LAI3g to improve the land surface scheme of RegCM4.6 to study the role of vegetation changes within the land–atmosphere interactions; more specifically, to evaluate vegetation impacts on the interannual variations and associated anomalies on land evapotranspiration in China during 1982–2015. The rest of the study includes data and methods in section 2, results in section 3, discussion in section 4, and conclusion in section 5, respectively.
The LAI dataset used in this study is GIMMS LAI3g, developed from the improved third-generation Global Inventory Modeling and Mapping Studies (GIMMS) Normalized Difference Vegetation Index (NDVI3g) from AVHRR sensors and best-quality MODIS LAI data (Zhu et al., 2013; Kappas et al., 2015). GIMMS LAI3g is the longest available satellite LAI dataset, with a temporal resolution of 15 days and a spatial resolution of 0.083° (Choi et al., 2013; Park and Jeong, 2021). We used bilinear interpolation to resample the spatial resolution of GIMMS LAI to 0.5°. GIMMS LAI3g as the input data for RegCM, providing vegetation information for RegCM simulations from 1982 to 2015. The GIMMS LAI3g data can be downloaded from: https://ecocast.arc.nasa.gov/data/pub/gimms/3g.v1/.
ERA-Interim is a reanalysis product from ECMWF (European Center for Medium-Range Weather Forecasts) using a four-dimensional variational assimilation scheme following the ERA-40 (Uppala et al., 2008). The initial, lateral boundary, and SST (sea surface temperature) data as RegCM input data are from ERA-interim reanalysis data with a horizontal resolution of 1.5° × 1.5°. It is currently used more frequently due to its higher resolution and large assimilation of observational and satellite inversion datasets (LloPart et al., 2018).
This study uses the non-parametric Theil–Sen slope (TSslope) method to calculate the long-term LAI trend. Compared to the traditional linear regression, this method is insensitive to data outliers and skewness (Sen, 1968; Su et al., 2014). As a result, it has been widely used in hydrology and climate research (Guo et al., 2016; Zamani et al., 2017). The formula is as follows:
In Eq. 1, the median is the function; LAIi and LAIj are i and j data in the time series. TSslope > 0 indicates an upward trend, and TSslope < 0 indicates a downward trend; a larger TSslope value indicates a stronger upward or downward trend.
The non-parametric Mann-Kendall (MK) test determines the trend’s significance level, which is widely used in hydrology and meteorological studies (Hess et al., 2001; Modarres, 2007; Shan et al., 2015).
The MK test defines a set of time series, with the parameter Z as the standardized test statistic:
Among them,
In the formula, n is the length of the time series. Given a significance level α, Z1-α/2 is calculated; when |Z|>α, there is a significant change in the time series at the α level. When |Z|>1.64, 1.96, or 2.58, the linear trend has passed the significance test of α = 0.10, 0.05, or 0.01, respectively. In this study, the significance test at α = 0.05 level is used.
We used regional climate model version 4.6 (RegCM4.6) to study the impact of vegetation change on land ET. The community land model 4.5 (CLM4.5) is used as the land surface scheme, which mainly includes four parts: biogeophysics, hydrological cycle, biogeochemistry, and vegetation dynamics (Oleson et al., 2008; Oleson et al., 2013). Furthermore, within the model, fluxes of momentum, latent heat (including ground evaporation, canopy evaporation, and transpiration), and sensible heat (including both ground and canopy) are also represented. The land surface in CLM4.5 is vertically divided into 16 layers, namely ten uneven soil layers, five snow-falling layers, and one vegetation layer. It uses a grid mosaic method, where each grid point can contain 17 different types of plant function types (Tiedtke, 1989; Oleson et al., 2013; Kim and Mohanty, 2016; Sun et al., 2016). The hydrostatic dynamical core is used for the model integration. Therefore, the model can dynamically downscale grid spacing up to 10 km or larger where hydrostatic assumptions are valid. We use a horizontal resolution of 50 km and a vertical coordinate system of 18 levels with a top level of 50 hPa. The utilized physical parameterization schemes are listed in Table 1. The integration domain covers the mainland of China (Figure 1). The distribution map of China’s provinces is shown in Supplementary Figure S1.
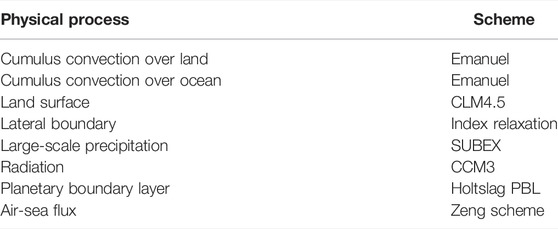
TABLE 1. List of physical parameterization schemes used in the simulation.
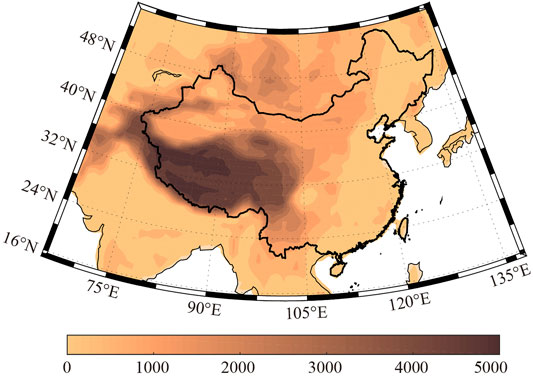
FIGURE 1. Model domain and terrain height (unit: m).
The land surface parameterization for identifying plant biomass is LAI in the CLM4.5 scheme. However, LAI is prescribed from January to December using RegCM default data, which cannot reflect the interannual variations of vegetation. Therefore, we replace the prescribed LAI using monthly GIMMS LAI3g data from 1982 to 2015 so that the impact of interannual vegetation changes can be studied. Two numerical experiments, namely control (CTL) and sensitivity (SEN) run, are integrated. Both CTL and SEN runs are forced using ERA-Interim boundary data from 1980 to 2015 for 36 years, and the first 2 years of simulation are used for model spin-up. The monthly GIMMS LAI3g data from 1982 to 2015 is used in the SEN run; however, we have used the multi-year-mean climatology derived from the same LAI data instead in the CTL run.
Figure 2 shows the annual climatological mean LAI and its pixel-wise trend from 1982 to 2015. The LAI mean (Figure 2A) shows higher vegetation density in eastern China and scarce vegetation in the west. It can be seen that LAI is unevenly distributed in China, with a gradual increase from arid to humid areas. The southeast coast and southwest China have ample water and heat conditions, where the LAI is higher than 3 m2m−2. In comparison, west and North China are relatively arid, with as little as 0.5 m2m−2. The temporal trend in LAI is shown in Figure 2B, indicating a significant spatial heterogeneity in the annual trend. A significant greening in China is evident, especially in South China (0.0015–0.0025 m2m−2yr−1) and the mid-south China (0.001–0.002 m2m−2yr−1). In general, most areas of China have significant vegetation greening, affecting the change of the land water cycle to a certain extent. However, there is no clear conclusion on whether vegetation greening greatly impacts ET or T/ET, so we conducted the following study.
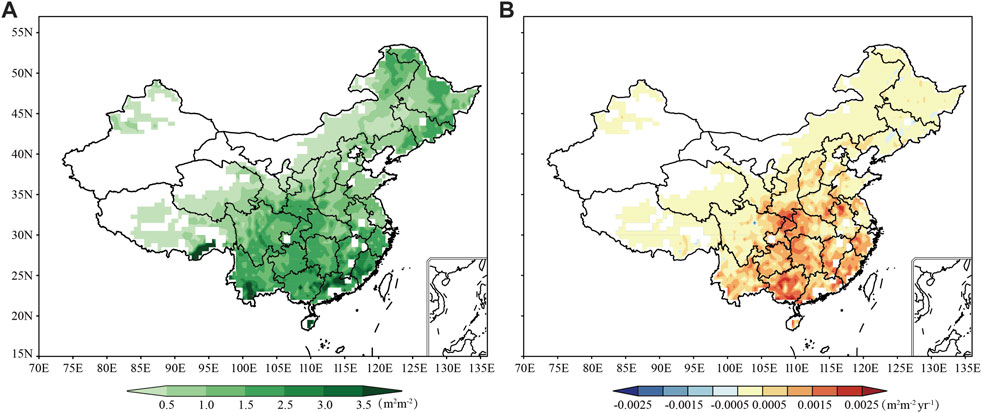
FIGURE 2. Spatial distribution of the (A) annual mean LAI, and (B) Theil–Sen slope trends of LAI during 1982–2015. The shades indicate the trend passing the 5% significance test.
This section shows the impact of the increasing vegetation density on ET and T/ET during 1982–2015. For this purpose, we designed two simulation experiments, each with control (CTL) and sensitivity (SEN). The input data of SEN is the monthly LAI data from 1982 to 2015, while the LAI input data of CTL is the multiple-year-averaged climatology derived from the same LAI data. The main difference between the SEN and CTL experiments is LAI; thus, the difference in ET and T/ET between SEN and CTL is mainly due to LAI changes. By studying the experiment results of CTL and SEN, the impact of vegetation greening on ET and T/ET can be reflected. We used ∆LAI to represent each pixel of LAI input data of China from 1982 to 2015 in SEN minus LAI input data of CTL. ∆ET represents ET data output by SEN minus ET data output by CTL from 1982 to 2015. ∆(T/ET) represents T/ET data output by SEN minus T/ET data output by CTL from 1982 to 2015. The comparison of the simulation results of the two experiments can only reflect whether vegetation greening has a substantial impact on ET or T/ET but cannot reflect the impact of other influencing factors (human activity and global warming) on ET and T/ET.
We calculated pixel correlation coefficients of ∆LAI with ∆ET and ∆(T/ET) in China from 1982 to 2015, respectively. In Figure 3, the first column is the correlation coefficient between ∆LAI and ∆ET, and the second column is ∆(T/ET) in four seasons in China. From the relationship among ∆LAI, ∆ET, and ∆(T/ET), we then characterize the impact of vegetation changes on ET and T/ET. From the results, a moderate correlation between ∆LAI and ∆ET indicates that vegetation changes have a limited effect on ∆ET. However, ∆(T/ET) is significantly correlated with ∆LAI (R > 0.50), with differences in the strength of the correlation evident in space and time.
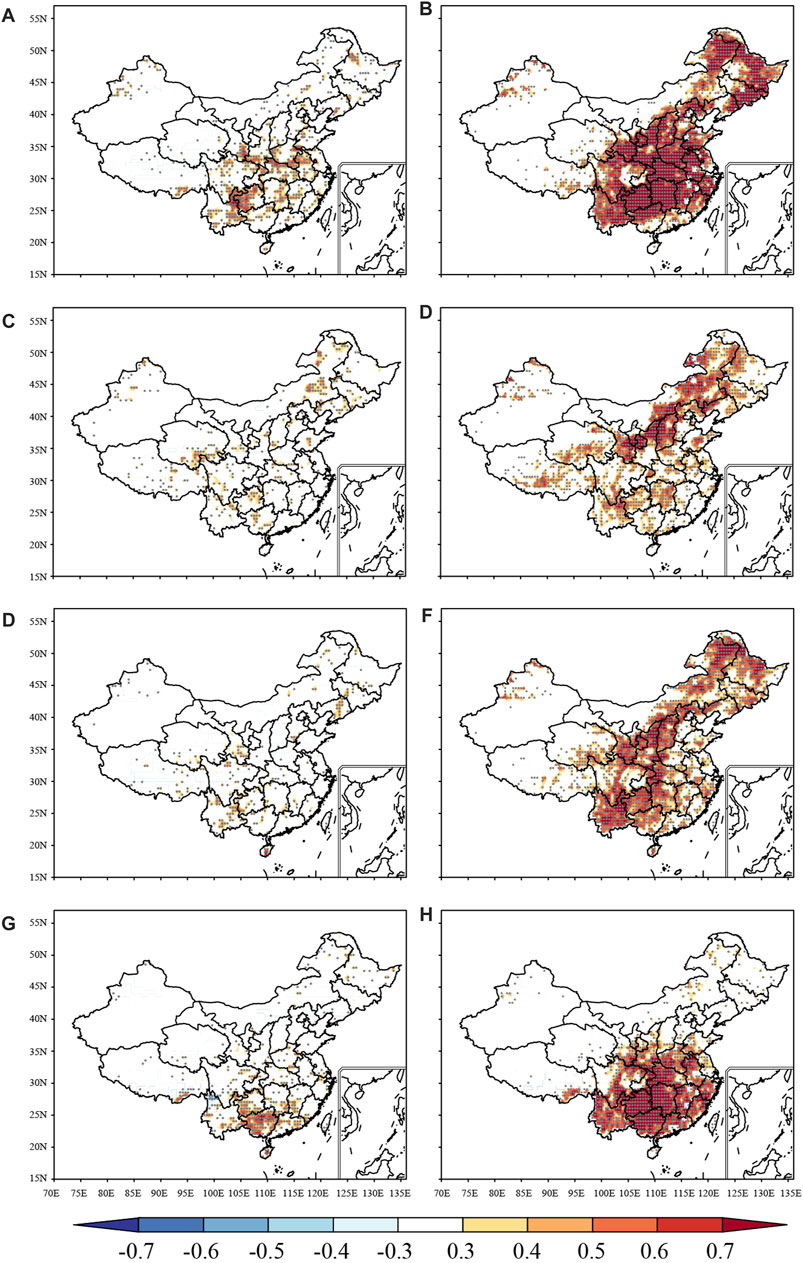
FIGURE 3. The pixel correlation coefficients of ∆LAI with ∆ET and ∆(T/ET), respectively. The first column is ∆ET and the second is ∆(T/ET). Spring (A,B) summer (C,D) autumn (E,F) and winter (G,H). The dots indicate the correlation coefficient passing the significance test at the 5% level.
In spring, ∆LAI and ∆(T/ET) in most regions show a significant positive correlation (R = 0.70), especially in the Northeast, North, and mid-south China (Figure 3B), manifesting that ∆(T/ET) in spring is more sensitive to vegetation changes. In summer, areas with a high correlation between ∆LAI and ∆(T/ET) are mainly distributed in Shanxi and parts of inner Mongolia, where the values are between 0.6 and 0.7. In contrast, the correlation is moderately weak in areas with rich vegetation (Figure 3D). In autumn, the correlation between ∆LAI and ∆(T/ET) is relatively strong in parts of Southwest and North China reaching as high as 0.6 (Figure 3F). In winter, except for Northeast and North China, the spatial distribution of the correlation between ∆LAI and ∆(T/ET) is similar to that of the spring. Still, the correlation intensity is slightly lower than in spring (Figure 3H). Especially in the mid-south of China.
In short, ∆LAI and ∆(T/ET) show a significant positive correlation, with temporal and spatial differences. The correlations between ∆ET and vegetation changes are not as strong as those between ∆(T/ET) and vegetation changes, showing that the sensitivity of transpiration and evapotranspiration to vegetation is different (Niu et al., 2019) and has a more pronounced impact on transpiration than evaporation. The changes of T/ET in spring and winter are more sensitive to vegetation changes than in summer and autumn.
Figure 4 shows the correlation of average ∆LAI with ∆ET and ∆(T/ET) in China from 1982 to 2015, showing that the winter ∆LAI has the most significant correlation (R = 0.75) with ∆ET followed by spring and summer, and the autumn has the lowest (R = 0.32). However, the correlation between ∆LAI and ∆(T/ET) is significantly stronger than ∆ET, whereas the overall correlation coefficients are above 0.78 with seasonal differences. The influences of vegetation changes on ∆(T/ET) are significantly stronger than those on ∆ET in China, which is consistent with the result shown in Figure 3.
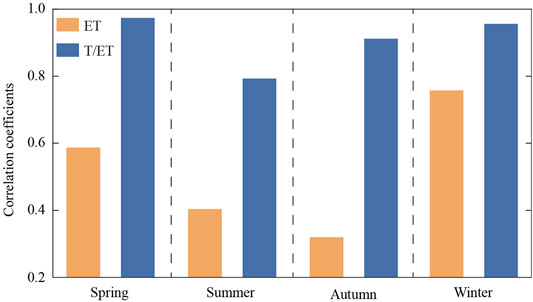
FIGURE 4. Correlation coefficients of interannual variability of ∆LAI with ∆ET and ∆(T/ET).
To further investigate whether vegetation anomalies have a more significant impact on ET or T/ET, we used the 95th and 5th percentile of LAI in SEN as the thresholds for extremely dense and scarce vegetation, respectively. In SEN, LAImax represents the part where each pixel LAI in China from 1982 to 2015 is higher than extremely dense vegetation thresholds; LAImin represents the part where each pixel LAI in China from 1982 to 2015 is lower than extremely scarce vegetation thresholds. The ET in SEN corresponds to the LAImax grid point defined as ETmax; the ET in SEN corresponds to the LAImin grid point defined as ETmin. The T/ET in SEN corresponds to the LAImax grid point defined as (T/ET)max; and the T/ET in SEN corresponds to the LAImin grid point defined as (T/ET)min.
Vegetation shows a strong positive correlation with ET and T/ET (Table 2). When the vegetation is extremely dense, the correlation strength between LAImax and (T/ET)max is significantly higher than that of ETmax, indicating that the highly dense vegetation plays a more important role in changing (T/ET)max. The correlation of LAImax with ETmax and (T/ET)max is strongest in autumn (R = 0.81 and R = 0.94), while the correlation for summer and winter is moderate (R = 0.63 and R = 0.78). When vegetation is extremely scarce, the correlation strength of LAImin with ETmin and (T/ET)min shows seasonal differences. In summer, the correlation strength between LAImin and (T/ET)min is lower than that of ETmin (R = 0.45 and R = 0.52). The correlation strength between LAImin and (T/ET)min in the rest of the seasons is higher than that of ETmin, inferring that the influence of vegetation density on ETmin in summer is stronger than that of (T/ET)min, and the effect on ETmin in the rest of the seasons is limited.
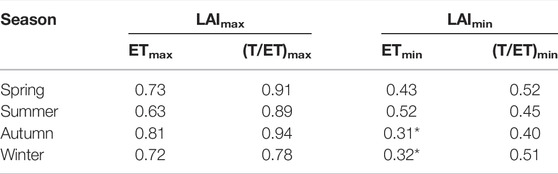
TABLE 2. Correlation coefficients of LAImax (LAImin) with ETmax (ETmin) and (T/ET)max [(T/ET)min] from SEN during the period 1982–2015 (* indicates not passing significance test at 0.05 level).
In a word, the effect of extreme vegetation change on T/ET is significantly higher than that of ET, and extremely rich vegetation has a stronger impact on T/ET than scarce vegetation. In our study, extremely dense vegetation strongly influences T/ET and ET during autumn, while very scarce vegetation has the weakest influence (Table 2).
To study how vegetation affects the water cycle under extreme conditions, we analyze the changes of ET and T/ET for positive and negative LAI anomalies during 1982–2015. We use positive anomalies to represent the ETmax (T/ETmax) of all grid points in China in the SEN minus the average ET (T/ET) simulated by the CTL from 1982 to 2015; negative anomalies represent the ETmin (T/ETmin) of all grid points in China in the SEN minus the average ET (T/ET) simulated by the CTL from 1982 to 2015.
Figure 5 shows the spatial distribution of positive anomalies in LAI, ET, and T/ET, that is, ET and T/ET change compared to the CTL when the vegetation is extremely dense. In spring, most areas of China show more vegetation in SEN when compared to CTL. The northeast and the Loess Plateau show higher LAI ranging from 1.2 to 1.5. The significant increase in vegetation, canopy interception evaporation, and transpiration increase have resulted in ET increase in this area, with an increase of more than 55 mm. However, ET in Yunnan, Guangdong, and Fujian show a decreasing trend, which may be due to the complex nature of the underlying surface in these areas affecting model simulation results (Liu et al., 2016). T/ET shows an increasing trend in most regions, especially in the northeast, north, and the Loess Plateau, with an increase of even more than 0.15, possibly due to the increments of transpiration in this area being higher than that of total ET. In summer, LAI increases significantly in mid-south China, Henan, and Shandong. Despite summer ET and T/ET showing an increasing trend, the actual increment of ET and T/ET is less than in spring.
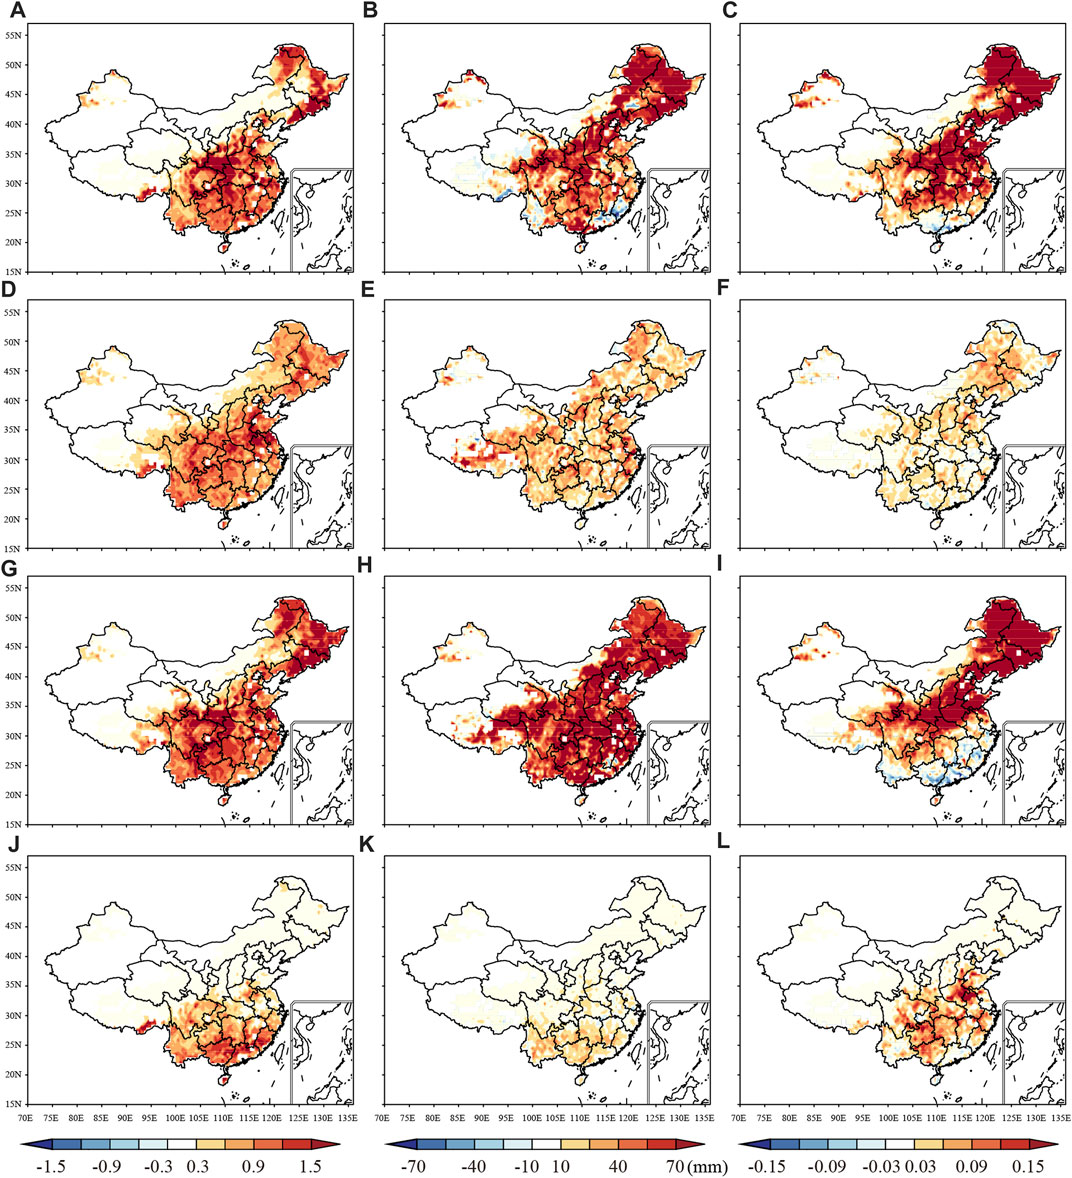
FIGURE 5. Spatial distribution of positive anomalies in LAI, ET, and T/ET. The first column is LAI, the second is ET, and the third is T/ET. Spring (A–C) summer (D–F) autumn (G–I) and winter (J–L).
In autumn, the spatial distribution of both LAI and ET changes is similar to that in spring, showing an increasing trend, but the increment is slightly different from that in spring. The regional average ET increment is more than 70 mm. T/ET shows a significant increasing trend in the northeast and north, while the decreasing trend in the south. In winter, LAI in South China shows a large increase ranging from 0.6 to 1.2. ET increment is also larger in the area with larger vegetation change, which is because the increment of canopy evaporation can compensate for ground evaporation decrement (Hungate et al., 2002; Fatichi and Pappas, 2017). The increasing trend of T/ET is observed highest in mid-south China, with a growth rate greater than 0.06. Although in winter, the increased vegetation will reduce the surface exposure (Hungate et al., 2002), and it has a certain thermal insulation effect (Yu et al., 2021) and increases soil evaporation.
Figure 6 shows the spatial distribution of negative anomalies in LAI, ET, and T/ET, that is, ET and T/ET change compared to the CTL when the vegetation is extremely scarce. In spring, the areas where vegetation has decreased significantly are mainly in mid-south China, leading to negative ET anomalies. However, some areas such as the Tibet Plateau show positive ET anomalies. T/ET decreases in Henan, Shandong, Dongbei, and the middle and lower reaches of the mid-south China, the decrement value exceeds 1.5. In summer, both ET and T/ET show negative anomalies in most parts of China. ET changes have uniform spatial distribution with a rapid decrease of 10–55 mm; the spatial change of T/ET is not so noticeable. ET exhibits negative anomalies when the vegetation is extremely reduced in autumn, especially the largest decrease evident in southern China. The spatial change of T/ET is similar in autumn and spring. However, the intensity of T/ET changes in autumn is significantly higher than in spring. T/ET in the Northeast and the mid-south China shows negative anomalies, while South China shows positive anomalies. In winter, mid-south China shows an increase in ET. Although vegetation and transpiration are significantly reduced, soil evaporation increases due to reducing vegetation coverage. Winter soil evaporation can contribute most of the ET; thus, T/ET shows the most significant change in mid-south China from 0.09 to 0.15. The effects of vegetation anomaly changes on ET and T/ET show obvious seasonal differences in China; the strongest influence is in spring and autumn, and the lowest influence is in summer and winter. Supplementary Figure S2 shows the pixel percentage change of positive and negative anomalies in ET and T/ET. When the vegetation is extremely dense, the pixels percentage of areas with high ET changes is similar to T/ET; when the vegetation is extremely scarce, the pixels percentage of areas with high ET changes is lower than T/ET.
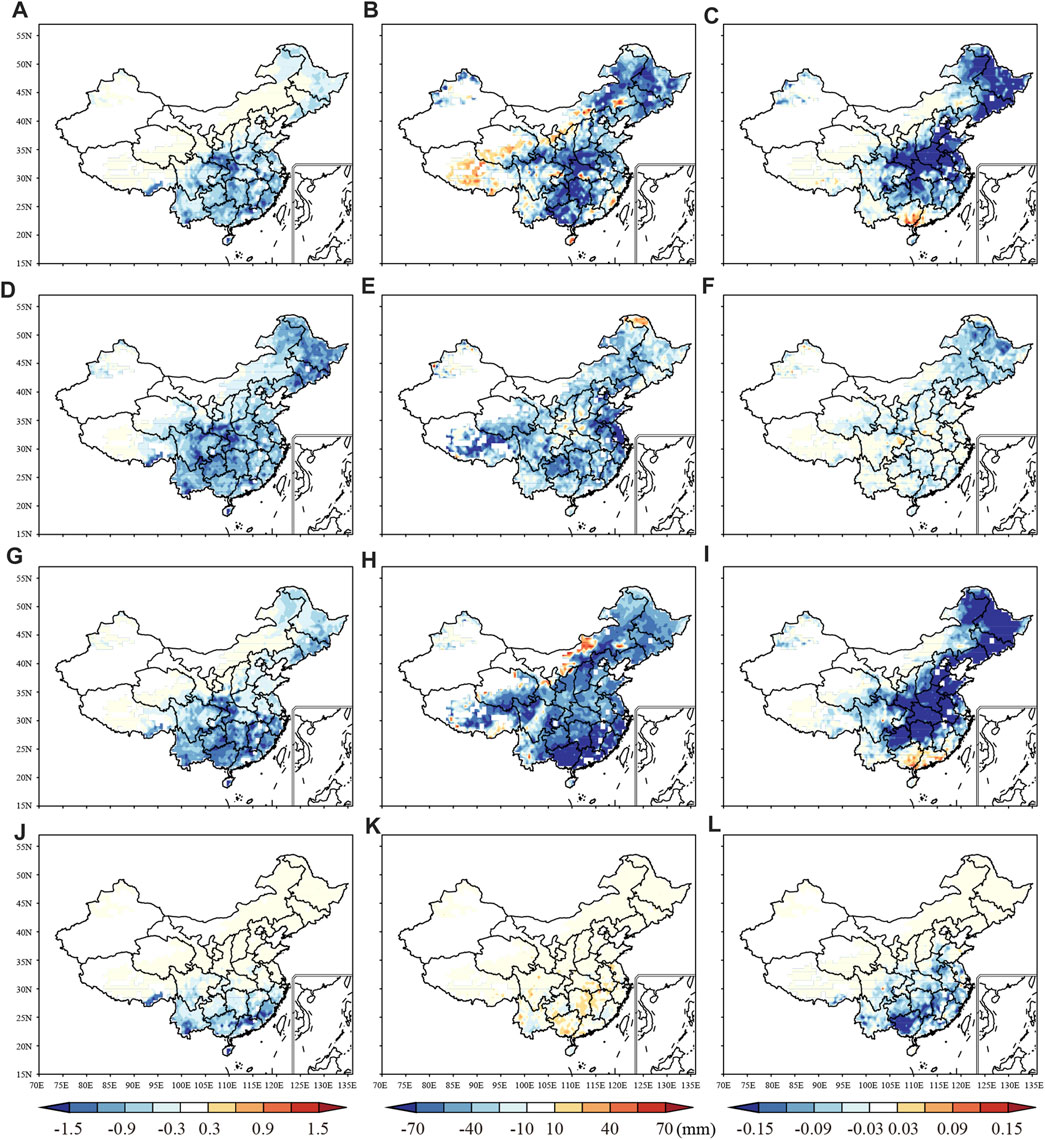
FIGURE 6. Spatial distribution of negative anomalies in LAI, ET, and T/ET. The first column is LAI, the second is ET, and the third is T/ET. Spring (A–C) summer (D–F) autumn (G–I) and winter (J–L).
ET is an important indicator of climate change’s impact on the water cycle, which mainly includes three components: vegetation transpiration (T), soil evaporation (ES), and canopy interception evaporation (EI) (Wang and Dickinson, 2012; Kool et al., 2014). The three components corresponding to the ETmax and ETmin are defined as &T, &ES, and &EI. To study the spatial differences in ET and T/ET caused by changes in vegetation anomalies, we computed the correlation coefficients of three ET components with ET and T/ET, respectively. The spatial distribution of the three components that contribute to ET and T/ET are identical in spring (Figures 7A, B). As ET and T/ET changes are mainly affected by &T in most parts of China, the increasing and decreasing vegetation have led to positive and negative ET and T/ET anomalies (Figure 5B, C, Figure 6B, C). In South China, T/ET is affected by &ES, indicating the increasing influence of soil evaporation on T/ET. In summer, &T significantly influences T/ET; &T is the main influence factor on ET in most of China, whereas &ES strongly influences ET in the Qinghai–Tibetan Plateau, Qinghai, Sichuan, and parts of inner Mongolia (Figure 7D). Although vegetation transpiration strongly influences summer ET and T/ET, its impact on T/ET is more pronounced. No differences in the spatial distribution of dominant factors &T and &ES affecting ET and T/ET are observed in autumn and spring (Figure 7E, F). The &T influences ET and T/ET in autumn in most regions of China, and the spatial distribution of ET and T/ET changes is similar to that in spring (Figure 5H, I, Figure 6H, I). In South China, &ES and &EI play the dominant role in affecting T/ET changes, and the sheltering (evergreen broad-leaved forest) effect of vegetation can lead to a decrease in the soil evaporation (Raz-Yaseef et al., 2010; Wang et al., 2013), explaining the increase in vegetation and decrease in T/ET (Figure 5I). Significant spatial differences in the dominant factors such as &T and &ES in affecting ET and T/ET in winter are evident (Figure 7G, Figure 7H). For example, in Northeast China, North China, Northwest China, and parts of the Qinghai–Tibet Plateau, &ES is the dominant factor affecting ET, but the dominant factor affecting T/ET is &T. In South China, ET is mainly affected by &T, while T/ET is mainly affected by &ES. The results show that ET changes in spring, summer, and autumn are mainly affected by &T, while the winter is mainly affected by &ES.
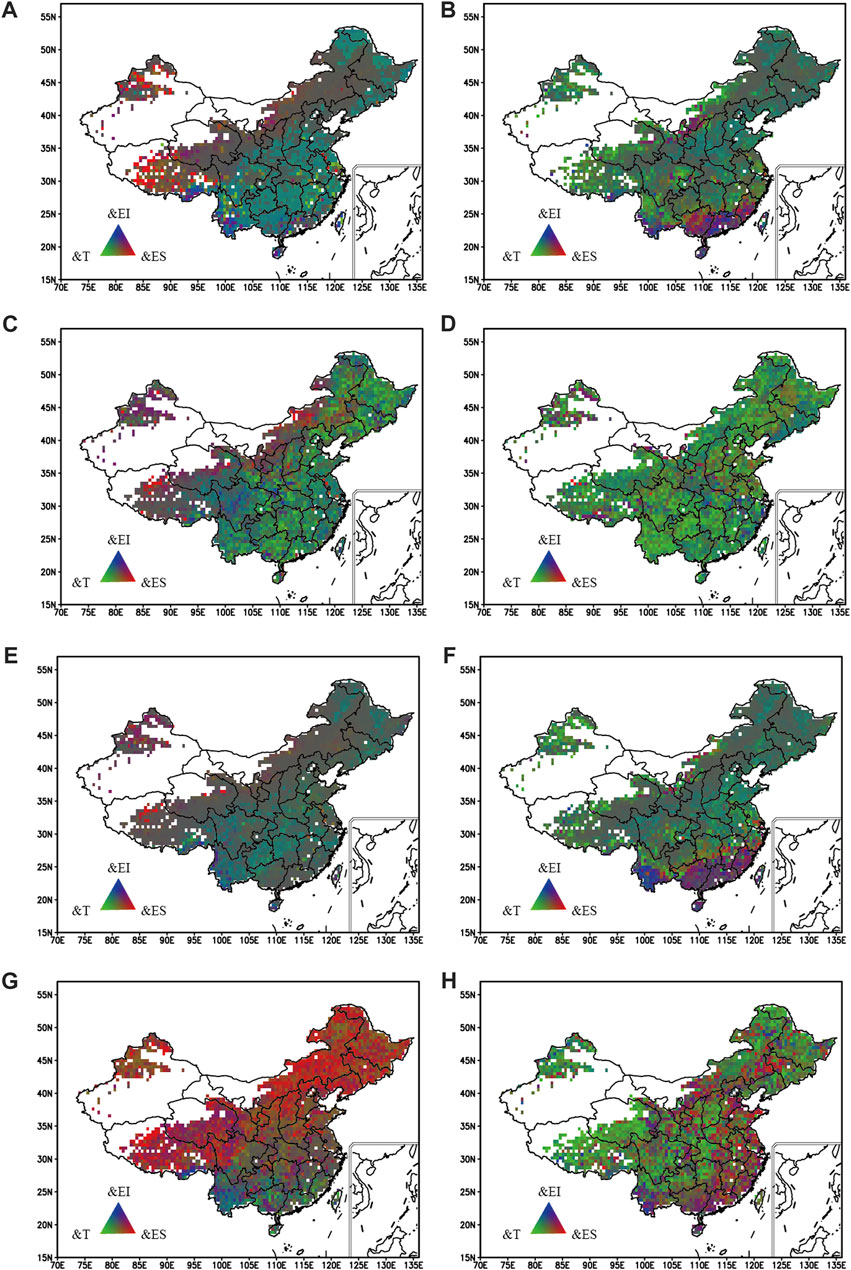
FIGURE 7. The spatial contribution of transpiration (&T), canopy interception (&EI), and soil evaporation (&ES) on ET and T/ET anomalies. Each color corresponds to a unique combination of the correlation coefficients of the three components with ET (A–G) and T/ET (B–H). The first column is ET and the second is T/ET. Spring (A,B) summer (C,D) autumn (E,F) and winter (G,H).
Figure 8 shows the interannual variation of negative and positive anomalies in LAI, ET, and T/ET. Here, positive LAI anomalies represent the mean value of LAImax minus CTL LAI after the regional average of SEN from 1982 to 2015; negative LAI anomalies are the mean value of LAImin minus CTL LAI after the regional average of SEN from 1982 to 2015. Positive and negative ET (T/ET) anomalies are the same. The influence of changes in vegetation anomalies on ET and T/ET in 1982–2015 shows that the correlation coefficients of positive LAI anomalies with ET and T/ET are significantly higher than those of negative LAI anomalies, indicating that the influence of vegetation positive anomalies on ET and T/ET is stronger than that of negative vegetation anomalies. The correlation coefficient between LAI and T/ET anomalies is higher than that of ET anomalies except in spring. Making clear that changes in vegetation anomalies have a stronger impact on T/ET than ET, and there are obvious seasonal differences in the intensity of the impact. The highest correlation coefficients (R = 0.94 and R = 0.81) of positive LAI anomalies with T/ET and ET, are measured in spring (Figure 8A), and the smallest coefficients (R = 0.75 and R = 0.59) are measured in winter (Figure 8D). The highest correlation (R = 0.70) between negative LAI anomalies and ET is measured in spring and the smallest (R = 0.36) in autumn (Figure 8C). In contrast, the highest correlation coefficients (R = 0.58) between negative LAI and T/ET are measured in winter. Results show that vegetation directly impacts the T/ET under abnormal conditions than ET, most prominently in the spring and autumn.
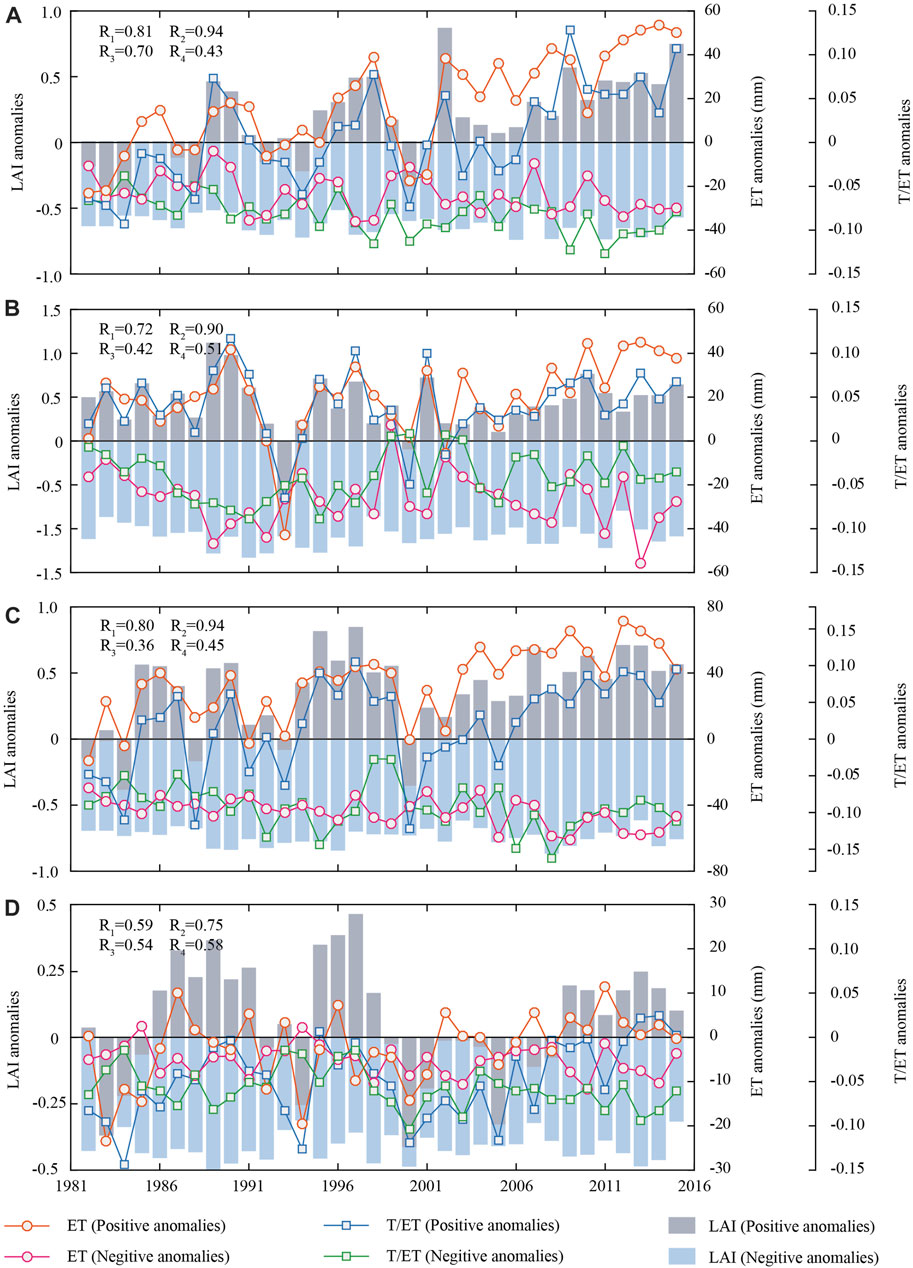
FIGURE 8. Interannual anomalies of LAI, ET, and T/ET in four seasons. Where R1 and R2 represent the correlation coefficients of LAI with ET and T/ET when the vegetation is positive anomalies, respectively; R3 and R4 represent the correlation coefficients of LAI with ET and T/ET when the vegetation is negative anomalies, respectively. Spring (A) summer (B) autumn (C) and winter (D).
Vegetation activities can directly or indirectly affect the changes of ET and its components (ES, EI, and T) (Scanlon and Kustas, 2012; Good et al., 2014). Positive vegetation anomalies do not appear to influence ES changes but influence EI, T, and ET (Figure 9A). ET change is observed mostly in spring and autumn, followed by summer and winter. T/ET in all four seasons shows significant positive anomalies. However, there are seasonal differences in the intensity of its changes, which may mainly relate to the unsynchronized changes of T and ET in different seasons. The influence of vegetation negative and positive anomalies on ET and T/ET changes shows a parallel response of decreasing and increasing vegetation anomalies toward ET and T/ET. For instance, canopy interception and transpiration decrease when the vegetation decreases, resulting in negative total ET and T/ET anomalies (Figure 9B). Because the results in Figure 9 cannot show the regional differences of ET three components; therefore, we selected two typical regions of South China (22–24.5 N, 110–112.5 E) and North China (34.5–37 N, 112–114.5 E) and calculated the changes of ET three components when the vegetation changes abnormally (Supplementary Figure S3). It can be seen that when vegetation is abnormal, there are apparent differences in EI and ES between South and North China. This indicates that different dry and wet environments will significantly affect the impact of vegetation greening on the water cycle.
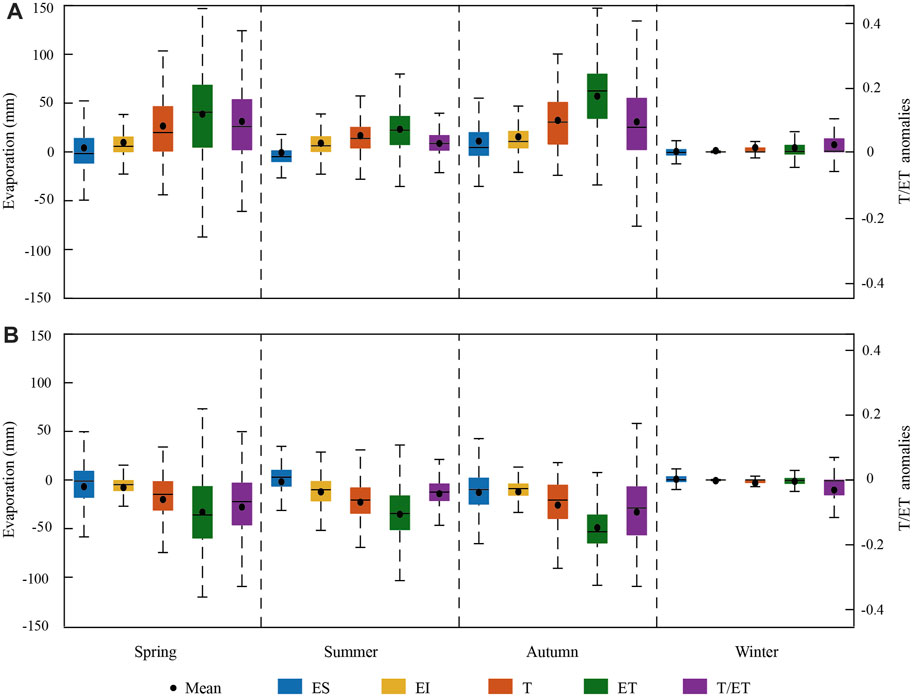
FIGURE 9. The seasonal anomalies of ET, T/ET, and different components of ET in China during 1982–2015. Positive anomalies (A) and negative anomalies (B).
China has implemented large-scale afforestation programs in the past 40 years (1978–2018). Significant vegetation changes will have a huge impact on the terrestrial water cycle (Liu et al., 2008; Ang Li et al., 2012; Zhu et al., 2016). Currently, LAI has been widely used as an indicator to measure vegetation greening and its related climate effects (Piao et al., 2015; Forzieri et al., 2020; Zeng et al., 2018; Zhang et al., 2020). Previous studies have shown that most areas of China have significant vegetation greening (Yang et al., 2016; Niu et al., 2019; Yu et al., 2021), which is consistent with our study findings.
LAI changes and T/ET changes show a more significant positive correlation than ET. However, there are apparent temporal and spatial differences, which may be attributed to the variable contributions from ET components to ET in different seasons (Li et al., 2019), indicating that vegetation greening has a more substantial impact on T/ET than ET (Figure 3, Figure 4). For instance, the changes of T/ET in spring and winter are more sensitive to vegetation changes than in summer and autumn, which may be because the temperature rises in spring. The vegetation density increases during the growth period, and the transpiration is enhanced; the low T/ET of forests and the poor stomatal conductance of trees in winter (Teuling et al., 2010) and the changes in ET in winter are mainly affected by soil evaporation. In contrast, the increased greening accelerated transpiration is much stronger during autumn and summer, reducing the soil moisture and decreasing soil evaporation (Yu et al., 2020). The vegetation coverage of mid-south China is high in summer. Although transpiration increases with vegetation greening, the increment is insignificant (Figure3D).
Furthermore, the shading effect of grass and shrubs reduces the exposure of bare soil, followed by reduced soil evaporation (Huang et al., 2015). Global vegetation evapotranspiration accounts for about 60% of the total land ET (Lian et al., 2018). It has also been confirmed that vegetation is the main driving factor for the spatial changes of T/ET, indicating that vegetation greening may increase this ratio. However, due to global vegetation greening, soil evaporation will decrease, partially hindering the increase in ET (Zhang et al., 2016). In wet areas of China, Zhang et al. (2020) pointed out that vegetation greening actually changed the proportion of ET components, which caused the proportion to increase by 59.0–62.0%. Still, vegetation greening did not increase the total ET simultaneously. The close relationship between vegetation and T/ET has been verified. For example, Raz-Yaseef et al. (2010) found the expansion of LAI led to an increase in transpiration and a decrease in soil evaporation, and T/ET is positively correlated with LAI. Wang et al. (2010) experimented with the change of ET allocation with vegetation cover, where they reported a 60%–83% increase in T/ET under 25%–100% coverage. Liu et al. (2015) stated that the increase in LAI leads to an increase in the T/ET. However, Li et al. (2019) found that LAI can only explain 20% of cross-site T/ET changes, mainly because the vegetation coverage types and climate changes of different sites are different, and ET is affected by biological and non-biological factors such as vegetation coverage, which leads to the uncertainty of observation.
Vegetation growth generally increases LAI and supports greater canopy conductance (Douville et al., 2000). Increased LAI will promote transpiration and interception evaporation, leading to increased evapotranspiration (Li et al., 2018; Piao et al., 2018). However, because of the shielding effect of vegetation, the energy reaching the soil surface is reduced (Hungate et al., 2002), causing poor soil evaporation (Gu et al., 2018). LAI anomalies strongly correlate with T/ET (Table2), consistent with previous research (Li et al., 2019). The vegetation anomalies significantly impact the changes of ET and T/ET, with noticeable seasonal and spatial differences in China (Figure5, Figure6). For instance, the influence of vegetation anomalies on the absolute amount of ET and T/ET is stronger in spring and winter but weaker in summer and autumn. It may be because, although in spring and winter, the increased vegetation will reduce the surface exposure (Hungate et al., 2002), and the increment of evaporation can compensate for ground evaporation decrement (Fatichi and Pappas, 2017). Although the environment, including high temperature, abundant precipitation, and extensive vegetation growth leading to transpiration, is most substantial in summer than in the other three seasons (Lu et al., 2019; Zhan et al., 2020). However, compared to normal vegetation conditions, the rate of transpiration increment is relatively low during summer. Although the increase in LAI promotes transpiration and canopy interception evaporation (Piao et al., 2007; Xiangyi Li et al., 2018a), vegetation canopy also reduces soil evaporation (Hu et al., 2009; Gu et al., 2018), thereby offsetting most or all the evapotranspiration from the canopy (Yu et al., 2021). The spatial distribution difference between ET and T/ET is mainly related to ET components’ contribution to them (Figure7). &T significantly affects ET and T/ET in most regions of China. There is no doubt that vegetation transpiration contributes a lot to ET and T/ET, which is consistent with the research from Lu et al. (2019).
The results show that ET changes in spring, summer, and autumn are mainly affected by &T. In contrast, the winter is mainly affected by &ES due to low temperature, sparse vegetation, and less evapotranspiration (Lu et al., 2019). The &T affects T/ET changes in most regions of China in summer, while in other seasons, &ES and &EI significantly influence T/ET in the south. It is mainly because South China has high vegetation coverage, sufficient hydrothermal conditions, and stronger vegetation transpiration than other areas (Yan et al., 2019; Wang et al., 2021). Therefore, compared with the normal state of vegetation, when the vegetation changes positive or negative, the change ratio of vegetation evapotranspiration is less than that of canopy interception and soil evapotranspiration (Wei et al., 2017). Figure 8 shows that positive vegetation anomalies lead to positive anomalies of ET and T/ET, while negative vegetation anomalies are the opposite. However, the correlation coefficient of positive LAI anomalies with ET and T/ET is significantly higher than negative LAI anomalies, showing that positive vegetation anomalies have a stronger influence on ET and T/ET changes than vegetation negative anomalies. It may be because the contribution of vegetation transpiration to the total ET is much higher than the canopy interception evaporation and soil evaporation (Wang et al., 2014). Very dense vegetation has a stronger sensitivity to transpiration than sparse vegetation, and LAI is more sensitive to transpiration than evapotranspiration (Niu et al., 2019). Vegetation promotes canopy transpiration and interception evaporation due to increased LAI, leading to increased evapotranspiration, thus affecting the water cycle (Piao et al., 2008; Xiangyi Li et al., 2018). However, there are few studies on the impact of changes in vegetation anomalies on land evapotranspiration. For example, Niu et al. (2019) quantified the relative contribution of China’s climate and vegetation greening to the T/ET trend from 1982 to 2015, mainly focusing on the impact of interannual vegetation changes on T/ET. Hu et al. (2018), based on the eddy covariance method, studied the comparison of the influence of vegetation on ET division in five places in North China. The influence of different vegetation types on T/ET is mainly emphasized. Wang et al. (2014) studied the impact of vegetation control on evapotranspiration zones in agricultural systems, but the research focuses on agricultural plants. While in this study, we clarified the degree of influence of changes in vegetation anomalies on T/ET and ET, respectively, which is of great significance to better understanding the water cycle under the background of global warming.
To verify the impact of vegetation greening on the water cycle, we use GIMMS LAI data as vegetation information and input it into RegCM4.6. RegCM is one of the most widely used high-resolution numerical models (Giorgi, 1990), which may outperform the general circulation model regarding the interactions between land and atmosphere (Gao et al., 2003; Gao et al., 2017; Gao et al., 2016; Yang et al., 2018). It should be noted that the parameters used in the RegCM simulation in this study have been verified by predecessors (Table.1), which largely avoids the problems caused by excessive parameterization. Furthermore, the parameterization scheme CLM4.5 compared with the biosphere atmospheric transfer scheme (BATS) can better capture the spatial heterogeneity of land cover (Gao et al., 2003). At present, GIMMS LAI data has been widely used in the research of vegetation greening (Lian et al., 2018). However, to input LAI data into the model, we have preprocessed the data, such as resampling, which may cause part of the vegetation information to be lost. Although many studies have confirmed that vegetation has a significant impact on the water cycle, such as river flow, runoff, ET, and water level (Piao et al., 2015; Forzieri et al., 2020), human factors (CO2 concentration and irrigation) on the water cycle cannot be ignored (Ainsworth and Rogers, 2007; Yang et al., 2019). For example, North China has become one of the largest irrigation areas globally, resulting in an average annual decline of 2.0 cm in the groundwater level for crop irrigation from 2003 to 2010 (Feng et al., 2013). Due to the limitations of RegCM4.6 in quantifying human activities, this study did not explicitly consider the impact of human factors. The time-lag effects of vegetation greening will affect climate change (Bai et al., 2012; Zheng et al., 2014; Niu et al., 2018; Zhao et al., 2020), and different vegetation types also have a significant impact on the land water cycle (Hu et al., 2018), while this study lacks research on the effects of different vegetation types on the land water cycle. Therefore, in follow-up research, we will consider increasing components of ecosystem types and the time-lag effects of vegetation responses to evapotranspiration.
In this study, the GIMMS LAI3g satellite remote sensing data in the land parameterization scheme of the RegCM 4.6 model have significantly improved the hydrothermal process simulation. The effect of vegetation interannual and its changes on ET and T/ET in China from 1982 to 2015, revealing the influence and mechanism of vegetation process response to water and heat flux at the land–atmosphere interface. The study found that the interannual variation of vegetation in China had a more significant impact on the T/ET variation than that on ET variation. Among them, LAI changes in spring and winter have a more substantial impact on T/ET than in summer and autumn. Changes in vegetation anomalies have a more significant impact on the changes of T/ET than ET, with noticeable spatial differences in China. These differences are mainly related to the dominant factors affecting the changes of ET and T/ET. In spring, summer, and autumn, &T plays the dominant role in affecting ET and T/ET changes in most regions of China. The influence of &T on T/ET changes is stronger than that of ET changes, especially in summer. In winter, &ES significantly affects the changes of ET, while T/ET changes in South China are controlled by &T, and other areas are affected by &ES and &EI. Vegetation positive anomalies have a stronger influence on ET and T/ET changes than vegetation negative anomalies (Chen et al., 2012; Gao et al., 2016; Masson-Delmotte et al., 2021; Notaro and Liu, 2008; Notaro et al., 2013; Oleson et al., 2008; Pachauri and Meyer, 2014; Scott and Biederman, 2017; Sullivan et al., 2019; Tiedtke, 1989; Yang et al., 2018; Yang et al., 2016; Zhu et al., 2016).
The original contributions presented in the study are included in the article/Supplementary Material; further inquiries can be directed to the corresponding author.
ZM and WG conceived this study and performed the data analysis and wrote the manuscript. All the other authors are actively involved in the discussions and revised the article.
This study was supported by the National Natural Science Foundation of China (41875094), the Sino-German Science Center “Sino-German Cooperation Group” project (GZ1447) of the National Natural Science Foundation of China, and the Postgraduate Research & Practice Innovation Program of Jiangsu Province (KYCX21_0935).
The authors declare that the research was conducted in the absence of any commercial or financial relationships that could be construed as a potential conflict of interest.
All claims expressed in this article are solely those of the authors and do not necessarily represent those of their affiliated organizations, or those of the publisher, the editors, and the reviewers. Any product that may be evaluated in this article, or claim that may be made by its manufacturer, is not guaranteed or endorsed by the publisher.
The Supplementary Material for this article can be found online at: https://www.frontiersin.org/articles/10.3389/fenvs.2022.819277/full#supplementary-material
Ainsworth, E. A., and Rogers, A. (2007). The Response of Photosynthesis and Stomatal Conductance to Rising [CO2]: Mechanisms and Environmental Interactions. Plant Cell Environ. 30 (3), 258–270. doi:10.1111/j.1365-3040.2007.01641.x
Ang Li, A., Wu, J., and Huang, J. (2012). Distinguishing between Human-Induced and Climate-Driven Vegetation Changes: a Critical Application of RESTREND in Inner Mongolia. Landsc. Ecol. 27 (7), 969–982. doi:10.1007/s10980-012-9751-2
Bai, S. Y., Wang, L., and Shi, J. Q. (2012). Time Lag Effect of NDVI Response to Climatic Change in Yangtze River Basin. Chin. J. Agrometeorology 33 (04), 579–586.
Bonan, G. B. (2008). Ecological Climatology: Concepts and Applications. Cambridge University Press. doi:10.1017/CBO9780511805530
Chang, X., Zhao, W., Liu, H., Wei, X., Liu, B., and He, Z. (2014). Qinghai Spruce (Picea Crassifolia) Forest Transpiration and Canopy Conductance in the Upper Heihe River Basin of Arid Northwestern China. Agric. For. Meteorology 198-199, 209–220. doi:10.1016/j.agrformet.2014.08.015
Chen, B., Xu, G., Coops, N. C., Ciais, P., Innes, J. L., Wang, G., et al. (2014). Changes in Vegetation Photosynthetic Activity Trends across the Asia-Pacific Region over the Last Three Decades. Remote Sens. Environ. 144, 28–41. doi:10.1016/j.rse.2013.12.018
Chen, G.-S., Notaro, M., Liu, Z., and Liu, Y. (2012). Simulated Local and Remote Biophysical Effects of Afforestation over the Southeast United States in Boreal Summer*. J. Clim. 25, 4511–4522. doi:10.1175/JCLI-D-11-00317.1
Choi, S., Ni, X., Shi, Y., Ganguly, S., Zhang, G., Duong, H., et al. (2013). Allometric Scaling and Resource Limitations Model of Tree Heights: Part 2. Site Based Testing of the Model. Remote Sens. 5, 202–223. doi:10.3390/rs5010202
Douville, H., Planton, S., Royer, J.-F., Stephenson, D. B., Tyteca, S., Kergoat, L., et al. (2000). Importance of Vegetation Feedbacks in doubled-CO2climate Experiments. J. Geophys. Res. 105, 14841–14861. doi:10.1029/1999JD901086
Duveiller, G., Hooker, J., and Cescatti, A. (2018). The Mark of Vegetation Change on Earth's Surface Energy Balance. Nat. Commun. 9 (1), 679. doi:10.1038/s41467-017-02810-8
Fatichi, S., and Pappas, C. (2017). Constrained Variability of Modeled T :ET Ratio across Biomes. Geophys. Res. Lett. 44 (13), 6795–6803. doi:10.1002/2017gl074041
Feng, W., Zhong, M., Lemoine, J.-M., Biancale, R., Hsu, H.-T., and Xia, J. (2013). Evaluation of Groundwater Depletion in North China Using the Gravity Recovery and Climate Experiment (GRACE) Data and Ground-Based Measurements. Water Resour. Res. 49 (4), 2110–2118. doi:10.1002/wrcr.20192
Forzieri, G., Miralles, D. G., Ciais, P., Alkama, R., Ryu, Y., Duveiller, G., et al. (2020). Increased Control of Vegetation on Global Terrestrial Energy Fluxes. Nat. Clim. Chang. 10 (2), 356–362. doi:10.1038/s41558-020-0717-0
Gao, X.-J., Shi, Y., and Giorgi, F. (2016). Comparison of Convective Parameterizations in RegCM4 Experiments over China with CLM as the Land Surface Model. Atmos. Ocean. Sci. Lett. 9 (4), 246–254. doi:10.1080/16742834.2016.1172938
Gao, X. J., Zhao, Z. C., Ding, Y. H., Huang, R. H., and Giorgi, F. (2003). Climate Change Due to Greenhouse Effects in China as Simulated by a Regional Climate Model. Adv. Atmos. Sci. 18 (6), 1224–1230. doi:10.1007/s00376-001-0036-y
Gao, X., Shi, Y., Han, Z., Wang, M., Wu, J., Zhang, D., et al. (2017). Performance of RegCM4 over Major River Basins in China. Adv. Atmos. Sci. 34 (4), 441–455. doi:10.1007/s00376-016-6179-7
Giorgi, F. (1990). Simulation of Regional Climate Using a Limited Area Model Nested in a General Circulation Model. J. Clim. 3 (9), 941–963. doi:10.1175/1520-0442(1990)003<0941:sorcua>2.0.co;2
Good, S. P., Soderberg, K., Guan, K., King, E. G., Scanlon, T. M., and Caylor, K. K. (2014). δ2H Isotopic Flux Partitioning of Evapotranspiration over a Grass Field Following a Water Pulse and Subsequent Dry Down. Water Resour. Res. 50, 1410–1432. doi:10.1002/2013WR014333
Gu, C., Ma, J., Zhu, G., Yang, H., Zhang, K., Wang, Y., et al. (2018). Partitioning Evapotranspiration Using an Optimized Satellite-Based ET Model across Biomes. Agric. For. Meteorology 259, 355–363. doi:10.1016/j.agrformet.2018.05.023
Guo, H., Gao, J. X., Xu, L. H., Yang, X. H., and Shi, Z. J. (2016). Spatiotemporal Variation of Temperature,precipitation and Wind Trends in a Desertification Prone Region of China From1960 to 2013. Int. J. Climatol. 36 (13), 4327–4337. doi:10.1002/joc.4635
Hess, A., Iyer, H., and Malm, W. (2001). Linear Trend Analysis: a Comparison of Methods. Atmos. Environ. 35 (30), 5211–5222. doi:10.1016/S1352-2310(01)00342-9
Hu, Z., Yu, G., Zhou, Y., Sun, X., Li, Y., Shi, P., et al. (2009). Partitioning of Evapotranspiration and its Controls in Four Grassland Ecosystems: Application of a Two-Source Model. Agric. For. Meteorology 149 (9), 1410–1420. doi:10.1016/j.agrformet.2009.03.014
Hu, H., Chen, L., Liu, H., Ali Khan, M., Tie, Q., Zhang, X., et al. (2018). Comparison of the Vegetation Effect on ET Partitioning Based on Eddy Covariance Method at Five Different Sites of Northern China. Remote Sens. 10 (11), 1755. doi:10.3390/rs10111755
Huang, M., Piao, S., Sun, Y., Ciais, P., Cheng, L., Mao, J., et al. (2015). Change in Terrestrial Ecosystem Water‐use Efficiency over the Last Three Decades. Glob. Change Biol. 21 (6), 2366–2378. doi:10.1111/gcb.12873
Hungate, B. A., Reichstein, M., Dijkstra, P., Johnson, D., Hymus, G., Tenhunen, J. D., et al. (2002). Evapotranspiration and Soil Water Content in a Scrub-Oak Woodland under Carbon Dioxide Enrichment. Glob. Chang. Biol. 8 (3), 289–298. doi:10.1046/j.1365-2486.2002.00468.x
Kappas, M., Propastin, P., Degener, J., and Renchin, T. (2015). Inter-Comparison and Evaluation of the Global LAI Product (LAI3g) and the Regional LAI Product (GGRS-LAI) over the Area of Kazakhstan. Remote Sens. 7, 3760–3782. doi:10.3390/rs70403760
Kim, J., and Mohanty, B. P. (2016). Influence of Lateral Subsurface Flow and Connectivity on Soil Water Storage in Land Surface Modeling. J. Geophys. Res. Atmos. 121 (2), 704–721. doi:10.1002/2015JD024067
Kool, D., Agam, N., Lazarovitch, N., Heitman, J. L., Sauer, T. J., and Ben-Gal, A. (2014). A Review of Approaches for Evapotranspiration Partitioning. Agric. For. Meteorology 184, 56–70. doi:10.1016/j.agrformet.2013.09.003
Li, X., Gentine, P., Lin, C., Zhou, S., Sun, Z., Zheng, Y., et al. (2019). A Simple and Objective Method to Partition Evapotranspiration into Transpiration and Evaporation at Eddy-Covariance Sites. Agric. For. Meteorology 265, 171–182. doi:10.1016/j.agrformet.2018.11.017
Li, X., He, Y., Zeng, Z., Lian, X., Wang, X., Du, M., et al. (2018). Spatiotemporal Pattern of Terrestrial Evapotranspiration in China during the Past Thirty Years. Agric. For. Meteorology 259, 131–140. doi:10.1016/j.agrformet.2018.04.020
Lian, X., Piao, S., Huntingford, C., Li, Y., Zeng, Z., Wang, X., et al. (2018). Partitioning Global Land Evapotranspiration Using CMIP5 Models Constrained by Observations. Nat. Clim. Change 8 (7), 640–646. doi:10.1038/s41558-018-0207-9
Liu, J., Li, S., Ouyang, Z., Tam, C., and Chen, X. (2008). Ecological and Socioeconomic Effects of China's Policies for Ecosystem Services. Proc. Natl. Acad. Sci. U.S.A. 105, 9477–9482. doi:10.1073/pnas.0706436105
Liu, Y., Xiao, J., Ju, W., Zhou, Y., Wang, S., and Wu, X. (2015). Water Use Efficiency of China's Terrestrial Ecosystems and Responses to Drought. Sci. Rep. 5, 13799. doi:10.1038/srep13799
Liu, Y., Xiao, J., Ju, W., Xu, K., Zhou, Y., and Zhao, Y. (2016). Recent Trends in Vegetation Greenness in China Significantly Altered Annual Evapotranspiration and Water Yield. Environ. Res. Lett. 11 (9), 094010. doi:10.1088/1748-9326/11/9/094010
Lixin Wang, L., Niu, S., Good, S. P., Soderberg, K., McCabe, M. F., Sherry, R. A., et al. (2013). The Effect of Warming on Grassland Evapotranspiration Partitioning Using Laser-Based Isotope Monitoring Techniques. Geochimica Cosmochimica Acta 111, 28–38. doi:10.1016/j.gca.2012.12.047
LloPart, M., da Rocha, R. P., Reboita, M., and Cuadra, S. (2017). Sensitivity of Simulated South America Climate to the Land Surface Schemes in RegCM4. Clim. Dyn. 49, 3975–3987. doi:10.1007/s00382-017-3557-5
Lu, J., Sun, G., Mcnulty, S. G., Amatya, D. M., and Devendra, M. (2003). Modeling Actual Evapotranspiration from Forested Watersheds across the Southeastern United States. J. Am. Water Resour. Assoc. 39 (4), 886–896. doi:10.1111/j.1752-1688.2003.tb04413.x
Lu, J., Wang, G., Gong, T., Hagan, D. F. T., Wang, Y., Jiang, T., et al. (2019). Changes of Actual Evapotranspiration and its Components in the Yangtze River Valley during 1980-2014 from Satellite Assimilation Product. Theor. Appl. Climatol. 138, 1493–1510. doi:10.1007/s00704-019-02913-w
MacKay, S. L., Arain, M. A., Khomik, M., Brodeur, J. J., Schumacher, J., Hartmann, H., et al. (2012). The Impact of Induced Drought on Transpiration and Growth in a Temperate Pine Plantation Forest. Hydrol. Process. 26, 1779–1791. doi:10.1002/hyp.9315
Masson-Delmotte, V., Zhai, P., Pirani, A., Connors, S. L., Péan, C., Berger, S., et al. (2021). “IPCC, 2021: Summary for Policymakers,” in Climate Change 2021: The Physical Science Basis. Contribution of Working Group I to the Sixth Assessment Report of the Intergovernmental Panel on Climate Change (Cambridge University Press). In Press.
Melillo, J. M., McGuire, A. D., Kicklighter, D. W., Moore, B., Vorosmarty, C. J., and Schloss, A. L. (1993). Global Climate Change and Terrestrial Net Primary Production. Nature 363, 234–240. doi:10.1038/363234a0
Miao-miao Li, M.-m., Liu, A.-t., Zou, C.-j., Xu, W.-d., Shimizu, H., and Wang, K.-y. (2012). An Overview of the "Three-North" Shelterbelt Project in China. For. Stud. China 14, 70–79. doi:10.1007/s11632-012-0108-3
Modarres, R., and de Paulo Rodrigues da Silva, V. (2007). Rainfall Trends in Arid and Semi-arid Regions of Iran. J. Arid Environ. 70, 344–355. doi:10.1016/j.jaridenv.2006.12.024
Niu, J., Chen, J., Sun, L., and Li, Q. (2018). Time-lag Effects of Vegetation Responses to Soil Moisture Evolution: a Case Study in the Xijiang Basin in South China. Stoch. Environ. Res. risk Assess. 32, 2423–2432. doi:10.1007/s00477-017-1492-y
Niu, Z., He, H., Zhu, G., Ren, X., Zhang, L., Zhang, K., et al. (2019). An Increasing Trend in the Ratio of Transpiration to Total Terrestrial Evapotranspiration in China from 1982 to 2015 Caused by Greening and Warming. Agric. For. Meteorology 279, 107701. doi:10.1016/j.agrformet.2019.107701
Notaro, M., and Liu, Z. (2008). Statistical and Dynamical Assessment of Vegetation Feedbacks on Climate over the Boreal Forest. Clim. Dyn. 31, 691–712. doi:10.1007/s00382-008-0368-8
Notaro, M., Zarrin, A., Vavrus, S., and Bennington, V. (2013). Simulation of Heavy Lake-Effect Snowstorms across the Great Lakes Basin by RegCM4: Synoptic Climatology and Variability. Mon. Weather Rev. 141 (6), 1990–2014. doi:10.1175/MWR-D-11-00369.1
Oleson, K. W., Niu, G. Y., Yang, Z. L., Lawrence, D. W., and Thornton, P. E. (2008). Improvements to the Community Land Model and Their Impact on the Hydrological Cycle. J. Geophys. Res. Atmos. 113 (113), 811–882. doi:10.1029/2007jg000563
Oleson, K. W., Lawrence, D. M., Bonan, G. B., Mark, G., and Zeng, X. B. (2013). “Technical Description of Version 4.5 of the Community Land Model (CLM),” in NCAR Tech: 2013, Note NCAR/TN-478+STR, 1–257. doi:10.1029/2010GL042430
Pachauri, R. K., and Meyer, L. A. (2014). IPCC (2014) Climate Change 2014:synthesis Report. Cambridge and New York: Cambridge University Press, 151. doi:10.1111/j.1728-4457.2001.00203.x
Park, H., and Jeong, S. (2021). Leaf Area Index in Earth System Models: How the Key Variable of Vegetation Seasonality Works in Climate Projections. Environ. Res. Lett. 16, 034027. doi:10.1088/1748-9326/abe2cf
Piao, S., Friedlingstein, P., Ciais, P., de Noblet-Ducoudré, N., Labat, D., and Zaehle, S. (2007). Changes in Climate and Land Use Have a Larger Direct Impact Than Rising CO 2 on Global River Runoff Trends. Proc. Natl. Acad. Sci. U.S.A. 104 (39), 15242–15247. doi:10.1073/pnas.0707213104
Piao, S., Ciais, P., Friedlingstein, P., Peylin, P., Reichstein, M., Luyssaert, S., et al. (2008). Net Carbon Dioxide Losses of Northern Ecosystems in Response to Autumn Warming. Nature 451 (7174), 49–52. doi:10.1038/nature06444
Piao, S., Ciais, P., Huang, Y., Shen, Z., Peng, S., Li, J., et al. (2010). The Impacts of Climate Change on Water Resources and Agriculture in China. Nature 467 (7311), 43–51. doi:10.1038/nature09364
Piao, S., Yin, G., Tan, J., Cheng, L., Huang, M., Li, Y., et al. (2015). Detection and Attribution of Vegetation Greening Trend in China over the Last 30 Years. Glob. Change Biol. 21 (4), 1601–1609. doi:10.1111/gcb.12795
Piao, S., Li, Y., Li, L. Z. X., Chen, A., Wang, X., Ciais, P., et al. (2018). Divergent Hydrological Response to Large-Scale Afforestation and Vegetation Greening in China. Sci. Adv. 4 (5), 9. doi:10.1126/sciadv.aar4182
Qianyu Li, Q., Lu, X., Wang, Y., Huang, X., Cox, P. M., and Luo, Y. (2018). Leaf Area Index Identified as a Major Source of Variability in Modeled CO<sub>2</sub> Fertilization. Biogeosciences 15 (22), 6909–6925. doi:10.5194/bg-15-6909-2018
Raz-Yaseef, N., Rotenberg, E., and Yakir, D. (2010). Effects of Spatial Variations in Soil Evaporation Caused by Tree Shading on Water Flux Partitioning in a Semi-arid Pine Forest. Agric. For. Meteorology 150, 454–462. doi:10.1016/j.agrformet.2010.01.010
Scanlon, T. M., and Kustas, W. P. (2012). Partitioning Evapotranspiration Using an Eddy Covariance‐Based Technique: Improved Assessment of Soil Moisture and Land-Atmosphere Exchange Dynamics. Vadose zone J. 11 (3). doi:10.2136/vzj2012.0025
Schlesinger, W. H., and Jasechko, S. (2014). Transpiration in the Global Water Cycle. Agric. For. Meteorology 189-190, 115–117. doi:10.1016/j.agrformet.2014.01.011
Scott, R. L., and Biederman, J. A. (2017). Partitioning Evapotranspiration Using Long‐term Carbon Dioxide and Water Vapor Fluxes. Geophys. Res. Lett. 44 (13), 6833–6840. doi:10.1002/2017GL074324
Seddon, A. W. R., Macias-Fauria, M., Long, P. R., Benz, D., and Willis, K. J. (2016). Sensitivity of Global Terrestrial Ecosystems to Climate Variability. Nature 531 (7593), 229–232. doi:10.1038/nature16986
Sen, P. K. (1968). Estimates of the Regression Coefficient Based on Kendall's Tau. J. Am. Stat. Assoc. 63 (324), 1379–1389. doi:10.1080/01621459.1968.10480934
Shan, N., Shi, Z., Yang, X., Gao, J., and Cai, D. (2015). Spatiotemporal Trends of Reference Evapotranspiration and its Driving Factors in the Beijing-Tianjin Sand Source Control Project Region, China. Agric. For. Meteorology 200, 322–333. doi:10.1016/j.agrformet.2014.10.008
Song, L., Zhu, J., Li, M., Zhang, J., Zheng, X., and Wang, K. (2018). Canopy Transpiration of Pinus Sylvestris Var. Mongolica in a Sparse Wood Grassland in the Semiarid Sandy Region of Northeast China. Agric. For. Meteorology 250-251, 192–201. doi:10.1016/j.agrformet.2017.12.260
Su, T., Feng, G., Zhou, J., and Ye, M. (2014). The Response of Actual Evaporation to Global Warming in China Based on Six Reanalysis Datasets. Int. J. Climatol. 35 (11), 3238–3248. doi:10.1002/joc.4203
Sudhof, T. (2009). “Climate Change and the Integrity of Science,” in City: International Association of Hydrological Sciences, 689–690.
Sullivan, R. C., Kotamarthi, V. R., and Feng, Y. (2019). Recovering Evapotranspiration Trends from Biased CMIP5 Simulations and Sensitivity to Changing Climate over North America. J. Hydrometeorol. 20 (8), 1619–1633. doi:10.1175/JHM-D-18-0259.1
Sun, S., Chen, B., Ge, M., Qu, J., Che, T., Zhang, H., et al. (2016). Improving Soil Organic Carbon Parameterization of Land Surface Model for Cold Regions in the Northeastern Tibetan Plateau, China. Ecol. Model. 330, 1–15. doi:10.1016/j.ecolmodel.2016.03.014
Tawia Hagan, D. F., Wang, G., San Liang, X., and Dolman, H. A. J. (2019). A Time-Varying Causality Formalism Based on the Liang-Kleeman Information Flow for Analyzing Directed Interactions in Nonstationary Climate Systems. J. Clim. 32 (21), 7521–7537. doi:10.1175/JCLI-D-18-0881.1
Teuling, A. J., Seneviratne, S. I., Stöckli, R., Reichstein, M., Moors, E., Ciais, P., et al. (2010). Contrasting Response of European Forest and Grassland Energy Exchange to Heatwaves. Nat. Geosci. 3 (10), 722–727. doi:10.1038/ngeo950
Tiedtke, M. A. (1989). comPrehensive Massflux Scheme for Cumulus Parametrization in Large-Scalemodels. Monwearev 117, 1179–1800. doi:10.1175/1520-0493(1989)117<1779:acmfsf>2.0.co;2
Ullah, W., Guojie, W., Gao, Z., Tawia Hagan, D. F., Bhatti, A. S., and Zhua, C. (2021). Observed Linkage between Tibetan Plateau Soil Moisture and South Asian Summer Precipitation and the Possible Mechanism. J. Clim. 34 (1), 361–377. doi:10.1175/JCLI-D-20-0347.1
Uppala, S. M., Dee, D. P., Kobayashi, S., Berrisford, P., and Simmons, A. (2008). Towards a Climate Data Assimilation system:Status Update of ERA-Interim. ECMWF Newsl. 115, 12–18.
Walther, G.-R., Post, E., Convey, P., Menzel, A., Parmesan, C., Beebee, T. J. C., et al. (2002). Ecological Responses to Recent Climate Change. Nature 416 (6879), 389–395. doi:10.1038/416389a
Wang, K., and Dickinson, R. E. (2012). A Review of Global Terrestrial Evapotranspiration: Observation, Modeling, Climatology, and Climatic Variability. Rev. Geophys. 50, 54. doi:10.1029/2011RG000373
Wang, Y., Jiang, T., Bothe, O., and Fraedrich, K. (2007). Changes of pan Evaporation and Reference Evapotranspiration in the Yangtze River Basin. Theor. Appl. Climatol. 90 (1-2), 13–23. doi:10.1007/s00704-006-0276-y
Wang, L., Caylor, K. K., Villegas, J. C., Barron-Gafford, G. A., Breshears, D. D., and Huxman, T. E. (2010). Partitioning Evapotranspiration across Gradients of Woody Plant Cover: Assessment of a Stable Isotope Technique. Geophys. Res. Lett. 37, a–n. doi:10.1029/2010GL043228
Wang, L., Good, S. P., and Caylor, K. K. (2014). Global Synthesis of Vegetation Control on Evapotranspiration Partitioning. Geophys. Res. Lett. 41 (19), 6753–6757. doi:10.1002/2014gl061439
Wang, Q., Cheng, L., Zhang, L., Liu, P., Qin, S., Liu, L., et al. (2021). Quantifying the Impacts of Land-Cover Changes on Global Evapotranspiration Based on the Continuous Remote Sensing Observations during 1982-2016. J. Hydrology 598, 126231. doi:10.1016/j.jhydrol.2021.126231
Wei, Z., Yoshimura, K., Wang, L., Miralles, D. G., Jasechko, S., and Lee, X. (2017). Revisiting the Contribution of Transpiration to Global Terrestrial Evapotranspiration. Geophys. Res. Lett. 44, 2792–2801. doi:10.1002/2016GL072235
Weiguang Wang, W., Xing, W., Shao, Q., Yu, Z., Peng, S., Yang, T., et al. (2013). Changes in Reference Evapotranspiration across the Tibetan Plateau: Observations and Future Projections Based on Statistical Downscaling. J. Geophys. Res. Atmos. 118 (10), 4049–4068. doi:10.1002/jgrd.50393
Xu, C.-y., Gong, L., Jiang, T., Chen, D., and Singh, V. P. (2006). Analysis of Spatial Distribution and Temporal Trend of Reference Evapotranspiration and pan Evaporation in Changjiang (Yangtze River) Catchment. J. Hydrology 327 (1), 81–93. doi:10.1016/j.jhydrol.2005.11.029
Yan, Y., Tang, J., Liu, G., and Wu, J. (2019). Effects of Vegetation Fraction Variation on Regional Climate Simulation over Eastern China. Glob. Planet. Change 175 (APR), 173–189. doi:10.1016/j.gloplacha.2019.02.004
Yang, Z., Zhang, Q., and Hao, X. (2016). Evapotranspiration Trend and its Relationship with Precipitation over the Loess Plateau during the Last Three Decades. Adv. Meteorology 2016, 1–10. doi:10.1155/2016/6809749
Yang, M., Zuo, R., Wang, L., and Chen, X. (2018). Simulation of Land Surface Climate over China with RegCM4.5: Verification and Analysis. Adv. Meteorology 2018, 1–14. doi:10.1155/2018/7960908
Yang, Y., Roderick, M. L., Zhang, S., McVicar, T. R., and Donohue, R. J. (2019). Hydrologic Implications of Vegetation Response to Elevated CO2 in Climate Projections. Nat. Clim. Change 9, 44–48. doi:10.1038/s41558-018-0361-0
Yin, Y., Wu, S., Zhao, D., Zhen, D., and Pan, T. (2012). Impact of Climate Change on Actual Evapotranspiration on the Tibetan Plateau during 1981-2010. J. Geogr. Sci. 67, 1471–1481. doi:10.1007/s00704-017-2060-6
Yu, L., Xue, Y., and Diallo, I. (2021). Vegetation Greening in China and its Effect on Summer Regional Climate. Sci. Bull. 66 (1), 13–17. doi:10.1016/j.scib.2020.09.003
Zamani, R., Mirabbasi, R., Abdollahi, S., and Jhajharia, D. (2017). Streamflow Trend Analysis by Considering Autocorrelation Structure, Long-Term Persistence, and Hurst Coefficient in a Semi-arid Region of Iran. Theor. Appl. Climatol. 129 (1-2), 33–45. doi:10.1007/s00704-016-1747-4
Zeng, Z., Piao, S., Li, L. Z. X., Wang, T., Ciais, P., Lian, X., et al. (2018). Impact of Earth Greening on the Terrestrial Water Cycle. J. Clim. 31, 2633–2650. doi:10.1175/jcli-d-17-0236.1
Zhan, M. Y., Wang, G. J., Lu, J., Chen, L. Q., Zhu, C. X., and Jiang, T. (2020). Projected Evapotranspiration and the Influencing Factors in the Yangtze River Basin Based on CMIP6 Models. Trans. Atmos. Sci. 43 (6), 1115–1126. doi:10.13878/j.cnki.dqkxxb
Zhang, D., Liu, X. M., and Bai, P. (2020). Different Influences of Vegetation Greening on Regional Water-Energy Balance under Different Climatic Conditions. Forests 9, 412. doi:10.3390/f9070412
Zhang, K., Kimball, J. S., Nemani, R. R., Running, S. W., Hong, Y., Gourley, J. J., et al. (2015). Vegetation Greening and Climate Change Promote Multidecadal Rises of Global Land Evapotranspiration. Sci. Rep. 5, 15956. doi:10.1038/srep15956
Zhang, Y., Peña-Arancibia, J. L., Mcvicar, T. R., Chiew, F. H., Vaze, J., Liu, C., et al. (2016). Multi-decadal Trends in Global Terrestrial Evapotranspiration and its Components. Sci. Rep. 6 (1), 19124–19954. doi:10.1038/srep19124
Zhao, A., Yu, Q., Feng, L., Zhang, A., and Pei, T. (2020). Evaluating the Cumulative and Time-Lag Effects of Drought on Grassland Vegetation: A Case Study in the Chinese Loess Plateau. J. Environ. Manag. 261, 110214. doi:10.1016/j.jenvman.2020.110214
Zheng, H., Wang, Q., Zhu, X., Li, Y., and Yu, G. (2014). Hysteresis Responses of Evapotranspiration to Meteorological Factors at a Diel Timescale: Patterns and Causes. PLoS ONE 9, e98857. doi:10.1371/journal.pone.0098857
Zhou, S., Yu, B., Zhang, Y., Huang, Y., and Wang, G. (2016). Partitioning Evapotranspiration Based on the Concept of Underlying Water Use Efficiency. Water Resour. Res. 52 (2), 1160–1175. doi:10.1002/2015wr017766
Zhou, S., Yu, B., Zhang, Y., Huang, Y., and Wang, G. (2018). Water Use Efficiency and Evapotranspiration Partitioning for Three Typical Ecosystems in the Heihe River Basin, Northwestern China. Agric. For. Meteorology 253-254, 261–273. doi:10.1016/j.agrformet.2018.02.002
Zhu, Z., Bi, J., Pan, Y., Ganguly, S., Anav, A., Xu, L., et al. (2013). Global Data Sets of Vegetation Leaf Area Index (LAI)3g and Fraction of Photosynthetically Active Radiation (FPAR)3g Derived from Global Inventory Modeling and Mapping Studies (GIMMS) Normalized Difference Vegetation Index (NDVI3g) for the Period 1981 to 2011. Remote Sens. 5, 927–948. doi:10.3390/rs5020927
Keywords: evapotranspiration, transpiration to evapotranspiration ratio, leaf area index, RegCM4.6, CLM4.5
Citation: MingYue Z, Guojie W, Hagan DFT, Waheed U, Giri K, Jiao L and ShiJie L (2022) Impacts of Vegetation Changes on Land Evapotranspiration in China During 1982–2015. Front. Environ. Sci. 10:819277. doi: 10.3389/fenvs.2022.819277
Received: 21 November 2021; Accepted: 21 April 2022;
Published: 26 May 2022.
Edited by:
Hong Liao, Nanjing University of Information Science and Technology, ChinaReviewed by:
Xuezhen Zhang, Institute of Geographic Sciences and Natural Resources Research (CAS), ChinaCopyright © 2022 MingYue, Guojie, Hagan, Waheed, Giri, Jiao and ShiJie. This is an open-access article distributed under the terms of the Creative Commons Attribution License (CC BY). The use, distribution or reproduction in other forums is permitted, provided the original author(s) and the copyright owner(s) are credited and that the original publication in this journal is cited, in accordance with accepted academic practice. No use, distribution or reproduction is permitted which does not comply with these terms.
*Correspondence: Wang Guojie, Z3dhbmdAbnVpc3QuZWR1LmNu
†ORCID: Kattel Giri, orcid.org/0000-0002-8348-6477
Disclaimer: All claims expressed in this article are solely those of the authors and do not necessarily represent those of their affiliated organizations, or those of the publisher, the editors and the reviewers. Any product that may be evaluated in this article or claim that may be made by its manufacturer is not guaranteed or endorsed by the publisher.
Research integrity at Frontiers
Learn more about the work of our research integrity team to safeguard the quality of each article we publish.