 Nick R. Bond
 Avril C. Horne
 Luke M. McPhan
 Rhys Coleman
94% of researchers rate our articles as excellent or good
Learn more about the work of our research integrity team to safeguard the quality of each article we publish.
Find out more
ORIGINAL RESEARCH article
Front. Environ. Sci., 22 August 2022
Sec. Freshwater Science
Volume 10 - 2022 | https://doi.org/10.3389/fenvs.2022.815080
This article is part of the Research TopicEnvironmental Flows in an Uncertain FutureView all 21 articles
Climate variability and change pose significant threats to aquatic biodiversity, particularly in areas with low and variable streamflow. Quantifying the magnitude of risk from these threats is made more difficult by the variable responses of individual species to hydrologic stress. Patterns of population decline and recovery in response to drought cycles will depend on both the resistance traits (e.g., tolerance to harsh environmental conditions) and resilience traits (e.g., fecundity, age at maturity), both of which vary considerably among species. Collectively these traits can give rise to varied, and lagged patterns of decline and recovery in response to hydrologic variability, which ultimately can affect population viability in drought prone environments and in response to a changing climate. Such population cycles are typically modelled based on demographic rates (mortality and recruitment) under different climate conditions. However, such models are relatively data intensive, limiting their widespread development. A less precise but more tractable approach is to adopt state-and-transition approaches based on semi-quantitative population states (or population size estimates), and modelled transitions between states under different hydrologic conditions. Here we demonstrate the application of such models to a suite of diverse taxa, based on an expert elicitation of expected state-changes across those different taxa under a range of different flow conditions. The model results broadly conform with population changes observed in response to a major drought in the case-study system, mimicking the observed lags in recovery of species with different life-histories. Stochastic simulations of population cycles under scenarios of more protracted drought provide a semi-quantitative measure of the potential risk to different species under each scenario, as well as highlighting the large uncertainties that can arise when taking into account stochastic (rather than deterministic) state-transitions.
“From the fact that all past futures have resembled past pasts it does not follow that all future futures will resemble future pasts”. Karl Popper.
Flow variability is a major driver of population and community dynamics in river-floodplain ecosystems, and predicting those dynamics is an important goal for researchers and river managers alike. In recent years there has been a strong push for the development and adoption of modelling approaches to assist with environmental flows planning that are better able to replicate the response of ecosystems to specific flow sequences (e.g., Shenton et al., 2012; Horne et al., 2019; Tonkin et al., 2019). This requires models of ecosystem condition that are dynamic through time. In a recent review of flow-ecology response models, Wheeler et al. (2017) distinguished between pure “state” based approaches, which quantify absolute values of particular variables (e.g., population size, presence/absence) and “rate” based approaches, which quantify relative changes in those variables over time (e.g., population growth, colonization/extinction). Wheeler et al. found purely “rate” based approaches relatively uncommon in the literature (∼12% of studies), despite the perceived advantages of such models in forecasting ecological dynamics and generating temporally-explicit predictions.
These sorts of dynamics are readily captured in population demographic models that include vital rates (births, deaths, migration), and such models can be extended to consider multi-species ensembles (e.g., Lytle et al., 2017). However, traditional demographic models require information on life-history and vital rates that is not available for most species, and this presents a barrier to their utility and uptake (Beissinger and Westphal, 1998). However, in their review of flow-ecology models, Wheeler et al. (2017) also noted that most of the flow-ecology studies they examined (53%) involved repeat measurements of state-variables at one or more sites over time, and thus were conducive to adopting a “rate” based approach, simply by adjusting the response variable to consider temporal change. Because such models do not explicitly model underlying processes, they cannot reveal the underlying mechanism producing the change (e.g., changes due to mortality vs. emigration), but they can still produce temporally specific predictions of biotic responses to specific flow sequences that are both useful and testable.
One widely used conceptualization of this repeated-state to rate based translation, which has been widely used in vegetation science, is the state-and-transition model, in which changes between defined states (e.g., in terms of vegetation condition or species composition) occur probabilistically at each time step (Plant and Vayssières, 2000; McIntyre and Lavorel, 2007; Daniel et al., 2016). The most basic formulation of state-and-transition models (STMs) assumes transition probabilities adhere to a constant first-order Markov process, but this assumption can easily be relaxed to consider higher-order lag effects or the influence of exogenous variables such as disturbances that alter transition probabilities over time (Baker, 1989; Daniel et al., 2016). Daniel et al. (2016) emphasize the use of multiple transition pathways within a state and transition simulation model (STSM) framework to explore the effects of disturbances such as wildfire, land management and land-use change on vegetation trajectories.
While common in terrestrial management, examples of repeated-state “rate” based approaches such as STMs and STSMs are rare in the flow-ecology literature (Wheeler et al., 2017). However, so long as representative states can be adequately defined, the framework is equally applicable to riverine contexts. Examples of plausible states could include relative abundance of single species or the composition of a community, both of which can be measured repeatedly over time and classified into discrete states. Where states are ordered ordinal (e.g., metrics describing abundance), transitions between classes in opposing directions encompass resistance and resilience traits in the face of disturbance, and hence trajectories of decline and recovery among different species following disturbances can be readily simulated (Bond et al., 2018).
Here we combined a simple STSM framework with an expert elicitation process to develop models that allowed us to explore the dynamics, and emergent risks to freshwater fauna assemblages in response to climate induced drought cycles. We focus on a multi-species assemblage that includes platypus, fish, and benthic invertebrates, all of which are impacted to varying degrees by drought disturbances (Rose et al., 2008; Crook et al., 2010; Bino et al., 2021). Our aim is to develop models that replicate the resistance and resilience patterns of different species and assemblages to droughts that differ in duration and frequency, in order to provide managers with insights into what outcomes might be expected under more severe drought cycles associated with climate-change. In doing so we also present a simple analysis of historical drought cycles that allowed us to very easily simulate wet/dry sequences (for a range of plausible changes in drought persistence) with similar overall statistical properties, but with distinct sequencing of individual wet-dry years, something often missing from models of flow-ecology relationships (Yen et al., 2013; Horne et al., 2019). The approach is applied to a case study of the Werribee River, Victoria, Australia, and demonstrates the suitability of STSM frameworks to support environmental flows more broadly.
The Werribee River (known as the Wirribi-yaluk by the Wadawurrung people) is a relatively short (∼100 km) coastal river in Victoria, Southeastern Australia. It flows through the lands of the Wurundjeri Woi-wurrung, Wadawurrung and Bunurong people. It drains a catchment area of approximately 1978 km2 with mean annual rainfall ranging from∼1000 mm/year in the headwaters to ∼450 mm/year in the lower reaches, and has a mean annual discharge of ∼52,814 Ml/year. Rainfall and runoff are winter/spring dominated, but also highly variable between years, giving rise to distinct drought cycles. Despite perennial flows, drought exerts a strong influence on runoff in the catchment. There is also significant water use for urban water supply and irrigation within the catchment. During low flow periods water can be released from Melton Reservoir (as well as several smaller storages, such as Merriumu and Pykes Creek Reservoirs), as an environmental flow to help protect downstream values, however during prolonged drought there can be insufficient water to maintain flow releases, which can lead to very low flows downstream, and consequent declines in water quality, particularly high salinity in the estuary, high water temperatures, and the loss of riffle habitats in reaches above the estuary (Lloyd et al., 2008; Sharpe, 2014).
We modelled the effects of these drought cycles using a state-and-transition modelling framework that considers the joint effects of 1) antecedent ecological condition, and 2) hydrologic conditions at each time-step. We largely followed the methodology of Bond et al. (2018), with the additional consideration of non-deterministic transitions between states, and a consideration of a broader range of ecological endpoints. The model is composed of two main components: the hydrologic inputs, and a set of state-transition matrices which are used to project state changes at each time-step given different combinations of antecedent hydrological and ecological states (Figure 1). Each of the main components is described in more detail below.
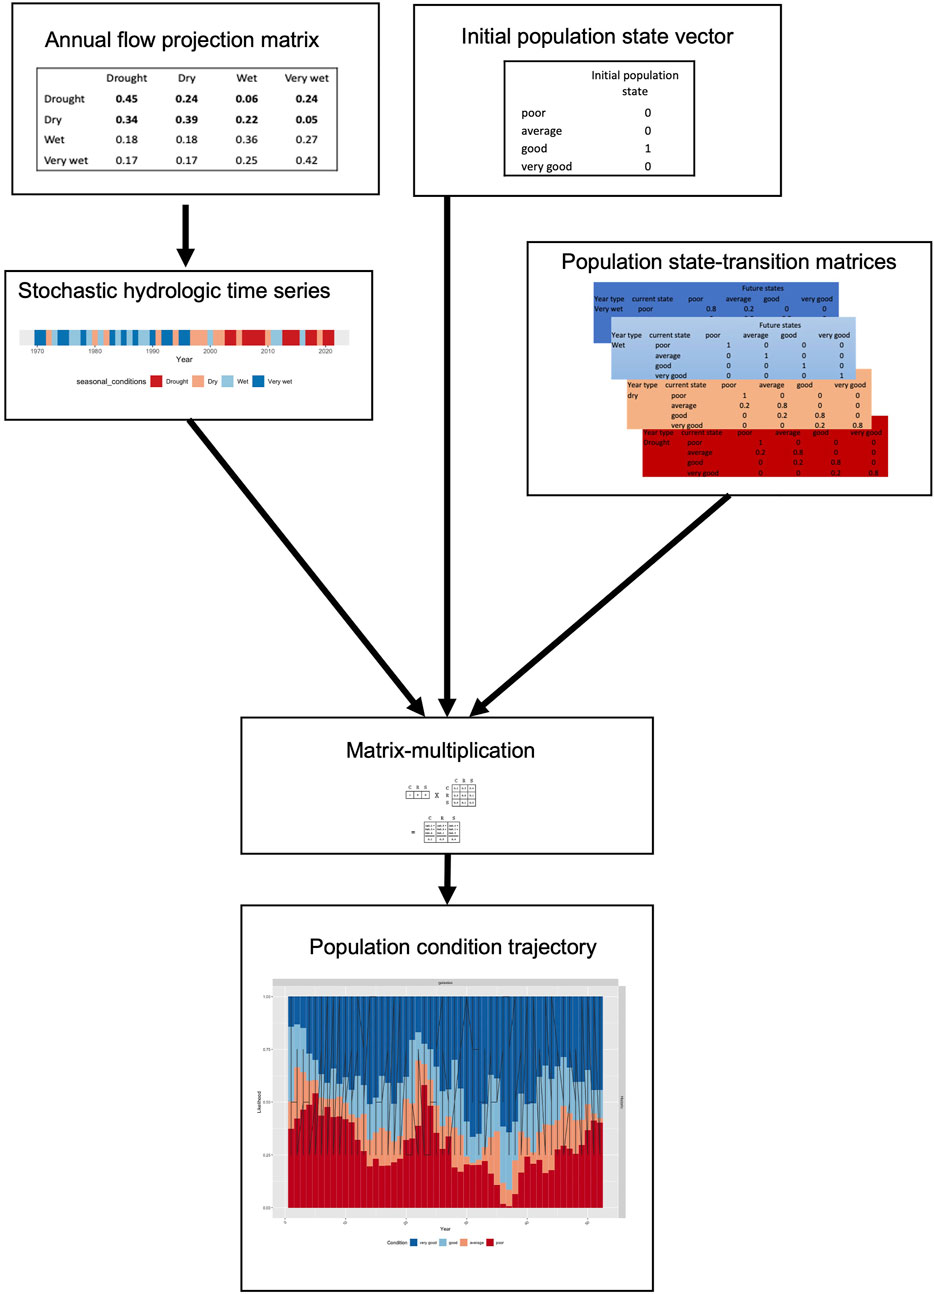
FIGURE 1. Diagram showing the Inputs and sequence of steps involving in generating the population projections using the STSM approach.
Conceptually, ecological responses to flow are expected to differ markedly in response to antecedent hydrologic conditions. For example, periods of below average flows can see declines in the health of populations and communities due to the associated physical-chemical stresses that organisms experience (Lake, 2006; Bond et al., 2008). The strength of these declines may be related to the relative degree of hydrologic stress. Conversely, periods of above average flows are associated with patterns of improving ecological health, particularly very wet periods, which may produce flood cycles that trigger high levels of productivity and population growth (Serena and Grant, 2017), noting floods can also be disturbances. Between the extremes of floods and droughts, many populations can be relatively stable, although this can vary among taxonomic groups.
To characterize interannual variability in hydrology for the Werribee River we used daily flow data from the gauge immediately downstream of Melton Weir (Gauge No 231205; Figure 2A). We classified each year of flow data (from the period 1960–2014) as falling into one of four hydrologic “states”—described as drought, dry, wet, and very wet—by distributing annual runoff totals into four equal quartiles (Figure 2B). After assigning each year to its respective hydrologic state (Figure 2C), a probability matrix was constructed describing the empirical probabilities of transitioning among different states at each time-step (Table 1). It is also worth noting that our hydrologic states do not align with the formal definition of drought conditions, for example as used by the Bureau of Meteorology. However, the adoption of the different water-availability/runoff classes is more closely aligned to the way in which years are classified from an environmental water planning perspective in the study region.
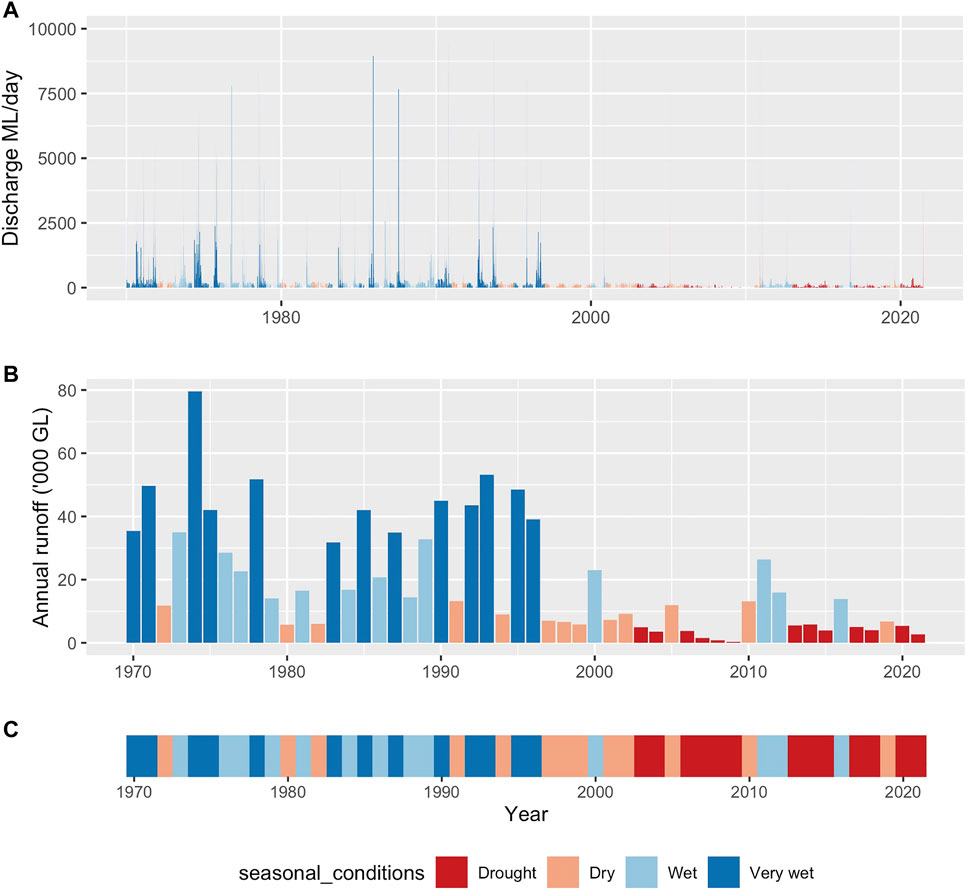
FIGURE 2. (A) daily runoff time series (Megalitres), (B) annual runoff estimates (Gigalitres), and (C) annual flow class sequence (Drought, Dry, Wet and Very Wet), with classes derived from quartiles of annual runoff ordered from driest to wettest.
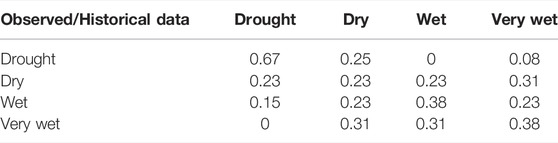
TABLE 1. Estimated annual transition probabilities between years with different runoff volumes. Years associated with Drought, Dry, Wet, and Very Wet classes span the lowest to highest runoff quartiles.
The empirical state-transition probabilities derived from the historical sequence were then used to derive replicate stochastic flow sequences (n = 100) for each of three distinct climate scenarios: historic, drought_10, and drought_20. The latter two scenarios involved increasing the likelihood (by 10 and 20% respectively), that a drought year would be followed by another drought year, with a corresponding decrease in the likelihood of wet conditions persisting (Table 2). These replicate flow series (see Figure 3 for representative sequences from each scenario) were then combined with population/community state-transitions (Sections 2.3, 2.4) to stochastically project ecological conditions associated with each flow series. These replicate projected ecological time-series were then examined to compare the ecological outcomes under each of the three climate scenarios.
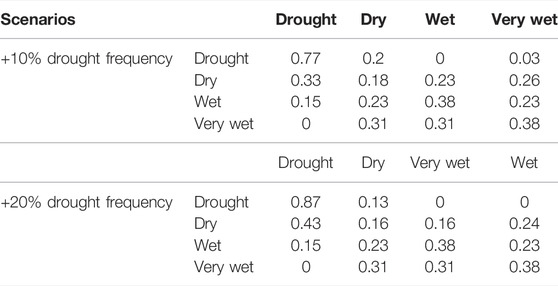
TABLE 2. Modified annual transition probabilities between years associated with two scenarios of more persistent droughts. Years associated with Drought, Dry, Wet and Very Wet classes span the lowest to highest runoff quartiles.

FIGURE 3. Hypothetical future flow sequences generated using the state and transition tables for the historical sequence (A), 10% increase in drought persistence (B) and 20% increase in drought persistence (C). Tables 1, 2 for annual transition probabilities under each scenario.
The model was also applied to the recent historical sequence to provide a visual indication of the trajectories of each population/community in response to the drought conditions that occurred in southeastern Australia from 1998 to 2009 [the so-called millennium drought (Bond et al., 2008)]. While not a formal validation of the model predictions, these outputs were presented to the scientists involved in the development of the state-transition probabilities, to see whether the system behaviour, in terms of the patterns of change in population/community health matched their expectations.
The conditional changes in ecological state were determined with input from a group of technical experts. The team initially assembled data on the life-history traits and tolerances of the target biota such as longevity, dispersal ability, fecundity, and sensitivity to adverse water quality and habitat availability (Table 3). The experts then used the assembled information to derive transition matrices describing anticipated state-changes under different combinations of antecedent conditions [including both antecedent population health and antecedent hydrology (Table 4)]. Information was derived from published reports (Koehn and O’Connor, 1990; McGuckin, 2006; Lloyd et al., 2008; McGuckin, 2012; Sharpe, 2014) and first-hand observations.
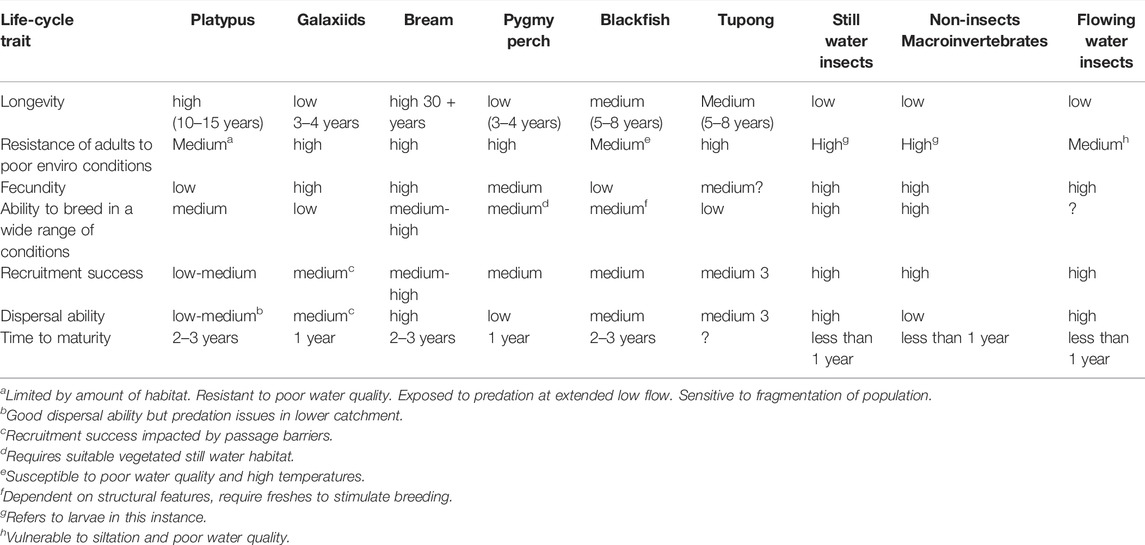
TABLE 3. Life-history traits of priority environmental values in the Werribee River.
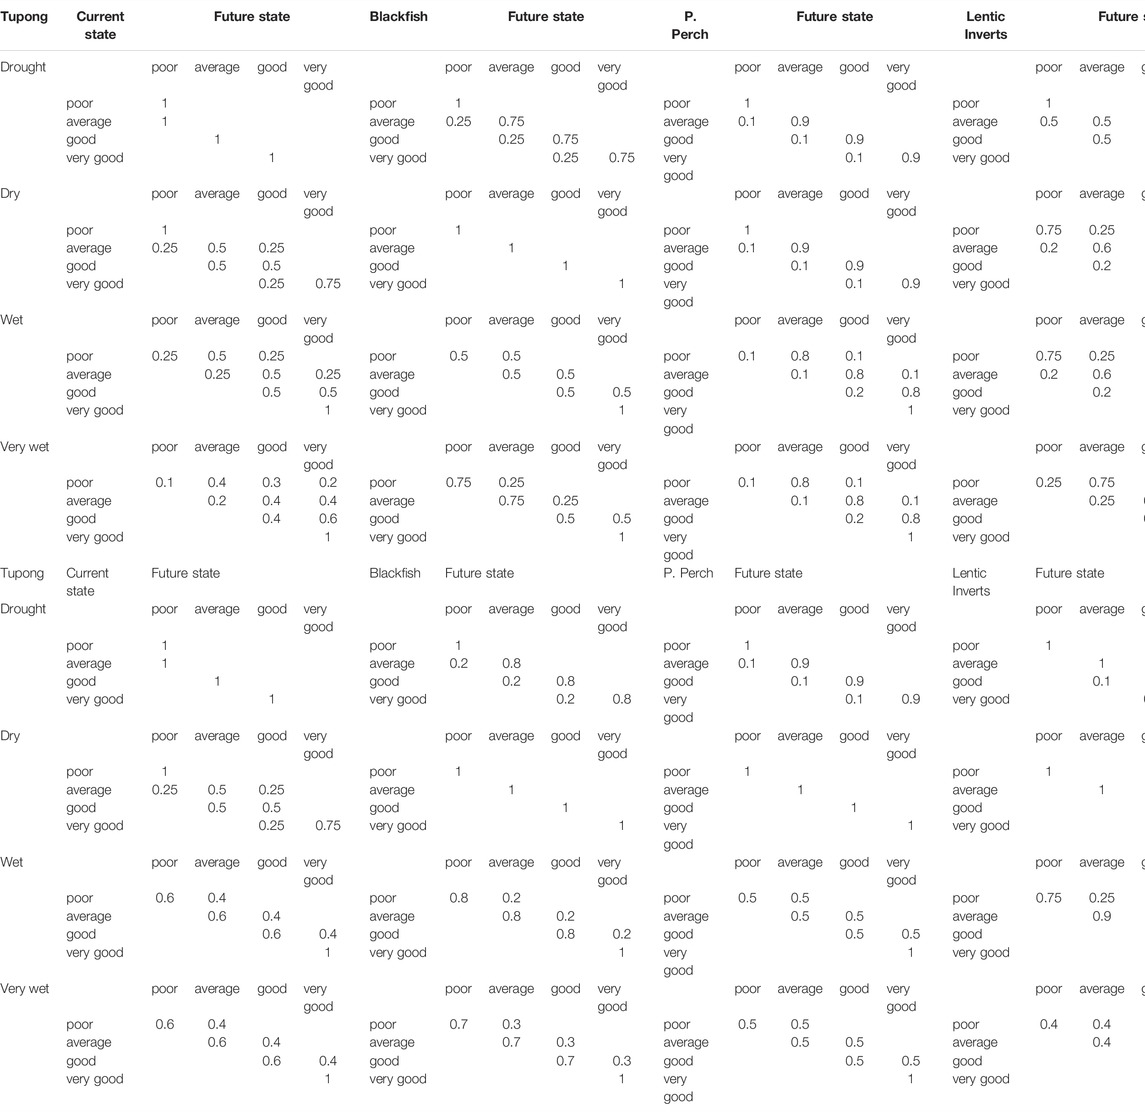
TABLE 4. State-transition matrices for eight priority ecological values (populations/communities) in the Werribee River. Numbers in each table represent the probability that the population will transition from the current state (left hand column) to the future state (top row) in a given time-step conditional on the hydrologic state (left-hand column).
Implicit in the expected transitions is a consideration of factors such as species-specific tolerances to harsh environmental conditions or habitat loss, and species life-history traits. These together give rise to differential degrees of resistance and resilience to drought conditions (e.g., Crook et al., 2010), and hence population state, and dynamics over time. The transition matrices used in the current study were considered to be particular to the conditions that arise in the Werribee River during drought cycles, where the differences in flow-regime across drought to very wet years affect environmental conditions experienced by the biota based on local physical habitat conditions. While these flow-environment relationships are not unique to the Werribee River, it cannot be assumed that similar degrees of physical stress will arise equally across all river systems, and hence it is the methods, rather than the results that should be treated as generalizable to other river systems. During the elicitation process to construct the transition matrices, the group of experts were asked a series of questions regarding the likely response to different hydrological conditions given a particular antecedent ecological state. Lower levels of certainty regarding the response and/or less predictable responses were reflected in state-transition probabilities being more evenly spread across multiple transition pathways. Having conducted an initial round of matrix construction, a series of scenarios were run and presented to the experts, and where modelled outcomes differed markedly from expectations, transition probabilities were revised to the point where they better reflected expected trends (especially in response to protracted drought and or recovery cycles). As an informal elicitation process, the team of experts worked together rather than independently to arrive at a consensus set of matrices for each taxa. This step could also be undertaken using independent matrix construction and the inclusion of uncertainties in matrix values, and furthermore the elicitation approach could be substituted with outputs from empirical surveys if sufficient data is available. We also emphasise that in setting the probabilities for both hydrological and ecological state-transitions, consideration must be given to the unique local attributes of both the hydrology and ecology of the study system and its biota, and hence while the overall STSM approach is highly transferable, the transition probabilities themselves are not automatically applicable to other systems.
Changes in state expected at each time step were embodied in a series of transition-tables or matrices that were used to “project” population condition over time as a First-order Markov process. By selecting different matrices at each time step (e.g., based on wet year vs. dry year, or time since the last wet year), it was possible to express the effects of a range of drivers affecting population resistance and resilience to disturbance. This approach has elsewhere been described as a matrix-selection method (Burgman et al., 1993) or “environmental state method” (Beissinger, 1995) to matrix projection, because it directly relates the definition of matrices to the cyclical environmental conditions the model is intended to focus on (e.g., in this case relative drought severity).
The ecological state projections were completed using matrix multiplication. The current ecological state (t0_eco_state) was converted to a vector value of all possible states which was multiplied by a “projection-matrix” for the current hydrological state (MatrixHydro_state) in that year. This would provide a new vector (t1_eco_state) which described the change in ecological state based on the hydrological conditions of the current year. This would then be iterated across the time series to generate a time series of ecological states, which was replicated with stochastic sequences of hydrologic states for each for each of the three-climate scenarios. A burn in period of 10 years was used to decrease the influence of the initial ecological state on the resultant time-series of ecological condition.
The modelled sequences reflected the observed declines in condition for a number of species/communities toward the end of the millennium drought, and a rapid recovery once the drought broke. These included two fish, galaxiids and tupong, and lotic macroinvertebrates (Figure 4). While there are insufficient data to conduct a more thorough validation, galaxiids and tupong were recorded in similar numbers in 2006 and 2012 (McGuckin, 2006; McGuckin, 2012), consistent with predictions, although there is no data to indicate the state of the population prior to the drought and at its peak in 2009. There are also no published time-series data for macroinvertebrates. The models also predicted the contrasting response of black bream in the estuary, a species that was expected to show little response to the drought conditions due to its ability to tolerate a wide range of salinity levels and to breed and recruit under a wide range of hydrologic conditions (Williams et al., 2012). While there are no time-series data available for bream, surveys in 2012 found the population to be in good health, with higher catch per unit effort (CPUE) in the Werribee than in any other Victorian estuary (Warry et al., 2013).
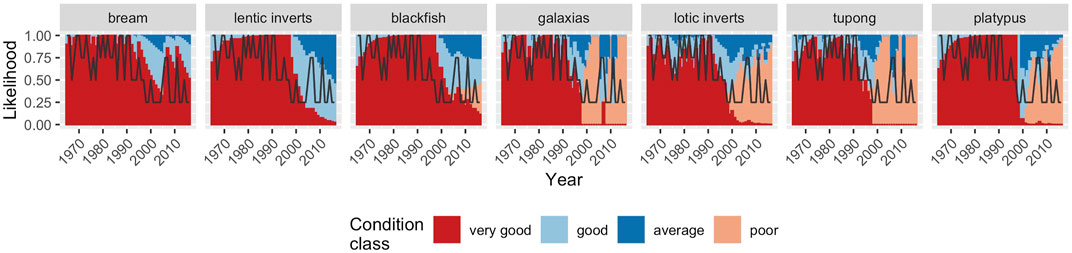
FIGURE 4. Predicted condition states for each population/community for the observed flow sequence from 1990 to 2010. The black line shows the runoff class in each year; 0.25 = “Drought”, 0.5 = “Dry”, 0.75 = Wet, and 1 = “Very wet”.
In contrast to those species that showed a quick recovery or limited change, a number of other taxa were predicted to show much slower recovery. For example, platypus populations were predicted to still be in relatively poor condition several years after the drought due to their lower reproductive capacity, although some recovery was still forecast. This prediction of a small but lagged recovery contrasts, however, with recent surveys which suggest populations have not recovered (Josh Griffiths, unpublished data). It is also the case that the model predictions were “optimistic” regarding the initial health of platypus populations (Figure 4), which in reality, were already in poor condition prior to the drought (Griffiths et al., 2021). Predictions for several other species, such as those for river blackfish and for southern pygmy perch are untested.
Stochastic projections of population condition were created for each of the three climate scenarios. Individual model runs highlight the dynamic nature of population cycles of some species, relative the greater overall stability of others. Additionally, there was a trend toward an increased risk of some species populations’ being in poor condition for much of the time under scenarios of more persistent droughts (Figures 5, 6). These risks were especially high for platypus and for migratory fish, which experts predicted would suffer from the loss of longitudinal connectivity, and hence breeding opportunities, in drought years. Several other species, such as black bream and southern pygmy perch were largely resistant to increased drought persistence, although pygmy perch are known to be affected by other local stressors not reflected in these scenarios such as predation by introduced species. Several taxa, including galaxiids and lotic invertebrates showed dynamic responses under all three scenarios, and even with more persistent droughts, only brief periods of favourable conditions are predicted to allow population condition to recover quickly (Figure 5).
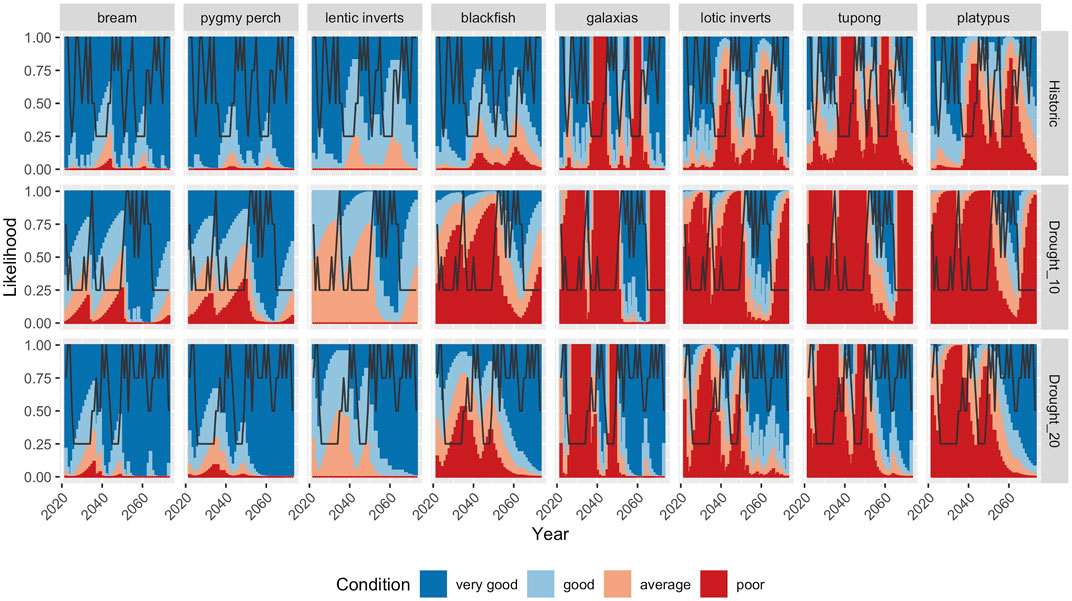
FIGURE 5. Projected trends in condition of each population/community under a single hypothetical hydrologic sequence produced under each climate scenario: historical sequence (top), 10% increase in drought persistence (middle) and 20% increase in drought persistence (bottom). The black line shows the runoff class in each year; 0.25 = “Drought”, 0.5 = “Dry”, 0.75 = Wet, and 1 = “Very wet”.
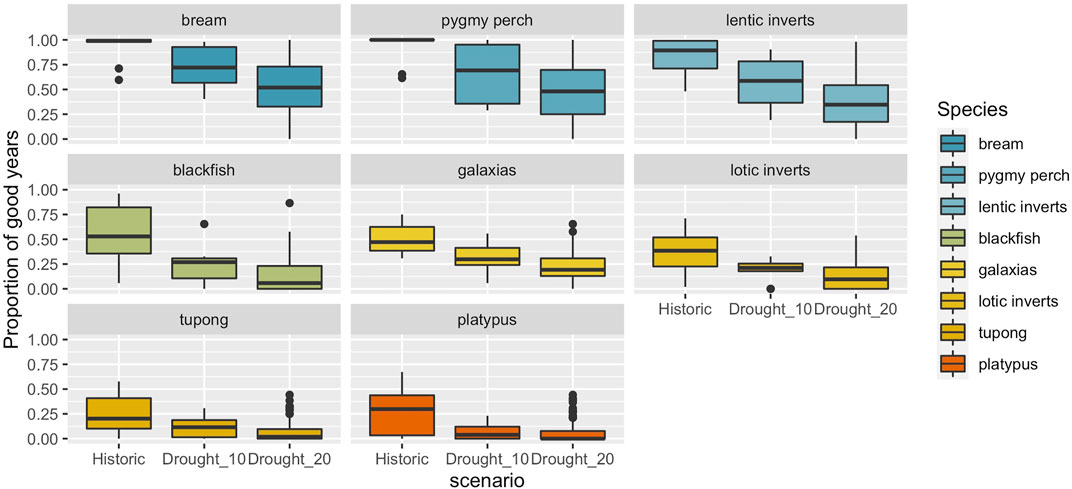
FIGURE 6. Summary of condition of each population/community under replicate (n = 100) stochastic projections of hydrologic sequences for each climate scenario: historical, 10% drought increase, and 20% drought increase. Boxes represent the 25–75th percentiles, whiskers represent 5–15th and 75th-95th percentiles, and individual points the 5th and 95th percentiles.
Averaging across multiple simulations under each climate scenario there is a clear gradient of responses to increased drought persistence (Figure 6 top panel), with species such as bream, southern pygmy perch and communities of lentic invertebrates relatively unaffected. By contrast, river blackfish, galaxiids and lotic invertebrates showed large declines in condition, even under a 10% increase in drought persistence, and with only minor declines in condition if drought persistence was to increase by 20% (Figure 6, middle panel). Finally, two taxa, tupong and platypus showed declines in condition under the two drought scenarios relative to the historic climate, but these declines were against a backdrop of relatively few years in which populations were predicted to be in good condition even under the historic baseline (Figure 6, bottom panel).
Within the flow-ecology research discipline there is an emerging focus on the development of models that can make temporally specific predictions under future flow scenarios (Lytle et al., 2017; Wheeler et al., 2017; Tonkin et al., 2019). However, currently there are few examples in which such models have been developed and applied in the flow-ecology literature, and many such formulations, such as mechanistic demographic models, require detailed information on vital rates (fecundity, survival, dispersal) that is unavailable for most species and/or locations (Urban et al., 2016).
An alternative formulation that provides limited insight into underlying mechanisms, but which is more readily formulated from simple time-series data or from expert opinion is a simple sequential-state rate-based modelling approach, which seeks to model changes in state from one time-step to another based on some combination of antecedent conditions. Such approaches have been widely used in vegetation science, but are relatively underutilized in flow ecology research (Freeman et al., 2012; Bond et al., 2018). Here we showed that such models can be relatively easily developed and applied to explore expected population and community dynamics in response to stochastically generated future flow sequences. Furthermore, the models for exploring the hydrological and ecological dynamics (and associated uncertainties) are of a similar level of complexity, thereby maximizing the efficiency of model development across those two domains. It is worth noting that while we used simple annual flow classes to define hydrologic “states”, an easy extension is to use a Hidden Markov Model (HMM) to generate a sequence of observed “events” (such as a the occurrence of a particular flow pulse of specific magnitude and duration), the probability of which is a product of both the probability of transitioning between different hydrologic states and the probability of each states “emission” of that event (e.g., Yen et al., 2013).
We modelled a suite of single species (fish, platypus) and community (invertebrate) responses using an ordered ordinal scale to describe population and community status (from poor to good). Our approach considered the effects of antecedent flow conditions at an annual time-step (i.e., wet years vs. dry years), but with the response to these antecedent conditions also conditional upon population health in the prior year.
Our modelled trajectories mirrored expectations and observed trends in the condition of most populations in the Werribee River, including the protracted, and in some cases slow and relatively minor declines (e.g., bream) during the millennium drought (1997–2009) and rapid responses to short-term improvements in hydrologic conditions, such as the response of galaxiid populations in response to flow pulses in 2006/7, 2010/11. It is also notable that some populations (e.g., platypus and tupong) show no substantial recovery after the millennium drought, which reflects the fact that hydrologic conditions have been less severe, but still sufficiently dry to limit population recovery. While we do not have local data to validate these predictions, they are consistent with observations more broadly for one of these two species, platypus, which have undergone relatively widespread declines in abundance across their broader geographic range due to drought (Serena and Williams, 2010; Bino et al., 2021). Long-term monitoring of population dynamics would greatly improve our ability to more confidently paramaterise and validate models such as these in the future.
The impacts of the millennium drought were amplified in the two scenarios of more protracted drought, which again aligns with expectations that many populations will contract and go locally extinct across parts of their range because of climate change (Bond et al., 2011; Bino et al., 2019). One limitation of our models is that they do not include extinction as an irreversible endpoint, although the inclusion of such absorbing states in the Markov chain is straightforward if the conditions leading to local extinction and no-recovery can be characterized. For some species, such as those requiring a specific breeding trigger at sub-generational time-scales, this may be relatively straightforward using simple models such as those described here, while in other cases such circumstances may be harder to predict. Indeed, a broader limitation is the fact that absorbing states such as extinction must be “hard-wired” into the models we developed (either from empirical observations of past such events or from expert input around situations where such an outcome would be expected). This is different from more mechanistic models, in which such outcomes may arise from specific combinations of underlying rate processes (e.g., in terms of recruitment and mortality) that have not been previously observed.
While there are a number of limitations to the non-mechanistic STSMs we have developed, they offer several advantages over traditional purely “state” based modelling approaches, namely;
1) They provide a simple framework for examining temporal flow-ecology dynamics.
2) The formulation can provide a steppingstone away from purely “state” based thinking toward a “rates” approach.
3) Transition matrices can be derived from time-series data or from expert elicitation, and outputs from both approaches can be validated using new data.
4) The models are amenable to being run with input from hydrological models of comparable complexity, including extension to consider HMMs and more complex hydrologic scenarios.
5) The models can be run stochastically and represent either deterministic or probabilistic state-changes at each time-step as befits the situation and available input/calibration data.
6) The models are much less data intensive than comparable mechanistic “rate” based approaches, while remaining testable.
We hope this case-study demonstration will encourage broader efforts to develop similar tools and approaches for modelling flow-ecology relationships. We believe STSMs will hold particular value in those situations where detailed mechanistic models are not tractable, and yet greater ecological realism is required for communicating and evaluating ecosystem dynamics under alternative flow scenarios.
The raw data supporting the conclusions of this article will be made available by the authors, without undue reservation.
NB conceived the study, analysed the data and results and wrote the manuscript. AH contributed to the development of the approach and reviewed/edited the manuscript. LM contributed to the development of the approach and reviewed/edited the manuscript. RC helped conceive the approach, helped refine the transition matrices and reviewed/edited the manuscript.
AH was funded through an ARC DECRA award (DE180100550).
RC was employed by the company Melbourne Water.
The remaining authors declare that the research was conducted in the absence of any commercial or financial relationships that could be construed as a potential conflict of interest.
All claims expressed in this article are solely those of the authors and do not necessarily represent those of their affiliated organizations, or those of the publisher, the editors and the reviewers. Any product that may be evaluated in this article, or claim that may be made by its manufacturer, is not guaranteed or endorsed by the publisher.
We would like to thank Tim Doeg, Edward Tsyrlin, Simon Treadwell, Bill Moulden, Amanda Wealands, Paul Reich, Wayne Koster, Jodie Braszell, Mark Toomey and Tori Perrin, who attended the Melbourne Water climate change planning workshop for the Werribee River where the modelling approach was originally proposed. This team also represents the technical experts who contributed to the development of the transition matrices for each taxonomic group.
Baker, W. L. (1989). A Review of Models of Landscape Change. Landsc. Ecol. 2, 111–133. doi:10.1007/bf00137155
Beissinger, S. R. (1995). Modeling Extinction in Periodic Environments: Everglades Water Levels and Snail Kite Population Viability. Ecol. Appl. 5, 618–631. doi:10.2307/1941971
Beissinger, S. R., and Westphal, M. I. (1998). On the Use of Demographic Models of Population Viability in Endangered Species Management. J. Wildl. Manag. 62, 821–841. doi:10.2307/3802534
Bino, G., Hawke, T., and Kingsford, R. T. (2021). Synergistic Effects of a Severe Drought and Fire on Platypuses. Sci. Total Environ. 777, 146137. doi:10.1016/j.scitotenv.2021.146137
Bino, G., Kingsford, R. T., Archer, M., Connolly, J. H., Day, J., Dias, K., et al. (2019). The Platypus: Evolutionary History, Biology, and an Uncertain Future. J. Mammal. 100, 308–327. doi:10.1093/jmammal/gyz058
Bond, N. R., Grigg, N., Roberts, J., Mcginness, H., Nielsen, D., O'brien, M., et al. (2018). Assessment of Environmental Flow Scenarios Using State-And-Transition Models. Freshw. Biol. 63, 804–816. doi:10.1111/fwb.13060
Bond, N. R., Lake, P. S., and Arthington, A. H. (2008). The Impacts of Drought on Freshwater Ecosystems: an Australian Perspective. Hydrobiologia 600, 3–16. doi:10.1007/s10750-008-9326-z
Bond, N., Thomson, J., Reich, P., and Stein, J. (2011). Using Species Distribution Models to Infer Potential Climate Change-Induced Range Shifts of Freshwater Fish in South-Eastern Australia. Mar. Freshw. Res. 62, 1043–1061. doi:10.1071/mf10286
Burgman, M. A., Ferson, S., and Akçakaya, H. R. (1993). Risk Assessment in Conservation Biology. Germany: Springer Science & Business Media.
Crook, D. A., Reich, P., Bond, N. R., Mcmaster, D., Koehn, J. D., and Lake, P. S. (2010). Using Biological Information to Support Proactive Strategies for Managing Freshwater Fish during Drought. Mar. Freshw. Res. 61, 379–387. doi:10.1071/mf09209
Daniel, C. J., Frid, L., Sleeter, B. M., and Fortin, M. J. (2016). State‐and‐transition Simulation Models: a Framework for Forecasting Landscape Change. Methods Ecol. Evol. 7, 1413–1423. doi:10.1111/2041-210x.12597
Freeman, M. C., Buell, G. R., Hay, L. E., Hughes, W. B., Jacobson, R. B., Jones, J. W., et al. (2012). Linking River Management to Species Conservation Using Dynamic Landscape-Scale Models. River Research and Applications. n-a-n-a.
Griffiths, J., Tingley, R., and Weeks, A. (2021). Distribution and Relative Abundance of Platypuses in the Greater Melbourne Area: Survey Results 2018-20. Melbourne: CESAR.
Horne, A. C., Nathan, R., Poff, N. L., Bond, N. R., Webb, J. A., Wang, J., et al. (2019). Modeling Flow-Ecology Responses in the Anthropocene: Challenges for Sustainable Riverine Management. BioScience 69, 789–799. doi:10.1093/biosci/biz087
Koehn, J. D., and O‘Connor, W. (1990). Biological Information for Management of Native Freshwater Fish in Victoria. Melbourne: Victorian Government Printer on behalf of Freshwater Fish Management Branch, Department of Conservation and Environment.
Lake, P. S. (2006). Effects on Aquatic Ecosystems. J. Photochem. Photobiol. B Biol. 46, 61. doi:10.1016/S1011-1344(98)00185-7
Lloyd, L., Anderson, B. G., Cooling, M., Gippel, C., Pope, A., and Sherwood, J. (2008). Environmental Water Requirements of the Werribee River Estuary: Final Estuary FLOWS Report. Syndal, VIC: Lloyd Environmental Pty Ltd.
Lytle, D. A., Merritt, D. M., Tonkin, J. D., Olden, J. D., and Reynolds, L. V. (2017). Linking River Flow Regimes to Riparian Plant Guilds: a Community‐wide Modeling Approach. Ecol. Appl. 27, 1338–1350. doi:10.1002/eap.1528
Mcguckin, J. (2006). A Fish Survey of the Werribee River Catchment. Melbourne: Streamline Research Pty Ltd.
Mcguckin, J. (2012). A Fish Survey of the Werribee River Catchment. Melbourne: Streamline Research Pty Ltd.
Mcintyre, S., and Lavorel, S. (2007). A Conceptual Model of Land Use Effects on the Structure and Function of Herbaceous Vegetation. Agric. Ecosyst. Environ. 119, 11–21. doi:10.1016/j.agee.2006.06.013
Plant, R. E., and Vayssières, M. P. (2000). Combining Expert System and GIS Technology to Implement a State-Transition Model of Oak Woodlands. Comput. Electron. Agric. 27, 71–93. doi:10.1016/s0168-1699(00)00099-5
Rose, P., Metzeling, L., and Catzikiris, S. (2008). Can Macroinvertebrate Rapid Bioassessment Methods Be Used to Assess River Health during Drought in South Eastern Australian Streams? Freshw. Biol. 53, 2626–2638. doi:10.1111/j.1365-2427.2008.02074.x
Serena, M., and Grant, T. R. (2017). Effect of Flow on Platypus (Ornithorhynchus anatinus) Reproduction and Related Population Processes in the Upper Shoalhaven River. Aust. J. Zool. 65, 130110–130139. doi:10.1071/zo17025
Serena, M., and Williams, G. (2010). Factors Contributing to Platypus Mortality in Victoria. victoria: Field Naturalists Club of Victoria.
Sharpe, A. (2014). Werribee River Environmental Flows Review: Recommendations Report. Melbourne: Jacobs.
Shenton, W., Bond, N. R., Yen, J. D. L., and Mac Nally, R. (2012). Putting the “Ecology” into Environmental Flows: Ecological Dynamics and Demographic Modelling. Environ. Manag. 50, 1–10. doi:10.1007/s00267-012-9864-z
Tonkin, J. D., Poff, N. L., Bond, N. R., Horne, A., Merritt, D. M., Reynolds, L. V., et al. (2019). Prepare River Ecosystems for an Uncertain Future. Nature 570, 301–303. doi:10.1038/d41586-019-01877-1
Urban, M. C., Bocedi, G., Hendry, A. P., Mihoub, J. B., Pe'er, G., Singer, A., et al. (2016). Improving the Forecast for Biodiversity under Climate Change. Science 353, aad8466. doi:10.1126/science.aad8466
Warry, F. Y., Reich, P., Hindell, J. S., Mckenzie, J., and Pickworth, A. (2013). Using New Electrofishing Technology to Amp-Up Fish Sampling in Estuarine Habitats. J. Fish. Biol. 82, 1119–1137. doi:10.1111/jfb.12044
Wheeler, K., Wenger, S. J., and Freeman, M. C. (2017). States and Rates: Complementary Approaches to Developing Flow-Ecology Relationships. Freshw. Biol. 63, 906-916. doi:10.1111/fwb.13001
Williams, J., Hindell, J. S., Swearer, S. E., and Jenkins, G. P. (2012). Influence of Freshwater Flows on the Distribution of Eggs and Larvae of Black Bream Acanthopagrus butcheri within a Drought-Affected Estuary. J. Fish Biol. 80, 2281–2301. doi:10.1111/j.1095-8649.2012.03283.x
Keywords: environmental flows, climate-change, ecological modelling, simulation models, fish, platypus
Citation: Bond NR, Horne AC, McPhan LM and Coleman R (2022) Using State-and-Transition Simulation Models (STSMs) to Explore Dynamic Population Responses to Drought Cycles in Freshwater Ecosystems. Front. Environ. Sci. 10:815080. doi: 10.3389/fenvs.2022.815080
Received: 15 November 2021; Accepted: 16 June 2022;
Published: 22 August 2022.
Edited by:
Anik Bhaduri, Griffith University, AustraliaReviewed by:
Jeyaraj Antony Johnson, Wildlife Institute of India, IndiaCopyright © 2022 Bond, Horne, McPhan and Coleman. This is an open-access article distributed under the terms of the Creative Commons Attribution License (CC BY). The use, distribution or reproduction in other forums is permitted, provided the original author(s) and the copyright owner(s) are credited and that the original publication in this journal is cited, in accordance with accepted academic practice. No use, distribution or reproduction is permitted which does not comply with these terms.
*Correspondence: Nick R. Bond, bi5ib25kQGxhdHJvYmUuZWR1LmF1
Disclaimer: All claims expressed in this article are solely those of the authors and do not necessarily represent those of their affiliated organizations, or those of the publisher, the editors and the reviewers. Any product that may be evaluated in this article or claim that may be made by its manufacturer is not guaranteed or endorsed by the publisher.
Research integrity at Frontiers
Learn more about the work of our research integrity team to safeguard the quality of each article we publish.