 Hujia Zhao1*
 Ke Gui2Yanjun Ma1Yangfeng Wang2Yaqiang Wang2
 Hong Wang2Yuanyuan Dou3Yu Zheng2
 Lei Li2Lei Zhang2Yuqi Zhang4
 Huizheng Che2Xiaoye Zhang2
- 1Institute of Atmospheric Environment, China Meteorological Administration, Shenyang, China
- 2State Key Laboratory of Severe Weather (LASW) and Key Laboratory for Atmospheric Chemistry (LAC), Institute of Atmospheric Composition and Environmental Meteorology, Chinese Academy of Meteorological Sciences (CAMS), CMA, Beijing, China
- 3Weifang Municipal Linqu Ecology and Environment Monitoring Center, Weifang, China
- 4Liaoning Meteorological Service Center, Liaoning Meteorological Bureau, Shenyang, China
Located in East Asia, the North China Plain (NCP) has a severe air pollution problem. In this study, variations in visibility, particulate matter (PM), gaseous pollutants, vertical meteorological parameters, and different types of aerosols and their optical properties were evaluated during an air pollution episode that occurred from 10 to 15 January 2019 in Tianjin over the NCP. The visibility was <10 km for approximately 96 h, and the concentrations of PM with an aerodynamic diameter of <2.5 μm (PM2.5) and <10 μm (PM10) increased to 300 and 400 μg/m3, respectively. Because of the conversion of SO2 to sulphate aerosol particles, the sulphur dioxide (SO2) concentration decreased to a minimum of 10 μg/m3. The continual deterioration of visibility was related to the high relative humidity and the boundary layer of <0.1 km. The southwest airflow (3.0–4.0 m/s) transported various pollutants from Hebei Province to the NCP. Higher mixing ratios of sulphate aerosols, organic aerosols, and black carbon aerosols were distributed over a 0.5-km-diameter area, and the maximum concentrations were approximately 90, 250–300, and 20 μg/kg, respectively. Higher mixing ratios of dust aerosols and sea salt aerosols were distributed within 1.5 km and 1.0–2.5 km, respectively, and their maximum concentrations were approximately 15 and 9 μg/kg, respectively. The findings are valuable for analysing the relationship between air quality and pollutant transport in the NCP.
Introduction
Aerosols can directly alter the energy balance of the earth–atmosphere system by absorbing and scattering solar radiation (Ackerman and Toon, 1981; Charlson et al., 1992; Hansen et al., 1997). Aerosols can facilitate the formation of cloud condensation nuclei, thereby causing changes in global and regional climates (Twomey et al., 1984; Hansen et al., 2000). Studies have investigated the environmental effects of aerosols, focusing on the problem of global climate change (Dubovik et al., 2002; Eck et al., 2005; Che et al., 2019; Gui et al., 2021a; Gui et al., 2021b).
In the past decade, PM2.5 has become the main pollutant in the urban areas of China during haze events because of the rapid development of the economy, the expansion of urbanisation, and the acceleration of energy consumption (Che et al., 2009; Zhang et al., 2009; Wang et al., 2014). The regional degradation of visibility in urban agglomerations in China characterised by intensive anthropogenic activities has garnered widespread public attention (Che et al., 2007; Chang et al., 2009; Zhang et al., 2012). The Beijing–Tianjin–Hebei (BTH) region is the political and cultural centre of China and a crucial economic zone in northern China. In recent years, severe pollution caused by PM2.5 in the BTH region has resulted in considerable public concern (Jin et al., 2016; Shen et al., 2019). Extreme haze episodes occur more frequently in the BTH region; moreover, several cities with poor air quality are located in this region (Che et al., 2014; Che et al., 2015). Studies have examined fine PM pollution in the BTH region because of its negative socioeconomic impacts (Gao et al., 2015; Zheng et al., 2015; Chen et al., 2017). During heavy pollution episodes, intercity transport is a crucial contributor to PM2.5 pollution in this region (Hua et al., 2016; Chang et al., 2018). Studies have conducted model simulations to estimate the contributions of different source regions (Zhang et al., 2013; Sun et al., 2016; Zou et al., 2018). In addition to regional transport, local atmospheric circulation substantially contributes to high PM2.5 pollution in the BTH region (Miao et al., 2015; Miao et al., 2017). Therefore, air pollution in the BTH region is mainly affected by local pollutant emission, specific regional topography, and regional pollutant transport.
Tianjin is the largest coastal city in the North China Plain (NCP; 117.2°E, 39.13°N). This city is the central functional area of the BTH region in China’s Capital Economic Circle and a vital central city in the Bohai Economic Circle in northern China. Continuous increases in anthropogenic activities as well as vehicle exhaust and coal combustion are key factors of pollutant emissions in this region (Wu et al., 2015; Zhao et al., 2019). In addition, seasonal biomass burning substantially contributes to PM2.5 pollution in Tianjin, thus affecting regional air quality (Andreae and Merlet, 2001; Yang et al., 2006; Chen et al., 2015). Tianjin Port, one of the world’s largest container ports, is affected by pollutant emissions from ships. Furthermore, mesoscale atmospheric circulation considerably contributes to air pollution in coastal areas (Corbett et al., 2007; Dore et al., 2007; Yau et al., 2012).
Most studies on pollution events in Tianjin have focused on particle concentration evolution, chemical composition, and regional transport (Bai et al., 2021; Lang et al., 2021; Li et al., 2021). Very few studies have examined the vertical mixing ratios of different types of aerosols. Thus, we synchronously observed near-surface and boundary-layer meteorological factors and aerosols in the vertical direction to examine mechanisms through which aerosols with different chemical compositions affect regional air quality, thus causing severe pollution. The findings provide insights into the mechanisms of regional severe air pollution. We investigated a pollution event characterised by high PM2.5 concentrations in the coastal city of Tianjin that occurred from 10 to 15 January 2019. Temporal variations in the concentrations of PM and gaseous pollutants as well as meteorological parameters, namely relative humidity (RH), temperature, wind speed (WS), and wind direction (WD), both near the surface and in the vertical direction, were examined. Moreover, potential sources contributing to PM2.5 emission during the sampling period were determined using the weighted potential source contribution function (WPSCF)/weighted concentration weighted trajectory (WCWT) model. In addition, we determined the effects of different types of aerosols and their contribution to aerosol extinction during the event. Multiple data sources were employed. The results may be used to formulate strategies for the prevention and control of local and regional air pollution in coastal areas during pollution events.
The remainder of the paper is organised as follows. Section 2 describes the study site and introduces the data used to analyse the temporal and vertical characteristics of pollution evolution. In Section 3, variations in pollutant concentrations, surface and vertical meteorological parameters, and potential PM2.5 sources during the event were examined. Moreover, the spatial distributions of aerosol optical properties are discussed according to the aerosol type and their effects on aerosol extinction during the episode. Finally, conclusions are drawn in Section 4.
Study Site and Data Collection
Tianjin is a large port city in China with a thriving chemical industry. The combined effects of local accumulation, regional transport, and secondary aerosol formation have resulted in severe atmospheric pollution in this region (Han et al., 2014). As shown in Figure 1, Tianjin is located east of the Bohai Sea. Local circulation, such as sea–land breeze, affects air quality under stable weather conditions. Under the effect of sea–land breeze circulation, the dispersion of pollutants to distant locations is inhibited, leading to pollutant accumulation (Han et al., 2015; Han et al., 2018). During severe pollution events, a convergence flow field appears in Tianjin and its surrounding areas, leading to high local pollution levels.
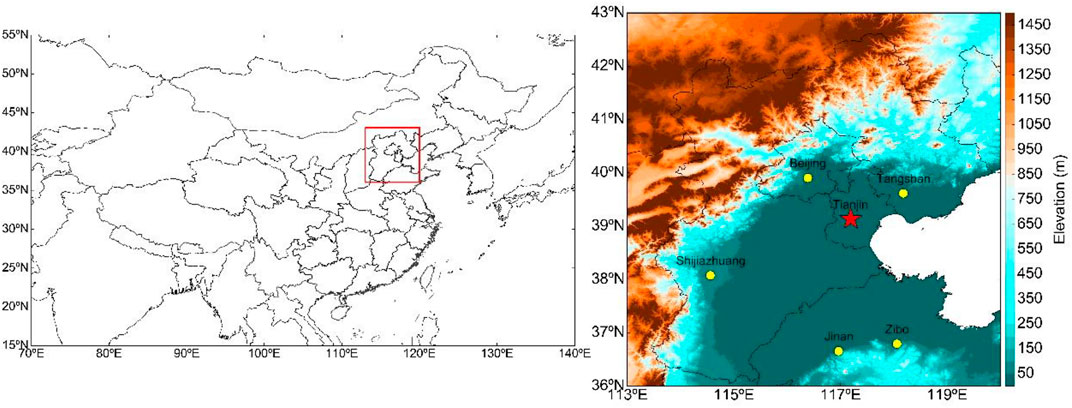
FIGURE 1. Study site and its surrounding area in the NCP; the red star represents Tianjin.
Data collected from six meteorological stations in Tianjin, comprising the hourly mass concentrations of four crucial particles and gaseous pollutants, namely PM2.5 (PM with an aerodynamic diameter of ≤2.5 μm), PM10 (PM with an aerodynamic diameter of ≤10 μm), SO2, and NO2, were obtained from the website of the China National Environmental Monitoring Centre (http://www.cnemc.cn). Furthermore, PM2.5 data collected nationwide over the study period were used to present the spatiotemporal evolution of PM2.5 in northern China. The time series analysis of the pollutants (Figure 2) is based on the average of data collected from the six stations.
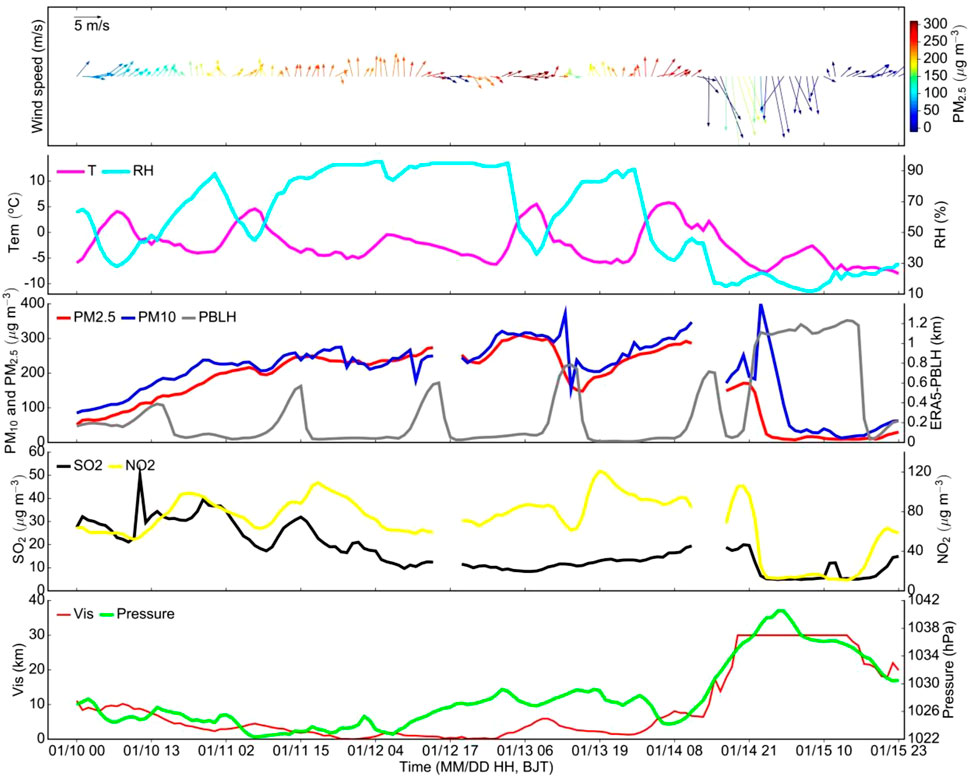
FIGURE 2. Time series variations in visibility, PM, gaseous pollutants, PBL height, and meteorology parameters from 10 to 15 January 2019 in Tianjin.
Data on hourly horizontal visibility, temperature, WS, WD, pressure, and RH at the surface was obtained from the Tianjin meteorological station (No. 54527, 39.0819°N, 117.0533°E; 3.3 m above sea level). This information is stored in the database of the National Meteorological Information Centre of the China Meteorological Administration (http://data.cma.cn/site/index.html).
Using TrajStat software (http://www.meteothink.org/products/trajstat.html), 72-h back trajectories corresponding to the period from 11 to 14 January 2019 (with 6-h intervals) were calculated and clustered by a starting height of 500 m. Two weight function models, namely the WPSCF and WCWT, were used to investigate the spatial distribution of potential PM2.5 sources for prevailing transport trajectories (Wang et al., 2006; Wang et al., 2009).
Potential source contribution function (PSCF) and concentration weighted trajectory (CWT) analyses of the study area (33.5°N–56.0°N, 85.0°E–117.5°E) were performed. A horizontal resolution grid of 0.5° × 0.5° was applied. To calculate the WPSCF and WCWT, global data assimilation system data with a resolution of 1° × 1° were used.
PSCF was analysed to calculate the probability that a source at latitude i and longitude j. The endpoints of the trajectory segment in each cell were obtained according to the results obtained by TrajStat and used to calculate the PSCF value of the grid cell. The following equation was employed:
where nij is the total number of endpoints present in a cell (i, j) and mij is the number of sources with concentrations higher than the threshold criterion when trajectories pass through the cell (i,j). According to China’s national ambient air quality standard (GB3095-2012: http://kjs.mep.gov.cn/hjbhbz/bzwb/dqhjbh/dqhjzlbz/201203/t20120302_224165.htm), the criterion value of a PM2.5 source was set to 75 μg m−3.
The weight function Wij was multiplied by the PSCF value to reduce the effect of the smaller nij. The equation used was as follows:
The CWT analysis was performed to localize the major sources of PM2.5. The
The equation used was as follows:
where
To analyse variations in weather conditions during pollution episodes, two-dimensional data (horizontal 10-m wind field [WF]) and planetary boundary layer [PBL] height) and three-dimensional data (vertical WF, vertical RH, and vertical temperature) were obtained from the European Centre for Medium-Range Weather Forecasts Reanalysis v5 (ERA5), data from which have a resolution of 0.25 ° × 0.25 °. The time–height distributions of RH, temperature, and WF for Tianjin (Figure 3) were obtained by interpolating the three-dimensional meteorological data in the ERA5 to those collected by the station.
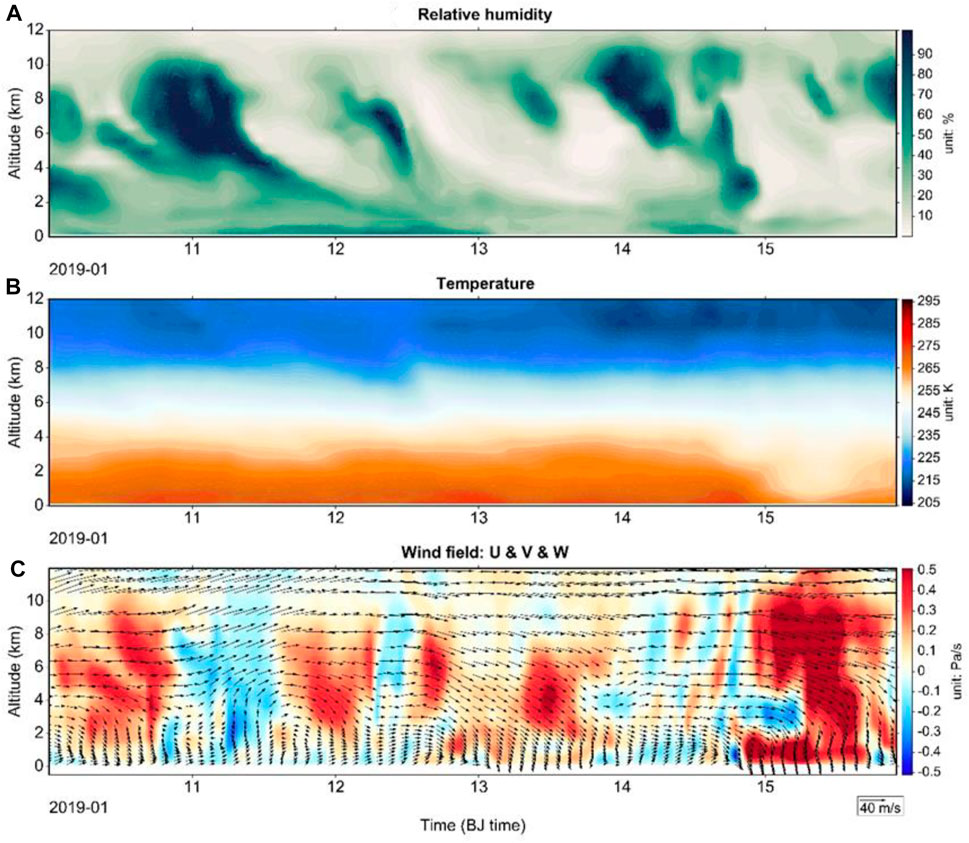
FIGURE 3. Time–height distribution of (A) RH, (B) temperature, and (C) WF from 10 to 15 January 2019 in Tianjin.
To examine regional aerosol extinction during the pollution episode, the spatial distributions of total aerosol optical depth (AOD) and different types of AOD (SO4AOD, DUAOD, OMAOD, BCAOD, and SSAOD), as well as the mixing ratios of sulphate aerosol, dust aerosol, organic matter aerosol, black carbon aerosol, and sea salt aerosol, were obtained from the Copernicus Atmosphere Monitoring Service Reanalysis (https://ads.atmosphere.copernicus.eu/cdsapp#!/dataset/cams-global-reanalysis-eac4?tab=overview) (Inness et al., 2019). The data have a resolution of 0.75° × 0.75°.
Results and Discussion
Temporal Variations in Visibility, PM, and Gaseous Pollutants
Temporal variations in visibility, PM2.5, PM10, and gaseous pollutant concentrations during a severe pollution episode that occurred from 10 to 15 January 2019 in Tianjin are presented in Figure 2.
During this pollution event, visibility deteriorated significantly, dropping below 5 km and lasting for approximately 96 h. In the early stage of the pollution episode, visibility was approximately 10 km at 0000 China Standard Time (CST) on 10 January; subsequently, visibility continued to decline, falling to under 5 km on 11 January. Notably, on 12 January, with the intensification of pollution, visibility was <1 km and accompanied by poor air quality. At 1700 CST on 14 January, air quality improved and visibility significantly increased to approximately 30 km until 15 January at the end of the pollution.
At the start of the pollution event, on 10 January, the PM2.5 concentration was approximately 50 μg/m3. With the further evolution of pollution, the PM2.5 concentration increased to approximately 200 μg/m3 at 0000 CST on 11 January, reaching approximately 250 μg/m3 on 12 January. On 13 January, with the continuous accumulation of pollutants, the PM2.5 concentration increased to 300 μg/m3. From night-time on 14 January to early morning on 15 January, the PM2.5 concentration decreased substantially to approximately 20 μg/m3. Compared with the influence of fine mode particles, the significant increase of PM10 mass concentration also reflects the important contribution of coarse particles to aerosol pollution in Tianjin. With the further exacerbation in pollution, the PM10 mass concentration increased to approximately 250 μg/m3 at 0000 CST on 11 January, reaching approximately 300 μg/m3 on 12 January. The PM10 mass concentration remained at the maximum of approximately 400 μg/m3 on 13 and 14 January. This result reveals the strong effect of the substantial increase in coarse particle emission sources on air quality in Tianjin during this period. This phenomenon corresponded to the dust contribution, which will be discussed in Section 3.5. On 15 January, after the end of the pollution event, the PM10 concentration significantly decreased to approximately 20 μg/m3.
Variations in the concentrations of SO2 and NO2, during the pollution event are displayed in Figure 2. In contrast to changes in the PM mass concentration (which significantly increased during the pollution event), the SO2 concentration exhibited a declining trend. The highest concentration of SO2 (∼30 μg/m3) was observed in the early stage of pollution on 10 January. With the further evolution of pollution, the SO2 concentration gradually decreased to approximately 20 μg/m3 on 11 January. When visibility was less than 5 km on 12 and 13 January, the SO2 concentration was at its lowest point of approximately 10 μg/m3. With the increase in visibility and improvement in air quality, the maximum SO2 concentration increased to approximately 20 μg/m3 on 14 January. On 15 January, air quality improved further, and the SO2 concentration remained low at <10 μg/m3 as the pollutants diffused. The variation in the SO2 concentration during the pollution event indicated the contribution of SO2 to the transformation and generation of sulphate aerosol. The accumulation of sulphate aerosols was one of the main factors affecting the formation and transformation of pollutants and is discussed in Section 3.5. Therefore, the effects of the emission and concentration of SO2 on air quality during air pollution should be investigated.
In contrast to the low SO2 concentration observed during the pollution event, the NO2 concentration remained at a certain level. The average NO2 concentration was approximately 30 μg/m3 from 10 to 14 January. The maximum daily NO2 concentration was observed in the evening, between 1900 and 2100 CST. During this period, motor vehicle emissions increased substantially, and the NO2 concentration increased to 40–50 μg/m3. On 15 January, the NO2 concentration dropped below 10 μg/m3. This finding indicates that the NO2 concentration was related to fossil fuel emissions from traffic sources (Dai et al., 2021). The results demonstrate that the main emission sources of gaseous pollutants in the NCP, including the energy, industry, transportation, residential, and port sectors, could contribute to specific aerosol concentrations in pollution events and affect air quality. NO2 from vehicle exhaust and SO2 from fuel combustion can lead to an increase in the PM2.5 concentration through precursor conversion.
Temporal Variations in Surface and Vertical Meteorological Parameters
Temporal variations in WS, temperature, RH, pressure, and PBL height during the study period (Figure 2) were evaluated to investigate the effects of meteorological conditions on air quality.
The PM2.5 mass concentration increased to 200–250 μg/m3 in the early morning of 11 and 12 January, and the average WS decreased to 1–2 m/s. Subsequently, the southwest airflow strengthened, and the pollutant concentration increased. The PM2.5 mass concentration increased to approximately 300 μg/m3 from the afternoon of 13 January to the morning of 14 January. On 14 and 15 January, the airflow from the northwestern and northeastern directions increased significantly, and the hourly WS was 8–10 m/s, contributing to aerosol dispersion and improved air quality. When pollution was at its most severe on 11 and 12 January, with the continuous deterioration of visibility, RH increased to approximately 90%. At the end of the pollution event, RH decreased to 30%–40%. The results reveal that the hygroscopic growth of aerosols under high RH significantly reduced visibility over the pollution episode. Temperatures increased as the pollution worsened; they were significantly higher on 13 January than on 12 January, with the highest temperature being 5°C. With the gradual reduction in the pollutant concentration, the average temperature began a reduction to approximately 0°C. The atmospheric boundary layer exhibited a significant diurnal fluctuation during the pollution process. With the further exacerbation of pollution, the nighttime and daytime height of the boundary layer was <0.1 km and approximately 0.7 km, respectively. On 15 January, with further improvements in visibility and air quality, the height of the boundary layer increased to 1.0–1.2 km. With the reduction in visibility, air pressure decreased to 1,022 hPa at 0800 CST on 11 January. At the end of the episode, air pressure increased to 1,042 hPa. These results indicate a positive correlation between visibility and air pressure. The low atmospheric pressure condition inhibited the upward dispersion of pollutants, leading to the accumulation of atmospheric pollutants near the surface, thus resulting in poor visibility.
We analysed vertical variations in meteorological parameters, namely RH, temperature, WS, and WD, at different heights during the pollution event (Figure 3). During the severe pollution period from 11 to 12 January, near-surface RH increased to approximately 50%–60%. With the further evolution of pollution, near-surface RH ranged between 70% and 80% on 13 January, and upper-atmosphere RH was close to 90%. At the end of the pollution event, on 14 January, near-surface RH decreased to approximately 20%, whereas near-surface RH was approximately 90% and distributed over approximate altitudes of 8–10 km. These results indicate that the pollution event was affected by the vertical distribution of RH. RH is a key factor that facilitates the transformation of SO2 and NO2 into sulphate and nitrate aerosols, respectively, through chemical reactions (Khoder 2002; Su et al., 2011). The temperature at an altitude of approximately 3 km was approximately 265 K from 9 to 13 January. On 14 January, the temperature dropped significantly to 255 K. The variation in the temperature distribution during the pollution period indicated that the combination of high temperature and RH is beneficial to the formation of secondary aerosols that exacerbate the level of aerosol pollution. The distribution of WF at different heights during the pollution process demonstrated that WS was low near the surface and that this altitude (0–2 km) was dominated by westerly airflow. With the evolution of pollution, airflow in the upper atmosphere exhibited a downward movement (∼0.3 Pa/s), and airflow near the surface presented a weak downdraft of approximately 0.2 Pa/s on 11 January. As pollutant accumulation intensified on 12 January, a descending airflow was observed near the surface, with a positive rate of 0.3–0.4 Pa/s. In particular, a strong downdraft (0.5 Pa/s) appeared at an altitude of 2–6 km in the upper atmosphere. Pollutants were transported to the ground with the downdraft; this phenomenon increased the local pollutant concentration. On 13 January, the near-surface and upper-atmosphere flows were stable at approximately 0 Pa/s, leading to the accumulation of pollutants. At the end of the pollution event, the rapidly sinking northwest airflow, the speed of which was approximately 0.5 Pa/s, facilitated pollutant dispersion.
Spatial Distribution of Daily Averages of PM2.5, WF, and PBL
Figure 4 depicts the spatial distribution of daily averages of PM2.5 and WF as well as PBL.
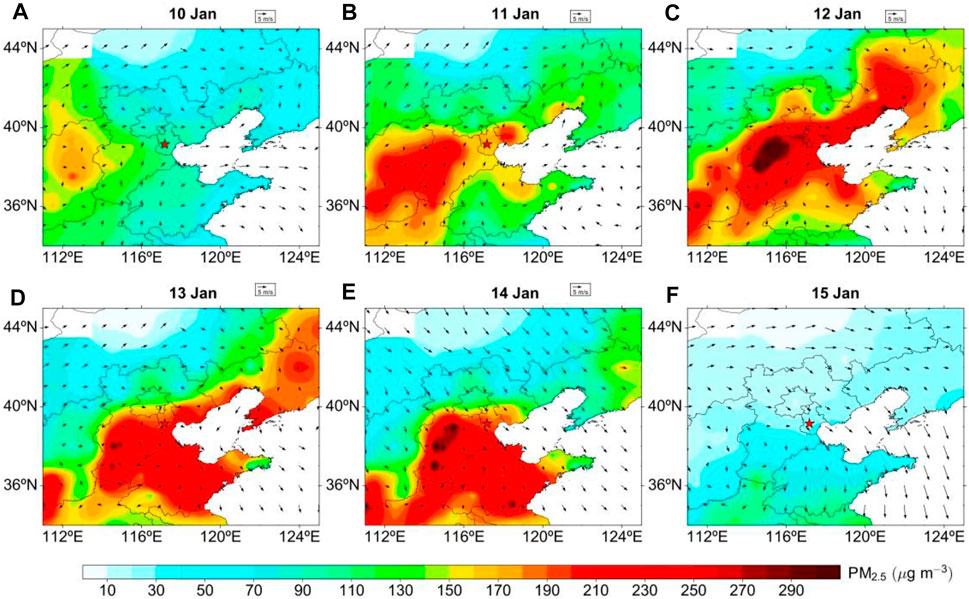
FIGURE 4. Spatial distribution of daily PM2.5 mass concentration and WF at 10 m from 10 to 15 January 2019 in Tianjin shown in (A–F).
On 10 January, the PM2.5 mass concentration in Tianjin was approximately 100 μg/m3. The highest concentration of PM2.5 (approximately 190 μg/m3) was observed in the southwest of Tianjin in Hebei Province. At that time, a southwest airflow, the speed of which was approximately 2.0 m/s, facilitated to the transport of pollutants to Tianjin. On 11 January, the spatial distribution of air pollutants in Tianjin and the southwest region intensified, and the PM2.5 concentration in Tianjin and its surrounding areas increased to 200 μg/m3. Moreover, the WF at 10 m, which was 1.0 m/s, was conducive to the initial accumulation of pollutants in Tianjin. During the severe pollution period on 12 January, the WF at 10 m indicated that the prevailing southwest airflow (3.0–4.0 m/s) transported various pollutants from Hebei Province to the NCP. Under the effect of the westerly airflow, a pollution belt characterised by the southwest–northeast transport of aerosols was formed. The centre of the high PM2.5 mass concentration (approximately 300 μg/m3) was observed in Baoding, Hebei Province. The daily average of the PM2.5 concentration in Tianjin was approximately 250 μg/m3 at that time. With an increase in westerly WS (∼2 m/s), pollutants were transported to the eastern coast. The daily average of the PM2.5 mass concentration in Tianjin remained high at nearly 200 μg/m3 on 13 January. On 14 January, with the gradual strengthening of the northwest wind (4–5 m/s), pollution continued to spread to eastern China. At that time, the daily average of the PM2.5 concentration in Tianjin was relatively low (approximately 190 μg/m3). Under the control of a strong northwest airflow (4–5 m/s), pollutants were dispersed from Tianjin on 15 January. The daily average of the PM2.5 concentration in Tianjin decreased to 30–50 μg/m3. These results indicate that the WF plays a crucial role in the transport and dispersion of pollutants, including the spatial distribution of PM2.5.
Considering the effect of the variation in the atmospheric boundary layer on air pollution, we examined the spatial variation in PBL during the pollution event.
As shown in Figure 5, the daily PBL height was approximately 200 m from 10 to 13 January. On 14 January, under the effect of the northwest airflow, the height of the atmospheric boundary layer in Tianjin significantly increased in the northwest direction, peaking at approximately 1,000 m. The average daily height of PBL in Tianjin increased to approximately 600 m on 14 January; this phenomenon was conducive to the dispersion of pollutants. Subsequently, the height of the boundary layer over the study area, centred in Tianjin, increased to approximately 600 m on 15 January.
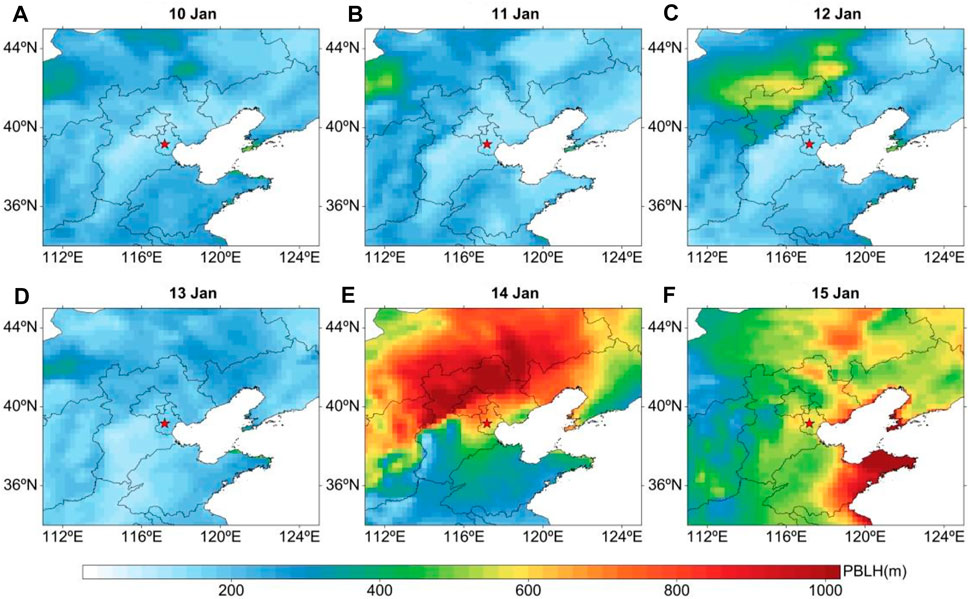
FIGURE 5. Spatial distribution of daily PBL height from 10 to 15 January 2019 in Tianjin shown in (A–F).
We used 72-h back trajectories to investigate main potential sources during the pollution event. Moreover, the WPSCF and WCWT models were used to quantitatively analyse the local and regional contributions of pollutants (Figure 6 and Figure 7).
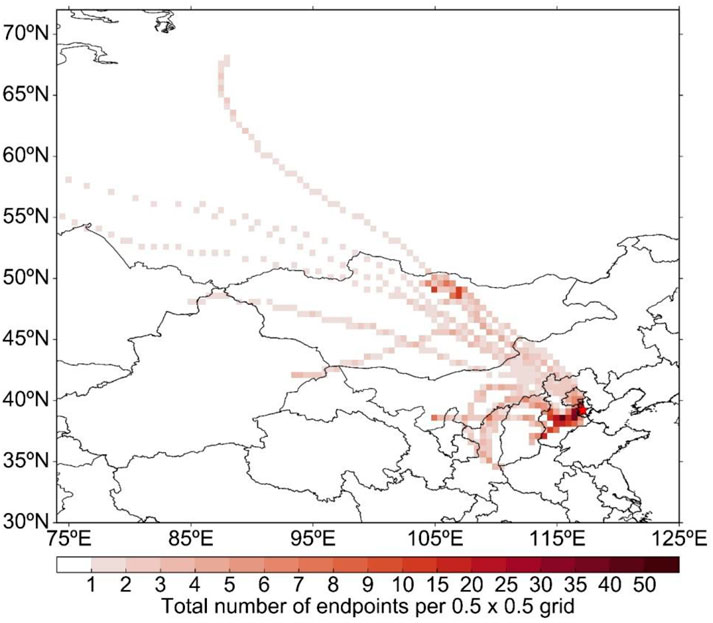
FIGURE 6. Back trajectories for a 72-h period from 10 to 15 January 2019 in Tianjin, expressed as the total number of trajectory endpoints in each 0.5 × 0.5 grid box.
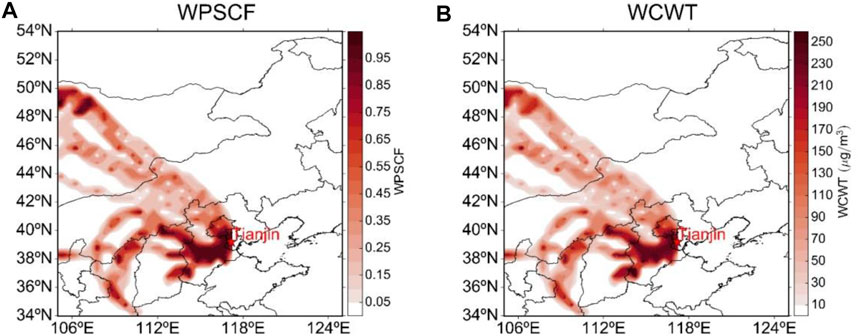
FIGURE 7. PM2.5 data obtained using the (A) WPSCF and (B) WCWT model for 10 to 15 January 2019 in Tianjin.
The trajectories of air pollutants in Tianjin on 11 to 14 January were analysed. The major trajectories mainly originated from two directions during the pollution process. One was the northwest direction, with a long, fast-moving transport pattern at a high altitude of 3–4 km; the other was the southwest direction, with a short, slow-moving transport pattern at a low altitude of <400 m. The WPSCF value of >0.9 indicated that the most likely source areas for PM2.5 pollution were Hebei Province, southwest of Tianjin, and most of the Shijiazhuang–Baoding area. A WCWT concentration of >200 μg/m3 was observed in the southwest of Tianjin, indicating that Hebei Province was the main source region for PM2.5 pollution in Tianjin during this pollution event.
Spatial Distribution of Daily AOD and AOD by Aerosol Type
The spatial distributions of total AOD and AOD by the aerosol type in the NCP during the pollution event are shown in Figure 8 and Figure 9. The characteristics of aerosol extinction during the pollution event varied significantly.
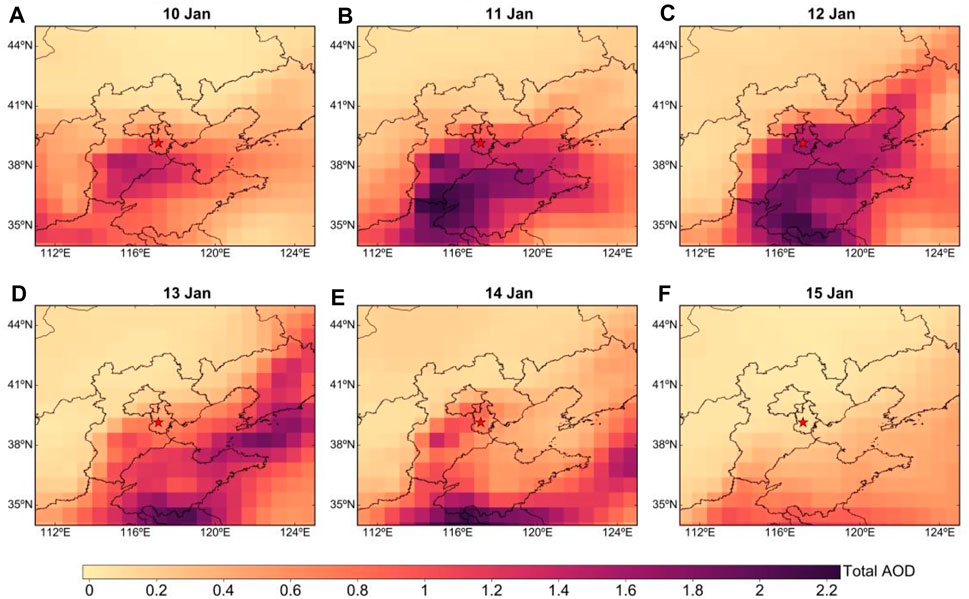
FIGURE 8. Spatial distribution of daily AOD from 10 to 15 January 2019 in Tianjin shown in (A–F).
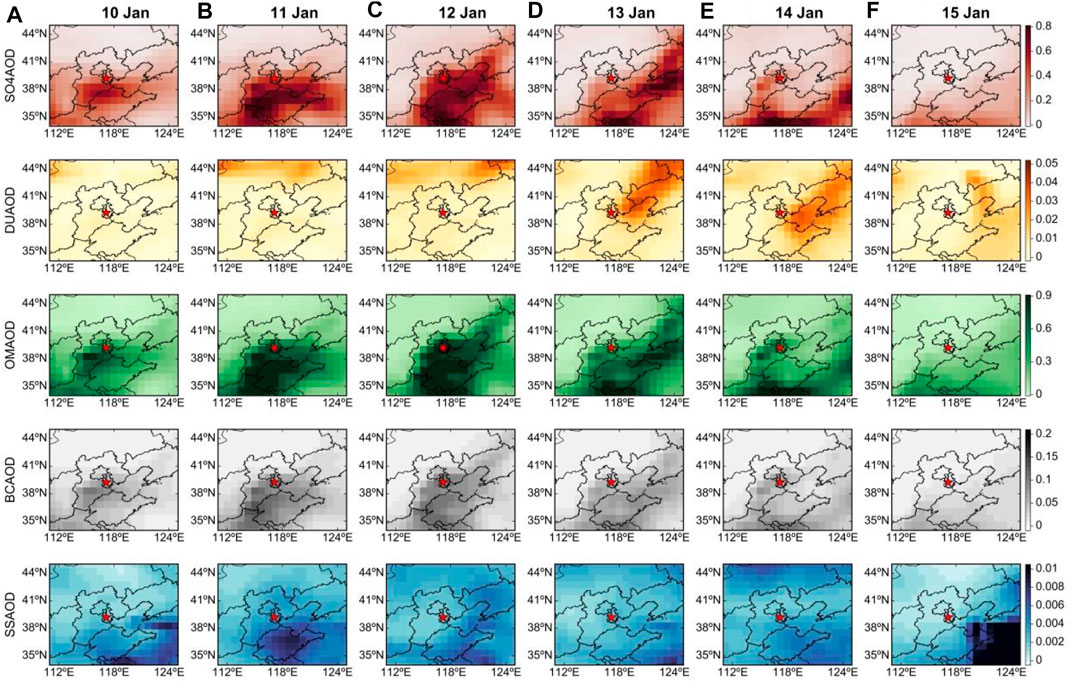
FIGURE 9. Spatial distribution of daily AOD by aerosol type from 10 to 15 January 2019 in Tianjin shown in (A–F).
On 10 January, the total AOD in Tianjin was 0.6–0.8, which is lower than that in the southwest region (∼1.2). This result indicated that the main source of pollution in Tianjin was Hebei Province, which located in the southwest. On 11 January, the total AOD in Tianjin increased to exceed 1.0, and as aerosol extinction spread from the surrounding areas of Hebei Province to the Shandong Peninsula, the AOD increased to 2.0. With the further exacerbation of pollution, aerosol extinction significantly increased in Tianjin, and the AOD increased to approximately 1.5 on 12 January. At that time, the pollution zone expanded to the eastern coastal area, and the AOD exceeded 2.0. With the further evolution of pollution, aerosol extinction in Tianjin weakened, and the total AOD dropped below 0.5 on 13 January. The relatively high near-surface PM concentration of approximately 300 μg/m3 indicated that aerosol pollution exerted a stronger effect at ground level. At that time, the total AOD in Hebei Province decreased to approximately 1.0, and severe pollution, as reflected by an AOD of >2.0, was observed in eastern China. With the eastward transport of pollutants, the AOD in Hebei Province, the source of pollution in the southwest of Tianjin, decreased to approximately 0.8 on 14 January.
We further discuss the contribution of different types of aerosols to aerosol extinction during the pollution event (Figure 9). On 10 January, the spatial distribution of SO4AOD in Tianjin was approximately 0.2, and the SO4AOD in the pollution source area in the southwest was approximately 0.5. On 11 January, the SO4AOD in Tianjin increased to approximately 0.5, and aerosol extinction in the surrounding area of Shijiazhuang, Hebei Province increased to 0.8. As pollution worsened, aerosol extinction increased significantly in Tianjin, and SO4AOD increased to approximately 0.6 on 12 January. On the same day, SO4AOD was high—more than 0.8—in the entire southwest–northeast line and the Bohai Sea. Sulphate aerosols are mainly emitted through anthropogenic activities conducted near ground level (Dai et al., 2021). Thus, the extinction of sulphate aerosols in the entire column decreased, whereas the near-surface PM concentration remained high. The SO4AOD distribution was higher on the east coast and in northeast plains. In the heavily polluted area, it was approximately 0.7. The distribution of SO4AOD (<0.1) was larger in the southwest of Tianjin. These results reveal the considerable effect of sulphate aerosol transport on the spatial distribution of aerosol extinction. According to the spatial distribution of DUAOD, dust particles from the northeast areas of Tianjin were found on 13 and 14 January. The effect of DUAOD on aerosol extinction was approximately 0.04 observed on 13 January, and the dust pollution zone spread to the east on 14 January. Changes in OMAOD showed a similar variation and spatial distribution as did SO4AOD during the pollution event. On 10 January, the highest OMAOD was approximately 0.3 in Tianjin. A higher OMAOD (∼0.6) was observed in the southwest area of Tianjin during that period. On 11 January, OMAOD in Tianjin and the surrounding regions increased substantially to 0.9 with increased aerosol extinction. As pollution worsened, OMAOD remained constant at 0.9 on 12 January in Tianjin. On the same day, high OMAOD was noted in the entire BTH region, eastern coastal areas, and the Bohai Sea, with an OMAOD of >0.9. Because coal burning, vehicle exhaust, and biomass combustion are the main emission sources of OC, pollutants were concentrated near ground level, resulting in a high PM concentration (Pang et al., 2020); however, the extinction of organic carbon aerosols in the entire column was weakened. This phenomenon indicated the significant contribution of organic aerosols to the extinction of organic aerosols in the NCP that was related to the emission source. During the early stage of pollution, on 10 January, the highest in Tianjin in BCAOD (∼0.05) was observed. The maximum BCAOD (∼0.07) was detected in the surrounding regions in the southwest. On 11 January, the BCAOD in Tianjin increased to approximately 0.07, and aerosol extinction in the surrounding areas of Hebei Province increased to 0.1. With the further evolution of pollution, aerosol extinction in Tianjin significantly increased, and the BCAOD reached approximately 0.1 on 12 January. At that time, high BCAOD (>0.1) was observed in the entire southwest–northeast line and the Bohai Sea. This observation indicates the contribution of black carbon aerosols to atmosphere extinction in the column. Moreover, the contribution of SSAOD to aerosol extinction in Tianjin during the pollution process was nonsignificant, and the SSAOD remained at approximately 0.002.
Time–Height Evolution of Different Types of Aerosols
Figure 10 displays the time–height vertical structural evolution of different types of aerosols during the pollution episode.
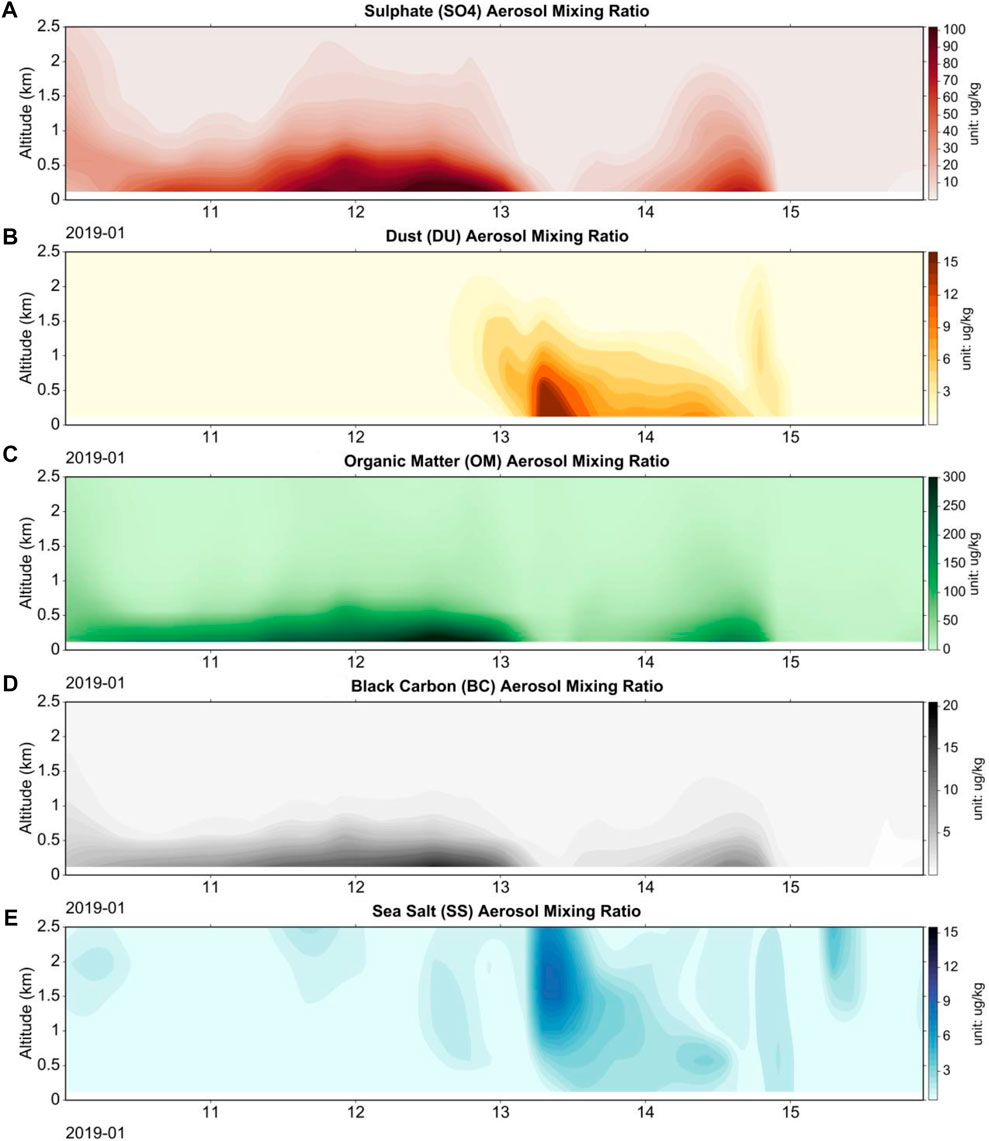
FIGURE 10. Time–height distribution of mixing ratios by aerosol type (A) SO4, (B) DU, (C) OM, (D) BC, and (E) SS from 10 to 15 January 2019 in Tianjin.
At 1200 CST on 10 January 2019, sulphate aerosols were distributed near the surface at an altitude of 1.0 km, and the mixing ratio of sulphate aerosols near the surface was 40–50 μg/kg. On 11 January, the proportion of near-surface sulphate aerosols gradually increased, and the mixing ratio of sulphate aerosols within an altitude of 1.0 km significantly increased to 80–90 μg/kg. The distribution of sulphate aerosols gradually increased, and sulphate aerosol layers of different concentrations appeared at an altitude of 1–2 km, with a mixing ratio of 10–20 μg/kg. On 12 January, pollution continued to intensify, and the mixing ratio of near-surface sulphate aerosols remained high. The mixing ratio of sulphate aerosols within an altitude of 0.5 km was >90 μg/kg. As pollution evolved from 13 to 14 January, the mixing ratio and distribution of sulphate aerosols decreased both near the surface and at high altitudes, and the mixing ratio of sulphate aerosols decreased to 50–60 μg/kg within an altitude of 1 km near the surface. The variation in the mixing ratios of sulphate aerosols in the pollution event indicated the conversion of SO2 to sulphate aerosols under high RH, reflecting a crucial relationship with the variation in RH near the surface and at high altitudes. This finding was confirmed by the SO2 emissions mentioned in Section 3.1.
Beginning on 13 January, dust aerosols were distributed from near the surface to an altitude of approximately 1.5 km. The mixing ratio of dust aerosols within 500 m near the surface was approximately 15 μg/kg, and the mixing ratio of dust aerosols at an altitude of 1.0–1.5 km was lower, at 3–6 μg/kg. Beginning on 14 January, with the reduction in dust aerosol pollution, the effect of dust aerosols gradually decreased within an altitude of 1 km, and the mixing ratio of dust aerosols near the surface decreased to 7–8 μg/kg within an altitude of 0.5 km. The presence of dust aerosols observed over the pollution event was consistent with the increase in PM10 emissions discussed in Section 3.1.
During the pollution event, organic aerosols had a high mixing ratio near the surface below an altitude of 0.5 km. The mixing ratio of organic aerosols on 10 January was approximately 100 μg/kg. With the evolution in pollution, the mixing ratio of organic aerosols near the surface gradually increased to 150–200 μg/kg on 11 January. With the intensification of pollution, the mixing ratio of near-surface organic aerosols reached a maximum of 250–300 μg/kg on 12 January. Furthermore, with the dispersion of pollution, the mixing ratio of organic aerosols decreased to approximately 150 μg/kg on 13 and 14 January. At the end of the pollution event on 15 January, organic aerosols disappeared. The vertical distribution of the mixing ratio of organic aerosols indicated that organic aerosols were mainly concentrated near the surface; this differed from the distribution of sulphate and dust aerosols in the upper atmosphere during the pollution event.
During the pollution episode, black carbon aerosols had a high mixing ratio near the surface below an altitude of 0.5 km. In the initial stage of pollution on 10 January, the mixing ratio of black carbon aerosols was approximately 5 μg/kg. With the further evolution of pollution, the mixing ratio of near-surface black carbon aerosols increased to 10–15 μg/kg on 11 January. As pollution continued to worsen, the mixing ratio of near-surface black carbon aerosols increased to 20 μg/kg on 12 January. With the dispersion of pollution, the mixing ratio of black carbon aerosols decreased to 10 μg/kg on 14 January. On 15 January, the black carbon aerosols had disappeared. The distribution of black carbon aerosols indicated that the effect of black carbon aerosols was mainly concentrated near the surface; this phenomenon is similar to that of organic carbon aerosols but different from the vertical distribution of sulphate and dust aerosols.
Because Tianjin is a coastal city, sea salt aerosols can cause a certain degree of air pollution. As shown in Figure 10, although the mixing ratio of sea salt aerosols was lower than that of other types of aerosols, it still was observed at an altitude of 1.0–2.5 km on 13 January. Combined with the time–height evolution of RH presented in Figure 3, the higher RH at a high altitude on 13 January was conducive to the hygroscopic growth of sea salt aerosols. With the vertical reduction in RH, the mixing ratio of sea salt aerosols decreased gradually. Because of the transport of water vapour in the atmosphere, sea salt aerosols were mainly distributed in the upper atmosphere and were strongly correlated with RH.
Discussions and Conclusion
With rapid economy development and massive anthropogenic emission, severe urban PM2.5 pollution have occurred frequently in major cities over the BTH region and its surroundings in China. Some studies analyzed the variations of PM2.5 and gaseous precursors and their chemical composition through in situ real-time comprehensive observation from measurement campaigns and simultaneously online measurements to examine the impact of meteorological conditions and pollutant emissions on air quality in these regions before and after the strictly controlled emissions. Dai et al. (2021) pointed out that SO2 and NO2 generated from vehicle emission and residential coal burning could be two major additional sources of environmental sulfate and nitrate during the haze episodes in Tianjin. Zhao et al. (2020) analyzed the long-range transport of dust and its impact on the pollution process that occurred in Tianjin by the westerly flow transported from northwestern China. Pang et al. (2020) investigated that NO3-, SO42+, and NH4+ was the main water-soluble ions contribute to PM2.5 pollution in Tianjin during the heating season. Li et al. (2021) presented the important contribution of increased nitrate concentration to PM2.5 during wintertime in Tianjin from 2014 to 2018. Shao et al. (2021) shown that nitrate aerosol was the most sensitive component to severe aerosol pollution under typical extremely unfavorable meteorological events in Tianjin.
In this study, an air pollution event in a typical city of the NCP was comprehensively analysed. In view of the core scientific problem of the whole process of the evolution of severe pollution, a comprehensive observation was conducted that overcame the limitation of a single observation data of near-surface stations. In particular, the temporal and spatial evolution of different composition aerosols was tracked. Temporal variations in visibility, PM mass concentration, PBL height, and vertical meteorological parameters as well as the spatial distributions of various types of aerosols and their optical properties were examined to determine aerosol pollution sources and regional transport characteristics during a pollution event from 10 to 15 January 2019 in Tianjin.
During this pollution event, the minimum visibility reached <5 km for approximately 96 h. The accumulative concentration of PM2.5 and PM10 reached 300 and 400 μg/m3, respectively. The variation in SO2 exhibited a declining trend, indicating the contribution of SO2 transformation to sulphate aerosols. The concentration of NO2 remained at approximately 30 μg/m3 which was significantly correlated with fossil fuel consumption and contributed to this pollution process.
The southwest airflow and low WS were dominant factors affecting PM accumulation and contributed to low visibility. With the continuous deterioration of visibility, RH increased to approximately 90%, thus aggravating pollution. A low PBL height of <0.1 km was observed during this period. The high RH in the vertical direction facilitated the chemical transformation of SO2 and NO2 into sulphate and nitrate aerosols, respectively.
The prevailing southwest airflow transported various pollutants from Hebei Province to the NCP at a WS of 3.0–4.0 m/s, and the daily PBL height was approximately 200 m. A WPSCF of >0.9 and a WCWT of >200 μg/m3 indicated that Hebei Province was the main source of PM2.5 pollution in Tianjin during the pollution episode.
The total AOD in Tianjin increased to approximately 1.5 during the pollution episode. The effect of sulphate aerosols on the spatial distribution of aerosol extinction increased, with an SO4AOD of approximately 0.6. The extinction of organic aerosols in the NCP was related to the emission source, with the OMAOD remaining at approximately 0.9. The BCAOD increased to approximately 0.1 with the further evolution of pollution.
The mixing ratio of sulphate aerosols within an altitude of 0.5 km was >90 μg/kg. The mixing ratio of dust aerosols within 500 m of the surface was approximately 15 μg/kg. Black carbon and Organic aerosols had a high mixing ratio near the surface, below an altitude of 0.5 km. The mixing ratio of sea salt aerosols was correlated with higher RH and vertically distributed at 1.0–2.5 km.
The findings provide insights into the effect of near-surface pollutants and vertical meteorological parameters on air pollution in the NCP. Aerosol transformation process and transport mechanism in this region can be explored by analysing the contributions of different types of aerosols.
Data Availability Statement
Publicly available datasets were analyzed in this study. This data can be found here: the Copernicus Atmosphere Monitoring Service Reanalysis (https://ads.atmosphere.copernicus.eu/cdsapp#!/dataset/cams-global-reanalysis-eac4?tab=overview).
Author Contributions
HZ, HC and XZ contributed to conception and design of the study. KG, YM and YW organized the database. YW, HW and YD performed the statistical analysis. YZ, LL, LZ and YZ wrote sections of the manuscript. All authors contributed to manuscript revision, read, and approved the submitted version.
Funding
This work is financially supported by grant from National Natural Science Foundation of China (41875157 and 41825011 and 42030608 and 42175185), Basic Scientific Research Fund of Shenyang Institute of Atmospheric Environment (2021SYIAEZD3).
Conflict of Interest
The authors declare that the research was conducted in the absence of any commercial or financial relationships that could be construed as a potential conflict of interest.
Publisher’s Note
All claims expressed in this article are solely those of the authors and do not necessarily represent those of their affiliated organizations, or those of the publisher, the editors, and the reviewers. Any product that may be evaluated in this article, or claim that may be made by its manufacturer, is not guaranteed or endorsed by the publisher.
References
Ackerman, T. P., and Toon, O. B. (1981). Absorption of Visible Radiation in Atmosphere Containing Mixtures of Absorbing and Nonabsorbing Particles. Appl. Opt. 20, 3661–3668. doi:10.1364/ao.20.003661
Andreae, M. O., and Merlet, P. (2001). Emission of Trace Gases and Aerosols from Biomass Burning. Glob. Biogeochem. Cycles 15, 955–966. doi:10.1029/2000gb001382
Bai, Y., Ni, Y., and Zeng, Q. (2021). Impact of Ambient Air Quality Standards Revision on the Exposure-Response of Air Pollution in Tianjin, China. Environ. Res. 198, 111269. doi:10.1016/j.envres.2021.111269
Chang, D., Song, Y., and Liu, B. (2009). Visibility Trends in Six Megacities in China 1973-2007. Atmos. Res. 94, 161–167. doi:10.1016/j.atmosres.2009.05.006
Chang, X., Wang, S., Zhao, B., Cai, S., and Hao, J. (2018). Assessment of Inter-city Transport of Particulate Matter in the Beijing-Tianjin-Hebei Region. Atmos. Chem. Phys. 18, 4843–4858. doi:10.5194/acp-18-4843-2018
Charlson, R. J., Schwartz, S. E., Hales, J. M., Cess, R. D., Coakley, J. A., Hansen, J. E., et al. (1992). Climate Forcing by Anthropogenic Aerosols. Science 255, 423–430. doi:10.1126/science.255.5043.423
Che, H., Xia, X., Zhao, H., Dubovik, O., Holben, B. N., Goloub, P., et al. (2019). Spatial Distribution of Aerosol Microphysical and Optical Properties and Direct Radiative Effect from the China Aerosol Remote Sensing Network. Atmos. Chem. Phys. 19, 11843–11864. doi:10.5194/acp-19-11843-2019
Che, H., Xia, X., Zhu, J., Li, Z., Dubovik, O., Holben, B., et al. (2014). Column Aerosol Optical Properties and Aerosol Radiative Forcing during a Serious Haze-Fog Month over north china plain in 2013 Based on Ground-Based Sunphotometer Measurements. Atmos. Chem. Phys. 14, 2125–2138. doi:10.5194/acp-14-2125-2014
Che, H., Xia, X., Zhu, J., Wang, H., Wang, Y., Sun, J., et al. (2015). Aerosol Optical Properties under the Condition of Heavy Haze over an Urban Site of Beijing, China. Environ. Sci. Pollut. Res. 22, 1043–1053. doi:10.1007/s11356-014-3415-5
Che, H., Zhang, X., Li, Y., Zhou, Z., Qu, J. J., and Hao, X. (2009). Haze Trends over the Capital Cities of 31 Provinces in China, 1981-2005. Theor. Appl. Climatol. 97, 235–242. doi:10.1007/s00704-008-0059-8
Che, H., Zhang, X., Li, Y., Zhou, Z., and Qu, J. J. (2007). Horizontal Visibility Trends in China 1981–2005. Geophys. Res. Lett. 34, 497–507. doi:10.1029/2007gl031450
Chen, H., Lin, Y., Su, Q., and Cheng, L. (2017). Spatial Variation of Multiple Air Pollutants and Their Potential Contributions to All-Cause, Respiratory, and Cardiovascular Mortality across China in 2015-2016. Atmos. Environ. 168, 23–35. doi:10.1016/j.atmosenv.2017.09.006
Chen, Y., Tian, C., Feng, Y., Zhi, G., Li, J., and Zhang, G. (2015). Measurements of Emission Factors of PM2.5, OC, EC, and BC for Household Stoves of Coal Combustion in China. Atmos. Environ. 109, 190–196. doi:10.1016/j.atmosenv.2015.03.023
Corbett, J. J., Winebrake, J. J., Green, E. H., Kasibhatla, P., Eyring, V., and Lauer, A. (2007). Mortality from Ship Emissions: a Global Assessment. Environ. Sci. Technol. 41, 8512–8518. doi:10.1021/es071686z
Dai, Q., Ding, J., Hou, L., Li, L., Cai, Z., Liu, B., et al. (2021). Haze Episodes before and during the COVID-19 Shutdown in Tianjin, China: Contribution of Fireworks and Residential Burning. Environ. Pollut. 286, 117252. doi:10.1016/j.envpol.2021.117252
Dore, A., Vieno, M., Tang, Y., Dragosits, U., Dosio, A., Weston, K., et al. (2007). Modelling the Atmospheric Transport and Deposition of sulphur and Nitrogen over the United Kingdom and Assessment of the Influence of SO2 Emissions from International Shipping. Atmos. Environ. 41, 2355–2367. doi:10.1016/j.atmosenv.2006.11.013
Dubovik, O., Holben, B., Eck, T. F., Smirnov, A., Kaufman, Y. J., King, M. D., et al. (2002). Variability of Absorption and Optical Properties of Key Aerosol Types Observed in Worldwide Locations. J. Atmos. Sci. 59, 590–608. doi:10.1175/1520-0469(2002)059<0590:voaaop>2.0.co;2
Eck, T. F., Holben, B. N., Dubovik, O., Smirnov, A., Goloub, P., Chen, H. B., et al. (2005). Columnar Aerosol Optical Properties at AERONET Sites in central Eastern Asia and Aerosol Transport to the Tropical Mid-Pacific. J. Geophys. Res. 110, D06202. doi:10.1029/2004jd005274
Gao, J. J., Tian, H. Z., Cheng, K., Lu, L., Zheng, M., Wang, S. X., et al. (2015). The Variation of Chemical Characteristics of PM2.5 and PM10 and Formation Causes during Two Haze Pollution Events in Urban Beijing, China. Atmos. Environ. 107, 1–8. doi:10.1016/j.atmosenv.2015.02.022
Gui, K., Che, H., Li, L., Zheng, Y., Zhang, L., Zhao, H., et al. (2021a). The Significant Contribution of Small-Sized and Spherical Aerosol Particles to the Decreasing Trend in Total Aerosol Optical Depth over Land from 2003 to 2018. Engineering. in press. doi:10.1016/j.eng.2021.05.017
Gui, K., Che, H., Zheng, Y., Zhao, H., Yao, W., Li, L., et al. (2021b). Three-dimensional Climatology, Trends, and Meteorological Drivers of Global and Regional Tropospheric Type-dependent Aerosols: Insights from 13 Years (2007-2019) of CALIOP Observations. Atmos. Chem. Phys. 21, 15309–15336. doi:10.5194/acp-21-15309-2021
Han, L., Zhou, W., Li, W., and Li, L. (2014). Impact of Urbanization Level on Urban Air Quality: A Case of fine Particles (PM 2.5 ) in Chinese Cities. Environ. Pollut. 194, 163–170. doi:10.1016/j.envpol.2014.07.022
Han, S., Liu, J., Hao, T., Zhang, Y., Li, P., Yang, J., et al. (2018). Boundary Layer Structure and Scavenging Effect during a Typical winter Haze-Fog Episode in a Core City of BTH Region, China. Atmos. Environ. 179, 187–200. doi:10.1016/j.atmosenv.2018.02.023
Han, S., Zhang, Y., Wu, J., Zhang, X., Tian, Y., Wang, Y., et al. (2015). Evaluation of Regional Background Particulate Matter Concentration Based on Vertical Distribution Characteristics. Atmos. Chem. Phys. 15, 11165–11177. doi:10.5194/acp-15-11165-2015
Hansen, J., Sato, M., Ruedy, R., Lacis, A., and Oinas, V. (2000). Global Warming in the Twenty-First century: An Alternative Scenario. Proc. Natl. Acad. Sci. 97, 9875–9880. doi:10.1073/pnas.170278997
Hansen, J., Sato, M., and Ruedy, R. (1997). Radiative Forcing and Climate Response. J. Geophys. Res. 102, 6831–6864. doi:10.1029/96jd03436
Hua, Y., Wang, S., Wang, J., Jiang, J., Zhang, T., Song, Y., et al. (2016). Investigating the Impact of Regional Transport on PM2.5 Formation Using Vertical Observation during APEC 2014 Summit in Beijing. Atmos. Chem. Phys. 16, 15451–15460. doi:10.5194/acp-16-15451-2016
Inness, A., Ades, M., Agustí-Panareda, A., Barré, J., Benedictow, A., Blechschmidt, A.-M., et al. (2019). The Cams Reanalysis of Atmospheric Composition. Atmos. Chem. Phys. 19, 3515–3556. doi:10.5194/acp-19-3515-2019
Jin, L., Luo, X., Fu, P., and Li, X. (2016). Airborne Particulate Matter Pollution in Urban China: a Chemical Mixture Perspective from Sources to Impacts. Natl. Sci. Rev. 4, 593–610. doi:10.1093/nsr/nww079
Khoder, M. I. (2002). Atmospheric Conversion of Sulfur Dioxide to Particulate Sulfate and Nitrogen Dioxide to Particulate Nitrate and Gaseous Nitric Acid in an Urban Area. Chemosphere 49, 675–684. doi:10.1016/s0045-6535(02)00391-0
Lang, J., Liang, X., Li, S., Zhou, Y., Chen, D., Zhang, Y., et al. (2021). Understanding the Impact of Vehicular Emissions on Air Pollution from the Perspective of Regional Transport: A Case Study of the Beijing-Tianjin-Hebei Region in China. Sci. Total Environ. 785, 147304. doi:10.1016/j.scitotenv.2021.147304
Li, X., Bei, N., Hu, B., Wu, J., Pan, Y., Wen, T., et al. (2021). Mitigating NOX Emissions Does Not Help Alleviate Wintertime Particulate Pollution in Beijing-Tianjin-Hebei, China. Environ. Pollut. 279, 116931. doi:10.1016/j.envpol.2021.116931
Miao, Y., Guo, J., Liu, S., Liu, H., Zhang, G., Yan, Y., et al. (2017). Relay Transport of Aerosols to Beijing-Tianjin-Hebei Region by Multi-Scale Atmospheric Circulations. Atmos. EnvironmentEnviron 165, 35–45. doi:10.1016/j.atmosenv.2017.06.032
Miao, Y., Liu, S., Zheng, Y., Wang, S., Chen, B., Zheng, H., et al. (2015). Numerical Study of the Effects of Local Atmospheric Circulations on a Pollution Event over Beijing-Tianjin-Hebei, China. J. Environ. Sci. 30, 9–20. doi:10.1016/j.jes.2014.08.025
Pang, N., Gao, J., Che, F., Ma, T., Liu, S., Zhao, P., et al. (2020). Cause of PM2.5 Pollution during the 2016-2017 Heating Season in Beijing, Tianjin, and Langfang, China. J. Environ. Sci. 95, 201–209. doi:10.1016/j.jes.2020.03.024
Shao, M., Dai, Q., Yu, Z., Zhang, Y., Xie, M., and Feng, Y. (2021). Responses in PM2.5 and its Chemical Components to Typical Unfavorable Meteorological Events in the Suburban Area of Tianjin, China. Sci. Total Environ. 788, 147814. doi:10.1016/j.scitotenv.2021.147814
Shen, Y., Zhang, L., Fang, X., Ji, H., Li, X., and Zhao, Z. (2019). Spatiotemporal Patterns of Recent PM2.5 Concentrations over Typical Urban Agglomerations in China. Sci. Total Environ. 655, 13–26. doi:10.1016/j.scitotenv.2018.11.105
Su, S., Li, B., Cui, S., and Tao, S. (2011). Sulfur Dioxide Emissions from Combustion in China: from 1990 to 2007. Environ. Sci. Technol. 45, 8403–8410. doi:10.1021/es201656f
Sun, Y., Chen, C., Zhang, Y., Xu, W., Zhou, L., Cheng, X., et al. (2016). Rapid Formation and Evolution of an Extreme Haze Episode in Northern China during winter 2015. Sci. Rep. 6, 27151. doi:10.1038/srep27151
Twomey, S. A., Piepgrass, M., and Wolfe, T. L. (1984). An Assessment of the Impact of Pollution on Global Cloud Albedo. Tellus 36B, 356–366. doi:10.1111/j.1600-0889.1984.tb00254.x
Wang, L. T., Wei, Z., Yang, J., Zhang, Y., Zhang, F. F., Su, J., et al. (2014). The 2013 Severe Haze over Southern Hebei, China: Model Evaluation, Source Apportionment, and Policy Implications. Atmos. Chem. Phys. 14, 3151–3173. doi:10.5194/acp-14-3151-2014
Wang, Y. Q., Zhang, X. Y., and Arimoto, R. (2006). The Contribution from Distant Dust Sources to the Atmospheric Particulate Matter Loadings at XiAn, China during spring. Sci. Total Environ. 368, 875–883. doi:10.1016/j.scitotenv.2006.03.040
Wang, Y. Q., Zhang, X. Y., and Draxler, R. R. (2009). TrajStat: GIS-Based Software that Uses Various Trajectory Statistical Analysis Methods to Identify Potential Sources from Long-Term Air Pollution Measurement Data. Environ. Model. Softw. 24, 938–939. doi:10.1016/j.envsoft.2009.01.004
Wu, H., Zhang, Y.-f., Han, S.-q., Wu, J.-h., Bi, X.-h., Shi, G.-l., et al. (2015). Vertical Characteristics of PM2.5 during the Heating Season in Tianjin, China. Sci. Total Environ. 523, 152–160. doi:10.1016/j.scitotenv.2015.03.119
Yang, H.-H., Tsai, C.-H., Chao, M.-R., Su, Y.-L., and Chien, S.-M. (2006). Source Identification and Size Distribution of Atmospheric Polycyclic Aromatic Hydrocarbons during rice Straw Burning Period. Atmos. Environ. 40, 1266–1274. doi:10.1016/j.atmosenv.2005.10.032
Yau, P. S., Lee, S. C., Corbett, J. J., Wang, C., Cheng, Y., and Ho, K. F. (2012). Estimation of Exhaust Emission from Ocean-Going Vessels in Hong Kong. Sci. Total Environ. 431, 299–306. doi:10.1016/j.scitotenv.2012.03.092
Zhang, Q., Streets, D. G., Carmichael, G. R., He, K. B., Huo, H., Kannari, A., et al. (2009). Asian Emissions in 2006 for the NASA INTEX-B mission. Atmos. Chem. Phys. 9, 5131–5153. doi:10.5194/acp-9-5131-2009
Zhang, R., Jing, J., Tao, J., Hsu, S.-C., Wang, G., Cao, J., et al. (2013). Chemical Characterization and Source Apportionment of PM2.5 in Beijing: Seasonal Perspective. Atmos. Chem. Phys. 13, 7053–7074. doi:10.5194/acp-13-7053-2013
Zhang, X. Y., Wang, Y. Q., Niu, T., Zhang, X. C., Gong, S. L., Zhang, Y. M., et al. (2012). Atmospheric Aerosol Compositions in China: Spatial/temporal Variability, Chemical Signature, Regional Haze Distribution and Comparisons with Global Aerosols. Atmos. Chem. Phys. 12, 779–799. doi:10.5194/acp-12-779-2012
Zhao, H., Wu, Z., Liu, J., and Wu, G. (2019). Two Air Pollution Events in the Coastal City of Tianjin, north China plain. Atmos. Pollut. Res. 10, 1780–1794. doi:10.1016/j.apr.2019.07.009
Zhao, L., Wang, W., Hao, T., Qu, W., Sheng, L., Luo, C., et al. (2020). The Autumn Haze-Fog Episode Enhanced by the Transport of Dust Aerosols in the Tianjin Area. Atmos. Environ. 237, 117669. doi:10.1016/j.atmosenv.2020.117669
Zheng, S., Pozzer, A., Cao, C. X., and Lelieveld, J. (2015). Long-term (2001-2012) Concentrations of fine Particulate Matter (PM2.5) and the Impact on Human Health in Beijing, China. Atmos. Chem. Phys. 15, 5715–5725. doi:10.5194/acp-15-5715-2015
Keywords: Pm, meteorological parameters, aerosol, aerosol optical depth, North China plain
Citation: Zhao H, Gui K, Ma Y, Wang Y, Wang Y, Wang H, Dou Y, Zheng Y, Li L, Zhang L, Zhang Y, Che H and Zhang X (2022) Effects of Different Aerosols on the Air Pollution and Their Relationship With Meteorological Parameters in North China Plain. Front. Environ. Sci. 10:814736. doi: 10.3389/fenvs.2022.814736
Received: 14 November 2021; Accepted: 18 January 2022;
Published: 09 February 2022.
Edited by:
Qiyuan Wang, Institute of Earth Environment (CAS), ChinaReviewed by:
Yunfei Wu, Institute of Atmospheric Physics (CAS), ChinaQian Zhang, Xi’an University of Architecture and Technology, China
Copyright © 2022 Zhao, Gui, Ma, Wang, Wang, Wang, Dou, Zheng, Li, Zhang, Zhang, Che and Zhang. This is an open-access article distributed under the terms of the Creative Commons Attribution License (CC BY). The use, distribution or reproduction in other forums is permitted, provided the original author(s) and the copyright owner(s) are credited and that the original publication in this journal is cited, in accordance with accepted academic practice. No use, distribution or reproduction is permitted which does not comply with these terms.
*Correspondence: Hujia Zhao, dGp6aGo0NjU5QHNpbmEuY29t