- 1College of Statistics, Chengdu University of Information Technology, Chengdu, China
- 2College of Management, Azad University, Mashhad, Iran
- 3College of Management, Chengdu University of Information Technology, Chengdu, China
Recently, the water supply process has experienced serious challenges, because, with the intensification of drought, the imbalance between available water resources and demand for water in different sectors has led to increased system risk. Therefore, this study proposed an optimal dynamic framework under different scenarios aimed at improving the drought risk of the water supply system. In this sense, given the negative effects of drought on the water supply procedure, the degree of drought risk is analyzed and improved according to system performance parameters. After examining the developed model by initial data collected from a real case study of Hamoun wetland in Iran, the most sensitive parameters were included reliability and vulnerability, which, in this regard, the highest degree of drought risk is related to the agricultural and industrial sectors due to the acquisition of less reliability and greater vulnerability. In addition, given the final output, adaptation measures such as demand governance scheme and weight scenario analysis have been developed in order to investigate the drought risk of the system in more detail.
1 Introduction
Climate change and global warming on the regional scale have led to an increase in average temperatures and drought (Xu et al., 2015; Wang et al., 2020). Given that population growth and climate change are expected to exacerbate the risk of regional drought, there is a need to develop sustainable optimal water management strategies consistent with the fluctuation of available water resources and water demand growth (Wanders and Wada, 2015; Blauhut, 2020). However, failure in the water supply system includes the probability of maintaining the deviation between water supply and water demand regarding limited water resources, so the focus on a performance-based approach is considered a driver to manage and control the system risk process (Nam et al., 2015; Tommaso, 2017). In other words, drought refers to the long-term supply of water below the required amount, but given the extent of time, impacts, and spatial variables, this definition is not justified (Heim, 2002). To this end, the drought index has been quantified in recent research using a series of measures derived from system performance (Hashimoto et al., 1982; Ataoui and Ermini, 2017). In this sense that due to the correlation between risk management and the performance of the system (Hopkins, 2014), a vast amount of literature considered the set of performance metrics trying to control the risk of the system. For instance, Ayyub (2014) applied a performance-oriented model with a greater focus on resilience and reliability that also covers the logical requirements consistent with measurement theory to develop an effective decision-making tool for system risk reduction, Mehran et al. (2015) applied a unique multivariate approach regarding the standard reliability and resilience index (MSRRI) to assess the socioeconomic drought criterion under different climate change scenarios. Indeed, MSRRI first considers a “top-down” approach with an emphasis on processes/phenomena such as climate change that could not be easily controlled by decision makers, and then a “bottom-up” approach to assessing local resilience and social reliability to deal with drought. Nam et al. (2015) proposed a new concept to manage drought risk in the agricultural sector generating a proactive approach regarding streamflow uncertainty. This proactive approach seeks to efficiently manage the effects of drought and shrink drought vulnerability considering performance measures. Maity et al. (2013) developed a criterion called drought management index (DMI) to investigate the long-term drought regarding reliability, resilience, and vulnerability as criteria for water resources operation with respect to the amount of soil moisture in a defined area. In fact, the proposed index distinguishes the drought-prone area from another one by applying sensitivity assessment. Rossi and Cancelliere (2013) proposed a mechanism to manage drought in the water supply system using reliability, resilience, and vulnerability criteria, so that the first two criteria are considered tools to assess drought, and the last criterion is taken into account as a mitigation measure to cope with drought impacts.
However, the previous studies have extensively addressed that drought is one of the most important concerns when it comes to multi-sectoral participants which may impact various economic, social, and environmental factors. But, most research regardless of optimal performance has proposed one or two indicators related to a hydrological time series to address drought management, which in most cases, these special measures during the drought period cannot meet the predefined threshold to satisfy the demand for water which indicates a formulation error.
Meanwhile, according to the perspective of the sub-basins, managing a multi-sectoral water supply system is complex. In other words, due to the lack of optimal performance management, while some areas experience a high volume of water resources, the water demand of others is unsatisfactory and therefore there are conflicts between sub-areas to gain more water resources focusing on their own interests.
Thus, developing a classical optimal method to investigate the possibility of system failure during the operational period is the simultaneous application of all factors. Indeed, it is critical to identify system failure behavior simultaneously with respect to frequency (reliability), ability to cover (resilience), and vulnerability as performance measures (Merabtene et al., 2002; Maity et al., 2013).
Accordingly, this study proposes a dynamic optimization model to improve drought risk in the water supply system regarding the performance indicators of the water supply system including reliability, resilience, and vulnerability. In general, drought risk measure assesses the characteristics of failure events and their impacts on water supply policies according to the basic parameters of system performance to investigate system behavior, taking into account potential adverse impacts such as imbalance between available water resources and demand (Zongxue et al., 1998; Li et al., 2019).
Therefore, given the above explanation, the main contributions of this study are as follows:
1) A dynamic optimization model has been developed to deal with drought in the water allocation procedure while examining the drought risk degree in different sectors.
2) Given streamflow uncertainty, different supply and demand scenarios are applied as adaptation measures to analyze periodic decisions.
The rest of this article is organized as follows. Section 2 proposes the drought risk framework. Section 3 expands the dynamic optimization framework. Section 4 develops a case study as well as data collection. Section 5 includes descriptive analysis. Section 6 refers to concluding remarks.
2 Framework of Drought Risk Management
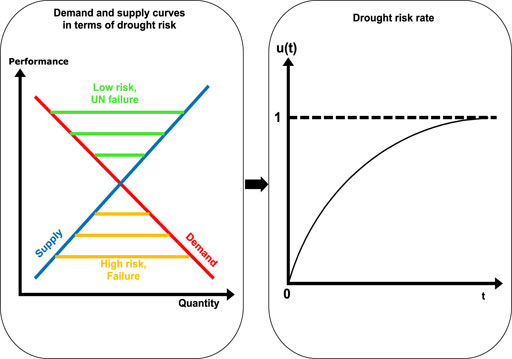
Performance and risk management are considered as two ends of the same discipline, so risk management is enhanced by arrangements for the effective use of performance tools, in the sense that achieving a higher level of performance is reflected in risk reduction (Albinson et al., 2016; Bourne and Mura, 2018; Ashby et al., 2019). In this regard, the main objective of drought risk management, regardless of adaptation measures, is to select the best combination based on comparison and ranking of system performance indicators in order to shrink the negative impact of drought and socio-environmental consequences (Rossi and Cancelliere, 2013). It should be noted that according to the definition, the performance of a water supply system consists of three metrics of reliability, vulnerability, and resilience (Hashimoto et al., 1982; Sandoval-Solis et al., 2011), in which the main focus is on satisfying the deviation between supply and demand (as shown in Figure 1), and consequently improving failure (Jinno, 1995; Hopkins, 2014).
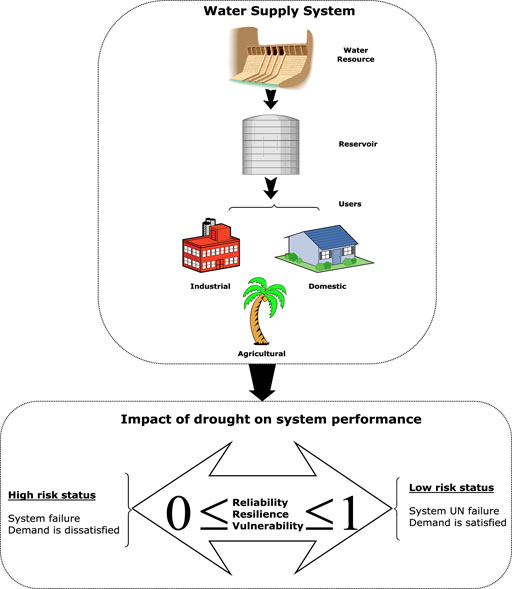
However, Figure 2 includes the conceptual framework of this study, which examines the water supply process between the three sectors of agricultural, industrial, and domestic, taking into account the supply-demand ratio to analyze the drought risk degree of the system. Indeed, to investigate the degree of drought risk, this study considers three performance metrics of the water supply system consisting (Hashimoto et al., 1982; Sandoval-Solis et al., 2011): reliability, resilience, and vulnerability to improve the drought risk status in addition to optimizing the water supply between multi-sectors under different scenarios. In the following, due to the streamflow uncertainty, managerial insights are also proposed as adopted measures. In fact, in the water supply system, streamflow as the main source of water is considered an uncertain factor (Niu et al., 2016). In this study, different scenarios for adjusting water supply patterns according to average rainfall are analyzed and a water supply plan is identified for distribution under uncertain streamflow levels. For this purpose, according to historical rainfall data, three additional possible scenarios (decrease by −5% and increase by 5% as well as 15% deviation from the current average rainfall) are applied to examine the pattern of water supply. In addition, since the stress of climate change is approaching a dangerous threshold, a sole focus on managing the available water resources will not significantly reduce the drought, and flexibility in managerial strategies is needed to decrease system vulnerability. Thus, this study applies the demand governance scheme using different leverages aiming at both supply side and demand side involvement.
3 A Dynamic Optimization Framework for Investigation of Drought Risk
The first indicator to examine drought risk is reliability, where there is an inverse relationship between the probability of failure or the risk and reliability, meaning that increasing reliability reduces risk (Hashimoto et al., 1982; Kjeldsen and Rosbjerg, 2004). By definition, reliability refers to the probability that no failure will occur during the simulated period (Hashimoto et al., 1982; Gu et al., 2017).
where T refers to the whole period,
Therefore, the deviation between the volume of water demand
The second indicator to analyze drought risk is resilience, which by definition describes how a system recovers quickly after a failure or bounces back from a failure status to a UN failure status. If the failure event is prolonged and the system does not recover quickly, it has a direct impact on the risk of the system due to increased system dissatisfaction (Hashimoto et al., 1982; Asefa et al., 2014).
where
The third indicator for investigation of risk drought is vulnerability and it is the weakness of the system structure that potentially puts it at risk (Dahbur et al., 2011). In a water supply system, vulnerability refers to the magnitude and severity of a failure if it occurs, even when the probability of failure is low (Hashimoto et al., 1982; Maestro et al., 2014).
where
However, given the above descriptions, the main purpose of this article is to improve drought, for which a dynamic optimization framework has been proposed. To this end, minimizing system vulnerability and maximizing system reliability, as well as resilience, are applied as multiple objective functions:
In this regard, the constraints of the proposed model are presented in Eqs 8–10. In particular, the water allocated to the sub-sectors should be less than the total amount of available water in the reservoir, as shown in Eq. 8. The volume of available water in the reservoir cannot exceed the maximum storage level of the reservoir, as shown in Eq. 9. The volume of water stored in the reservoir is a dynamic procedure as shown in Eq. 10.
where
However, the global multi-objective model of this study for improving long-term drought in the agricultural, domestic, and industrial sectors is as follows:
The solution of the proposed model was performed by the weighted sum method (Stanimirovic et al., 2011), which in this regard, as shown in Eq. 9,
4 Case Study
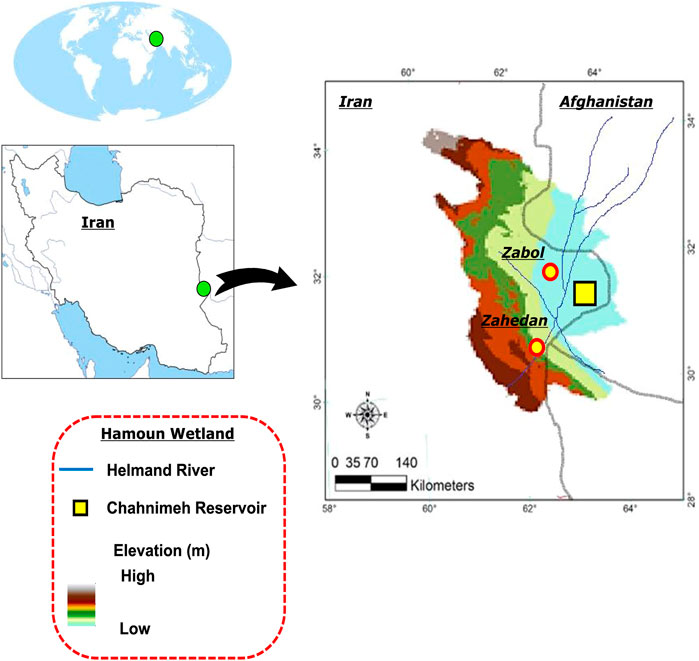
One of the most famous wetlands in Iran, located in the arid climate near the Afghanistan border, is the Hamoun wetland (30°–31.5°N to 61°–66°E), which has very cold winters and very hot summers with strong seasonal winds (Figure 3). The main source of water supply for this wetland is the Helmand River, which the Afghanistan government has recently built many dams on the tributaries of this river, and this, along with rainfall reduction (60 mm/year) has led to a shrinkage of wetland. In general, according to the recent studies (Dehghan et al., 2014; He et al., 2021) the intensification of drought in the region caused a reduction in the area of the wetland from 370,000
Due to the large population of mentioned cities (in total over 1,000,000 inhabitants) and also the irrigation area in the Sistan plain on the one hand (Dahmardeh Ghaleno et al., 2017; Yao et al., 2019); and the serious drought challenges, on the other hand, sub-area managers have not been able to satisfy the gap between water demand and water supply, so Hamoun wetland is considered as the study area.
However, historical data on runoff and reservoir capacity has been extracted from the Regional Water Authority of Sistan, and some literature (Najafi and Vatanfada, 2011; Thomas and Varzi, 2015; Yao et al., 2019; He et al., 2021). Moreover, water demand data for different sectors are derived from statistics recorded by the Sistan and Baluchestan Provincial Water Authority (as shown in Tables 1 and 2).
5 Descriptive Analysis
5.1 Optimal Multi-Sectoral Allocation of Available Water Resources
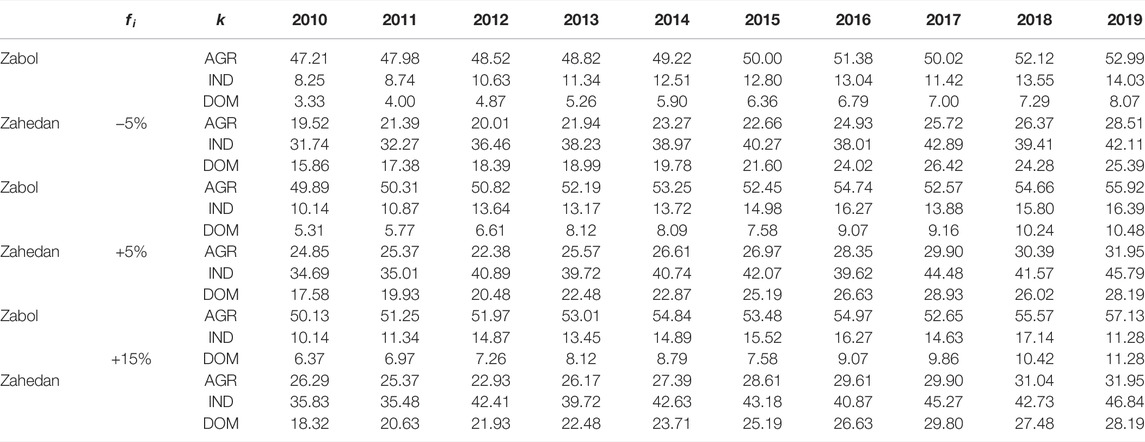
According to the optimal analysis of water supply between the agricultural, industrial, and domestic sectors (Table 3), the volume of water allocated to the domestic sector of Zabol, due to the smaller population compared to Zahedan, is less than other sectors, so that between 2010 and 2013 the amount of water allocated to this sector was less than
Furthermore, by analyzing the risk of drought (as shown in Figure 4), given that the deviation between water demand and water supply for the domestic sector was less than the other two sectors, this sector in terms of reliability (
5.2 Drought Risk Analysis Under Uncertain Scenarios
Due to the limitations in the proposed model, such as the use of initial inflow data related to a limited period, this study developed a scenario analysis to investigate inflow uncertainty and its impacts on final outputs. In this regard, three new scenarios, which are decreased by 5% and increased by 5% as well as 15% deviation from the current average inflow data have been considered to examine the risk of drought according to the proposed model. To this end, Table 4 shows the volume of water allocated to each sector according to the proposed scenarios. By comparing these results with the present status (Table 3), the agricultural and industrial sectors, as the largest recipients of water, are more exposed to the water crisis in comparison with the domestic sector.
Moreover, given the final results related to drought risk analysis listed in Table 5, it can be mentioned that the agricultural and industrial sectors (0.1, 0.2) are less reliable under scenario 1 compared to the domestic sector (0.3). For scenario 2, both domestic and industrial sectors (0.5, 0.6) are more reliable than the agricultural sector (0.4) in Zabol, but in Zahedan city, the industrial sector (0.5) has gained the least reliability. Also, there is a noticeable change in the resilience indicator under scenario 3, and its value has improved significantly for all three sectors industrial, agricultural, and domestic. Meanwhile, in the city of Zabol and Zahedan, the domestic sector has shown less sensitivity to vulnerability indicators under all three scenarios.
5.3 Investigation of Drought Risk Under Various Weight Scenarios
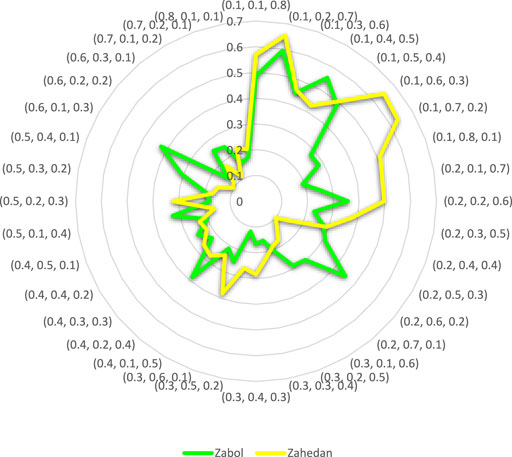
According to the considered weight for each objective function (as shown in Eq. 9), the system performance rate and consequently the degree of drought risk of the system are examined. In fact, these subjective weights integrated into each objective are used to trade-off between water demand and water supply (Tokos et al., 2013). Therefore, this study developed 36 analysis sets according to the weight of each objective function to investigate the risk of drought. According to the final outputs, for both sub-areas, the drought risk rate enhanced sharply due to the increase in vulnerability weight and the decrease in system reliability (Figure 5).
5.4 Discussion
Recently, the available water resources in the Hamoun wetland have shrunk due to various reasons such as rainfall reduction, the sharp rise in temperature (over
6 Conclusion
Drought has had significant adverse impacts on different sectors in the arid and semi-arid regions, leading the water supply system to unsustainability. However, meeting the demand for water has become a prominent challenge for each sector due to the limited water resources. For example, the agricultural sector is the largest water recipient in the globe. As a result, this sector is deeply affected by water scarcity, and its declining efficiency threatens human food security. Therefore, the use of traditional methods for water supply is not practical in areas that are heavily dependent on inflow, so developing optimal frameworks is critical to improving the effects of drought.
In this regard, this study applied a dynamic programming model that in addition to optimizing water supply between multi-sectors, the degree of drought risk was also improved. Accordingly, to analyze the risk of drought in the regional water supply system, an assessment mechanism based on the performance indicators was considered. Moreover, a case study from the semi-arid region of southeastern Iran was applied to investigate the developed model.
Based on the final outputs, reliability and vulnerability were the most sensitive indicators in the proposed model. In this regard, both industrial and agricultural sectors had the highest drought risk rate due to low sensitivity to reliability and high sensitivity to vulnerability. In general, according to the outputs of the proposed model, a mere focus on optimizing the limited water resources will not lead to significant changes in mitigating the effects of drought and developing adaptation measures such as the demand governance scheme to engage demand alongside supply can significantly reduce the effects of drought.
However, considering the limitations of the model development, this study appends the following suggestions to the final outputs: First, accurate forecasting of the scale and amount of local precipitation using future hydrological patterns and then deciding on water supply appropriate to the status of future available water resources is essential for areas that depend solely on surface water. Second, developing long-term policies such as simulating population distribution patterns to estimate demand for water at the local scale can be reflected in the conservation of water resources and diminishing the impacts of the drought and thus increasing the system’s reliability against vulnerability reduction.
Data Availability Statement
The original contributions presented in the study are included in the article/Supplementary Materials, further inquiries can be directed to the corresponding author.
Author Contributions
Conceptualization, methodology, software: MM; Data curation: YH; Writing—original draft: MB; Review and Editing, Supervision: XH.
Funding
The work was supported by the higher education talent training quality and teaching reform project from the Sichuan Provincial Department of Education (JG 2021-992), the undergraduate teaching engineering project of CUIT (JYJG2021117, JYJG2022104), the graduate education and teaching research and reform project of CUIT (CUITGOKP202103), and Key project fund project of Sichuan system science and Enterprise Development Research Center (Xq22B08).
Conflict of Interest
The authors declare that the research was conducted in the absence of any commercial or financial relationships that could be construed as a potential conflict of interest.
Publisher’s Note
All claims expressed in this article are solely those of the authors and do not necessarily represent those of their affiliated organizations, or those of the publisher, the editors, and the reviewers. Any product that may be evaluated in this article, or claim that may be made by its manufacturer, is not guaranteed or endorsed by the publisher.
References
Akbari, M., Mirchi, A., Roozbahani, A., Gafurov, A., Klöve, B., and Haghighi, A. T. (2021). Desiccation of the Transboundary Hamun Lakes: Natural or Anthropogenic? Preprint. doi:10.31223/X5G90V
Albinson, N., Blau, A., and Chu, Y. (2016). The Future of Risk, New Game New Rules. Available at: https://www2.deloitte.com/content/dam/Deloitte/us/Documents/risk/us-aers-the-future-of-risk-new-game-new-rules.pdf.
Ariyaee, M., Azadi, N. A., Majnoni, F., and Mansouri, B. (2015). Comparison of Metal Concentrations in the Organs of Two Fish Species from the Zabol Chahnimeh Reservoirs, Iran. Bull. Environ. Contam. Toxicol. 94 (6), 715–721. doi:10.1007/s00128-015-1529-1
Asefa, T., Clayton, J., Adams, A., and Anderson, D. (2014). Performance Evaluation of a Water Resources System under Varying Climatic Conditions: Reliability, Resilience, Vulnerability and beyond. J. Hydrol. 508, 53–65. doi:10.1016/j.jhydrol.2013.10.043
Ashby, S., Bryce, C., and Ring, P. (2019). Risk and Performance: Embedding Risk Management. Scotland: Glasgow Caledonian University.
Ataoui, R., and Ermini, R. (2017). Risk Assessment of Water Distribution Service. Procedia Eng. 186, 514–521. doi:10.1016/j.proeng.2017.03.264
Ayyub, B. M. (2014). Systems Resilience for Multihazard Environments: Definition, Metrics, and Valuation for Decision Making. Risk Anal. 34 (2), 340–355. doi:10.1111/risa.12093
Bazzi, H., Ebrahimi, H., and Aminnejad, B. (2021). A Comprehensive Statistical Analysis of Evaporation Rates under Climate Change in Southern Iran Using WEAP (Case Study: Chahnimeh Reservoirs of Sistan Plain). Ain Shams Eng. J. 12 (2), 1339–1352. doi:10.1016/j.asej.2020.08.030
Blauhut, V. (2020). The Triple Complexity of Drought Risk Analysis and its Visualisation via mapping: a Review across Scales and Sectors. Earth-Sci. Rev. 210, 103345. doi:10.1016/j.earscirev.2020.103345
Bourne, M., and Mura, M. (2018). Performance and Risk Management. Prod. Plan. Control 29 (15), 1221–1224. doi:10.1080/09537287.2018.1520319
Dahbur, K., Mohammad, B., and Tarakji, A. B. (2011). “A Survey of Risks, Threats and vulnerabilities in Cloud Computing,” in Proceedings of the 2011 International Conference on Intelligent Semantic Web-Services and Applications (Pakistan: Isra University), 1–6. Editors T. Asefa, J. Clayton, and A. Adams, 1–6.
Dahmardeh Ghaleno, M. R., Sadoddin, A., Sheikh, V., and Sabouni, M. (2017). Optimal Utilization of the Chahnimeh Water Reservoirs in Sistan Region of Iran Using Goal Programming Method. Ecopersia 5 (1), 1641–1654. doi:10.18869/modares.ecopersia.5.1.1641
Dehghan, A., Palmer-Moloney, L. J., and Mirzaee, M. (2014). “Water Security and Scarcity: Potential Destabilization in Western Afghanistan and Iranian Sistan and Baluchestan Due to transboundary Water Conflicts,” in Water and Post-Conflict Peacebuilding (Routledge), 323–344.
Gu, W., Shao, D., Tan, X., Shu, C., and Wu, Z. (2017). Simulation and Optimization of Multi-Reservoir Operation in Inter-Basin Water Transfer System. Water Resour. Manage 31 (11), 3401–3412. doi:10.1007/s11269-017-1675-9
Hashimoto, T., Stedinger, J. R., and Loucks, D. P. (1982). Reliability, Resiliency, and Vulnerability criteria for Water Resource System Performance Evaluation. Water Resour. Res. 18 (1), 14–20. doi:10.1029/wr018i001p00014
He, Y., Mahdi, M., Huang, P., Xie, G., Galoie, M., and Shafi, M. (2021). Investigation of Climate Change Adaptation Impacts on Optimization of Water Allocation Using a Coupled SWAT-bi Level Programming Model. Wetlands 41 (3), 1–18. doi:10.1007/s13157-021-01434-5
Heim, R. R. (2002). A Review of Twentieth-Century Drought Indices Used in the United States. Bull. Amer. Meteor. Soc. 83 (8), 1149–1166. doi:10.1175/1520-0477-83.8.1149
Jinno, K. (1995). Risk Assessment of a Water Supply System during Drought. Int. J. Water Resour. Dev. 11 (2), 185–204. doi:10.1080/07900629550042399
Kjeldsen, T. R., and Rosbjerg, D. (2004). Choice of Reliability, Resilience and Vulnerability Estimators for Risk Assessments of Water Resources Systems/Choix d’Estimateurs de fiabilité, de résilience et de vulnérabilité pour les analyses de risque de systèmes de ressources en eau. Hydrol. Sci. J. 49 (5), 767. doi:10.1623/hysj.49.5.755.55136
Li, J., Gao, Z., Guo, Y., Zhang, T., Ren, P., and Feng, P. (2019). Water Supply Risk Analysis of Panjiakou Reservoir in Luanhe River Basin of China and Drought Impacts under environmental Change. Theor. Appl. Climatol. 137 (3), 2393–2408. doi:10.1007/s00704-018-2748-2
Maestro, T., Nicolosi, V., Cancelliere, A., and Bielza, M. (2014). Impacts of Climate Change, hydrological Drought Mitigation Measures and Irrigation Demand on Water Supply System performance. Eur. Water 45 (46), 25–33.
Maity, R., Sharma, A., Nagesh Kumar, D., and Chanda, K. (2013). Characterizing Drought Using the Reliability-Resilience-Vulnerability Concept. J. Hydrol. Eng. 18 (7), 859–869. doi:10.1061/(asce)he.1943-5584.0000639
Malyar, I. (2016). Transboundary Water Institutions in Developing Countries: A Case Study in Afghanistan. United States: Oregon State University.
Mehran, A., Mazdiyasni, O., and AghaKouchak, A. (2015). A Hybrid Framework for Assessing Socioeconomic Drought: Linking Climate Variability, Local Resilience, and Demand. J. Geophys. Res. Atmos. 120 (15), 7520–7533. doi:10.1002/2015jd023147
Merabtene, T., Kawamura, A., Jinno, K., and Olsson, J. (2002). Risk Assessment for Optimal Drought Management of an Integrated Water Resources System Using a Genetic Algorithm. Hydrol. Process. 16 (11), 2189–2208. doi:10.1002/hyp.1150
Moghaddamnia, A., Ghafari Gousheh, M., Piri, J., Amin, S., and Han, D. (2009). Evaporation Estimation Using Artificial Neural Networks and Adaptive Neuro-Fuzzy Inference System Techniques. Adv. Water Resour. 32 (1), 88–97. doi:10.1016/j.advwatres.2008.10.005
Najafi, A., and Vatanfada, J. (2011). Environmental Challenges in Trans-boundary Waters, Case study: Hamoon Hirmand Wetland (Iran and Afghanistan). Int. J. Water Resources Arid Environ. 1 (1), 16–24.
Nam, W.-H., Choi, J.-Y., and Hong, E.-M. (2015). Irrigation Vulnerability Assessment on Agricultural Water Supply Risk for Adaptive Management of Climate Change in South Korea. Agric. Water Manag. 152, 173–187. doi:10.1016/j.agwat.2015.01.012
Niu, G., Li, Y. P., Huang, G. H., Liu, J., and Fan, Y. R. (2016). Crop Planning and Water Resource Allocation for Sustainable Development of an Irrigation Region in China under Multiple Uncertainties. Agric. Water Manag. 166, 53–69. doi:10.1016/j.agwat.2015.12.011
Rossi, G., and Cancelliere, A. (2013). Managing Drought Risk in Water Supply Systems in Europe: A Review. Int. J. Water Resour. Dev. 29 (2), 272–289. doi:10.1080/07900627.2012.713848
Sandoval-Solis, S., McKinney, D. C., and Loucks, D. P. (2011). Sustainability Index for Water Resources Planning and Management. J. Water Resour. Plann. Manage. 137 (5), 381–390. doi:10.1061/(asce)wr.1943-5452.0000134
Stanimirovic, I. P., Zlatanovic, M. L., and Petkovic, M. D. (2011). On the Linear Weighted Sum method for Multi-Objective Optimization. Facta Acta Univ. 26 (4), 49–63.
Thomas, V., and Varzi, M. M. (2015). A Legal Licence for an Ecological Disaster: The Inadequacies of the 1973 Helmand/Hirmand Water Treaty for Sustainable Transboundary Water Resources Development. Int. J. Water Resour. Dev. 31 (4), 499–518. doi:10.1080/07900627.2014.1003346
Tokos, H., Pintarič, Z. N., and Yang, Y. (2013). Bi-Objective Optimization of a Water Network via Benchmarking. J. Clean. Prod. 39, 168–179. doi:10.1016/j.jclepro.2012.07.051
Tommaso, P. (2017). “Risk and Performance Management: Two Sides of the Same Coin?,” in The Routledge Companion to Accounting and Risk, Editors W. Margaret, and L. Philip (Abingdon, UK: Routledge), 137–149. doi:10.4324/9781315716756-10
Wanders, N., and Wada, Y. (2015). Human and Climate Impacts on the 21st Century Hydrological Drought. J. Hydrol. 526, 208–220. doi:10.1016/j.jhydrol.2014.10.047
Wang, K., Niu, J., Li, T., and Zhou, Y. (2020). Facing Water Stress in a Changing Climate: A Case Study of Drought Risk Analysis under Future Climate Projections in the Xi River Basin, China. Front. Earth Sci. 8, 86. doi:10.3389/feart.2020.00086
Xu, K., Yang, D., Yang, H., Li, Z., Qin, Y., and Shen, Y. (2015). Spatio-temporal Variation of Drought in China during 1961-2012: A Climatic Perspective. J. Hydrol. 526, 253–264. doi:10.1016/j.jhydrol.2014.09.047
Yao, L., Xu, Z., Moudi, M., and Li, Z. (2019). Optimal Water Allocation in Iran: A Dynamic Bi-Level Programming Model. Water Supply 19 (4), 1120–1128. doi:10.2166/ws.2018.165
Keywords: drought risk, performance indicators, failure, runoff scenarios, water supply
Citation: Hong X, Basirialmahjough M, He Y and Moudi M (2022) Investigation of Drought Risk Using a Dynamic Optimization Framework in Regional Water Allocation Procedure With Different Streamflow Scenarios. Front. Environ. Sci. 10:813239. doi: 10.3389/fenvs.2022.813239
Received: 12 November 2021; Accepted: 08 June 2022;
Published: 11 July 2022.
Edited by:
Angela Helen Arthington, Griffith University, AustraliaCopyright © 2022 Hong, Basirialmahjough, He and Moudi. This is an open-access article distributed under the terms of the Creative Commons Attribution License (CC BY). The use, distribution or reproduction in other forums is permitted, provided the original author(s) and the copyright owner(s) are credited and that the original publication in this journal is cited, in accordance with accepted academic practice. No use, distribution or reproduction is permitted which does not comply with these terms.
*Correspondence: Mahdi Moudi, bW91ZGlAY3VpdC5lZHUuY24=
 Xu Hong1
 Mahdi Moudi