 Jiahong Qin
 Jianhua Cao*
- Institute of Finance and Economics, Shanghai University of Finance and Economics, Shanghai, China
This paper employs the Green Credit Guidelines as green financial policy to investigate whether the implementation of green credit has contributed to the low-carbon economic development. The difference-in-differences method (DID) is then applied to estimate the emission reduction effects. The paper found that green financial policy has effectively reduced pollution and energy consumption in high pollution and high energy consuming industries. As a means of verifying the reliability of the results, propensity score matching difference-in-differences (PSM-DID) applies the match kernels and radius method before the DID. Furthermore, this paper explored the regional and industry heterogeneity in incremental carbon emission reductions. This is the first paper to use Guidelines to measure green finance, in order to achieve indicator innovation and provide corresponding policy advice. To reduce carbon emissions, the government must strengthen the implementation of green credit policy and create a green financial environment tailored to local needs.
Introduction
In order to develop a green economy, China has formulated a number of green financial policies. Understanding the impact of green financial policies on carbon dioxide emissions is imperative. In particular, policy implementation is critical to reducing carbon emissions. At the third conference of the parties to the United Nations Framework Convention on Climate Change (UNFCCC), held in 1997 in Kyoto, Japan, significant progress was made. After the Kyoto Protocol was adopted, the world entered the post-Kyoto era, when international economic diplomacy gradually shifted its focus to the environment and climate change. Additionally, carbon emissions from industrial development have become such a significant factor that various countries are obliged to factor it into economic development. Nationally Determined Contributions (NDCs) are climate action plans established by all parties to reduce emissions and adapt to climate change impacts. However, carbon dioxide emissions in 2030 are projected to be approximately 5.5% lower than in 2015, which is insufficient to meet the plan described by countries in their NDCs (Roelfsema et al., 2020). Recently, China has experienced rapid economic growth as the largest developing country. The growth of the economy will inevitably result in an increase in energy consumption. In deciding between economic benefits and carbon dioxide emissions caused by energy consumption, how should the Chinese government make a decision? Fortunately, the Chinese government is committed to responding to climate change. In addressing climate change, China is contributing to the global climate governance process based on the demands of its internal sustainable development and its shared responsibility for building a global community of shared future. To participate fully in global climate governance, China’s 14th Five-year Plans for social and economic development were committed to implementing such policies so that the value of reduced emissions from oil and coal consumption would be equal to that of increased emissions from natural gas consumption. On February 1, 2021, interim rules for carbon emissions trading management will take effect. It is the first time that the country has clarified the role of enterprises in the reduction of greenhouse gas emissions. In an economic transitional period, maintaining a balance between financial development and carbon emissions is of the utmost urgency.
Development of the financial sector is a prerequisite for economic development, and reducing carbon emissions is an essential component of economic transformation. In 2008, the added value of China’s financial sector was 183.134 billion yuan. The financial sector continued to grow in the following years. The added value was 6,112.17 billion yuan in 2016. Accordingly, financial development is inextricably linked to economic development. In terms of the relationship between finance and carbon emission reduction, there are three views. First, financial development would lead to increased carbon emissions by facilitating industrialization. The Climate Change Convention and the Kyoto Protocol stipulate that countries have different allocations of carbon emission rights and distinguish the rights of developed and developing countries at different stages. The international community prefers that the carbon emission rights of developing countries need to be adjusted according to the population (Yao, 2012). In this sense, some scholars have provided evidence of financial development’s significantly increasing carbon emissions in developing nations, such as India (Boutabba, 2014), Pakistan (Ali et al., 2015; Shahzad et al., 2017), and Senegal (Asumadu-Sarkodie and Owusu, 2016). Due to China’s large population, it has also produced the highest carbon emissions in the world as a developing country. Xiong and Qi (2018) used China’s provincial data and found that its financial development would also significantly encourage carbon emissions.
Second, the effects of financial development on carbon emissions are uncertain. Ozturk and Acaravci (2013) found that financial development in Turkey had no significant effects on carbon emissions. Dogan and Seker (2016) also found no significant effects in renewable energy countries. Considering the heterogeneity and differences in the degrees of the financial development of various countries, Acheampong et al. (2020) found that financial development may have reduced carbon emissions as a whole, but the nonlinear and regulatory effects of financial development on carbon emissions were different at different stages of financial development in different countries, so the comprehensive effects could not be determined. Taking different income samples as an example, Ehigiamusoe (2019) found that financial development reduced the carbon emissions of high-income groups but aggravated those of low- and middle-income ones.
Third, there is a nonlinear relationship between financial development and carbon emissions. Charfeddine and Khediri (2016) used a co-integration model and found that the effects of financial development on carbon emissions were a structural mutation phenomenon. Zaidi et al. (2019) showed that the financial development and carbon dioxide emissions in member countries of the Asia-Pacific Economic Cooperation (APEC) had an inverted U-shape, indicating that the expansion of financial development had a nonlinear relationship with carbon emissions, i.e., the former would first stimulate but then suppress the latter. Katircioğlu and Taspinar (2017) believed that the development of the financial industry had a certain inhibitory effect on carbon emissions based on Turkey. To sum up, the discussion on the relationship between financial development and carbon emissions has not been unified. Gök (2020) suggested that research on financial development and carbon emissions depended on the selected financial development indicators, estimation methods, and research objects.
Energy consumption has contributed to a large amount of carbon dioxide emissions during the process of China’s economic development. One of the most pressing environmental issues in the world is the greenhouse effect caused by carbon dioxide. In addition, the green transition is an effective way to reduce pollution in economic development. Therefore, to reduce carbon emissions, the financial industry is seeking new ways, such as green credit, green securities, green insurance, and green bonds, to realize green finance. Chen et al. (2018) found that green financial policies serve the purpose of carbon emission reduction through new financial products by controlling the long-term borrowing of high pollution industries. However, modest research has been conducted on the relationship between green finance and carbon emissions. From a national and regional macro level, coal energy consumption, industry value added (Shahzad et al., 2021), environmental taxes (Ghazouani et al., 2021) and environmental regulation (Song et al., 2021) have a significant impact on carbon emissions. Nevertheless, at the corporate level, the effectiveness of macro-control policies needs to be examined. Energy savings and emission reduction have become rigid goals for the green development of the global economy. Growth in the economy increases energy consumption, whereas biomass and renewable energy are conducive to green development (Magazzino et al., 2021a; Mele et al., 2021). In terms of emission reduction, biomass energy has a greater reduction effect than fossil fuels (Magazzino et al., 2021b; Magazzino et al., 2021c ). Throughout this paper, the subject of reducing industry-level carbon emissions is explored from a policy perspective. As an effective form of green economic development, is green finance following or running counter to the trend?
This paper used the panel data of 23 industries in 30 provinces from 2007 to 2016, took the Green Credit Guidelines published in 2012 as a quasi-natural experiment. The experimental group represents the industry subject to the green credit guidelines, whereas the control group is the industry not affected by the policy. The difference-in-differences (DID) method was used to examine the effects of the Guidelines on China’s industrial carbon emissions and verify if the green financial policy had reduced the emissions. The explanatory variable is the green financial policy, and the explained variable is the increase of carbon dioxide. The marginal contributions of this study are: 1) the first use of the Guidelines as a green financial policy to measure the variables of green finance and examine the relationship between the policy and carbon emissions; 2) the use of the causal identification of the DID method to examine the effects of green financial policies on carbon emissions and clarify the causal relationship between green finance and carbon emissions; 3) an empirical study of the effects of green financial policies on carbon emission increments of high pollution and high energy consumption industries, as well as a study of regional and industry heterogeneity.
Policy Background and Theoretical Analysis
The green financial policy mentioned in this paper refers to the Green Credit Guidelines issued by the China Banking Regulatory Commission (China Banking Regulatory Commission) in 2012. We measured the green credit in accordance with the promulgation of the policy. In these Guidelines, the credit industry has been given a clear definition and a concrete argumentation. Banks and other financial institutions formulate credit guidelines for industries regulated by the government and those with significant environmental and social risks. It is the role of financial institutions to implement green credit policies, link corporate credit lines with environmental performance, such as corporate pollution emissions, and optimize the industrial structure and sustainable development. According to policy requirements, firms are required to provide detailed pollution information to banks. In accordance with the environmental pollution of the firms, the bank controls the credit threshold strictly. Therefore, the credit volume to dirty firms is limited, and firms must reduce pollution emissions in a variety of ways. In the new era of economic development in China, environmental policies are aligned with the goal of reducing carbon emissions. Because the policy’s implementation is less affected by local governments, it is possible to reflect the direct impact of green financial policies on industrial carbon emissions.
In accordance with banking microeconomic theory (Stiglitz and Weiss, 1981), there is an information asymmetry between banks and enterprises. The asymmetry of information results in an imbalance in the allocation of financial resources between enterprise property rights and scale. Companies with higher carbon emissions will also receive substantial financial support since financial resources are more readily available to large companies. As a result of the green finance policy, financial institutions are encouraged to establish green financial products that will aid companies in developing clean production methods and reduce greenhouse gas emissions. This paper explores the relationship between green credit policies and carbon emissions resulting from corporate financing, corporate investments, and resource allocation, as shown in Figure 1.
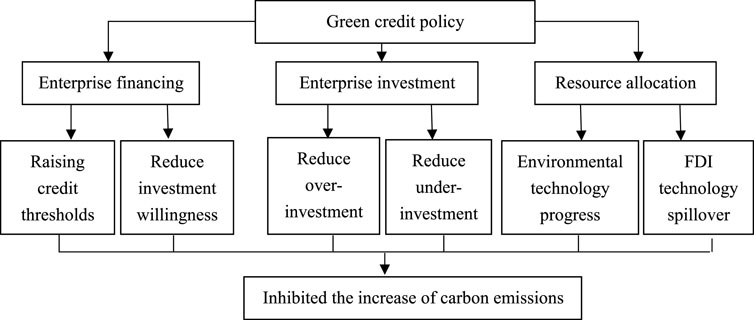
FIGURE 1. Impact mechanism of green credit policy on carbon emissions.
First, from the perspective of corporate finance, green financial policies have raised the credit thresholds for industries with high pollution and high energy consumption. Moreover, it reduces the willingness of external creditors to invest in it. On the one hand, credit policy directly affects corporate debt (Demirguc-Kunt and Maksimovic, 1996), which is the foundation of industry debt (Mitton, 2008). Green credit policies limit opportunities for the high pollution and high energy-consuming industries to obtain new loans and restrict their development (Liu et al., 2019). However, only increases in bank loans are affected but those that have already been obtained are not restricted. As a result, the expansion of such industries is limited, thereby affecting the quantity of carbon emissions. On the other hand, government departments transmit corporate environmental information to the market, disclose and expose corporate pollution information, and improve market supervision mechanisms. Such activities affect the investment decisions of external creditors (Michael and Mitchell, 2006), which directly affect the capital operations, business strategies, and production scales of companies, and, in turn, affect carbon emissions. In sum, green financial policies affect corporate carbon emissions by influencing credit thresholds and the willingness of external creditors to invest.
Second, companies will receive inadequate or excessive investment (Richardson, 2006). Green financial policies affect corporate investment decisions, which, in turn, affect corporate carbon emissions. Cash flow is directly linked to corporate investments. In theory, excessive flow signifies excessive investment, whereas insufficient flow signifies insufficient investment. From a quantitative analysis of the effects of green credit policies, Liu et al. (2017) argued that such policies could significantly inhibit investment in energy-intensive industries, as well as limit the debt problems of high pollution and high energy industries (Zhang et al., 2011). Therefore, for high pollution enterprises, green financial policies limit excessive cash flow and curb investment, thereby reducing corporate carbon emissions. However, from the perspective of the opportunity costs of capital utilization, green financial policies encourage investment and development for green enterprises by increasing credit lines and alleviating the lack of cash flow, thereby reducing social carbon emissions. To sum up, at the level of corporate investment, green finance reduces carbon emissions by remedying both underinvestment and overinvestment.
Finally, from the perspective of resource allocation, green financial policy forces industrial transformation and upgrading, which affects environmental technology progress and Foreign Direct Investment (FDI) technology spillover. Acemoglu et al. (2012) proposed advances in environmental technology for energy saving and emission reduction to reduce industrial carbon emissions. The promulgation of the green credit policy reflects if an enterprise has withstood the pressure of transformation. In general, effective implementation can encourage enterprises to improve energy efficiency and reduce carbon emissions. From the perspective of FDI technology spillover based on the “pollution paradise hypothesis,” Javorcik and Wei (2003) believe that multinational companies with high pollution and high emissions are more likely to migrate to countries with weaker environmental standards. In addition, the “Porter hypothesis” that improves the environmental regulation standards of the host country would encourage multi-national research and development of clean technologies and emission reduction, thus further improving sewage pollution (Porter, 1991). The implementation not only restricts the entry of high polluting industries with no threshold but also encourages the entry of low polluting green industries. Green financial policies reduce carbon emissions through progress in environmental technology and through FDI technology spillover.
The above analysis can lead to the conclusion that green credit policies would have different effects on different industries. Looking further from the perspective of different industries, how do green credit policies affect their carbon emissions? According to the Green Credit Guidelines, such policies have specific effects on the following three industries. First, industries with high pollution and high energy consumption, i.e., with high carbon emissions, are directly restricted by green credit. After the implementation of green policies, the difficulty of granting credit will increase or become prohibited altogether. Second, green credit policies encourage the development of green industries, such as new energy industries, and banks will grant credit lines to encourage their development. Third, the policy has insignificant effects on the credit lines granted by banks to industries that are neither high pollution and high energy consumption nor green. According to the current industry classification, the green industry, with its weak foundations, has not been classified into a specific industry category. Therefore, what can be compared is the difference between high polluting, high energy-consuming industries and low polluting, low energy-consuming industries. In light of the above analysis, this paper proposes the following hypotheses:
Hypothesis 1. As a green financial policy, green credit policy can inhibit the increase of carbon emissions.The Green Credit Guidelines is non-binding policy, and it takes some time for banks to implement the policies of the Green Credit Guidelines. Continuous impact of policy implementation needs to be improved, and the overall impact is lagging. Meanwhile, not all industries with high pollution and high energy consumption will apply for bank credit when the policy are issued. Therefore, the impact of the Green Credit Guidelines policy on carbon emissions will require a process. In summary, it is necessary to further consider the time lag when discussing the impact of green finance policies on carbon emissions. Hence, we propose the following hypothesis:
Hypothesis 2. The impact of the Green Credit Guidelines has a time lag effect.
Methodology and Data
Model Setting and Definition of Variables
We have added a flowchart to show the research methodology in the Supplementary Chart. The economic policies covered by this study affected particular areas. The DID method can be used to identify econometric models of the shock effects of economic policies and the effects on the gap among regions where the policies have been implemented and not implemented. A model constitutes two differences and can identify the net effect of an economic policy on a certain region. The estimation formula is:
where y
it
is the explained variable, du is a dummy variable for the regions set to 1 for the experimental group but 0 for the control group, and dt is a dummy variable for policy implementation set to 0 or 1 before or after implementation, respectively. du × dt represents the interaction item between the virtual variables of the region and policy implementation, before which du × dt = 0 and after which du × dt = 1. The effects of the policies can be represented by simplified graphs, as shown in Table 1. The coefficient
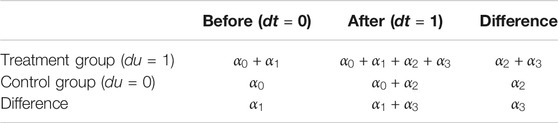
TABLE 1. Policy effect analysis table of double difference method.
According to the theoretical analysis of the second part and the application of the DID method, the model is:
where i represents the industry, p represents the province, and t represents the year.
For industry, exports (export) were controlled by the proportion of export delivery value to sales value. The industry profit rate (profit) was measured by the ratio of the total profit to sales output value multiplied by 100%. Industry revenue capacity (inc_cap) was expressed as the proportion of main business revenue in paid-in capital. The proportion of national capital was the proportion of national capital to paid-in capital. For province, the natural logarithm of GDP per capita (lnpgdp) was controlled. Then, the number of patents per 10,000 people (ppatent) was divided by the total number obtained each year by each province and the total number of people was multiplied by 10,000. In addition, the proportion of secondary industry (indstr) was expressed as the proportion of secondary industry to GDP. Financial self-sufficiency (finc_exp) was fiscal expenditure divided by fiscal revenue.
Sample Selection and Data Sources
The carbon emission data of the explained variables by province and industry were derived mainly from the China Carbon Emissions Database (CEADs) (Shan et al., 2018; Shan et al., 2020). With the joint support of many research institutions, such as the British Research Council, the Newton Foundation, the National Natural Science Foundation of China, and the Chinese Academy of Sciences, scholars from all over the world have compiled China’s multi-scale carbon emission inventory.
The CEADs is used for industry matching with the China Industrial Economic Database. Hence, we matched 23 industries, including special equipment manufacturing, transportation equipment manufacturing, chemical manufacturing and so on. In addition, according to the energy consumption per unit of industrial added value, the petroleum refinery industrial, chemical industry, nonferrous metals products manufacturing, smelting and pressing of ferrous metals, and non-ferrous metal smelting are designed as high energy consumption industries. Therefore, the above five industries are experimental group and the remainders represent the control group.
The industry control variables in this paper were derived mainly from the China Industrial Economic Database of the Easy Professional Superior data platform (EPS), which is a comprehensive Social Sciences data service platform including China’s macro-economy, financial market, industrial operation, regional economy, foreign trade, and so on. In addition, the provinces’ control variables came from the “China Macroeconomic Database” of the EPS data platform. During data processing, the China Carbon Emissions Database was matched with the China Industrial Economic Database. The Green Credit Guidelines were implemented in 2012. The data were first compiled in 2007 and last updated in 2016. Therefore, the final sample inspection period was determined to be 2007–2016. However, the selected explained variable in this paper is incremental, so the period of the last research data is 2008–2016. The descriptive statistical tables of the main variables are shown in Table 2.
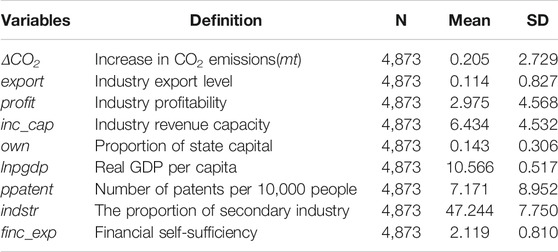
TABLE 2. Descriptive statistics of main variables.
Empirical Results
Benchmark Regression
After the Hausman test between fixed effects and random effects, the fixed effect model was used to estimate the model in this study. Table 3 presents the corresponding estimation results. Column (1) shows the control industry-provincial fixed effects. Only the policy effects of the Green Credit Guidelines were examined. The results show that the coefficient of du × dt is significantly negative and the coefficient value is 1.071, indicating that the policy will reduce 1.071 million tons (mt) of carbon emissions in total. 1 Reducing 1.071 mt of carbon dioxide is critical for China’s ecological and environmental protection, as well as for the sustainable development. Considering the time effect, Column (2), which is based on Column (1), controls the fixed effects of the year. The coefficient of du × dt remained highly negative and the change in the coefficient was negligible, indicating that policy could have a relatively stable effect on the incremental carbon emissions from the high pollution and high energy industries.
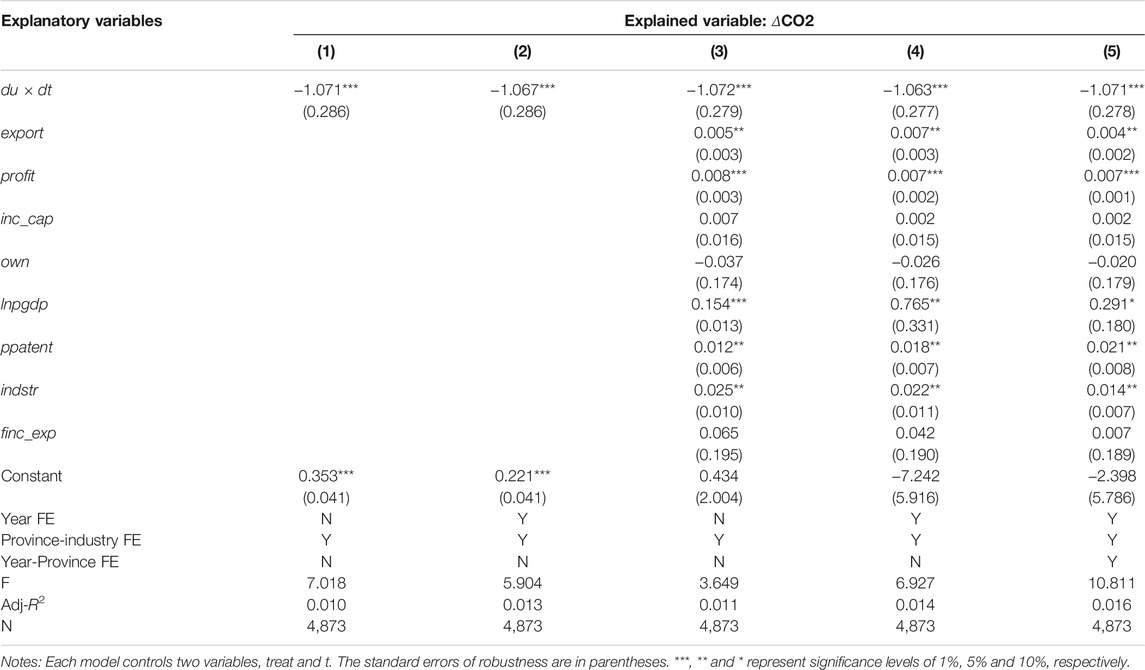
TABLE 3. Benchmark regression.
In addition, industry and regional control variables are added in Column (3). Compared with the coefficient in Column (1), the coefficient of du × dt is still highly negative and mostly unchanged, indicating a relatively stable effect. To examine the individual time effects, the time control variable was added in Column (4). The core explanatory variable was still significantly negative. Based on the three-dimensional panel data composed of province–industry–year, the sample continues to control the year–province fixed effect in Column (5). The results show that the coefficient of du × dt is still highly negative. Moreover, the coefficient is almost the same as that in Column (1). After a comprehensive consideration of various factors, the effect was relatively stable. Therefore, Hypothesis 1 was supported.
Among the industry control variables, industry export level, and industry profitability had significant positive effects on incremental carbon emissions, signifying that industry revenue capacity and national capital share did not drastically affect incremental carbon emissions. Among the regional control variables, the actual GDP per capita at the provincial level, the number of patents per 10,000 people, and the proportion of the secondary industry had very strong effects on incremental carbon emissions, whereas fiscal self-sufficiency had no significant effect.
Parallel Trend Test
On the basis of empirical evidence, we also did a parallel trend test. The result is shown in Figure 2. Before the implementation of the policy, it is obvious that none of the coefficients are significant, which demonstrates that the differences in carbon emissions between the treatment group and the control group before policy were not significant. The results show that the parallel trend assumption is supported by these results, indicating that the application of the DID method to assess the policy is a reasonable and convincing approach.
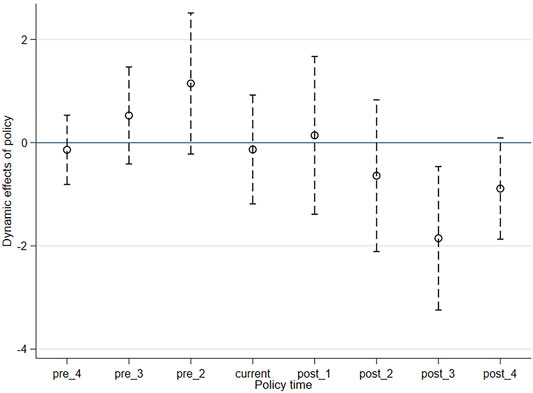
FIGURE 2. Parallel trend test.
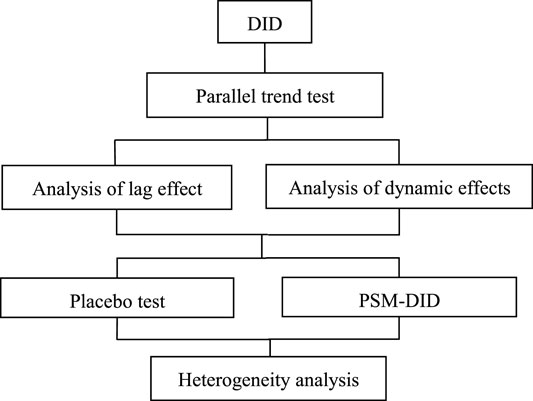
FIGURE 3. Parallel trend test.
Analysis of Lag Effect
Considering that the implementation of the policies and the embodiment of the policy’s effects need a time cycle This study focused on the time lag’s effects on incremental carbon emissions. The results are reported in Table 4. The six models include all control variables.

TABLE 4. Analysis of lag effect.
Column (2) is based on Column (1) and increases the fixed effect of time. Column (3) uses Column (2) and adds the year–province fixed effect. The estimation results of the three models show that the regression coefficient of du × dt’s lagging one period is highly negative. The coefficient’s values are 1.062 and 1.092. As more fixed effects are added, the absolute value of the coefficient increases, indicating that the policy’s effects are relatively exogenous and the results are relatively stable. Judging from the magnitude of the numerical change, the coefficient has increased, indicating that one year after the policy’s implementation had a more obvious effect on the reduction.
Columns (4) to (6) are consistent with the regression methods of Columns (1) to (2) and gradually increase the time and the year–province fixed effects. The only difference is du × dt’s being set to lag in the second period and still being significantly negative. The absolute value of the coefficient is significantly higher than the baseline regression, indicating that the effect was more obvious 2 years after the implementation.
Analysis of Dynamic Effects
According to the above results, the policy had a reduction effect on the industry’s incremental carbon emissions and the effect had a time lag. This study analyzed the dynamic effects of the policy on the incremental carbon emissions. First, to generate green2009 dummy variables with 2008 as the base period, the policy was assumed to have been implemented in 2009, during which the high pollution and high energy industries take values of 1, whereas the other industries take values of 0. By analogy, seven dummy variables from green2010 to green2016 were generated. When the model was estimated, these dummy variables were added to the model together. The estimated coefficient of each dummy variable represents the effects of the policy after its implementation in that year. Then, the dynamic effects of the hypothetical green financial policy were judged. Table 5 presents the corresponding estimation results.
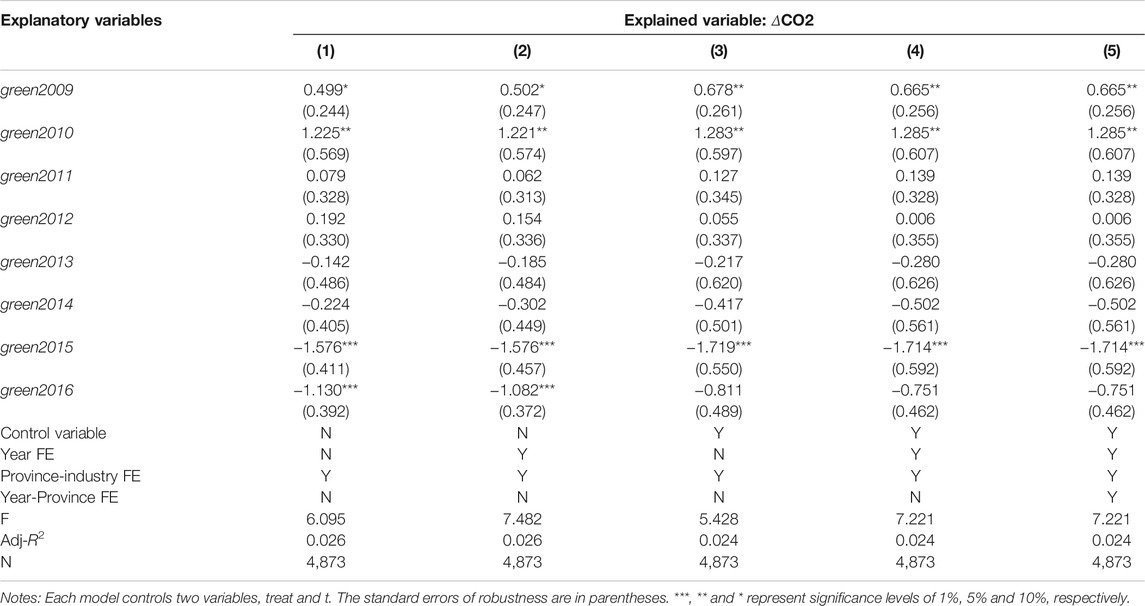
TABLE 5. Dynamic effect analysis.
Columns (1) and (2) do not include the control variables, whereas Column (2) in Column (1) controls the fixed effect of time. The regression results show that the coefficients of green2009 and green2010 are significantly positive, i.e., in 2009 and 2010, the incremental carbon emissions of the high pollution and high energy industries increased relative to those of other industries. In 2011 and 2012, the two coefficients were still positive but not significant. Moreover, in 2013 and 2014, the regression coefficient was negative but not significant. From Columns (3) to (5), other control variables were added into the regression. The coefficient of the green dummy variable was not significantly positive until 2015, indicating that the green financial policy had a strong time lag and a reduction effect had only begun to play a role 4 years after the policy’s implementation.
Placebo Test
Because the choice of processing groups was determined by energy consumption, the selection has a certain randomness. The placebo test was performed by changing experimental groups. The metallurgy industry, general equipment manufacturing, special equipment manufacturing, transportation equipment manufacturing, and electrical machinery and equipment manufacturing belong to the heavy industries. Compared with the general industries, their energy consumption is higher. However, they are not industries that have restricted credit in the Green Credit Guidelines. We regarded the above five industries as the experimental group (dpu = 1) and other industries as the control group (dpu = 0). The results are reported in Table 6. Under Columns (1) to (3), the control variables, time effects, and individual effects were controlled separately. The estimated coefficients of dpu × dt were significantly positive, indicating that the above five industries had increased their carbon emissions more than did the other industries. There was no carbon emission reduction. Considering the time lag, Columns (4) to (7) under the three conditions of controlling province–industry, year–province, and both, we specifically investigated the incremental carbon emissions in the dpu × dt lag phase. The results are consistent with Columns (1) to (3). The coefficients of dpu × dt were significantly positive, indicating no reduced carbon emissions. In summary, we found from the placebo test that green financial policies stimulated emission reduction only from high pollution and high energy industries. Moreover, this reduction effect had a time lag, thus supporting both Hypothesis 1 and Hypothesis 2.
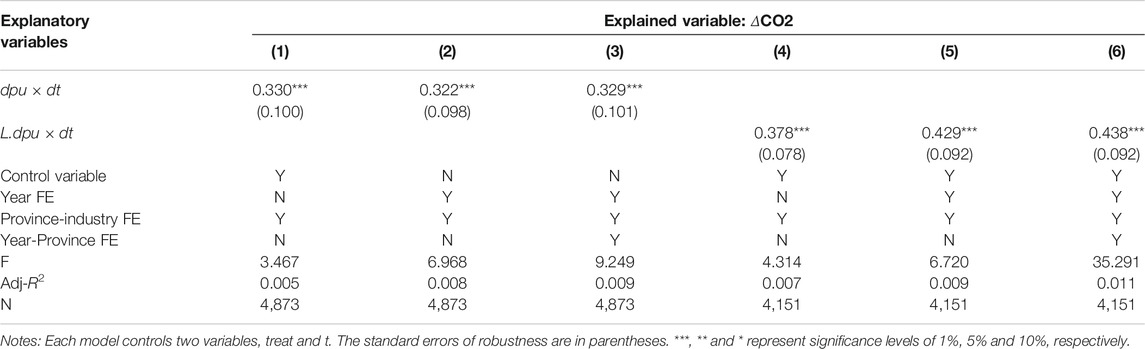
TABLE 6. Placebo test.
Propensity Score Matching Difference-in-Differences
According to the above analysis, the policy had a reduction effect on incremental carbon emissions from only high pollution and high energy industries. However, the DID model cannot completely solve the endogenous problem, signifying that the influence of other factors on incremental carbon emissions could not be ruled out. To alleviate possible endogenous problems, we used the PSM-DID method for testing. The results are shown in Table 7. Specifically, PSM was used to match samples similar to the experimental group, then the DID method was used for estimation. When a certain experimental observation i is matched, we take a weighted average of all the observations of the control group, and the weight can be determined by the kernel function. The kernel function reflects the degree of similarity of the covariate. If the covariate is similar, the weight for it will be greater.
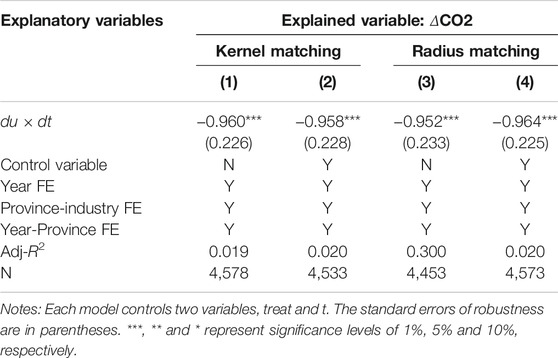
TABLE 7. PSM-DID test.
Columns (1) and (2) are the estimated results of DID after kernel matching. In the absence of control variables, the coefficient of du × dt was –0.96. When the control variables were included, the regression coefficient was –0.958. Both coefficients are highly significant with a small difference between them. Columns (3) and (4) show the results of the DID estimation after radius matching. The coefficient of du × dt remained significantly negative even when the control variable was added. In addition, there is no significant difference in the coefficient size. From the regression analysis, we found that the coefficient of du × dt was relatively minor when compared to the benchmark regression, indicating the possibility of overestimation and that other factors had strengthened the effects of the policy when PSM matching was not used. Therefore, the estimation results of the PSM-DID method were more reliable.
Heterogeneity Analysis
To examine the regional differences in the effects of the financial policy, this study analyzed the heterogeneity of green financial policy on the industry’s incremental carbon emission reductions from the perspectives of regional and industry heterogeneity. The 30 provinces of mainland China (excluding Tibet) were divided into sub-samples of four regions: eastern, central, western, and northeastern. The eastern region covered the 10 provinces and cities of Beijing, Hebei, Tianjin, Shandong, Jiangsu, Shanghai, Zhejiang, Fujian, Guangdong, and Hainan, the central region covered the six provinces of Shanxi, Henan, Anhui, Hunan, Hubei, and Jiangxi. The western region included Inner Mongolia, Xi’an, Gansu, Qinghai, Xinjiang, Yunnan, Sichuan, Chongqing, Guizhou, Guangxi, and 11 other provinces and cities. The northeastern region included Liaoning, Jilin, and Heilongjiang. The last region was separately investigated because of its serious industrial decline.
The regression results in Table 8 show that the du × dt coefficient is significantly negative in the four models, indicating that green financial policy had a significant effect on the incremental carbon emission reductions of the high pollution and high energy industries in all four regions. Specifically, the du × dt coefficient of the eastern region is 1.188, which is greater than those of 1.012 of the central and 0.700 of the western regions. Moreover, the absolute value of the regression coefficient in the northeastern region is 2.155. Thus, the policy’s effects were the strongest in the northeastern, followed by the eastern, central, and western regions. The effects in the northeastern region may be related to the decline of its aging industrial foundation, whereas the strengths of the effects in the other regions may be related to their levels of economic development.
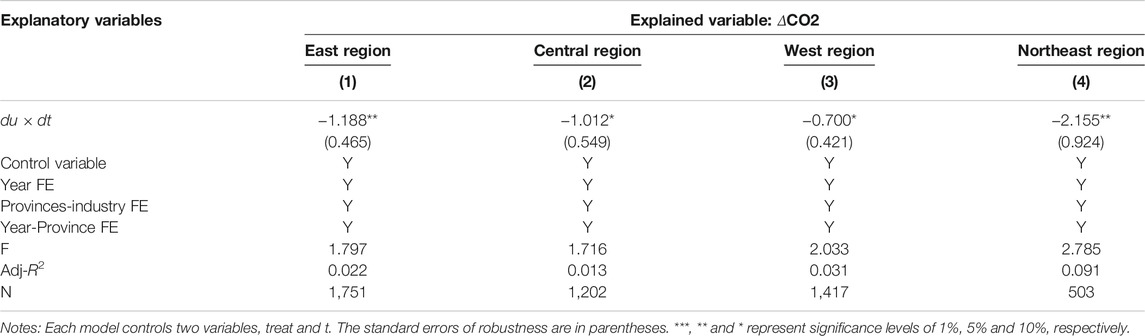
TABLE 8. Regional heterogeneity analysis.
To examine the differences in the emission reduction effect of green credit policies, this study examined the effects of the green financial policy on capital heterogeneity and average profit heterogeneity. The results are shown in Table 9.
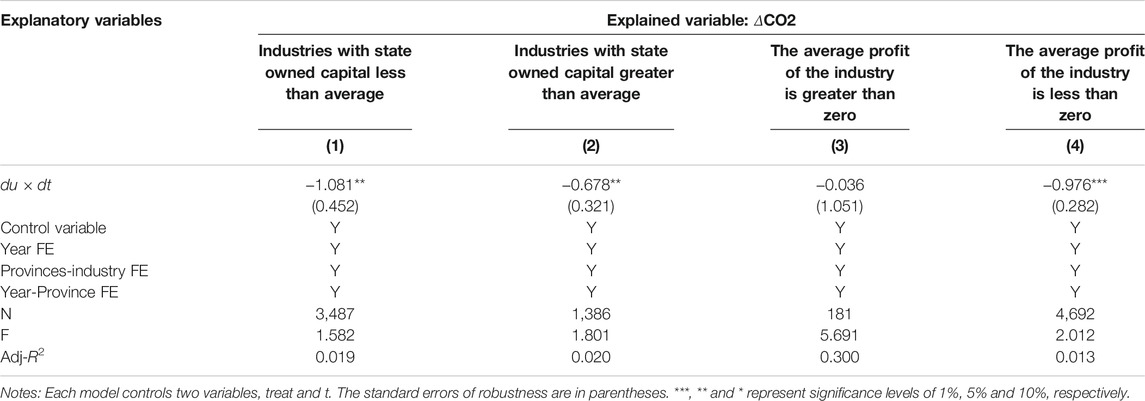
TABLE 9. Industry heterogeneity analysis.
To examine the heterogeneity of capital, the average capital value (0.143) was taken as the sample cut-off point. Columns (1) and (2) respectively represent two sub-samples in which the proportions of state-owned capital are less and greater than the industry average. The results show that in industries where state-owned capital is less than the average, the absolute value of the regression coefficient of du × dt is relatively larger, indicating that the industries where state capital accounts for a relatively small (or large) amount had been relatively more (or less) affected by green financial policy. The probable reason is the banks’ consideration of not only the industry’s characteristics but also the state-owned nature of the enterprise when they issue loans.
In order to investigate the differences of the emission reduction effects of green credit policy in different profit margin industries, the industry average profit rate as zero was taken as the sample cut-off point. Columns (3) and (4) respectively represent the regression results of two sub-samples with industry average profit rates of zero and less than zero. According to Table 9, the green financial policy had no significant effect on industries whose average profit margins were greater than zero. However, in industries where the average profit margins were less than zero, the policy had a significant and negative effect. The probable reason is the banks’ inclinations toward enterprises in industries with high profit margins. Even if they are high pollution and high energy industries, they are still eligible for loans.
Conclusion and Policy Implications
Financial development, financial globalization, and high-tech industries have a strong connection with environmental ecology (Shahzad et al., 2022). A primary goal of this paper was to determine whether the green credit policy had met the low-carbon economic development. In applying the difference-in-differences method to estimate the emission reduction effects of the policy, this paper adopted the Green Credit Guidelines as a policy shock toward green financial policy. Several conclusions are drawn. Our basic empirical model indicates that green financial policy has significantly reduced incremental carbon emissions in high pollution and high energy consumption industries. According to our simulation of the dynamic effect, there was a time lag and the results were apparent only three to 4 years after the policy was implemented. Additionally, the PSM-DID and placebo test all show the robust result. According to the results of a study of regional heterogeneity, green financial policy had the most impact in the northeastern region, followed by the eastern, central, and western regions. Also, according to the results of the analysis of industry heterogeneity, the effects of green financial policy were stronger in industries with small proportions of state-owned capital and margins less than zero.
The policy enlightenment in this paper is in the following areas. Introducing green credit policies can significantly reduce greenhouse gas emissions. Thus, controlling carbon emissions through macro financial means is positive and effective at the micro level. In addition, the policy effect lags behind. The government should rationally enhance the implementation of green credit policies. Furthermore, the effects of policy implementation vary among regions and industries. Thus, it is important for the government to consider the differences between regions and industries.
Data Availability Statement
Publicly available datasets were analyzed in this study. This data can be found here: https://www.ceads.net.cn/ https://data.cnki.net/NewHome/index.
Author Contributions
JQ is responsible for data processing and first draft of the study. JC is responsible for the design and literature collection.
Funding
This paper was supported by the Shanghai Social Science Planning Annual Project (No. 2021BJB003).
Conflict of Interest
The authors declare that the research was conducted in the absence of any commercial or financial relationships that could be construed as a potential conflict of interest.
Publisher’s Note
All claims expressed in this article are solely those of the authors and do not necessarily represent those of their affiliated organizations, or those of the publisher, the editors and the reviewers. Any product that may be evaluated in this article, or claim that may be made by its manufacturer, is not guaranteed or endorsed by the publisher.
Supplementary Material
The Supplementary Material for this article can be found online at: https://www.frontiersin.org/articles/10.3389/fenvs.2022.798072/full#supplementary-material
Footnotes
1 If the coefficient is M, the coefficient indicates that X changes by one unit while Y changes by M units on average. Specifically, the implementation of the policy is expected to affect the carbon emissions of M units. The policy implementation time is 2012, and the research time period is 2008–2016. Specifically, through the implementation of this policy, the carbon increase of the experimental group was reduced by 1.071 million tons after 2012.
References
Acemoglu, D., Aghion, P., Bursztyn, L., and Hemous, D. (2012). The Environment and Directed Technical Change. Am. Econ. Rev. 102 (1), 131–166. doi:10.1257/aer.102.1.131
Acheampong, A., Amponsah, M., and Boateng, E. (2020). Does Financial Development Mitigate Carbon Emissions? Evidence from Heterogeneous Financial Economies. Energ. Econ. 88 (5), 1–13. doi:10.1016/j.eneco.2020.104768
Ali, S., Hamid, W., and Ahmad, N. (2015). Analyzing the Dynamics of Energy Consumption, Liberalization, Financial Development, Poverty and Carbon Emissions in Pakistan. J. Appl. Environ. Biol. Sci. 5 (4), 166–183.
Asumadu-Sarkodie, S., and Owusu, P. A. (2016). A Multivariate Analysis of Carbon Dioxide Emissions, Electricity Consumption, Economic Growth, Financial Development, Industrialization, and Urbanization in Senegal. Energ. Sourc. B: Econ. Plann. Pol. 12 (1), 77–84. doi:10.1080/15567249.2016.1227886
Boutabba, M. A. (2014). The Impact of Financial Development, Income, Energy and Trade on Carbon Emissions: Evidence from the Indian Economy. Econ. Model. 40 (6), 33–41. doi:10.1016/j.econmod.2014.03.005
Charfeddine, L., and Khediri, K. (2016). Financial Development and Environmental Quality in UAE: Cointegration with Structural Breaks. Renew. Sustain. Energ. Rev. 55, 1074–1085. doi:10.1016/j.rser.2015.07.059
Chen, Y.-C., Hung, M., and Wang, Y. (2018). The Effect of Mandatory CSR Disclosure on Firm Profitability and Social Externalities: Evidence from China. J. Account. Econ. 65 (1), 169–190. doi:10.1016/j.jacceco.2017.11.009
Demirguc-Kunt, A., and Maksimovic, V. (1996). Stock Market Development and Financing Choices of Firms. World Bank Econ. Rev. 10 (2), 341–369. doi:10.1093/wber/10.2.341
Dogan, E., and Seker, F. (2016). The Influence of Real Output, Renewable and Non-renewable Energy, Trade and Financial Development on Carbon Emissions in the Top Renewable Energy Countries. Renew. Sustain. Energ. Rev. 60 (7), 1074–1085. doi:10.1016/j.rser.2016.02.006
Ehigiamusoe, K. (2019). Effects of Energy Consumption, Economic Growth, and Financial Development on Carbon Emissions: Evidence from Heterogeneous Income Groups. Environ. Sci. Pollut. Res. 26 (22), 1–14. doi:10.1007/s11356-019-05309-5
Ghazouani, A., Jebli, M. B., and Shahzad, U. (2021). Impacts of Environmental Taxes and Technologies on Greenhouse Gas Emissions: Contextual Evidence from Leading Emitter European Countries. Environ. Sci. Pollut. Res. 28, 22758–22767. doi:10.1007/s11356-020-11911-9
Gök, G. (2020). The Role of Financial Development on Carbon Emissions: A Meta Regression Analysis. Environ. Sci. Pollut. Res. 27 (1), 11618–11636. doi:10.1007/s11356-020-07641-7
Javorcik, B. S., and Wei, S.-J. (2003). Pollution Havens and Foreign Direct Investment: Dirty Secret or Popular Myth? Contrib. Econ. Anal. Pol. 3 (2), 1244. doi:10.2202/1538-0645.1244
Katircioğlu, S., and Taşpinar, N. (2017). Testing the Moderating Role of Financial Development in an Environmental Kuznets Curve: Empirical Evidence from Turkey. Renew. Sustain. Energ. Rev. 68, 572–586. doi:10.1016/j.rser.2016.09.127
Liu, J.-Y., Xia, Y., Fan, Y., Lin, S.-M., and Wu, J. (2017). Assessment of a Green Credit Policy Aimed at Energy-Intensive Industries in China Based on a Financial CGE Model. J. Clean. Prod. 163 (10), 293–302. doi:10.1016/j.jclepro.2015.10.111
Liu, X., Wang, E., and Cai, D. (2019). Green Credit Policy, Property Rights and Debt Financing: Quasi-Natural Experimental Evidence from China. Finance Res. Lett. 29 (6), 129–135. doi:10.1016/j.frl.2019.03.014
Magazzino, C., Mele, M., and Schneider, N. (2021b). A D2C Algorithm on the Natural Gas Consumption and Economic Growth: Challenges Faced by Germany and Japan. Energy 219 (8), 119586. doi:10.1016/j.energy.2020.119586
Magazzino, C., Mele, M., Schneider, N., and Shahbaz, M. (2021c). Can Biomass Energy Curtail Environmental Pollution? A Quantum Model Approach to Germany. J. Environ. Manage. 287, 112293. doi:10.1016/j.jenvman.2021.112293
Magazzino, C., Porrini, D., Fusco, G., and Schneider, N. (2021a). Investigating the Link Among ICT, Electricity Consumption, Air Pollution, and Economic Growth in EU Countries. Energ. Sourc. Part B: Econ. Plann. Pol. 17, 1–23. doi:10.1080/15567249.2020.1868622
Mele, M., Gurrieri, A. R., Morelli, G., and Magazzino, C. (2021). Nature and Climate Change Effects on Economic Growth: an LSTM experiment on Renewable Energy Resources. Environ. Sci. Pollut. Res. 28, 41127–41134. doi:10.1007/s11356-021-13337-3
Michael, F., and Mitchell, A. P. (2006). Does the Source of Capital Affect Capital Structure? Rev. Financ. Stud. 19 (1), 45–79. doi:10.1093/rfs/hhj003
Mitton, T. (2008). Why Have Debt Ratios Increased for Firms in Emerging Markets? Europe Finance Manage. 14 (1), 127–151. doi:10.1111/j.1468-036x.2007.00430.x
Ozturk, I., and Acaravci, A. (2013). The Long-Run and Causal Analysis of Energy, Growth, Openness and Financial Development on Carbon Emissions in Turkey. Energ. Econ. 36 (8), 262–267. doi:10.1016/j.eneco.2012.08.025
Richardson, S. (2006). Over-investment of Free Cash Flow. Rev. Account. Stud. 11 (3), 159–189. doi:10.1007/s11142-006-9012-1
Roelfsema, M., van Soest, H. L., Harmsen, M., van Vuuren, D. P., Bertram, C., den Elzen, M., et al. (2020). Taking Stock of National Climate Policies to Evaluate Implementation of the Paris Agreement. Nat. Commun. 11 (1), 1–12. doi:10.1038/s41467-020-15414-6
Shahzad, S. J. H., Kumar, R. R., Zakaria, M., and Hurr, M. (2017). Carbon Emission, Energy Consumption, Trade Openness and Financial Development in Pakistan: A Revisit. Renew. Sustain. Energ. Rev. 70 (4), 185–192. doi:10.1016/j.rser.2016.11.042
Shahzad, U., Ferraz, D., Nguyen, H.-H., and Cui, L. (2022). Investigating the Spill Overs and Connectedness between Financial Globalization, High-Tech Industries and Environmental Footprints: Fresh Evidence in Context of China. Technol. Forecast. Soc. Change 174, 121205. doi:10.1016/j.techfore.2021.121205
Shahzad, U., Schneider, N., and Ben Jebli, M. (2021). How Coal and Geothermal Energies Interact with Industrial Development and Carbon Emissions? An Autoregressive Distributed Lags Approach to the Philippines. Resour. Pol. 74, 102342. doi:10.1016/j.resourpol.2021.102342
Shan, Y., Guan, D., Zheng, H., Ou, J., Li, Y., Meng, J., et al. (2018). China CO2 Emission Accounts 1997-2015. Sci. Data 5 (1), 170201–170208. doi:10.1038/sdata.2017.201
Shan, Y., Huang, Q., Guan, D., and Hubacek, K. (2020). China CO2 Emission Accounts 2016-2017. Sci. Data 7 (1), 54–59. doi:10.1038/s41597-020-0393-y
Song, M., Xie, Q., and Shen, Z. (2021). Impact of Green Credit on High-Efficiency Utilization of Energy in China Considering Environmental Constraints. Energy Policy 153, 112267. doi:10.1016/j.enpol.2021.112267
Stiglitz, J. E., and Weiss, A. (1981). Credit Rationing in Markets with Imperfect Information. Am. Econ. Rev. 71 (3), 393–410.
Xiong, L., and Qi, S. (2018). Financial Development and Carbon Emissions in Chinese Provinces: A Spatial Panel Data Analysis. J. Singapore. Econ. Rev. 63 (2), 447–464. doi:10.1142/S0217590817400197
Yao, C. (2012). Population Size, Economics Growth and Carbon Emission: Based on the Empirical Analysis and International Comparison. Econ. Geogr. 32 (3), 138–145.
Zaidi, S. A. H., Zafar, M. W., Shahbaz, M., and Hou, F. (2019). Dynamic Linkages Between Globalization, Financial Development and Carbon Emissions: Evidence from Asia Pacific Economic Cooperation Countries. J. Clean. Prod. 228 (8), 533–543. doi:10.1016/j.jclepro.2019.04.210
Keywords: green credit policy, carbon emission reduction, regional heterogeneity, industry heterogeneity, DID
Citation: Qin J and Cao J (2022) Carbon Emission Reduction Effects of Green Credit Policies: Empirical Evidence From China. Front. Environ. Sci. 10:798072. doi: 10.3389/fenvs.2022.798072
Received: 19 October 2021; Accepted: 04 January 2022;
Published: 26 January 2022.
Edited by:
Bodo Sturm, Leipzig University of Applied Sciences, GermanyReviewed by:
Umer Shahzad, Anhui University of Finance and Economics, ChinaSevda Kuşkaya, Erciyes University, Turkey
Copyright © 2022 Qin and Cao. This is an open-access article distributed under the terms of the Creative Commons Attribution License (CC BY). The use, distribution or reproduction in other forums is permitted, provided the original author(s) and the copyright owner(s) are credited and that the original publication in this journal is cited, in accordance with accepted academic practice. No use, distribution or reproduction is permitted which does not comply with these terms.
*Correspondence: Jianhua Cao, Y2FvLmppYW5odWFAbWFpbC5zaHVmZS5lZHUuY24=