 Dianxi Hu
 Jianling Jiao1
94% of researchers rate our articles as excellent or good
Learn more about the work of our research integrity team to safeguard the quality of each article we publish.
Find out more
ORIGINAL RESEARCH article
Front. Environ. Sci., 28 June 2022
Sec. Environmental Economics and Management
Volume 10 - 2022 | https://doi.org/10.3389/fenvs.2022.779617
This article is part of the Research TopicTrade Openness, Energy Usage and Environmental QualityView all 6 articles
The global value chain (GVC) is a new model of international commodity manufacturing and trade that provides a unique channel to obtain innovative knowledge and technology spillover. However, the impact mechanism of GVC embeddedness on the internal processes of the green innovation value chain (GIVC) is not clear. This study opens the “black box” of green innovation processes, which is very important for connecting resource and industrial chains. The KPWW method and the super-efficiency network SBM-DEA model (NSBM-S) are used to measure the GVC embeddedness index and GIVC efficiency, respectively. A panel model is constructed to demonstrate the multidimensional impacts of the GVC position on GIVC. The result show that mean green technology R&D efficiency is less than mean green achievement transformation efficiency; the impact of the GVC embeddedness on the GIVC efficiency is mainly reflected in the rise of the GVC position rather than the deepening of GVC participation; and the impact of the rise of the GVC position on the green technology R&D efficiency is greater than that of green achievement transformation efficiency. Without considering the greenness characteristics of intermediate output, the impact of the GVC position on the general innovation value chain will be amplified. Our conclusions are conducive to identifying the weak links in green innovation processes and provide novel empirical evidence for formulating sustainable development countermeasures in an open economy.
Under the new global division of labor mode and networked competition environment, the flow and restructuring of capital, labor, energy, and other factors have accelerated globally, and relevant countries embedded in the global value chain (GVC) could focus on the specialized manufacturing of intermediate products. The geographical isolation of product production and consumption cause carbon dioxide (CO2) and pollutant emissions from developed to developing countries. This leads to serious inequality between economic benefits and environmental losses in developing countries; sustainable development, with energy conservation and emission reduction as its core, faces multiple challenges (Hu et al., 2022). For a long time, the extensive development model of low labor cost, high energy consumption, and high pollution emissions in China’s manufacturing sector deviated from the five development concepts of “innovation, coordination, greenization, openness, and sharing”. Green production technology is a key factor in cleaner production; technological innovation and progress not only come from the promotion effect of independent research and development (R&D) of domestic institutions but also from the digestion, absorption, and re-innovation of international technology spillovers. To fully understand the role of GVC embeddedness in the optimization and allocation of green resources, it is imperative to explore the green innovation paradigm and then seize the initiative of the innovation value chain.
As the main part of the real economy, the manufacturing sector is an important engine for promoting the sustainable and rapid growth of China’s economy and even the global manufacturing industry. “Made in China 2025” proposes to deploy an innovation chain around the industrial chain and allocate a resource chain around the innovation chain (Yu, 2019); by accelerating green transformation and upgrading, the manufacturing sector should constantly improve resource utilization efficiency and build an efficient, clean, low-carbon, and circular manufacturing system. The work report of the State Council of China proposed vigorously promoting green development to achieve a “win-win” situation of high-quality development and ecological protection (Li, 2019). In 2021, the State Council issued guiding opinions on accelerating the establishment and improvement of a green and low-carbon circular economic system, emphasizing the construction of a market-oriented green technology innovation system, encouraging the R&D of green and low-carbon technologies and accelerating the transformation of scientific and technological achievements. Most existing literature regards the entire green innovation input–output system as a “black box”, only considering the initial input and final output, and ignores the internal structure and operation mechanism of the intermediate links of green innovation; this is not consistent with the actual situation of green innovation processes. Few studies have focused on the impact of GVC embeddedness on the internal processes of the green innovation value chain (GIVC), which directly restricts the pertinence and implementation effectiveness of the innovation-driven development strategy. Therefore, combined with GIVC theory and the realistic goal of enhancing green innovation momentum, this study puts forward the following core questions: What is the impact mechanism of the GVC position on the GIVC of China’s manufacturing sector? Is there any difference in the effect of GVC embeddedness on green technology R&D stage and green achievement transformation stage? To clarify these problems, this study uses the super-efficiency network SBM-DEA model (NSBM-S) to calculate whole- and subprocess GIVC efficiencies and constructs an empirical model to study the impact of the GVC embeddedness on the GIVC, to more clearly evaluate the hierarchy of green innovation processes.
The key innovations of this study are as follows. First, it focuses on the multiple effects of the GVC position on the GIVC and opens the “black box” of the internal structure of the green innovation system layer by layer. This not only realizes the transformation from “result-oriented” to “process-oriented” green technology innovation but also widens the channel category of green innovation resources. Second, referring to international patent classification (IPC) numbers, this study obtains the quantity of green invention patent applications by viewing and identifying patent abstracts in combination with the connotation of green technology and green products. Therefore, the greenness characteristics of intermediate outputs can be considered in this study, which makes it more scientific to use the two-stage NSBM-S model to calculate the GIVC efficiency. Third, this study found that the impact of the GVC embeddedness on the GIVC efficiency has mainly depended on the rise of the GVC position rather than the deepening of GVC participation; if the ecological features of the innovation processes were ignored, the impact of the GVC embeddedness on the innovation value chain would be exaggerated.
Our article is organized as follows: Section 2 involves the literature review. Section 3 offers research hypotheses. Section 4 introduces model construction, variable description, and data sources. Section 5 presents the results and analyses. Section 6 is the discussion. Section 7 summarizes the conclusions and makes policy recommendations.
The concept of the innovation value chain was proposed (Hansen and Birkinshaw, 2007), which was considered as a complete activity flow from creativity generation to product transformation to improve enterprise’s performance. It consists of closely related sub-links such as green design, R&D, learning by doing, trial production, production, and marketing. Based on combining the theories of innovation value chain and green innovation, GIVC is defined as the process by which each economy changes its production mode with the help of innovative means in the global production chain to reduce pollution emissions and improve green innovation productivity (Cui, 2020). Considering different judgments and purposes, there are individual differences in the classification of the innovation value chain. Among them, Xiao et al. (2015) subdivided the enterprise technological innovation activities into two interrelated subprocess stages of scientific and technological R&D and achievement transformation. Guan and Yu (2005) divided technological innovation processes into technology R&D stage and achievement transformation stage, while other studies divided the enterprise technological innovation processes into three stages: creativity generation, creativity transformation, and creativity diffusion. Drawing on innovation value chain theory and incorporating environmental effects, green innovation activities are divided into green technology R&D and green achievement transformation with obvious differences (Glückler, 2013). The green technology R&D stage is composed of green design, development, testing, and trial production, and it is a process in which enterprises, universities, and scientific research institutes use R&D resources to invest in technology innovation. Guided by green development, the process mainly carries out the R&D of new knowledge and technology and obtains intermediate outputs such as green patents. The generation of innovative knowledge is only the first step in the value-creating processes, and the real purpose is to realize final economic benefits. The green achievement transformation stage is composed of manufacturing, industrialization, product promotion, and other links, which is the process of further transforming intermediate outputs such as green patents from the first stage into commercial value, realizing energy conservation, and emission reduction. The materialization of green patents and other intellectual property rights requires human and material resources, and it is also the key stage of value creation in the GIVC. Green technological innovation activities are an interconnected process from R&D and design to final output to realize the continuous improvement of the ecological environment and commercial value.
At present, the methods for measuring efficiency mainly include stochastic frontier analysis (SFA) and data envelopment analysis (DEA). DEA can evaluate complex systems with multiple inputs and outputs without determining the index weight and unified dimension in advance. It is widely used in the evaluation of innovation efficiency. However, the early DEA model regarded the decision-making unit (DMU) as a “black box” of input and output, and it was not clear how the input of R&D resources was transformed into intermediate and final outputs. Subsequently, the DEA model was gradually optimized using various extended forms. The super-efficiency DEA model proposed by Andersen and Petersen (1993) removes the evaluated DMU from the reference set and measures the evaluated DMU efficiency according to the frontier composed of other DMUs to effectively distinguish efficiency. Färe et al. (2007) established a network DEA model to decompose the complex operation processes or stages of the DMU, to solve the impact of each link on overall efficiency; Kao (2009) constructed a relational two-stage DEA model with a constant return to scale (CRS), and the correlation between different stages is reflected by the same weight of the elements; Jiang and Guan (2008) divided the innovation activities of China’s industrial sector into independent processes of R&D innovation and the scientific and technological achievement transformation and measured the innovation efficiency by the traditional DEA model, respectively; Guan and Chen (2010) used the two-stage DEA model to measure the innovation efficiency and explore innovation efficiency determinants; Zhang B. et al. (2019) believed that there is shared R&D investment in the upstream R&D and downstream commercialization stages of the innovation processes, and the Russell network DEA model is used to calculate the innovation performance. Yu and Liu (2013) divided the realization processes of innovation value into knowledge innovation, scientific and technological innovation, and product innovation, and empirically demonstrated the spatial spillover effect of innovation efficiency in three stages. In addition, the literature divides the high-tech industrial innovation system into technology development, technology transformation, and industrialization stages and applies the extended chain network DEA model to solve each stage’s efficiency. It is an obvious trend to subdivide the innovation value chain into different research stages, which is more convenient for exploring the sub-link heterogeneity of the innovation value chain.
Normally, we can rely on internal R&D funds and personnel investment, as well as exogenous green technology spillover and diffusion to promote enterprises’ green innovation ability. Most studies explore the impact of subdimensions such as import and export trade, FDI, and OFDI on technological innovation, which is inevitably biased compared to the multidimensional conclusion of GVC embeddedness. Both developed and developing countries have become indispensable parts of the GVC and global innovation chain (GIC). However, few studies have focused on the direct impact of GVC embeddedness on the innovation value chain. As innovation activities are closely related to the value chain, this study compares the research results of the impact of GVC embeddedness on innovation value chain. Combined with the dual effects of technology spillover and “low-end locking,” the impact of the GVC participation on scientific and technological innovation showed an inverted “U” shape (Wang et al., 2014). Altenburg et al. (2008) found that the GVC position of a host country’s enterprises could affect innovation ability. When innovation activities are in line with the interests of multinational corporations in developed countries, they are strongly supported; otherwise, they are blocked. Other studies found that the domestic value chain is more helpful for China’s enterprises in realizing the driving effect of market scale on technology than GVC. Green technology innovation is not a single innovation activity of an enterprise, but a series of complete processes from green technology R&D to product production and application. However, the previous studies regarded innovation activities as a whole and have not yet explored the different stages of the innovation value chain in combination with GVC.
Relying on a literature review and the comparative analysis, we find that research involving GVC embeddedness and innovation value chain is gradually increasing, and some valuable and enlightening results have been obtained, which provides a good theoretical basis for the research hypothesis here. There remain some deficiencies in the existing research; most of them pay attention to the technological innovation system at the overall regional level, and there are relatively few studies on the industry-level GIVC. In particular, the greenness cognition of the whole chain from R&D investment, production, and manufacturing to performance output is insufficient, and the key links of green innovation require further exploration. In addition, the existing literature does not fully consider the green characteristics of the internal transformation processes of the innovation value chain; in the treatment of greenness intermediate output, ordinary patents are often applied to replace green patents. To truly reflect the GIVC’s characteristics, green invention patents and typical undesired outputs (CO2 and COD) are considered in this study.
Since the GVC position refers to whether the enterprise is in the core upstream position such as technology R&D, or the secondary position in the middle and downstream, such as simple processing and assembly, it is closely related to the value chain at the upper end of the smile curve. Therefore, this study focuses on the impact of the GVC position on two-stage GIVC, focusing on the social and environmental sustainability while examining economic effects.
Under the background of the GVC division of labor, the production factors and intermediate products of the manufacturing sector can be configured globally, which helps developing countries to import high-tech intermediate products from developed countries and obtain R&D achievements and technology spillovers (Naveed et al., 2018). The formation of international competitiveness not only comes from the amount of resource endowment but also from the ability to integrate global resources. Therefore, we conduct a theoretical analysis of the two dimensions of resource allocation and market competition.
In the dimension of resource integration: According to the resource-based view and late-developing advantage theory of technological progress, the green technology innovation of the manufacturing sector requires reliance on sufficient resources. Innovation resources include R&D innovation, direct technology introduction, and peer technology spillover. As a part of R&D expenditure closely related to environmental protection, energy conservation and emission reduction, and green product development and design, green R&D has a direct impact on enterprises’ green innovation ability and competitive advantage. Increasing investment in green R&D and innovation was the main path to realize leapfrog transformation (Yin et al., 2018), which has become an important measure for green innovation and alleviated the “low-end locking effect” of developed countries under GVC. The total amount and intensity of technological R&D investment in China’s manufacturing sector continues to grow, which lays a material foundation for improving the green technology content of products in production, distribution, exchange, consumption, and other processes as well as narrowing the green technology gap compared to developed countries. In addition to increasing the internal expenditure of direct R&D funds and the absolute amount of R&D personnel investment, China’s manufacturing sector also carries out reverse product R&D and innovation by introducing technology, purchasing technology, digestion and absorption technology, and transformation technology. The introduction of foreign technology not only can be realized through direct purchase channels but also indirectly through personnel exchange and the use of intermediate products. Coe and Helpman (1995) found that R&D investment and importing intermediate products could improve total factor productivity, and then promote the technical content of enterprises’ products. Coe et al. (1997) believed that the import of intermediate products promotes the allocation of domestic resources and improve the technical content of products by enhancing the technical learning ability of a high-end labor force.
GVC embeddedness will often accelerate the frequent cross-border flow of resource elements and the transfer and spillover of technical knowledge (Shi et al., 2021) and drive the deep participation of customers, suppliers, universities, and scientific research institutions. The network cooperation relationship is expanded from interdepartmental cooperation within the enterprise to external multi-body cooperation and even that between countries. Local enterprises embedded in the global production network can easily obtain overseas patents and realize technology spillover through supply chain networks or import trade so that enterprises can improve the imitation efficiency of technological progress and promote green growth. The GIC effectively integrates global technology, knowledge, and other innovation resources so that innovation subjects can change the pattern of resource allocation through R&D cooperation, R&D entrustment, technology import, and industry–university research cooperation, among others. In addition, convenient transportation and perfect network communication can provide better conditions for travel and communication for the flow of high-quality R&D personnel with high transfer characteristics, which is conducive to the dissemination of cutting-edge global green technology and management experience and then realize the effective transmission and full sharing of tacit knowledge among enterprises (Autant-Bernard et al., 2007). In particular, with the deepening of GVC participation in the division of labor, the trade of intermediate products was more extensive, and commodity exchange has realized the spillover of production technology and knowledge (Mendoza, 2010). Generally, enterprises that master key technologies have sufficient motivation and willingness to realize knowledge transfer and technology spillover. GVC embeddedness and GIC in China’s manufacturing sector has optimized the allocation efficiency of green R&D knowledge and innovation resources and comprehensively promoted green R&D output as well as knowledge and technology transfer.
In the dimension of market competition: The fierce market competition at home and abroad is an invisible pressure and important driving force for green R&D and innovation in China’s manufacturing sector. Peretto (2003) found that competition from abroad encourages enterprises to actively participate in R&D innovation to reduce production costs and expand market share through price competitiveness. Aghion et al. (2009) believed that when there were potential competitors in a market, the closer the technological level of the enterprise was to the global forefront, the more power it had to increase R&D investment and avoid existing competition. Specifically, the means to enhance competitiveness in the international market are as follows: first, in addition to directly promoting green technology innovation by increasing R&D investment, enterprises in developing countries will also obtain technology transfer from developed countries through patent transfer, technology licensing, and other channels, and digest, absorb, and imitate external green advanced technologies through “learning by doing” and then promote the improvement of competitive market position. Second, the leading enterprises in the value chain of developed countries often have high product quality, environmental protection standards, and green trade barriers to import and exports. This forces enterprises in developing countries to actively increase R&D investment in green production technology to cope with the strict environmental regulations of developed countries (Beladi and Oladi, 2011) and pay more attention to the improvement of enterprises’ green performance. Third, to prevent the negative impact of an enterprise’s weak competitiveness in the value chain, multinational corporations gradually improve the technical level of employees in late-developing countries through professional training, operational guidance, and technical assistance (Ivarsson and Alvstam, 2010). In short, this study argues that the competition caused by GVC embeddedness is becoming increasingly extreme. This improves the production process and green science and technology levels through R&D investment and achieves technology transfer from developed countries by employing patent transfer, technology authorization, and cross-border M&A (Acemoglu et al., 2016; Ghisetti and Quatraro, 2017). The aforementioned channels strengthen the R&D and design level of green technology and create more competitive product development projects and green patents to improve the value-added and control ability of R&D links, consolidating market power. In summary, research Hypothesis 1 is proposed.
H1: A rise in the GVC position promotes green technology R&D efficiency in China’s manufacturing sector.
In this stage, green intermediate output is transformed into final output by cooperating with internal and external R&D resources to maximize the commercial value of new products and minimize negative environmental output. This is a circular rising process from technical knowledge acquisition and absorption to innovation, which is mainly reflected in economies of scale, energy conservation, and emission reduction.
In the dimension of economies of scale: The essence of achievement transformation is the movement of knowledge flow. GVC embeddedness creates favorable conditions for accelerating knowledge sharing in the global production network, which directly affects the economic and ecological performance transforming green technology into reality. Generally speaking, integration into GVC helps broaden trade activities in overseas markets and facilitates the formation of economies of scale. Diversified and cheap imported intermediate inputs improve enterprise resource availability and marginal production cost decreases (Glass and Saggi, 2001). From the perspective of innovation cost, the scale effect can enhance the internal driving force to carry out innovation activities and reduce the marginal cost and quasi-rent (Bloom et al., 2016). Berghman et al. (2012) believed that by acquiring the knowledge, technology, and information in GVC, enterprises strengthen the technological innovation level to create differentiated and sustainable competitive advantages. Karame Akamatsu found that after technology introduction, developing country enterprises should actively absorb, transform, and diffuse technology and apply it to product development to achieve rapid performance growth and market radiation. Regarding the GVC embeddedness of China’s manufacturing sector, in addition to improving input–output efficiency by importing advanced raw materials, machinery, equipment, and other intermediate inputs (Wang et al., 2015), it also strengthens the international cooperation and exchange of green and clean technologies, uses the late-developing advantages to indirectly imitate and absorb peers’ green technologies to improve the achievements transformation efficiency and finally promotes the expansion, strength, and excellence of the manufacturing sector. GVC participation can enable the domestic manufacturing sector to use existing resource endowments to communicate and cooperate with advanced economies in the value chain and accelerate the transformation and solidification of green innovation elements (green patents, etc.) in final outputs by improving resource allocation levels.
In the dimension of energy conservation and emission reduction: In the global production network, different processes in the manufacturing sector are distributed in many countries or regions. The import and export of final products and intermediate products offer learning opportunities to participate in the professional division of labor, including face-to-face communication, knowledge transfer of leading enterprises, pressure to adopt international standards, and local labor force training by leading enterprises. By identifying the resource, energy consumption, and pollution emissions of each link, we can target high-energy consumption and high-pollution processes, increase green R&D investment, and introduce high-end cleaner production technology to achieve energy conservation and emission reduction (Cui, 2020). The optimizing of China’s export embodied energy structure is conducive to global energy conservation and emission reduction (Zhang et al., 2021). Generally, multinational corporations in developed countries implement global unified environmental standards, which naturally have a joint impact on the transformation of green achievements of upstream and downstream enterprises. To produce and supply products that meet unified environmental standards, OEM enterprises in late-developing countries make every effort to improve their technical capacity and adopt cleaner manufacturing means, to improve production efficiency and reduce pollution emission levels. With the deepening of the GVC, China’s manufacturing sector imports more high-tech complete machine products, core parts, and other intermediate products, including equipment with high clean technology content, which is conducive to rapid, short-term application of cleaner production technologies, reducing the intensity of pollution emissions and energy consumption, improving the utilization efficiency of resources and energy, and alleviating the burden of environmental costs. In addition, the green technology spillovers indirectly absorbed by China’s manufacturing sector are transmitted and diffused along the industrial chain in the link of achievement transformation, thus giving rise to the multiplier effect of technology spillovers. GVC embeddedness can not only directly affect technical level through the input of imported products but also enhance the absorption of imported technical capacity by relying on domestic enterprises’ R&D (Liu et al., 2014). The absorbed cleaner technology will also spread along the industrial chain and produce an amplification effect. It is bound to promote the efficient transformation of intermediate outputs, such as green patents and new product development projects in the manufacturing sector, to maximize the resource utilization efficiency and minimize the environmental pollution.
This study holds that the green achievement transformation stage is the “last kilometer” to realize the final output of green innovation. Deep integration into the GVC can form closer ties with upstream and downstream links, provide opportunities to learn advanced experience and obtain innovation elements, and generally promote the absorption and transformation of green technology. Accordingly, Hypotheses 2 and 3 were proposed.
H2: The rise in the GVC position also promotes the green achievement transformation efficiency in China’s manufacturing sector.
H3: The rise in the GVC position promotes the overall GIVC efficiency in China’s manufacturing sector.
The overall research framework is shown in Figure 1.
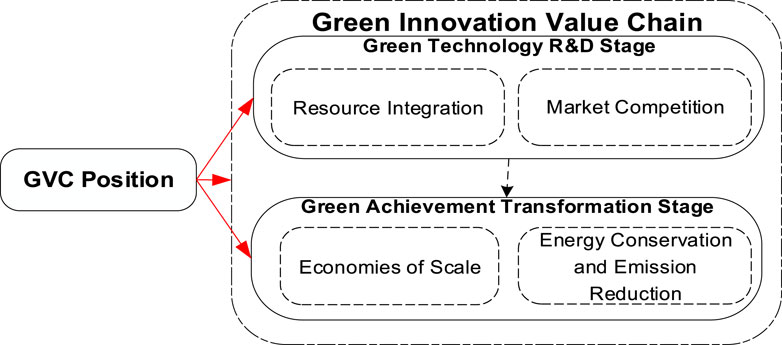
FIGURE 1. Overall research framework of this study.
To verify the research hypothesis, this study constructs an empirical model of the impact of GVC embeddedness on green technology R&D efficiency, achievement transformation efficiency, and overall GIVC efficiency in China’s manufacturing sector.
where i and t represent each manufacturing sector and year, respectively; α, β, and γ are the corresponding regression coefficients; EI, EII, and EG indicate the efficiency of the green technology R&D stage, green achievement transformation stage, and the entire GIVC, respectively; ML, IS, and ER refer to the marketization level, industrial scale, and environmental regulation, respectively; εit is the random interference term. Since the value of an individual GVCPo is less than 0, it is impossible to take the logarithm; therefore, GVCPo is added by 1 before taking the logarithm. When comparing the impact of GVC embeddedness on two-stage GIVC efficiency, the GVCPo can be replaced by the GVCPa. To reduce the influence of heteroscedasticity and time trend factors on the empirical results, the logarithm was taken for each variable.
Green technology R&D efficiency, green achievement transformation efficiency, and overall GIVC efficiency.
This study refers to the basic idea of the network DEA model (Kao, 2009; Xiao et al., 2015) and fully considers the factors such as “re-input of green intermediate products output”. The specific input–output relationship of the GIVC is shown in Figure 2.
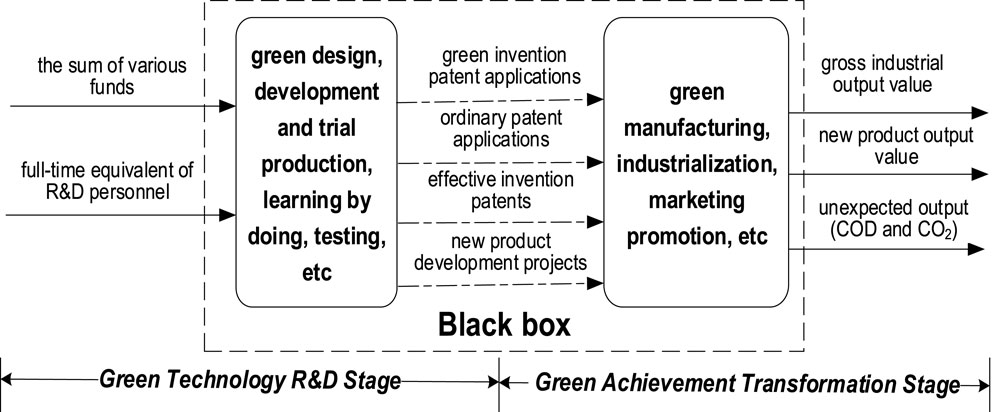
FIGURE 2. Input–output diagram of two-stage GIVC.
In the context of economic globalization, in addition to relying on independent R&D, China’s manufacturing sector also adopts development models such as introduction, digestion, absorption, and re-innovation. Therefore, considering the continuity of innovation resource investment (Xiao et al., 2012), this study takes R&D, internal expenditure of new product development, purchase of domestic technology, technology introduction, technology digestion and absorption, and technological transformation funds as the capital investments in the green technology R&D stage. Considering that R&D activities belong to knowledge production, the aforementioned various fund inputs have an important impact on output in current and future periods, and stock data can more accurately reflect the relationship between input and productivity than flow data. Therefore, the aforementioned funds are taken as the initial R&D investment resources. Taking 2005 as the base period, this study adopts the perpetual inventory method to calculate the stock of the relevant economic data and uses the R&D price index (0.75*industrial producer price index + 0.25*consumer price index) to reduce it. The stock calculation formula is as follows:
where RDt and Et represent the R&D capital stock and the discounted R&D investment in year t, respectively; δ refers to the depreciation rate; and referring to relevant research, δ is generally taken as 15%. In addition, the initial R&D capital stock can be obtained as follows:
where g represents the average annual growth rate.
As the non-technical factors of relevant audit institutions may affect patent authorization, part of the output at the R&D stage includes both the number of ordinary patent applications and the number of green patent applications. Based on patent timeliness, the number of effective invention patents is also included in the scope of patent output. It should be noted that because environment-friendly and resource-saving technologies are generally implicit in green invention patents, this study refers to the practice of Li (2017) and searches for the quantity of green invention patent applications at the industry level according to the IPC number. However, at this stage, there is no clear classification of green technology in China’s patent classification system. When collecting green patent data, this study inputs the IPC number in the network of China’s State Intellectual Property Office1 for retrieval and then checks and identifies the patent abstract in combination with the connotation of green technology and products to obtain the quantity of green invention patent applications at the industry level and takes them as an intermediate output index reflecting the greenness characteristic.
Under normal circumstances, the intermediate outputs, such as patents generated in the technology R&D stage, will not withdraw from the innovation system immediately but will continue to be redeveloped in the form of patent transactions and technology transfers to serve the subsequent achievement transformation stage. This study selects the widely used total industrial output value and the output value of new products as economic index, in which the output value of new products can improve the competitiveness or advantage with the help of innovation. Moreover, innovation activities may include some minor technological improvements and process innovations, but the sales revenue of new products cannot be reflected; the total industrial output value is regarded as one of the final outputs. Owing to the continuity and non-traceability of pollution emissions, this study regards them as the unexpected output in the achievement transformation stage according to the conventional practice. Finally, to highlight the essence of green innovation’s impact on energy conservation, environmental protection, and social benefits, this study selects the typical greenhouse gas (CO2) and COD as negative environmental outputs.
This study constructs the NSBM-S model and uses MaxDEA 8 Ultra Software to calculate the GIVC efficiency based on non-guidance and non-radial and considering unexpected output under the assumption of variable return to scale. The model can fully consider the internal correlation between technology R&D stage and achievement transformation stage, as well as the greenness characteristics of input and output. It can not only solve the problems in input–output slack and unexpected output in efficiency evaluation but also effectively measure the difference in innovation level among DMUs. In addition, the efficiency can also be directly used as the explanatory variable for empirical research. Considering the equal importance of the technology R&D stage and achievement transformation stage, the weights of the two substages are the same in the network model.
GVC position index (LNGVCPo) and GVC participation index (LNGVCPa).
At present, several methods exist to measure the GVC embeddedness index; the KPWW proposed by Koopman et al. (2010) has been widely recognized and applied in relevant research. Based on the TiVA database of the OECD-WTO, this study measures the GVC embeddedment indicators by the following method. The calculation formulae are as follows:
where IVit represents the domestic value-added of the imported country exported by industry i to the third country in year t, and FVit and Eit represent the foreign value-added and total export volume exported by industry i in year t, respectively. The higher the GVCPoit index, that is, in the export of a certain industry in China’s manufacturing sector, the higher the proportion of the domestic value-added of indirect exports, and the lower the proportion of foreign value-added, the higher the division status of GVC. The GVCPait index refers to GVC participation in the international division of labor, which is mainly reflected in the share of undertaking intermediate product processing and the proportion of intermediate product export in GVC value-added; the greater the GVCPait index, the higher the degree of integration of the industry into the GVC division of labor. Generally speaking, higher GVC position is often accompanied by deeper GVC participation, but deeper GVC participation does not mean higher GVC position. This study explores the impact of GVC position on a two-stage GIVC. To compare with the GVC position, GVC participation was also considered as one of the explanatory variables.
To eliminate the influence of uncontrollable factors on two-stage GIVC, this study refers to prior research to determine the control variables from the marketization level, industry scale, foreign direct investment, and environmental regulation.
Marketization level (LNML): There are many forms of market structure and no consistent conclusion exists regarding its impact on technological innovation. Schumpeter et al. believed that monopoly has promoted technological innovation, while Arrow (1971) showed that due to the full exchange of technology among enterprises to achieve common progress, perfect competition was more conducive to technological innovation than the market structure of monopoly. The rise of the marketization level means the improvement of market resource allocation efficiency, which will be conducive to speeding up the flow of green innovation elements and technical information. This study uses the number of enterprises in each sector to express the marketization level.
Industry scale (LNIS): Industrial scale and innovation capability have always been the focus of innovation theory research. Scale effects play an important role in promoting enterprise innovation (Martí nez-Ros and Kunapatarawong, 2019). Schumpeter believed that the innovation ability of small enterprises was generally weaker than that of large-scale enterprises, whereas other studies believed that small enterprises innovate more easily because of their flexibility. This study holds that because of the high risk of innovation, large enterprises can bear the consequences of innovation failure and have incomparable innovation advantages; the larger the scale is, the higher the innovation efficiency (Awan et al., 2021). This study uses the ratio of the total output value after adjustment to the number of enterprises corresponding to the industry category to represent the size of the industrial scale.
Foreign direct investment (LNFDI): Differences remain in whether FDI enhances the green innovation ability of China’s manufacturing sector. Some studies consider that FDI has a positive spillover effect on domestic enterprises, but it still needs to rely on independent innovation to improve the GVC position, while others believe that less FDI technology spillover and the short production capacity of local enterprises hinder the transformation and upgrading of China’s processing trade. As multinational corporations master cutting-edge science and technology, they often have technology transfer and spillover effects on the host country in optimizing the global industrial chain (Doytch and Narayan, 2016). FDI enterprises establish forward and backward links between a value chain and an industrial chain with domestic enterprises (Zhu et al., 2022), especially the vertical technology spillover effect of developed countries on developing countries. Supported by the available research (Deng et al., 2021), this study selects the assets of industrial enterprises invested in by foreign businesses from Hong Kong, Macao, and Taiwan to measure FDI in China’s manufacturing sector.
Environmental regulation (LNER): As environmental regulation optimizes the allocation of investment elements of green technology innovation, it has a diversified impact on the focus, direction, and scale of green technology innovation. Strong environmental policies significantly affect financial performance, investment decision-making, and the diffusion of green technology innovation in enterprises (Zhang D. et al., 2019). It is generally believed that increasing the intensity of environmental regulations can significantly promote intermediate trade and industrial transfers through FDI. Following usual practice, we refer to the improved entropy method (Qin et al., 2018) to measure the comprehensive index of environmental regulation intensity.
The calculation steps are as follows: First, the ratio of the operation cost of waste gas treatment facilities to the emission of SO2, the ratio of the operation cost of waste gas treatment facilities to the emission of smoke (powder) dust, the ratio of the operation cost of wastewater treatment facilities to the emission of wastewater, and the comprehensive utilization rate index of solid waste in various manufacturing industries are dimensionless treated. Second, based on the calculation of the proportion of the standardized index assignment, the entropy and variation coefficient of each pollutant index and the weight of each pollutant index are calculated. Finally, the comprehensive index of environmental regulation intensity is obtained by multiplying the proportion of the standardized index and the weight of the corresponding pollutant index.
The basic data for measuring the GVC embeddedness index of China’s manufacturing sector are collected from the TiVA database of OECD-WTO (2021 Edition), and the manufacturing sector is integrated into 14 categories according to industry classification standards (Hu et al., 2021). The search shows that D13T15 (Textiles, wearing apparel, leather, and related products), D16 (Wood and products of wood and cork), and D25 (Fabricated metal products) do not involve green patents; therefore, the actual research objects were 11 categories excluding the aforementioned three sectors. Because the total output value data of the subdivided industries are only published until 2011, the sales output value close to the total output value is selected for replacement based on the practice of relevant research. In addition, there is no detailed data on green R&D funds and green innovation personnel. Referring to Li (2017), traditional R&D personnel, R&D funds and other variables are used to replace them because ordinary technological innovation activities can effectively promote the co-increase of economic and environmental benefits. It is impossible to completely separate traditional innovators from green innovators. Considering that the transformation of resource input into output has a certain time-delay, the total time-delay is taken as 2 years; that is, the innovation output indicators are treated with 1 year lag. In turn, the R&D input, intermediate output and final output correspond to 2006–2014, 2007–2015, and 2008–2016, respectively. The above data are mainly obtained from the China Energy Statistical Yearbook, Statistical Yearbook of Scientific and Technological Activities of Industrial Enterprises, China Science and Technology Statistical Yearbook, China Environmental Statistical Yearbook and China Statistical Yearbook. To decrease the amount of missing data, the proportional calculation method and trend line method were used for the corresponding supplement.
This study integrates the yearbook data to obtain panel data of China’s manufacturing sector. Table 1 summarizes the descriptive statistics of the key variables.
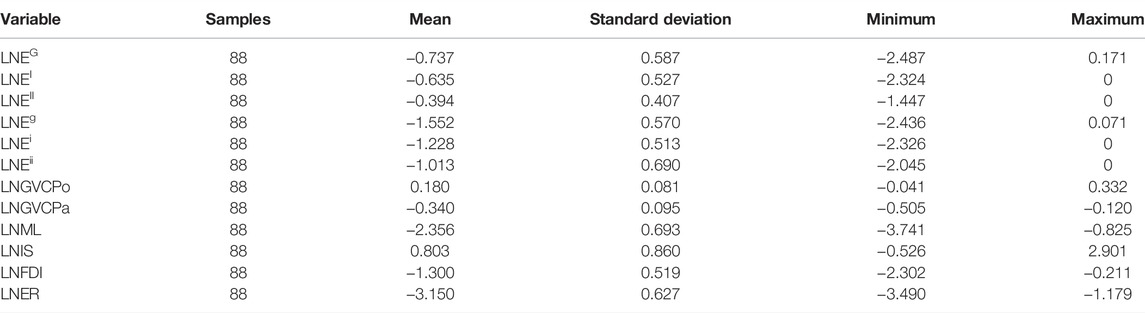
TABLE 1. Descriptive statistics of each variable.
As shown in Table 1, the observed number of variables is 88. Except for the control variable LNIS, the standard deviation of the other variables is larger than the mean, indicating some differences in various sectors during the study period.
Considering the advantages of the DEA method in solving multi-input, multi-output (including unexpected output), and multistage problems, this study selects the two-stage NSBM-S model to measure the overall GIVC efficiency, green technology R&D efficiency and green achievement transformation efficiency of 11 manufacturing sectors.
The green technology R&D stage measures whether each manufacturing sector can effectively transform R&D investment into the intermediate output of green innovation, reflecting the manufacturing sector’s utilization of innovation resources and improvement of scientific and technological R&D capability. As shown in Table 2, the top three sectors in the green R&D efficiency are D26 (Computer, electronic and optical products), D29T30 (Transport equipment), and D23 (Other non-metallic mineral products), and the mean efficiency of different industries varies greatly. During the investigation period, the mean green technology R&D efficiency for all sectors was 0.530, which is higher than the GIVC mean efficiency of 0.4784.
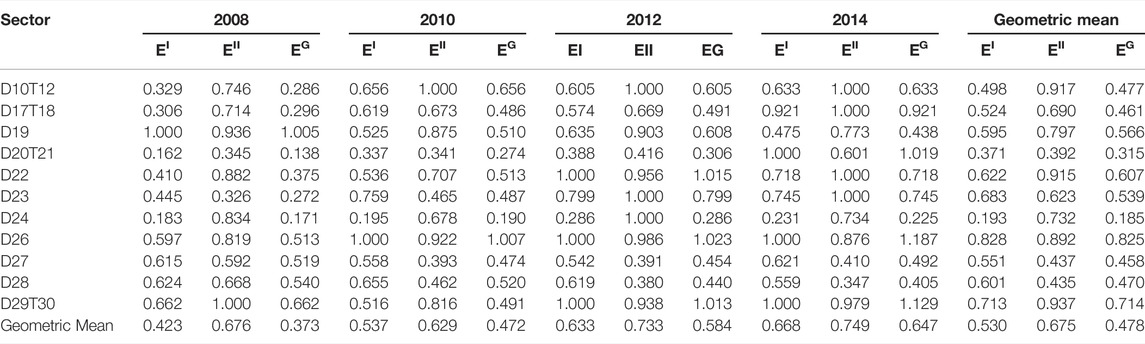
TABLE 2. Two-stage efficiency and overall GIVC efficiency.
In the green achievement transformation stage, it is important to screen whether the manufacturing sector can effectively transform the green R&D output into final economic and environmental output to reflect market value and green technology level. Eight sectors were found to have higher than the total mean efficiency, and only D27 (Electrical equipment), D28 (Machinery and equipment, nec), and D20T21 (Chemicals and pharmaceutical products) were significantly lower than the mean efficiency. During the study period, the mean efficiency in the green achievement transformation stage was 0.675, which was significantly higher than that in the green technology R&D stage and the overall GIVC.
As for the overall GIVC efficiency, it can be seen from Table 2 that there are five sectors with mean efficiency higher than that of total sectors, which may be closely related to the environment in which China pays increasing attention to the development of green innovation; among them, the top three sectors are D26, D29T30 and D22 (Rubber and plastic products), and the mean efficiency of each sector remains quite different.
In short, both overall and two-stage efficiencies are low, and there is still room for improvement. In particular, the efficiency loss in the green technology R&D stage is more obvious, which also reflects that the main body synergy among production, learning and research remain insufficient. Therefore, it is necessary to strengthen the input and management of innovation resources in the R&D process to maximize the scientific and technological output under the established input. Innovation investment is still a scarce resource; while increasing innovation investment, we must pay attention to improving the utilization rate of innovation resources.
To describe the two-stage green innovation efficiency distribution of 11 major sectors from 2006 to 2016 more intuitively, this study takes each sector’s mean efficiency and draws a four-quadrant chart (Figure 3), which subdivides all sectors into “low R&D and low transformation” sectors, “low R&D and high transformation” sectors, “high R&D and low transformation” sectors and “high R&D and high transformation” sectors.
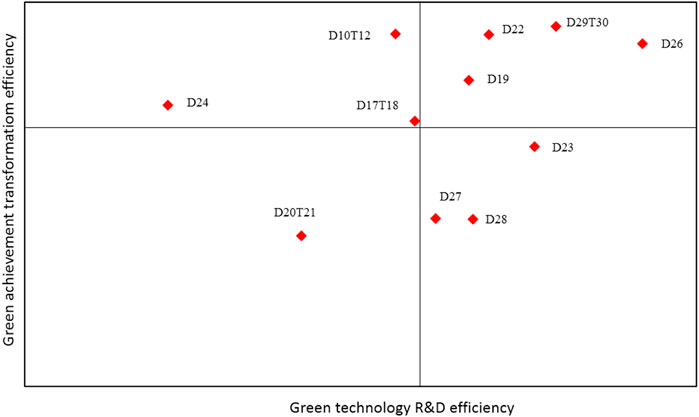
FIGURE 3. Matrix diagram of two-stage GIVC mean efficiency.
According to the matrix in Figure 3, there are four “high R&D and high transformation” sectors in the first quadrant, namely, D19 (Coke and refined petroleum products), D22, D26, and D29T30, indicating that the comprehensive green innovation level is relatively high. While maintaining their advantages, these sectors should actively play a radiation role and drive other industries towards a sustainable growth model.
In the second quadrant, the “low R&D and high transformation” sectors include D10T12 (Food products, beverages and tobacco), D17T18 (Paper products and printing), and D24 (Basic metals), which indicates that there may be a serious waste of input resources, or that the output of green invention patents applied for is relatively small. Therefore, it is necessary to improve efficiency in the green R&D stage by strengthening the protection of intellectual property rights and establishing a reasonable incentive system for R&D personnel.
In the third quadrant, only D20T21 belongs to the double barriers of “low R&D and low transformation” sectors. On the one hand, D20T21 typically features high energy consumption and high pollution, and there is great pressure and difficulty in simultaneously improving the two-stage efficiency. On the other hand, there is less green patent output in the entire GIVC, and the effect of digesting and absorbing green technology spillover is not significant. Therefore, it is necessary for D20T21 to consider introducing mature green technologies and improving the digestion and absorption capacity to promote the coordinated development of the two-stage GIVC.
In the fourth quadrant, the “high R&D and low transformation” sectors are D23, D27, and D28. The three sectors have a common bottleneck in the transformation of green achievements, and high green R&D output is not highly related to corresponding economic benefits. It is necessary to create more achievement transformation platforms and support relevant policies to promote the efficient and clean transformation of green intermediate outputs.
To eliminate the influence of heteroscedasticity and sequence autocorrelation, we need to comprehensively judge the form of the panel model using the Hausman test and F-test, and then empirically analyze the impact of the GVC position on GIVC using the panel ordinary least squares (OLS) regression method. The empirical results are presented in Table 3.
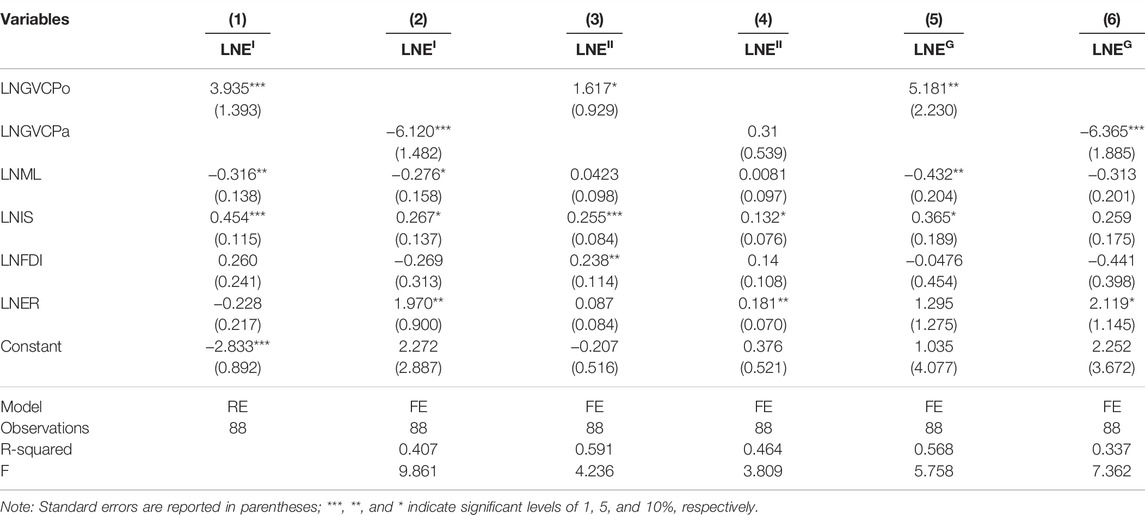
TABLE 3. Empirical results of the impact of the GVC embeddedness on the GIVC.
In Column (1) of Table 3, the impact of GVC position on green technology R&D efficiency is positive and significant. Every 1% increase in LNGVCPo promotes LNEI by 3.935%, which also verifies that the R&D link at the upper left of the smile curve is consistent with the rise in the GVC position. Therefore, China’s manufacturing sector can move forward to the middle and high ends of green R&D and drive the improvement of the overall level of green R&D efficiency. In other words, these sectors should focus on clean technologies, such as energy conservation and emission reduction, green production, and new energy, and promote backward advantageous countries or regions to reduce the resources and environment pressures from the source by employing personnel assignment, introducing foreign capital, liberalizing trade, and technical cooperation. In conclusion, Hypothesis 1 was verified.
In Column (3) of Table 3, the impact of the GVC position on green achievement transformation efficiency is positive and significant. Every 1% increase in LNGVCPo improves LNEII by 1.617%, which is significantly less than the impact on green R&D efficiency. This may be because improving the GVC position effectively promotes mutual learning among stakeholders in the innovation value chain and collaborative sharing of green innovation achievements, thus increasing business performance and improving energy conservation and emission reduction. Therefore, the condition of an open economy, requires continuing to strengthen the introduction, digestion, absorption, and re-innovation of green technology, improving the ability of green technology achievements in economic output, reducing the emission of pollutants and carbon dioxide, and guiding the transformation of the manufacturing sector’s green development mode. Thus, Hypothesis 2 was verified.
In Column (5) of Table 3, the impact of GVC position on overall GIVC efficiency is also positive and significant. In other words, every 1% increase in the LNGVCPo will improve the LNEG by 5.181%. The impact of GVC embeddedness on the overall GIVC efficiency is mainly reflected in the rise of the GVC position, which is similar to the empirical results of the phased investigation. Thus, Hypothesis 3 was also verified.
In terms of control variables, the impact of marketization level on the overall efficiency and two-stage efficiency of GIVC is not obvious or negative, which may be related to the imperfect development degree of marketization. Industrial scale promotes the overall efficiency and two-stage efficiency of the GIVC, and the impact on the green R&D stage is significantly greater than that in the green achievement transformation stage. This also proves that the scale effect promotes the improvement of enterprise marginal profit margin and the reduction of innovation marginal cost (Bloom et al., 2016) and improves the R&D power of enterprises engaged in green innovation activities. FDI significantly promotes only green achievement transformation efficiency. In addition, the positive impact of environmental regulation on GIVC is reflected only in synergy with GVC participation.
In short, the rise in the GVC position has improved the green innovation level of China’s manufacturing sector as a whole, and the impact on the green R&D stage is significantly greater than that in the green achievement transformation stage. On the one hand, the GVC embedding division of labor can learn, imitate and absorb the existing technologies of developed countries at a low cost while accepting the green technology spillovers of multinational corporations with high requirements and standards to improve the overall technology and management level. On the other hand, this may be due to the imbalance of human capital structure at this stage, the low matching degree between innovation and development requirements, and employee’ abilities, especially the lack of high-level R&D personnel and professional managers, which makes it difficult to meet the actual requirements of green technology R&D and achievement transformation for talent. Therefore, the government should pay more attention to cooperation among enterprises, universities and scientific research institutions to form an innovation community and provide appropriate policy preferences. For example, tax incentives, R&D subsidies, and patent protection can support green technology innovation. China’s manufacturing sector should make full use of the opportunity for GVC embeddedness in export trade, joint ventures and cooperation; introduce, digest, and absorb external innovation resource elements with a more inclusive attitude; especially increase the absorption and digestion capacity of green technology spillovers; promote the sharing of innovation elements and the transfer of implicit knowledge; and accelerate the pace of implementation by relying on the platform.
There is a certain degree of interaction between the GVC embeddedness and the GIVC. Since it is difficult to obtain the instrumental variables of GVC embeddedness, this study selects the lag period of the GVC position as the explanatory variable for re-estimation. The results of the model are shown in Column (7) of Table 4. On the whole, there is a positive correlation between the GVC position and the green technology R&D efficiency. Other control variables such as marketization level, industrial scale, foreign direct investment, and environmental regulation are basically consistent with the above regression results.
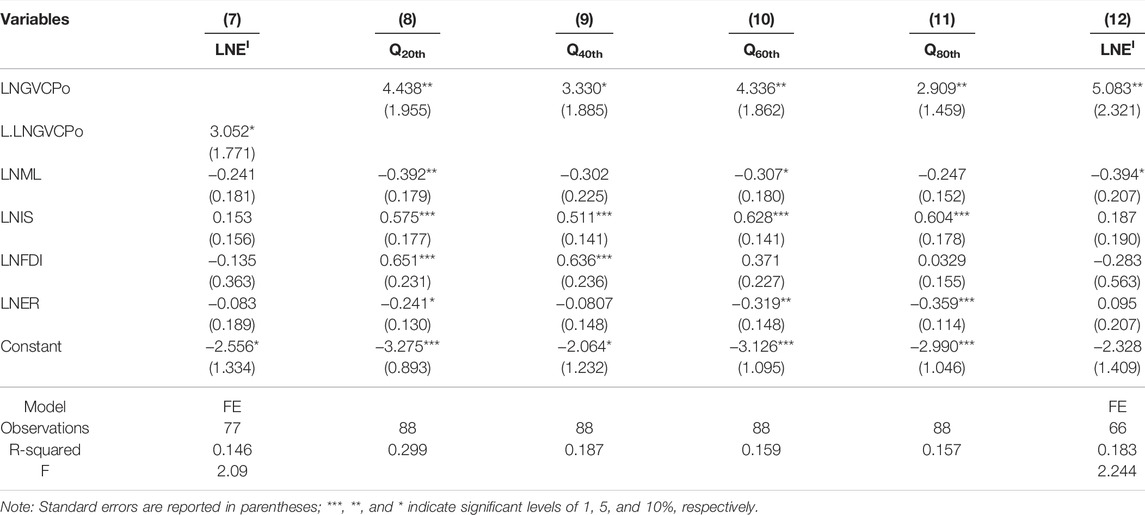
TABLE 4. Regression results of endogenous issue and robustness test.
To test the robustness of model and overcome the extreme deviation of the mean regression, the quantile regression method was used in Column (8)-(11) of Table 4.
R2 in Column (8), (9) and (10) refer to Pseudo R2.
The coefficients of LNGVCPo in all quantiles are positive and significant, showing a downward trend of waves overall, which verifies the robustness of the estimation results.
To further test the robustness of the model, we deleted the data of the first and last years during the study period for regression. According to Column (12) of Table 4, the coefficient of LNGVCPo is positive and significant, every 1% increase in LNGVCPo promotes LNEI by 5.083%, which also verifies the robustness of the basic model.
Considering the heterogeneity of the above problems and model robustness, this study conducts an in-depth discussion from the perspectives of GVC participation, general innovation value chain, the interaction between GVCPo and GVCPa.
Combined with the definition of GVC embeddedness and the theoretical analysis of the influencing mechanism, this study empirically explores the impact of GVC position on GIVC. The GVC position index and participation index are the indicators of GVC embeddedness. Therefore, it is necessary to compare and explore the effect of GVC participation on the GIVC efficiency. In Column (2) of Table 2 shows that the impact of GVC participation on green technology R&D efficiency is negative and significant. This means that for every 1% increase in LNGVCPa, LNEi decreases by 6.120%. A possible reason is that China’s manufacturing sector is still in the preliminary stage of GVC embeddedness, the absorption and transformation of foreign technology introduction and green technology spillover are insufficient, and there is a transition period for familiarization with relevant standards, process flow, and production adjustment. It is difficult to realize rapid progress in green technology in the short term.
Similarly, Column (4) of Table 2 shows that GVC participation had a positive impact on green achievement transformation efficiency, although the promotion effect was not significant. That is, for every 1% increase in LNGVCPa, LNEii increased by 0.31%. In Column (6), the impact of GVC participation on overall GIVC efficiency becomes negative and significant. For every 1% increase in LNGVCPa, the inhibitory effect on LNEg was 6.365%. The impact of the GVC position and participation on GIVC shows obvious heterogeneity, and the positive influence is still mainly reflected in the rise of the GVC position. The deepening of GVC participation had a negative or insignificant impact on GIVC. The one-sided pursuit of increasing GVC participation may lead to excessive embeddedness and “low-end locking” by multinational corporations in developed countries.
This study also measures the general innovation value chain efficiency and further analyzes the impact of GVC embeddedness on it to carry out comparative research. Compared with the measurement of GIVC efficiency, greenness indicators such as green intermediate output and unexpected output are not considered when measuring innovation value chain efficiency. The NSBM-S model was also conducted to measure general efficiency. Table 5 presents the empirical results.
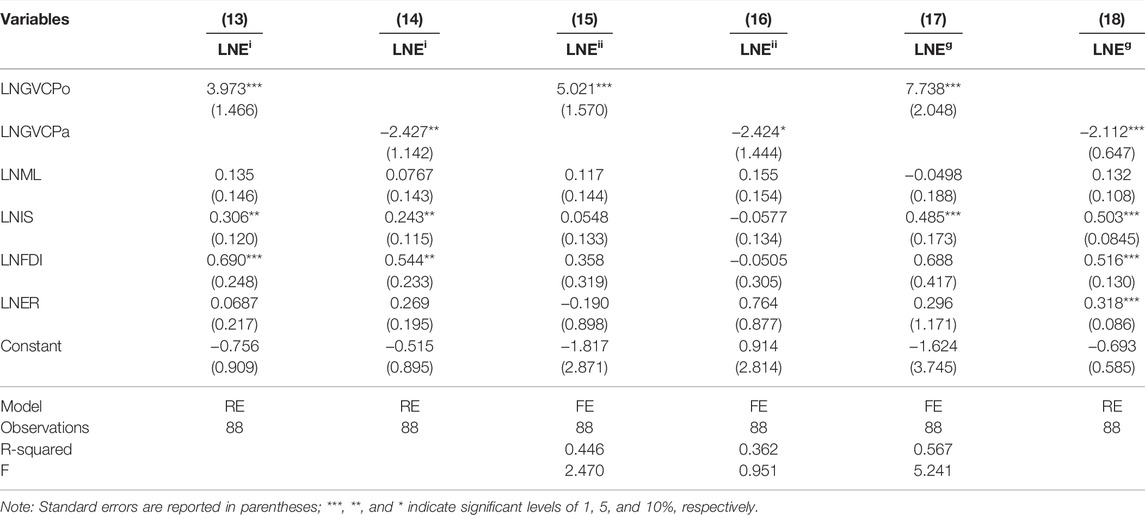
TABLE 5. Empirical results of the impact of GVC embeddedness on the general innovation value chain.
As shown in Table 5, the impact of the GVC position and participation on the overall efficiency and two-stage efficiency of the general innovation value chain have also obvious heterogeneity. The former is a positive promotion, whereas the latter is mostly negative inhibition. The influence of GVC position on the overall efficiency and two-stage GIVC efficiency is less than that of the general innovation value chain. The impact of GVC embeddedness on the overall GIVC efficiency and two-stage efficiency of the general innovation value chain is mostly inhibitory, and there is no other distinct tendency. The impact of GVC position on green technology R&D efficiency is greater than that of green achievement transformation efficiency. However, the impact of the GVC position on technology R&D efficiency is less than that of achievement transformation efficiency.
The results show that there are obvious differences in the impact of the two GVC indicators on GIVC efficiency. The direct impact of GVC position on two-stage GIVC may be indirectly affected by GVC participation at the same time. In addition, the rise in the GVC position is of great benefit to the impact of the GIVC. However, we cannot unilaterally pursue a GVC position and ignore the role of GVC participation. Considering the joint effect of these two GVC indicators, what is the effect on the GIVC efficiency? To explore the objective law of the joint effect of GVC position and participation on the efficiency of two-stage GIVC, this study uses the panel threshold model proposed by Hansen and separately selects LNGVCPo and LNGVCPa as threshold dependent variables and threshold variables to verify the threshold effect.
Based on the threshold effect test in Table 6, the impacts of LNGVCPo on green technology R&D efficiency, green achievement transformation efficiency, and overall GIVC efficiency exist for a single threshold (τ = −0.3262), double threshold (τ1 = −0.4649, τ2 = −0.3262), and single threshold (τ = −0.3262), respectively. With an increase in LNGVCPa crossing the threshold value τ, the regression coefficient of LNEi decreased from 8.671 to 5.094 in Column (19), which was significant at the 1% level. When the threshold τ1 of LNGVCPa gradually increased to the threshold τ2, the influencing coefficients of LNEii were 5.746, 4.631 and 1.484 in Column (20), respectively, showing an obvious downward trend in the inflection point. The regression coefficient is no longer significant when the second threshold exceeded. As LNGVCPa crosses the threshold τ, the effect of LNGVCPo on LNEi decreased from 10.91 to 6.332 in Column (21), which is still significant at the 1% level. In summary, with the improvement of LNGVCPa, the indirect influencing coefficient of the overall GIVC efficiency and two-stage efficiency is realized as a marginal decreasing trend. Therefore, in the processes of GVC embeddedness, China’s manufacturing sector must climb to the middle and high-end of the GVC position rather than unilaterally pursuing the deepening of GVC participation.
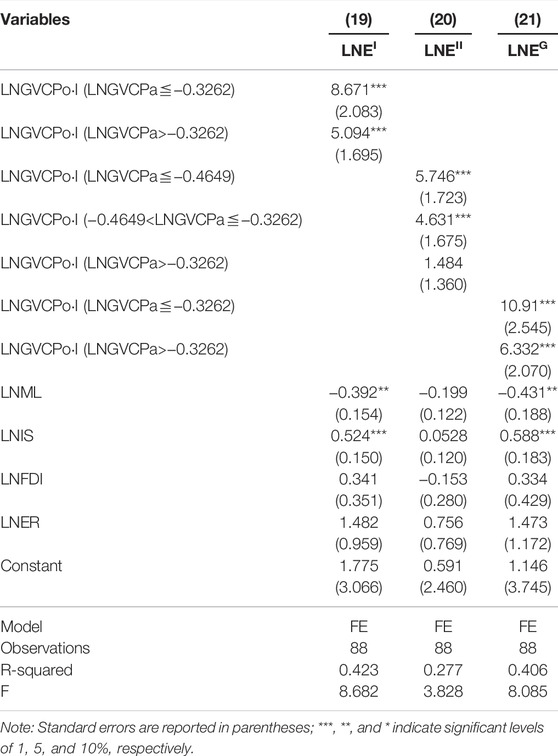
TABLE 6. Threshold effect results of the impact of the GVC position on GIVC.
This study creatively enriches the theoretical connotation of green technological innovation and the innovation value chain under the background of globalization, and also points out the direction for analyzing the weakness of green innovation and improving the processes performance. The innovative findings are as follows: Green technology R&D efficiency is less than green achievement transformation efficiency. However, the impact of the GVC position on green R&D efficiency is better than that of green achievement transformation efficiency. Without considering the greenness characteristics of the innovation processes, the effect of the GVC position on the innovation value chain will be exaggerated. GVC embeddedness has indeed promoted the GIVC of China’s manufacturing sector. The above conclusions optimize the allocation level of green innovation resources and provide theoretical foundation for government departments to formulate green innovation countermeasures. Therefore, in the development and transformation from “factor-driven” to “innovation-driven”, the following suggestions are proposed.
1) Integrating and broadening innovation resources at home and abroad to create new momentum for transforming and upgrading GIVC. China’s manufacturing sector should increase R&D capital investment in green technology innovation, focus on core areas and links—such as clean energy, material savings, environmental protection, and green production—and further highlight the targeted value of green technology R&D. Furthermore, actively promoting the facilitation of cross-border innovation and R&D capital flow is a pressing, fully learning from the green development model of first-mover advantage countries; introducing, digesting and absorbing green technology spillovers; and promoting the collaborative sharing of green innovation elements and tacit knowledge. Finally, the manufacturing sector needs to break through the boundary of external cooperation and broaden the depth and breadth of collaborative research on green technology with universities and scientific research institutions. Meanwhile, the manufacturing sector should optimize the allocation of green innovation resources in broader areas upstream and downstream of the industrial chain, and guide the coordinated development of technology R&D and achievement transformation.
2) Creating a multi-pronged software and hardware platform to support the green technology R&D and the achievement transformation. First, it is very important to strengthen the protection and utilization awareness of intellectual property; pay attention to the market value evaluation and patent transfer activities of green technology; and encourage the manufacturing sector to fully use the intellectual property strategy to realize the mining and sustainable innovation of green technology. Second, the government may establish green technological incubators and matching commercialization platforms, promote the construction of green technology trading centers, accelerate the application and promotion of advanced and mature green technology achievements, and improve the scientific and technological transformation efficiency. Third, the government should provide policy incentives for key green innovation enterprises through credit concessions, taxes, financial subsidies, and other channels, further establishing and improving the operation mechanism linked to risk sharing and income distribution, effectively protecting the interests of all partners, and gradually building a market-oriented green innovation system.
The original contributions presented in the study are included in the article/Supplementary Material; further inquiries can be directed to the corresponding author.
DH: methodology and writing—original draft. JJ: funding acquisition and formal analysis. CC: conceptualization and data curation. RX: methodology and visualization. YT: writing—review and editing.
This work is supported by the National Natural Science Foundation of China (71972064, 71871082, 71573069) and Special Basic Cooperative Research Programs of Yunnan Provincial Undergraduate Universities Association, China (2017FH001-072).
The authors declare that the research was conducted in the absence of any commercial or financial relationships that could be construed as a potential conflict of interest.
All claims expressed in this article are solely those of the authors and do not necessarily represent those of their affiliated organizations, or those of the publisher, the editors, and the reviewers. Any product that may be evaluated in this article, or claim that may be made by its manufacturer, is not guaranteed or endorsed by the publisher.
Acemoglu, D., Moscona, J., and Robinson, J. A. (2016). State Capacity and American Technology: Evidence from the Nineteenth Century. Am. Econ. Rev. 106, 61–67. doi:10.1257/aer.p20161071
Aghion, P., Blundell, R., Griffith, R., Howitt, P., and Prantl, S. (2009). The Effects of Entry on Incumbent Innovation and Productivity. Rev. Econ. Statistics 91, 20–32. doi:10.1162/rest.91.1.20
Altenburg, T., Schmitz, H., and Stamm, A. (2008). Breakthrough? China's and India's Transition from Production to Innovation. World Dev. 36, 325–344. doi:10.1016/j.worlddev.2007.06.011
Andersen, P., and Petersen, N. C. (1993). A Procedure for Ranking Efficient Units in Data Envelopment Analysis. Manag. Sci. 39, 1261–1264. doi:10.1287/mnsc.39.10.1261
Arrow, K. J. (1971). “The Economic Implications of Learning by Doing,” in Readings in the Theory of Growth (Springer), 131–149. doi:10.1007/978-1-349-15430-2_11
Autant‐Bernard, C., Billand, P., Frachisse, D., and Massard, N. (2007). Social Distance versus Spatial Distance in R&D Cooperation: Empirical Evidence from European Collaboration Choices in Micro and Nanotechnologies. Pap. Regional Sci. 86, 495–519. doi:10.1111/j.1435-5957.2007.00132.x
Awan, U., Arnold, M. G., and Gölgeci, I. (2021). Enhancing Green Product and Process Innovation: Towards an Integrative Framework of Knowledge Acquisition and Environmental Investment. Bus. Strat. Env. 30, 1283–1295. doi:10.1002/bse.2684
Beladi, H., and Oladi, R. (2011). Does Trade Liberalization Increase Global Pollution? Resour. Energy Econ. 33, 172–178. doi:10.1016/j.reseneeco.2010.04.009
Berghman, L., Matthyssens, P., and Vandenbempt, K. (2012). Value Innovation, Deliberate Learning Mechanisms and Information from Supply Chain Partners. Ind. Mark. Manag. 41, 27–39. doi:10.1016/j.indmarman.2011.11.014
Bloom, N., Draca, M., and Van Reenen, J. (2016). Trade Induced Technical Change? the Impact of Chinese Imports on Innovation, IT and Productivity. Rev. Econ. Stud. 83, 87–117. doi:10.1093/restud/rdv039
Coe, D. T., Helpman, E., and Hoffmaister, A. W. (1997). North-south R & D Spillovers. Econ. J. 107, 134–149. doi:10.1111/1468-0297.00146
Coe, D. T., and Helpman, E. (1995). International R&D Spillovers. Eur. Econ. Rev. 39, 859–887. doi:10.1016/0014-2921(94)00100-E
Cui, X. (2020). Impact of Embedded Global Value Chain on China's Green Development. China; Huaqiao University. doi:10.27155/d.cnki.ghqiu.2020.000139
Deng, Y. J., Wang, Y. D., and Qin, Y. (2021). The Impact of FDI on Ambidextrous Innovation in China’s Manufacturing Industry--The Moderation Effect of the Level of Industry Marketization and the Speed of FDI. Soft Sci. 35, 13–18. (In Chinese). doi:10.13956/j.ss.1001-8409.2021.11.03
Doytch, N., and Narayan, S. (2016). Does FDI Influence Renewable Energy Consumption? an Analysis of Sectoral FDI Impact on Renewable and Non-renewable Industrial Energy Consumption. Energy Econ. 54, 291–301. doi:10.1016/j.eneco.2015.12.010
Färe, R., Grosskopf, S., and Whittaker, G. (2007). Network DEA. Modeling Data Irregularities and Structural Complexities in Data Envelopment Analysis. Springer.
Ghisetti, C., and Quatraro, F. (2017). Green Technologies and Environmental Productivity: A Cross-Sectoral Analysis of Direct and Indirect Effects in Italian Regions. Ecol. Econ. 132, 1–13. doi:10.1016/j.ecolecon.2016.10.003
Glass, A. J., and Saggi, K. (2001). Innovation and Wage Effects of International Outsourcing. Eur. Econ. Rev. 45, 67–86. doi:10.1016/S0014-2921(99)00011-2
Glückler, J. (2013). Knowledge, Networks and Space: Connectivity and the Problem of Non-interactive Learning. Reg. Stud. 47, 880–894. doi:10.1080/00343404.2013.779659
Guan, J., and Chen, K. (2010). Measuring the Innovation Production Process: A Cross-Region Empirical Study of China's High-Tech Innovations. Technovation 30, 348–358. doi:10.1016/j.technovation.2010.02.001
Guan, J. C., and Yu, J. (2005). National Innovation Capacity Measurement Based on DEA. R&D Manag. 3, 8–15. (In Chinese).
Guiding opinions of the State Council (2021). Guiding Opinions of the State Council on Accelerating the Establishment and Improvement of a Green, Low-Carbon and Circular Economic Development System. Available: http://www.gov.cn/zhengce/content/2021-02/22/content_5588274.htm.
Hu, D., Jiao, J., Tang, Y., Han, X., and Sun, H. (2021). The Effect of Global Value Chain Position on Green Technology Innovation Efficiency: From the Perspective of Environmental Regulation. Ecol. Indic. 121, 107195. doi:10.1016/j.ecolind.2020.107195
Hu, D., Jiao, J., Tang, Y., Xu, Y., and Zha, J. (2022). How Global Value Chain Participation Affects Green Technology Innovation Processes: A Moderated Mediation Model. Technol. Soc. 68, 101916. doi:10.1016/j.techsoc.2022.101916
Ivarsson, I., and Alvstam, C. G. (2010). Supplier Upgrading in the Home-furnishing Value Chain: An Empirical Study of IKEA's Sourcing in China and South East Asia. World Dev. 38, 1575–1587. doi:10.1016/j.worlddev.2010.04.007
Jiang, J., and Guan, J. (2008). Analysis of Relative Efficiency to Chinese Low-And Medium-Technology Sectors. Stud. Sci. Sci. 26, 1325–1332. (In Chinese). doi:10.16192/j.cnki.1003-2053.2008.06.018
Kao, C. (2009). Efficiency Decomposition in Network Data Envelopment Analysis: A Relational Model. Eur. J. Operational Res. 192, 949–962. doi:10.1016/j.ejor.2007.10.008
Koopman, R., Powers, W., Wang, Z., and Wei, S.-J. (2010). Give Credit where Credit Is Due: Tracing Value Added in Global Production Chains”. Massachusetts: NBER Working Paper.
Li, K. (2019). 2019 Work Report of the Chinese Government. Available: http://www.gov.cn/guowuyuan/2019zfgzbg.htm.
Li, W. (2017). Spatial-temporal Evolution and Factors of Industrial Green Technological Innovation Output in China's Provinces: An Empirical Study of 30 Provinces' Data. J. Industrial Engineering/Engineering Manag. 31, 9–19. (In Chinese). doi:10.13587/j.cnki.jieem.2017.02.002
Liu, W., Li, L., and Liu, Y. (2014). The Impact of Global Value Chain Embeddedness on Technological Sophistication of China’s Export. China Ind. Econ. 6, 83–95. (In Chinese). doi:10.19581/j.cnki.ciejournal.2014.06.008
Martínez-Ros, E., and Kunapatarawong, R. (2019). Green Innovation and Knowledge: The Role of Size. Bus. Strategy Environ. 28, 1045–1059.
Mendoza, R. U. (2010). Trade‐induced Learning and Industrial Catch-Up. Econ. J. 120, 313–350. doi:10.1111/j.1468-0297.2010.02379.x
Naveed, K., Watanabe, C., and Neittaanmäki, P. (2018). The Transformative Direction of Innovation toward an IoT-Based Society - Increasing Dependency on Uncaptured GDP in Global ICT Firms. Technol. Soc. 53, 23–46. doi:10.1016/j.techsoc.2017.11.003
Peretto, P. F. (2003). Endogenous Market Structure and the Growth and Welfare Effects of Economic Integration. J. Int. Econ. 60, 177–201. doi:10.1016/s0022-1996(02)00025-9
Qin, N., Liu, L., and Sun, Z. (2018). Impact of Environmental Regulation on Employment: Based on the Perspective of China's Industry Heterogeneity. Econ. Rev., 106–119. (In Chinese). doi:10.19361/j.er.2018.01.06
Shi, D., Chen, Z., Marzena, H.-S., Abdul Razaque, L., and Muhammad Zahid, R. (2021). The Role of the Global Value Chain in Improving Trade and the Sustainable Competitive Advantage: Evidence from China’s Manufacturing Industry. Front. Environ. Sci., 779295. doi:10.3389/fenvs.2021.779295
Wang, Y., Lin, H., and Lu, C. (2014). The Effect of Global Value Chain Embeddedness on Technical Progress–An Empirical Study on Panel Data of China’s Industries. China Ind. Econ. 9, 65–77. (In Chinese). doi:10.19581/j.cnki.ciejournal.2014.09.005
Wang, Y., Wang, J., and Yan, J. (2015). The Double Effect of Global Value Chain Embeddedness on Energy Conservation and Emission Reduction--An Empirical Study on Panel Data of China’s Industries. China Soft Sci. 08, 148–162. (In Chinese).
Xiao, R., Qian, L., and Chen, Z. (2012). Research on the Innovation Efficiency and its Affecting Factors in China's High-Tech Industries. J. Manag. Sci. 25, 85–98. (In Chinese).
Xiao, R., Wang, Z., and Qian, L. (2015). Research on Chinese Enterprise’s Technology Innovation Efficiency and its Influencing Factors in Different Property Based on the Angle of Value Chain in the Two Stages. J. Industrial Engineering/Engineering Manag. 29, 190–201. (In Chinese). doi:10.13587/j.cnki.jieem.2015.02.021
Yin, B., Xiao, W., and Liu, Y. (2018). Green R&D Investment and "made in China" Climb in the Global Value Chain. Stud. Sci. Sci. 36, 1395–1403+1504. (In Chinese). doi:10.16192/j.cnki.1003-2053.2018.08.007
Yu, L. (2019). Made in China 2025” China’s Development Strategy through Technological Innovation. Portugal; Universidade de Lisboa.
Yu, Y., and Liu, D. (2013). The Effect of the Space Outflow of China's Regional Innovation and the Effect of the Outflow of Value Chains: A Study, from the Perspective of the Innovative Value Chain, on the Model of the Panel of Multi-Dimentsional Space. Manag. World, 6–20+70+187. (In Chinese). doi:10.3969/j.issn.1672-0334.2014.02.003
Zhang, B., Bai, S., and Ning, Y. (2021). Embodied Energy in Export Flows along Global Value Chain: A Case Study of China's Export Trade. Front. Energy Res. 9, 118220. doi:10.3389/fenrg.2021.649163
Zhang, B., Luo, Y., and Chiu, Y.-H. (2019a). Efficiency Evaluation of China's High-Tech Industry with a Multi-Activity Network Data Envelopment Analysis Approach. Socio-Economic Plan. Sci. 66, 2–9. doi:10.1016/j.seps.2018.07.013
Zhang, D., Du, P., and Chen, Y. (2019b). Can Designed Financial Systems Drive Out Highly Polluting Firms? an Evaluation of an Experimental Economic Policy. Finance Res. Lett., 218–224. doi:10.1016/j08.032
Keywords: China’s manufacturing sector, global value chain embeddedness, GVC position, green innovation value chain, super-efficiency network SBM-DEA model
Citation: Hu D, Jiao J, Chen C, Xiao R and Tang Y (2022) Does Global Value Chain Embeddedness Matter for the Green Innovation Value Chain?. Front. Environ. Sci. 10:779617. doi: 10.3389/fenvs.2022.779617
Received: 19 September 2021; Accepted: 16 May 2022;
Published: 28 June 2022.
Edited by:
Faik Bilgili, Erciyes University, TurkeyReviewed by:
Bo Chen, Central University of Finance and Economics, ChinaCopyright © 2022 Hu, Jiao, Chen, Xiao and Tang. This is an open-access article distributed under the terms of the Creative Commons Attribution License (CC BY). The use, distribution or reproduction in other forums is permitted, provided the original author(s) and the copyright owner(s) are credited and that the original publication in this journal is cited, in accordance with accepted academic practice. No use, distribution or reproduction is permitted which does not comply with these terms.
*Correspondence: Yunshu Tang, eXN0YW5nQGhmdXQuZWR1LmNu
Disclaimer: All claims expressed in this article are solely those of the authors and do not necessarily represent those of their affiliated organizations, or those of the publisher, the editors and the reviewers. Any product that may be evaluated in this article or claim that may be made by its manufacturer is not guaranteed or endorsed by the publisher.
Research integrity at Frontiers
Learn more about the work of our research integrity team to safeguard the quality of each article we publish.