- 1College of Agriculture, Henan University of Science and Technology, Luoyang, China
- 2College of Natural Resources and Environment, Northwest A&F University, Yangling, China
Dissolved organic matter (DOM) has a critical impact on various processes in the ecological environment, especially in soil and surface water due to its mobility and reactivity. In the present study, a column experiment simulating a paddy field was conducted to evaluate the feasible application of inorganic fertilizer incorporated with three types of organic materials (wheat straw, rapeseed shell, and astragalus smicus). Researchers investigated the vertical distinctions of soil (combined with different organic materials in 0–10 cm) DOM in 0–40 cm profiles after long-term leaching. Excitation–emission matrices coupled with parallel factor analyses (EEM-PARAFAC) and UV-visible techniques were employed to diagnose the spectral characteristics of soil DOM at four depths in different treatments, qualitatively and quantitatively. The results showed that the DOM content of CF (conventional fertilizer) (0.14 g kg−1) was the highest at the 10–20 cm layer and the CK (no fertilizer) (0.05 g kg−1) at 30–40 cm was the lowest, and the mean DOC concentration decreased with the increase in soil depth. Four fluorescent components, protein and tryptophan-like, humic acid-like, fulvic acid-like, and solubility-like microbial metabolite product materials, were identified by the PARAFAC model. Relative distributions of calculated components suggested that DOM mainly contained more aromatic humic materials and litter fulvic acid with the increase in soil depth. However, the SUVA254 showed a maximum in 20–30 cm layers, indicating strong aromatic and abundant hydrophobic fractions. Fluorescent index (FI) values of soil DOM from various treatments have a similar terrestrial and allochthonous source in topsoil and microbial source in deeper soil. In short, the findings obtained in our work could commendably provide some valuable optical information of DOM released from soil column and offer technical guidance when applying organic or green fertilizer to paddy soil during rice production.
Introduction
Dissolved organic matter (DOM) is the most mobile fraction of organic matter in soil, which can contribute substantially to nutrient cycling and carbon distributions within the ecosystem (Chantigny, 2003; Bolan et al., 2011). Although DOM accounts for a small quantity of soil organic matter (SOM), it plays an indispensable role in the processes of soil carbon cycle and microbial metabolism and soil pollutant transport and migration (Ogawa and Tanoue, 2003; Gao et al., 2018). Previous studies mainly focused on the degradation and migration of DOM in natural waters and sewage treatment process, but information on its spectral characteristics in soils is still scarce. DOM is considered to be sensitive to land use and agricultural managements. Returning crop residues to soil is a popular pathway at present, which subsequently input a large amount of DOM into agricultural land. Therefore, to a certain degree, understanding of DOM released by soil incorporated with crop straw is particularly important for further study on its environmental implication.
DOM dynamics and characteristics in an agro-ecosystem were susceptible to anthropogenic processes such as input of organic or inorganic fertilizer, cultivation practices, soil temperature, and moisture (Chantigny, 2003; Gao et al., 2017); however, DOM fluorescent variations in soil profile have rarely been reported. A previous study revealed that DOM varied in 0–30 cm soil depth under different cropping and cultivation intensities in North America (Romero et al., 2017). Large recalcitrant carbon exists in sub-soil and exerts a critical effect on the global carbon cycle. Organic carbon (OC) stability in deeper soil layers is determined by the physical protection of soil aggregates and also regulated by spatial distribution of OC, microorganisms, and enzymes (Rumpel and Kogel-Knabner, 2011). Several investigations have shown that DOM pool storage significantly decreases with increasing soil depth (Kalbitz et al., 2000). Early researchers have concluded that the content of DOM released from agricultural soils was strongly affected by drying and rewetting processes, whereas dissolved organic carbon (DOC) concentrations in fresh soils were mainly determined by biological processes (De Troyer et al., 2014). The latest studies have also verified that DOM in sub-soil is more likely to be enriched by microbial-like precursors and deprived of organic materials than topsoil DOM (Hassouna et al., 2010; Romero et al., 2017).
Recently, spectral techniques such as ultraviolet-visible (UV-Vis) and three-dimensional excitation–emission matrices (3D-EEMs) were employed to probe DOM physicochemical characteristics (Gao et al., 2017; Zhang et al., 2017). As a fast, non-destructive analytical approach, EEMs were used to distinguish the probable source and nature of DOM in an aquatic or terrestrial environment (Coble, 1996; Zhang et al., 2011). Combined with multivariate parallel factor (PARAFAC) model analysis, EEM-PARAFAC is adopted to determine and identify DOM fluorescent components effectively in the ecological environment (Uchimiya et al., 2016; Wei et al., 2016). Yet, compositional variations of DOM in sub-soil amended by reduced fertilization with organic materials after a process of drying and wetting cycle are not elucidated and poorly understood.
The objective of this simulation test was to study the variations of DOM in different soil layers and identify soil DOM spectral distinctions when using UV-visible and EEM-PARAFAC modeling, quantitatively and qualitatively. Specifically, we aimed to (1) characterize DOM concentration of soil amended with fertilizer and organic materials at various depths; (2) quantify UV-visible and fluorescent compounds of the four layers of soil DOM in different treatments; and (3) identify DOM fluorescent components by the EEM-PARAFAC technique.
We hypothesized that organic material amendments would increase soil DOM content, and lead to greater compositional changes of DOM compounds after long-term leaching.
Materials and Methods
Soil Column Experiment
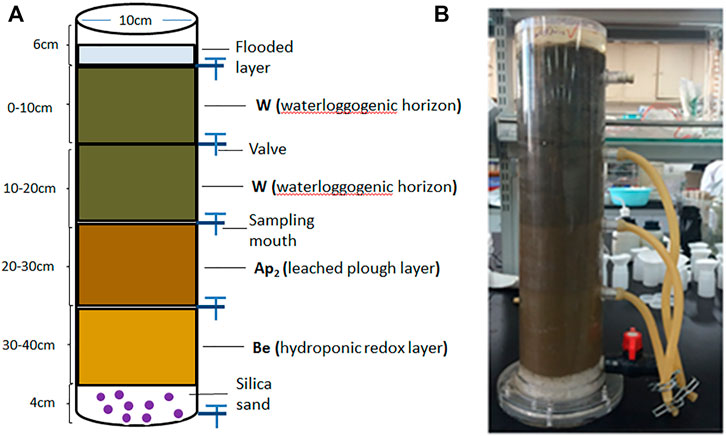
Soil used in this study was collected on September 25, 2017, from a test site located in Xinji County, Hanzhong City (33°0′16″N, 108°48′44″E) after rice harvest. Wheat straw, rapeseed shell, and astragalus smicus were simultaneously sampled in the local field. To simulate organic material amendments in flooded paddy soil, a series of soil column experiments were conducted in Yangling District, Shaanxi Province, China (34°15′N, 108°34′E). Approximately 1 kg of air-dried soil was placed in a soil column after every 10 cm (Figure 1), and the 0–10 cm layer was mixed with different exogenous materials (sieved 1 mm) at the same fertilizer level (i.e., CK: control treatment without organic material and fertilizer; CF: conventional fertilizer applied; RF: reduced 20% fertilizer compared with CF; RFWS: wheat straw combined with RF; RFRS: rapeseed shell combined with RF; RFAS: astragalus smicus combined with RF). The dosages of the three materials were converted by the amount applied in the local paddy field (wheat straw: 5 t hm−2, rapeseed shell: 3 t hm−2, astragalus smicus: 3 t hm−2), i.e., wheat straw: 3.93 g/column, rapeseed shell: 2.36 g/column, and astragalus smicus: 2.36 g/column. Then, 1,350 ml of deionized water was added to saturate the dried soil in the column. Deionized water was added to keep the surface water volume at 300 ml (about 3 cm height in column) throughout the whole experiment. Meanwhile, the leachates of different layers (10, 20, 30, and 40 cm) were sampled at various times. After leaching, the fluorescent characteristics of soil DOM were detected by UV-Vis EEM-PARAFAC modeling. The chemical properties of soil in the four layers are presented in Table 1. The total carbon of WS, RS, and AS was 39.6%, 40.0%, and 41.1%, respectively. Additionally, a Fourier transform infrared spectrometer (FTIR, Eensou27, Germany) was employed to identify the characteristics of WS, RS, and AS, and the relevant information is shown in Supplementary Figure S1.

TABLE 1. Basic characteristics of the profile (0–40 cm) soils filled in column in the present study.
Analytical Methods
Soil Sample Preparation
According to the fertility characteristics of rice in the paddy field, the whole leaching time was determined to be 85 days. The days for wetting and drying were 50 and 35 days, respectively. After 85 days of drying, wetting, and column leaching, soils at different depths (0–10, 10–20, 20–30, and 30–40 cm) were hierarchically collected, and then air-dried and sieved (through 100-mesh sieves) for further use.
Soil Water-Extractable DOM
The solutions for fluorescence and UV-Vis spectrum analysis to determine the soil DOM chemical structure were extracted by deionized water with a 1:6 w/v ratio of water and sieved soil. The mixture was then centrifuged (4,000 rpm) at room temperature for 20 min after shaking on a mechanical platform shaker at 180 rpm in the dark for 24 h. Then, the tubes were placed horizontally on a mechanical platform shaker (180 rpm) in the dark for 2 h. The suspensions were centrifuged at 10,000 rpm for 10 min. Finally, the obtained supernatants were filtered through 0.45-mm microfiber filters (Millipore) and maintained in the dark at 4°C for further DOM analysis. Soil samples were repeated four times in the DOM analysis.
UV-Vis and Fluorescence Spectrum Analysis
The quantities of samples’ DOM were represented by DOC concentrations, which were measured with a total organic carbon (TOC) analyzer (Shimadzu Inc., TOC-VCHP, Japan). A UV-Vis spectrophotometer (UV Probe-1780, Shimazdu, Japan) was utilized to determine the absorbance values of water-extractable DOM, and deionized water was used to prepare a baseline at wavelengths of 400–250 nm (Gao et al., 2017).
For the fluorescence intensity measurement, a three-dimensional excitation–emission matrix (3D-EEM) was studied by employing a fluorescence spectrophotometer (F97 Pro, Lengguang Tech., China), scanning at excitation wavelengths ranging from 200 to 500 nm and emission wavelengths from 250 to 550 nm, with an increment of 5 nm. The scanning speed was set at 6,000 nm min−1. A blank solution (deionized water) was taken into consideration to obtain emission spectra solely from DOM samples by subtracting the blank signals from the measured fluorescence. In the case of the UV absorbance coefficient at 254 nm over 0.05, the DOM solution samples should be diluted prior to fluorescence determination to prevent inner-filter collection (Hur et al., 2008). Definition and significance of the DOM optical indices and parameters used in this study are showed in Table 2.

TABLE 2. Definition and significance of the DOM optical indices and parameters used in the present study.
PARAFAC modeling was operated through MATLAB 7.0 (Mathworks, Natick, MA, United States) coupled with the DOM Fluor Toolbox following the recommendation of Stedmon and Bro (2008). In this study, 192 soil DOM samples were prepared to obtain EEM spectra, which were utilized for PARAFAC modeling calculations. The relative concentration of each component was calculated from Eq. 1:
Where Xijk is the fluorescent index (FI) intensity for the ith sample at jth emission and kth excitation wavelength; εijk is the residual matrix, representing the signals that cannot be interpreted; F is the component number, indicating the independent fluorescent components with actual contributions; aif, bjf, and ckf are the element of loading matrix A, B, and C, describing the fluorescent component concentration, emission, and excitation spectrum, respectively.
Statistical Analysis
The raw data were addressed using Excel 2010 (Microsoft Excel 2010; O’Reilly, Microsoft United States). All figures in this work were drawn with Origin 9.0 (Origin 2015; United States). Data were processed statistically with analysis of variance (ANOVA) and Duncan’s multiple range tests for significant differences between treatments at p < 0.05. All data analysis was conducted using the SPSS 20.0 (SPSS Inc., Chicago, United States) software package.
Results and Discussion
Quantity of Soil DOM Vertically
As a proxy of SOC (Borisover et al., 2012), soil DOM content was universally represented by DOC concentrations, which can reflect soil soluble organic C bioavailability (Marschner and Kalbitz, 2003). The content of DOC extracted from soil in the four layers (0–10, 10–20, 20–30, and 30–40 cm) is shown in Figure 1. The water-extractable DOM in soils varied significantly, ranging from 0.05 to 0.14 g kg−1. Mean DOC concentration at different soil depths showed a range of 0.07–0.12 g kg−1, and displayed a decreasing tendency with the increase in soil depth (Figure 2). Among the four soil layers, mean DOC content in soil 30–40 cm (0.07 g kg−1) was significantly lower than that in 0–30 cm (p < 0.05), which was generally consistent with the results of a previous study (Romero et al., 2017). However, no significant differences were noted in DOM content between 0–10 cm (0.12 g kg−1) and 10–20 cm (0.11 g kg−1) (p > 0.05). It is possible that there is a slight difference in DOM between the 0–10 cm and 10–20 cm layer, with similar agricultural management before the leaching test. For the topsoil (0–10 cm), the content of DOM derived from soil amended with different fertilizers and organic materials has significant variation. The additional organic matter of WS, RS, and AS, composed of carbonyl, carboxyl group, and other C–C bonds, may induce the excess DOM release (Supplementary Figure S1). Abundant organic matter accumulated in the topsoil, and plant litter, roots, and other decaying materials were decomposed by microorganisms. DOC concentration of RFWS treatment was the highest (0.13 g kg−1), while the lowest soil DOC occurred in CF treatment (0.098 g kg−1) (p < 0.05), which may be ascribed to the enhancement of exogenous WS. In the second soil layer (10–20 cm), soil DOM content in CF treatment was higher than those in others (p < 0.01), which may be combined with the DOM accumulation from the topsoil during leaching (Wang et al., 2015). However, the minimum DOM content occurred in RFRS treatment, suggesting a less DOM lixiviation from the 0–10 cm soil.
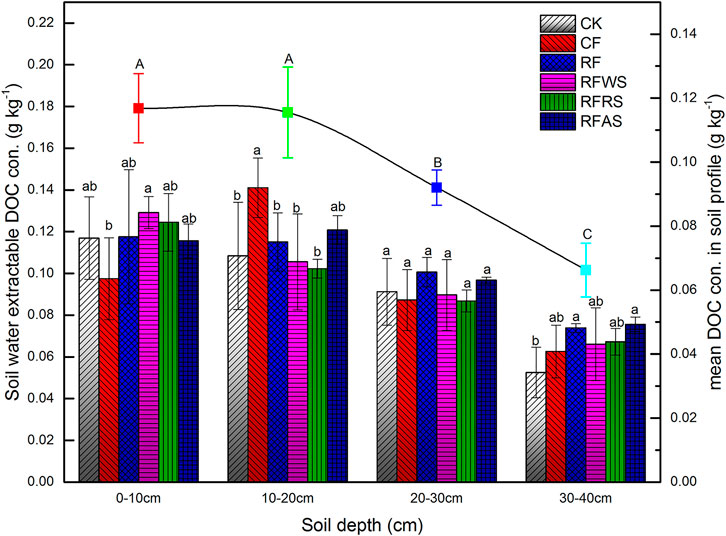
FIGURE 2. Content of DOM (represented by DOC concentration) from soils sampled after leaching test. Different color bars represent different treatments (treated in 0–10 cm) (CK: control treatment without organic material and fertilizer; CF: conventional fertilizer applied; RF: reduced 20% fertilizer compared with CF; RFWS: wheat straw combined with RF; RFRS: rapeseed shell combined with RF; RFAS: astragalus smicus combined with RF).
Variations of Spectra Indices
To elucidate the chemical characteristics of DOM derived from the various soil depths after long-term leaching, the additional analyses of SUVA254 and SR were done by UV-visible spectrophotometry, and the correlation between DOC and the indices was also analyzed (Figures 3A,B). The mean SUVA254 of DOM released from the 20–30 cm soil layer was higher than the other three soil layers (3.94 mg C−1 m−1), indicating strong aromatic and abundant hydrophobic fractions (Matilainen et al., 2012). However, the estimates of DOM mean SUVA254 in 0–10, 10–20, and 30–40 cm were 1.34 mg C−1 m−1, 2.38 mg C−1 m−1, and 1.73 mg C−1 m−1, respectively, predicting more hydrophilic fractions (SUVA254 < 3) (Yeh et al., 2014; Wei et al., 2017). For the 0–10 cm layer, values of SUVA254 in RFWS, RFRS, and RFAS were 1.17 mg C−1 m−1, 1.19 mg C−1 m−1, and 0.97 mg C−1 m−1, which showed a negative correlation with soil DOM. As a means to determine DOM molecular weight, the mean SR at 0–40 cm soil depth ranged from 2.66 to 3.50, suggesting a decreasing tendency first and then an increasing tendency of soil DOM molecular weight. Besides, a large-molecular-weight DOM would augment the addition of organic materials, while increasing the DOC concentration (Yamashita et al., 2010).
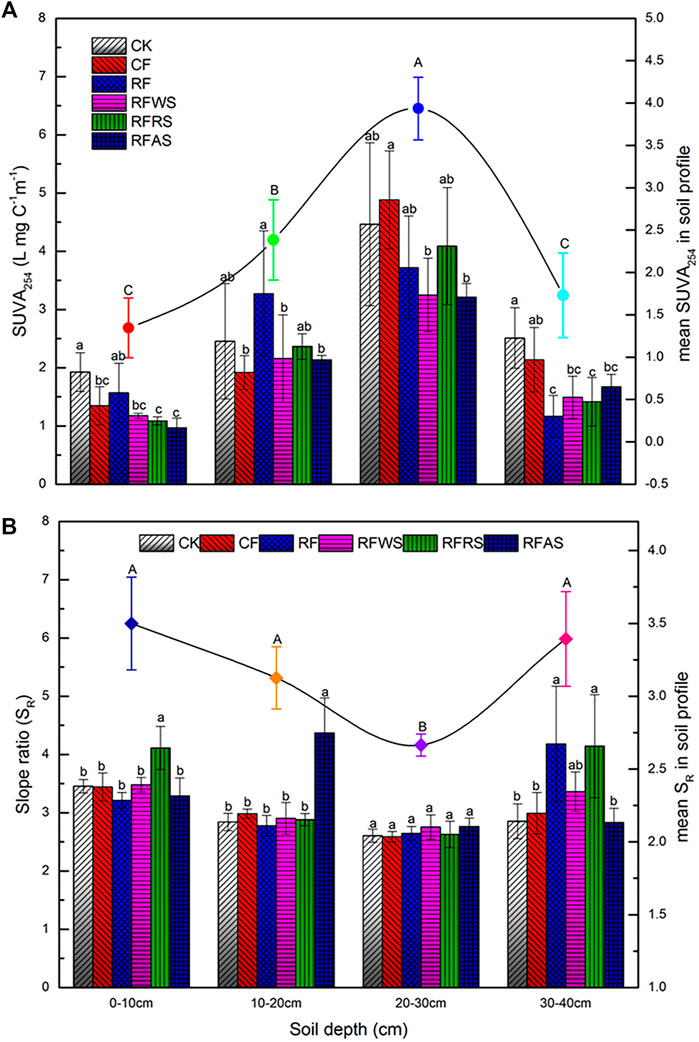
FIGURE 3. (A) Changes of SUVA254 values from soils sampled after leaching test. (B) Changes of SR values from soils sampled after leaching test. Different color bars represent different treatments (treated in 0–10 cm) (CK, control treatment without organic material and fertilizer; CF, conventional fertilizer applied; RF, reduced 20% fertilizer compared with CF; RFWS, wheat straw combined with RF; RFRS, rapeseed shell combined with RF; RFAS, astragalus smicus combined with RF).
To further study the origin and quality of DOM, variations of fluorescent indices (FI, HIX, BIX, and β:α) from soils sampled in different soil layers were also determined (Table 3). Overall, the FI values fluctuated approximately 1.8, and the minimal FI value appeared in the 0–10 cm treatment CK (1.46), significantly lower than that of other treatments in topsoil. It can be inferred that the DOM from various treatments may have a similar terrestrial and allochthonous source in topsoil and a microbial source in deeper soil (Mcknight et al., 2001). Among the six treatments in topsoil (0–10 cm), the HIX value of CK was obviously lower than those amended by organic matter and fertilizer (p < 0.01), resulting in the enhancement of DOM humification degree. In addition, the HIX values of DOM in the topsoil with straw amendment were higher than those in deep soils (p < 0.05). This means that DOM in soils amended with organic materials has a higher degree of humification in topsoil, while humus was gradually decomposed and transformed by microorganisms with the increase in soil depth. Compared to CK, organic material amendments significantly increased the values of BIX and β:α in topsoil (0–10 cm) after leaching (p < 0.05). However, there was no significant difference among RFWS, RFRS, and RFAS (p > 0.05), which may be attributed to the presence of materials containing similar compounds such as substituents, hydroxyl, alkoxyl, and amino groups (Romero et al., 2017). Additionally, the BIX and β:α indexes of different treatments at various depths showed a similar trend. This indicates that the new DOM was generated gradually and mainly from a microbial source with the increase in soil depth (Parlanti et al., 2000; Wilson and Xenopoulos, 2009).
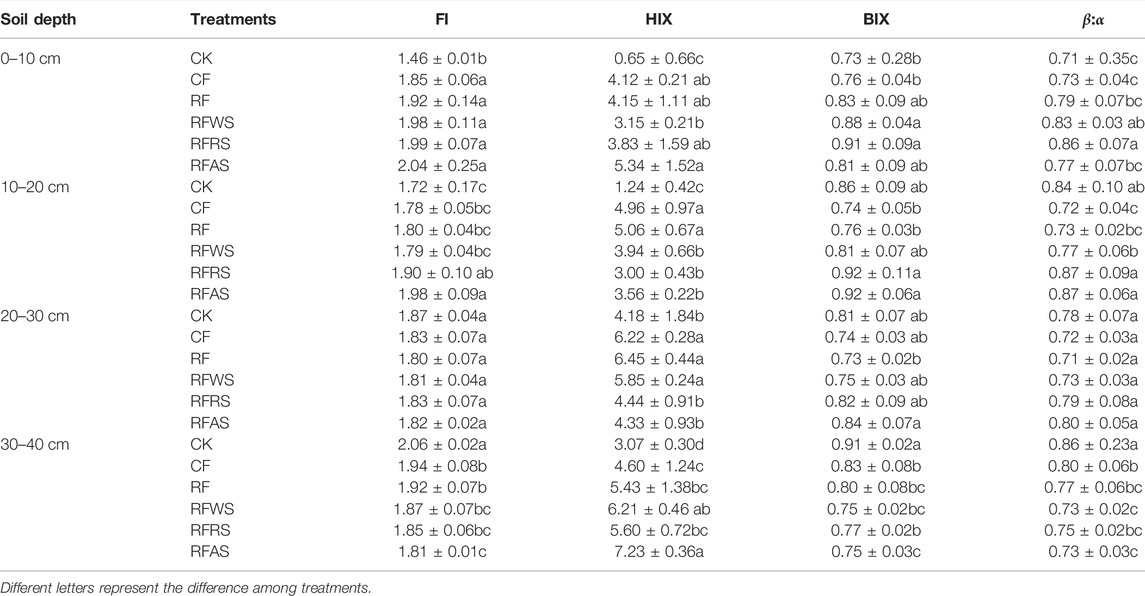
TABLE 3. Variations of fluorescent indices (FI, HIX, BIX, and β:α) from soils sampled after leaching test.
PARAFAC Analysis of EEM Spectra
In the present study, the DOM components for the entire soil sample in the column leaching experiment were identified by EEM-PARAFAC modeling analysis. The EEM locations, representative EEM contours, and fluorescence spectral loadings of the six components (labeled C1, C2, C3, C4, C5, and C6) are described in Table 4, which could be used for qualitative DOM components analysis. C1 and C2, characterized by the peak at 255 nm excitation with 450 nm emission, and a peak at 255 (320) nm excitation with 380-nm emission wavelengths, were determined by humic acid-like fluorescent structures combined with lower-molecular-weight materials (Ishii and Boyer, 2012). C3 was characterized by the peak at 200 (255) nm excitation with 340-nm emission wavelengths, which was defined as a solubility-like microbial metabolite product (Marhuenda-Egea et al., 2007). The peaks of C4 and C6, located at 230 (275) nm excitation with 340 nm emission, and a peak at 220 (270) nm excitation with 290-nm emission wavelengths, were identified by tryptophan-like molecules (Stedmon and Markager, 2005). The C4 and C6 components, regarded as the free tryptophan bound in proteins and amino acids, can predicate the structural characteristics of protein substances (Fellman et al., 2010; Gao et al., 2017). C5, characterized by the peak at 220 (290) nm excitation with 420-nm emission wavelengths, was considered as a fulvic acid-like material (Santín et al., 2009). A previous study reported that a longer emission wavelength showed an enhancement of humic-like structures of aromatic and relatively higher molecular weight (Lichtman and Conchello, 2005).
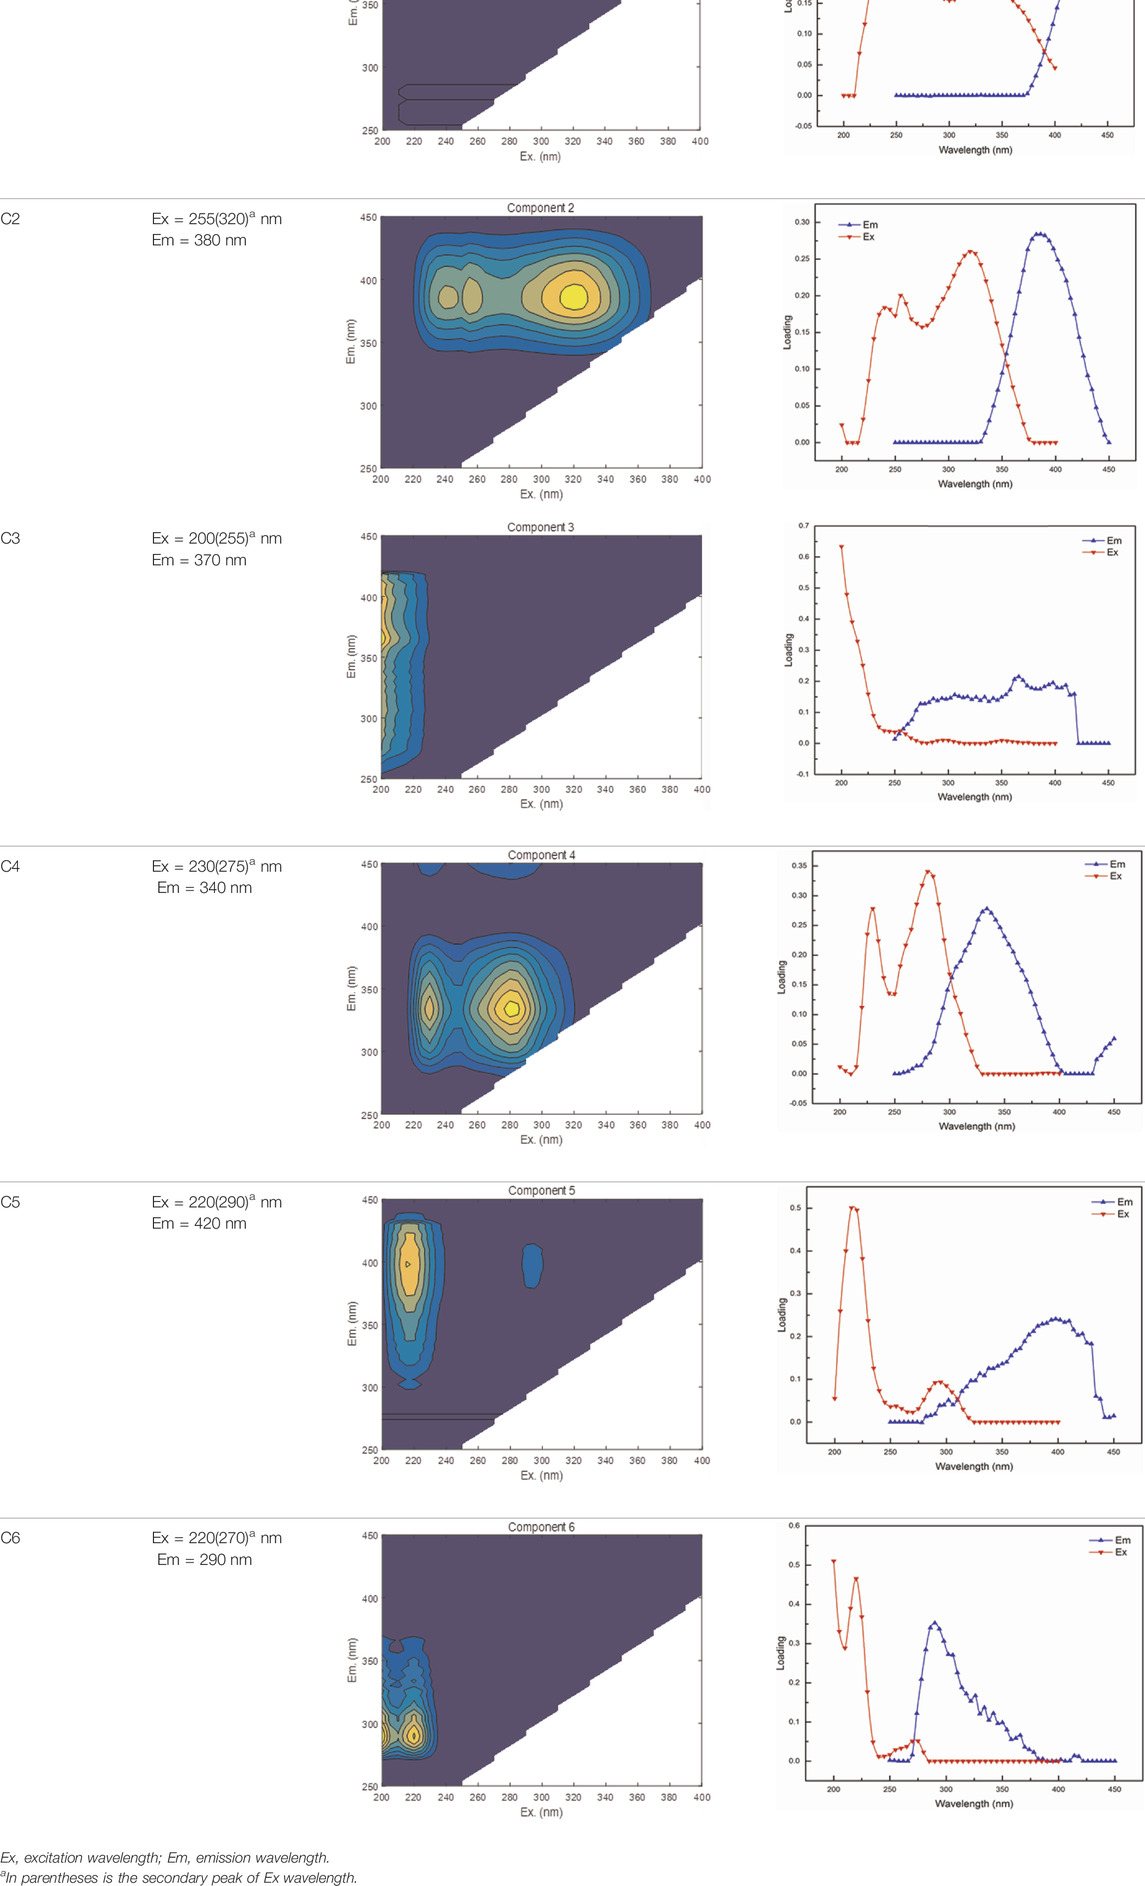
TABLE 4. EEM locations, representative EEM contours, and fluorescence spectral loadings of the six components identified by EEM-PARAFAC modeling.
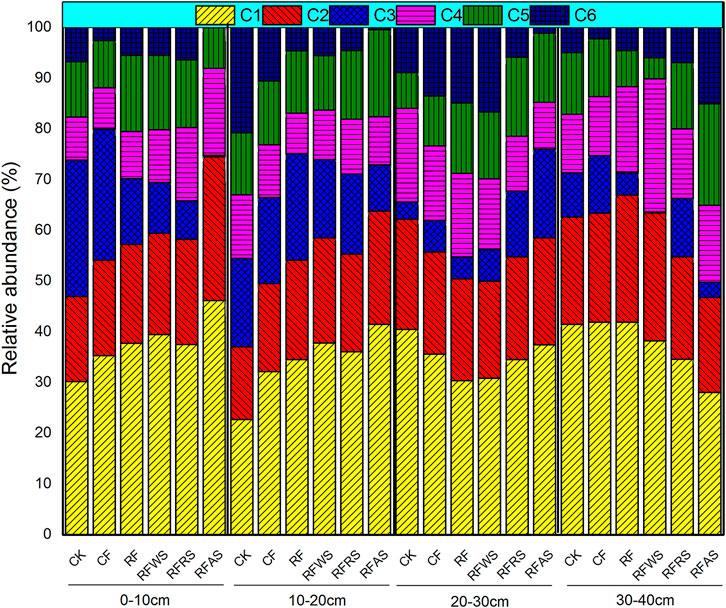
In order to better understand the variability of DOM at different soil depths after long-term leaching, the relative abundances of the six components calculated by PARAFAC modeling are shown in Figure 4. Conversely, the relative abundance of solubility-like microbial metabolite products (C3) increased first (0–10 cm: 14% to 0–20 cm: 15.8%) and then decreased by 6.5% at 30–40 cm depth. The fluorescent tryptophan-like substances (C4 and C6) were the main contributors of DOM released from organic material-amended soil in 20–40 cm depth, which accounted for 23.8% (20–30 cm) and 22.3% (30–40 cm). The average relative distribution of the fourth PARAFAC component, identified fulvic acid-like material (C5), had no significant difference at different soil depths (0–10 cm: 11.8%, 10–20 cm: 12.1%, 20–30 cm: 12.3%, and 30–40 cm: 12.8%). These present results suggested more high-molecular-weight and aromatic humic materials generated from topsoil DOM that was amended by organic materials after long-term leaching (Wei et al., 2016). To better understand the variations of DOM derived from soil treated with fertilizer or organic matter at different column depths, the relative abundances of six PARAFAC components were evaluated in terms of fluorescence intensity (Figure 5). Overall, the mean FI values decreased gradually with the increase in soil depths: 0–10 cm (1,596.7) > 10–20 cm (1,564.1) > 20–30 cm (1,105.4) > 30–40 cm (1,078.1). For FI values of C1–C6, the similar changes occurred in different soil layers after long-term leaching. The corresponding results were consistent with the relative abundances of C1–C6 in different soil layers. The distinct changes of the present FI values and relative abundances of fluorescent components predicted a potential variation of soil DOM composition after organic material amendment and fertilizer addition during a period of leaching.
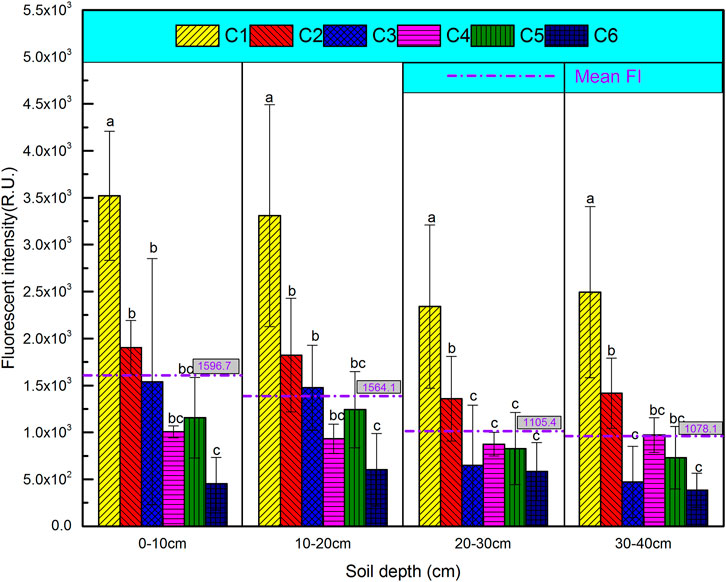
FIGURE 5. Fluorescent intensities of six fluorescence components identified by EEM-PARAFAC modeling in the four soil layers.
Conclusion
The DOM content obtained from organic material amendments at different soil depths (0–10, 10–20, 20–30, and 30–40 cm) significantly varied, ranging from 0.05 to 0.14 g kg−1, while the maximum DOM occurred in CF treatment at 10–20 cm. Furthermore, the quantity and spectral quality of DOM derived from the four soil depths after leaching were analyzed using UV and fluorescence techniques coupled with EEM-PARAFAC, and four fluorescent components (protein and tryptophan-like, humic acid-like, fulvic acid-like, and solubility-like microbial metabolite product substances) were identified. Additionally, the abundances of the four components showed more aromatic humic materials with higher molecular weights but poor amino acids were generated from soil treated with organic fertilizer with the increase in soil depths. The potential application of organic and inorganic materials in paddy soil was also evaluated by spectral indicators, and the findings demonstrated that organic substance amendment could accelerate soil DOM decomposition and transportation in soil column during leaching, leading to the development of a high-quality soil/water environment.
Data Availability Statement
The raw data supporting the conclusions of this article will be made available by the authors, without undue reservation.
Author Contributions
JG: Drafting the manuscript. LL: Analysis and/or interpretation of data. ZS: Development or design of methodology, and creation of models. JL: Revising and editing the manuscript.
Funding
This research was funded by the Shaanxi Science and Technology Coordination Innovation Project (2016KTZDNY03-01) and the Shaanxi Water Resources Science and Technology Project (2016slkj-15). This study received funding from China Tobacco Henan Industrial Limited Company (2020410001340006). The funder was not involved in the study design, collection, analysis, interpretation of data, the writing of this article and the decision to submit it for publication.
Conflict of Interest
The authors declare that the research was conducted in the absence of any commercial or financial relationships that could be construed as a potential conflict of interest.
Publisher’s Note
All claims expressed in this article are solely those of the authors and do not necessarily represent those of their affiliated organizations, or those of the publisher, the editors, and the reviewers. Any product that may be evaluated in this article, or claim that may be made by its manufacturer, is not guaranteed or endorsed by the publisher.
Acknowledgments
We acknowledge the reviewers and the journal Editor-in-Chief for their helpful comments and constructive inputs that greatly improved the quality of this manuscript.
Supplementary Material
The Supplementary Material for this article can be found online at: https://www.frontiersin.org/articles/10.3389/fenvs.2022.766795/full#supplementary-material
References
Bolan, N. S., Adriano, D. C., Kunhikrishnan, A., James, T., McDowell, R., and Senesi, N. (2011). Dissolved Organic Matter: Biogeochemistry, Dynamics, and Environmental Significance in Soils. Adv. Agron. 110, 1–75. doi:10.1016/b978-0-12-385531-2.00001-3
Borisover, M., Lordian, A., and Levy, G. J. (2012). Water-extractable Soil Organic Matter Characterization by Chromophoric Indicators: Effects of Soil Type and Irrigation Water Quality. Geoderma 179-180, 28–37. doi:10.1016/j.geoderma.2012.02.019
Chantigny, M. H. (2003). Dissolved and Water-Extractable Organic Matter in Soils: a Review on the Influence of Land Use and Management Practices. Geoderma 113 (3-4), 0–380. doi:10.1016/s0016-7061(02)00370-1
Coble, P. G. (1996). Characterization of marine and Terrestrial DOM in Seawater Using Excitation-Emission Matrix Spectroscopy. Mar. Chem. 51, 325–346. doi:10.1016/0304-4203(95)00062-3
De Troyer, I., Merckx, R., Amery, F., and Smolders, E. (2014). Factors Controlling the Dissolved Organic Matter Concentration in Pore Waters of Agricultural Soils. Vadose Zone J. 13 (7), vzj2013.09.0167. doi:10.2136/vzj2013.09.0167
ElBishlawi, H., and Jaffe, P. R. (2015). Characterization of Dissolved Organic Matter from a Restored Urban Marsh and its Role in the Mobilization of Trace Metals. Chemosphere 127, 144–151. doi:10.1016/j.chemosphere.2014.12.080
Fellman, J. B., Hood, E., and Spencer, R. G. M. (2010). Fluorescence Spectroscopy Opens New Windows into Dissolved Organic Matter Dynamics in Freshwater Ecosystems: A Review. Limnol. Oceanogr. 55, 2452–2462. doi:10.4319/lo.2010.55.6.2452
Gao, J., Liang, C., Shen, G., Lv, J., and Wu, H. (2017). Spectral Characteristics of Dissolved Organic Matter in Various Agricultural Soils throughout china. Chemosphere 176, 108–116. doi:10.1016/j.chemosphere.2017.02.104
Gao, J., Lv, J., Wu, H., Dai, Y., and Nasir, M. (2018). Impacts of Wheat Straw Addition on Dissolved Organic Matter Characteristics in Cadmium-Contaminated Soils: Insights from Fluorescence Spectroscopy and Environmental Implications. Chemosphere 193, 1027–1035. doi:10.1016/j.chemosphere.2017.11.112
Hassouna, M., Massiani, C., Dudal, Y., Pech, N., and Theraulaz, F. (2010). Changes in Water Extractable Organic Matter (Weom) in a Calcareous Soil under Field Conditions with Time and Soil Depth. Geoderma 155 (1-2), 0–85. doi:10.1016/j.geoderma.2009.11.026
Helms, J. R., Stubbins, A., Ritchie, J. D., Minor, E. C., Kieber, D. J., and Mopper, K. (2008). Absorption Spectral Slopes and Slope Ratios as Indicators of Molecular Weight, Source, and Photobleaching of Chromophoric Dissolved Organic Matter. Limnol. Oceanogr. 53 (3), 955–969. doi:10.4319/lo.2008.53.3.0955
Hur, J., Hwang, S.-J., and Shin, J.-K. (2008). Using Synchronous Fluorescence Technique as a Water Quality Monitoring Tool for an Urban River. Water Air Soil Pollut. 191, 231–243. doi:10.1007/s11270-008-9620-4
Ishii, S. K. L., and Boyer, T. H. (2012). Behavior of Reoccurring PARAFAC Components in Fluorescent Dissolved Organic Matter in Natural and Engineered Systems: a Critical Review. Environ. Sci. Technol. 46, 2006–2017. doi:10.1021/es2043504
Kalbitz, K., Solinger, S., Park, J.-H., Michalzik, B., and Matzner, E. (2000). Controls on the Dynamics of Dissolved Organic Matter in Soils: a Review. Soil Sci. 165 (4), 277–304. doi:10.1097/00010694-200004000-00001
Lichtman, J. W., and Conchello, J.-A. (2005). Fluorescence Microscopy. Nat. Methods 2, 910–919. doi:10.1038/nmeth817
Marhuenda-Egea, F. C., Martínez-Sabater, E., Jordá, J., Moral, R., Bustamante, M. A., Paredes, C., et al. (2007). Dissolved Organic Matter Fractions Formed during Composting of Winery and Distillery Residues: Evaluation of the Process by Fluorescence Excitation-Emission Matrix. Chemosphere 68 (2), 301–309. doi:10.1016/j.chemosphere.2006.12.075
Marschner, B., and Kalbitz, K. (2003). Controls of Bioavailability and Biodegradability of Dissolved Organic Matter in Soils. Geoderma 113 (3-4), 211e235. doi:10.1016/s0016-7061(02)00362-2
Matilainen, A., Gjessing, E. T., Lahtinen, T., Hed, L., Bhatnagar, A., and Sillanpää, M. (2012). An Overview of the Methods Used in the Characterisation of Natural Organic Matter (Nom) in Relation to Drinking Water Treatment. Chemosphere 83 (11), 1431–1442. doi:10.1016/j.chemosphere.2011.01.018
Mcknight, D. M., Boyer, E. W., Westerhoff, P. K., Doran, P. T., Kulbe, T., and Andersen, D. T. (2001). Spectrofluorometric Characterization of Dissolved Organic Matter for Indication of Precursor Organic Material and Aromaticity. Limnol. Oceanogr. 46 (1), 38–48. doi:10.4319/lo.2001.46.1.0038
Ogawa, H., and Tanoue, E. (2003). Dissolved Organic Matter in Oceanic Waters. J. Oceanogr. 59 (2), 129–147. doi:10.1023/a:1025528919771
Ohno, T. (2002). Fluorescence Inner-Filtering Correction for Determining the Humification index of Dissolved Organic Matter. Environ. Sci. Technol. 36 (4), 742–746. doi:10.1021/es0155276
Parlanti, E., Wörz, K., Geoffroy, L., and Lamotte, M. (2000). Dissolved Organic Matter Fluorescence Spectroscopy as a Tool to Estimate Biological Activity in a Coastal Zone Submitted to Anthropogenic Inputs. Org. Geochem. 31, 1765–1781. doi:10.1016/s0146-6380(00)00124-8
Romero, C. M., Engel, R. E., D'Andrilli, J., Chen, C., Zabinski, C., Miller, P. R., et al. (2017). Bulk Optical Characterization of Dissolved Organic Matter from Semiarid Wheat-Based Cropping Systems. Geoderma 306, 40–49. doi:10.1016/j.geoderma.2017.06.029
Rumpel, C., and Kögel-Knabner, I. (2011). Deep Soil Organic Matter-A Key but Poorly Understood Component of Terrestrial C Cycle. Plant Soil 338, 143–158. doi:10.1007/s11104-010-0391-5
Santín, C., Yamashita, Y., Otero, X. L., Álvarez, M. Á., and Jaffé, R. (2009). Characterizing Humic Substances from Estuarine Soils and Sediments by Excitation-Emission Matrix Spectroscopy and Parallel Factor Analysis. Biogeochemistry 96 (1), 131–147. doi:10.1007/s10533-009-9349-1
Stedmon, C. A., and Bro, R. (2008). Characterizing Dissolved Organic Matter Fluorescence with Parallel Factor Analysis: a Tutorial. Limnol. Oceanogr. Methods 6, 572–579. doi:10.4319/lom.2008.6.572b
Stedmon, C. A., and Markager, S. (2005). Resolving the Variability in Dissolved Organic Matter Fluorescence in a Temperate Estuary and its Catchment Using PARAFAC Analysis. Limnol. Oceanogr. 50, 686–697. doi:10.4319/lo.2005.50.2.0686
Uchimiya, M., Liu, Z., and Sistani, K. (2016). Field-scale Fluorescence Fingerprinting of Biochar-Borne Dissolved Organic Carbon. J. Environ. Manage. 169, 184–190. doi:10.1016/j.jenvman.2015.12.009
Wang, Y., Shao, M. a., Zhang, C., Liu, Z., Zou, J., and Xiao, J. (2015). Soil Organic Carbon in Deep Profiles under Chinese continental Monsoon Climate and its Relations with Land Uses. Ecol. Eng. 82, 361–367. doi:10.1016/j.ecoleng.2015.05.004
Wei, D., Li, M., Wang, X., Han, F., Li, L., Guo, J., et al. (2016). Extracellular Polymeric Substances for Zn (II) Binding during its Sorption Process onto Aerobic Granular Sludge. J. Hazard. Mater. 301, 407–415. doi:10.1016/j.jhazmat.2015.09.018
Wei, D., Zhang, K., Wang, S., Sun, B., Wu, N., and Xu, W. (2017). Characterization of Dissolved Organic Matter Released from Activated Sludge and Aerobic Granular Sludge Biosorption Processes for Heavy Metal Treatment via a Fluorescence Approach. Int. Biodeterior. Biodegrad. 124, 326–333. doi:10.1016/j.ibiod.2017.03.018
Wilson, H. F., and Xenopoulos, M. A. (2009). Effects of Agricultural Land Use on the Composition of Fluvial Dissolved Organic Matter. Nat. Geosci. 2 (1), 37–41. doi:10.1038/ngeo391
Yamashita, Y., Maie, N., Briceno, H., and Jaffe, R. (2010). Optical Characterization of Dissolved Organic Matter in Tropical Rivers of the Guayana Shield, Venezuela. J. Geophys. Res. 115, 214–221. doi:10.1029/2009jg000987
Yeh, Y.-L., Yeh, K.-J., Hsu, L.-F., Yu, W.-C., Lee, M.-H., and Chen, T.-C. (2014). Use of Fluorescence Quenching Method to Measure Sorption Constants of Phenolic Xenoestrogens onto Humic Fractions from Sediment. J. Hazard. Mater. 277, 27–33. doi:10.1016/j.jhazmat.2014.03.057
Zhang, M., He, Z., Zhao, A., Zhang, H., Endale, D. M., and Schomberg, H. H. (2011). Water-extractable Soil Organic Carbon and Nitrogen Affected by Tillage and Manure Application. Soil Sci. 176 (6), 307–312. doi:10.1097/ss.0b013e31821d6d63
Keywords: dissolved organic matter, EEM-PARAFAC, crop residues, paddy soil, leaching
Citation: Gao J, Liu L, Shi Z and Lv J (2022) Characteristics of Fluorescent Dissolved Organic Matter in Paddy Soil Amended With Crop Residues After Column (0–40 cm) Leaching. Front. Environ. Sci. 10:766795. doi: 10.3389/fenvs.2022.766795
Received: 30 August 2021; Accepted: 16 February 2022;
Published: 07 April 2022.
Edited by:
Lu-Jun Li, Chinese Academy of Sciences (CAS), ChinaReviewed by:
Renkou Xu, Chinese Academy of Sciences (CAS), ChinaQinghui Huang, Tongji University, China
Copyright © 2022 Gao, Liu, Shi and Lv. This is an open-access article distributed under the terms of the Creative Commons Attribution License (CC BY). The use, distribution or reproduction in other forums is permitted, provided the original author(s) and the copyright owner(s) are credited and that the original publication in this journal is cited, in accordance with accepted academic practice. No use, distribution or reproduction is permitted which does not comply with these terms.
*Correspondence: Jiakai Gao, amtnYW8yMDE2QDE2My5jb20=; Jialong Lv, bGpsbGxAbndzdWFmLmVkdS5jbg==
 Jiakai Gao
 Ling Liu
 Zhaoyong Shi
 Jialong Lv2*