 Huiping Huang
 Qiangzi Li
 Yuan Zhang
- 1Aerospace Information Research Institute, Chinese Academy of Sciences, Beijing, China
- 2University of Chinese Academy of Sciences, Beijing, China
Urban ecological quality evaluation attracts more and more attention in urban land use and ecosystem planning optimization due to continuity problems from rapid urbanization and population growth. Remote sensing was always considering contribute to the evaluation. However, accurate and efficient evaluation of urban ecological quality is being challenged, as traditional remote-sensing-based methods were mainly based on low spatial resolution data, pixel-based land cover classification, and vegetation condition factors, and ignored object-oriented high spatial resolution classification and urban landscape pattern. Thus, method for urban ecological quality evaluation based on high-resolution remote sensing is greatly needed to support spatially explicit decision-making in urban planning. In this study, a novel high-resolution remote-sensing-based method based on six ecological indicators from vegetation conditions and landscape patterns was proposed to evaluate urban ecological quality. The six ecological indicators were derived from high-resolution remote sensing data using an object-oriented land cover classification. Factor analysis indicated that the sensitivity of landscape patterns to ecological quality is relatively weaken. Therefore, vegetation conditions and landscape patterns were used as two respective variables to generate a linear evaluation model, with their weights calculated from the loadings of factor analysis, to evaluation urban ecological quality. The results showed that the proposed linear model, considering both vegetation conditions and landscape patterns, is effective and trustworthy, and can provide more suitable support to urban land use and ecological planning.
1 Introduction
Urbanization in China has been an unforeseen major historical event over the past 40 years. The urban population increased from 172.45 million in 1978 to 914.25 million in 2021, and the urbanization rate increased from 17.9 to 64.7% during the same period (National Bureau of Statistics of China, 2021). Due to the relaxation of population policies in China, the urbanization rate has shown an accelerating tendency, and is predicted to surpass 70% by 2035 (Chinese Academy of Social Sciences, 2019). However, the dramatic urbanization process poses great challenges to the ecological environment and resources (Zhang et al., 2019), leading to various ecological issues including biodiversity reduction (Elmqvist, 2013), lengthy drought (Kaufmann et al., 2007), heat island effect (Du et al., 2020), water quality deterioration (Owen, 2010), atmospheric pollution (Sarrat et al., 2006), and disease spreading (Allender et al., 2010). Shrinkage of ecological land and the resulting water shortage have become outstanding issues in highly urbanized cities such as Beijing, China (Zhang et al., 2009). China implemented the “Green GDP” project in 2007 to deal with the challenging ecological situation. Green GDP suggests less urbanization and industrialization, and more green space expansion in urban areas. Accordingly, Beijing municipal government decided to limit residential and business land, and develop more green space in the urban area to strengthen the ecological conservation. Both growing ecological issues and the effectiveness of policy optimization need to be considered for understanding the impacts on urban residential suitability. Therefore, the analysis of urban ecological quality is of greater importance than ever in the rapid urbanization region.
A well-established approach is to use ecological indicators as standardized tools to provide comparable and comprehensive information of an urban area for urban ecological quality analysis (Lakes and Kim, 2012). Urban ecological indicators are quantitative and spatially continuous descriptions of ecological conditions in urban environments. They reflect ecological functions and ecosystem services such as groundwater recharge, retention of contaminants, air purification, and urban climate regulation (Henry and Dicks, 1987; Bolund and Hunhammar, 1999; Eliasson and Svensson, 2003; Arlt and Lehmann, 2005; Gómez-Baggethun and Barton, 2013).
Many urban ecological indicators have been developed for evaluating urban ecological quality, ranging from qualitative to quantitative, from physical based to remote sensing based, from point to surface monitoring, and from intermittent monitoring to continuous monitoring in the last 2 decades (Wang et al., 2017). However, most of the existing indicators were developed using local statistical data, labor-intensive field surveys, or visual interpretation of aerial photographs, which are difficult to collect, and often lack high quality spatial context (Cadenasso et al., 2007). Therefore, there is a need to develop a high-resolution cyberinfrastructure-based ecological indicator for effective ecological planning (Rose et al., 2015).
A remarkable array of ecological measurements can be derived from remotely sensed images that include habitats (or land cover classifications) and their biophysical properties (integrated ecosystem measurements) as well as natural and human-induced changes across the landscape (Pettorelli et al., 2014). Various automatic remote-sensing-based methods have been developed to improve the efficiency of urban ecological indicators. Behling et al. presented an automatic remote sensing and GIS based system to generate flexible and user-defined urban ecological indicators. In their work, fourteen indicators were developed based on hyperspectral remote sensing data and its corresponding height information (Behling et al., 2015). Xu developed a remote sensing based ecological index (RSEI), which takes greenness, wetness, dryness and heat into consideration. The four aspects were quantified by four remote sensing indices: normalized difference vegetation index (NDVI), normalized difference built-up and soil index (NDBSI), wetness component of the tasseled cap transformation (Wet), and land surface temperature (LST) (Xu, 2013). However, a common issue exists in the current remote-sensing-based ecological evaluation: the use of coarse indicators from low-resolution remote sensing data, which hindered the development of spatially detailed urban ecological indicators.
On the other hand, current ecological indicators from remotely sensed images mainly focused on the quantity of urban ecological land and ignored their spatial patterns. However, the spatial pattern is considered as one of the most important factors that affect urban ecological quality (Su et al., 2012; Zhou et al., 2012; Estoque and Murayama, 2013). For instance, landscape pattern strongly influences ecological processes with respect to population persistence, biodiversity, and ecosystem health. The ecological consequences of urbanization can be observed and described by the dynamic changes of regional landscape through landscape metrics (Li et al., 2010; Peng et al., 2016). Some studies have expounded the significant functions of Urban Green Space (UGS) in urban life (Uy and Nakagoshi, 2008). Landscape pattern assessment could also infer potential ecological processes (Turner et al., 2001; Botequilha Leitão and Ahern, 2002). These factors express the ecological quality of UGS from different aspects, such as biodiversity, physical and mental health, and visual and amenity benefits (Harper et al., 2005; Fuller et al., 2007; Gonzalez et al., 2010). Therefore, landscape pattern assessment should be considered to derive more comprehensive ecological quality assessment.
In light of the issues of existing studies on remote-sensing-based urban ecological quality evaluation, the objective of this article is to propose an innovative method to develop urban ecological indicators using high resolution remote sensing images. The proposed method takes both vegetation condition and landscape pattern into consideration to evaluate the urban ecological quality. The results are expected to greatly support urban managers for better understanding of the importance of urban ecological quality, and for more objective decision making in urban planning.
2 Study Area, Data Collection and Pre-Processing
2.1 Study Area
In this study, Haidian District in Beijing, China (Figure 1), was selected as the study area. The area is located in the northwest part of Beijing city. It covers an area of 430.8 km2 and is divided into 30 administrative sub-districts. The population of the area amounted to 3.24 million by the end of year 2019, while the production value reached 113.23 billion US dollars, taking up 22.4% of the total value of Beijing (Bureau of Statistics of Haidian District, 2020). Generally, the built-up area occupies half of the southeast area while mountains distribute in the west margin, with urban-rural fringe located in between. Because of the tremendous population, high industrial output and fragmented land use patches, Haidian District becomes a suitable area to develop an ecological quality evaluation method with both vegetation conditions and landscape patterns considered.
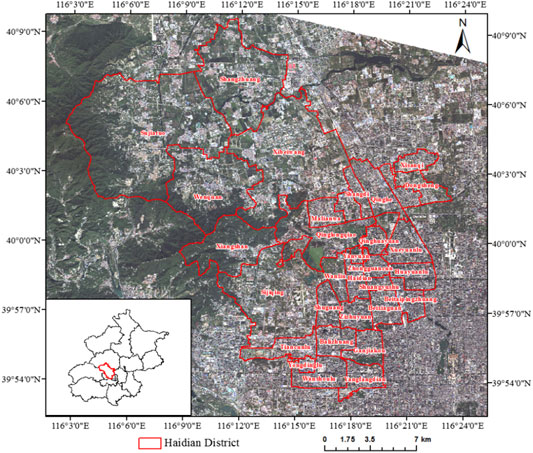
FIGURE 1. The study area of Haidian district overlaid on a mosaicked GaoFen-2 true-color image and the location of Haidian District within Beijing, China.
2.2 Remote Sensing Data and Preprocessing
GaoFen-2 (GF-2) is a high spatial resolution remote sensing satellite that was launched by China, on 19 August 2014. It contains Panchromatic and Multi-Spectral (PMS) sensors (PMS-1 and PMS-2 with the same band designations). The band designation of GF-2 PMS is shown in Table 1. The spatial resolution of the multispectral and panchromatic bands is 4 and 1 m, respectively. Four GF-2 multispectral images, acquired on 12 September 2015, were used to develop ecological indicators in this study.
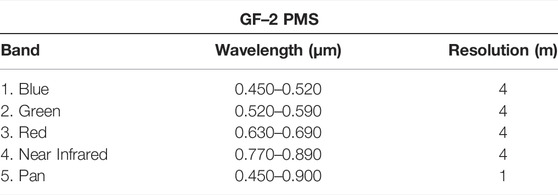
TABLE 1. Spectral bands of GaoFen-2 (GF-2) Panchromatic/Multi-Spectral (PMS).
The multispectral data preprocessing includes radiometric calibration, atmospheric correction, ortho-rectification and mosaic. Radiometric calibration was used to convert digital numbers to Top-Of-Atmosphere (TOA) reflectance using parameters developed by the China Centre for Resources Satellite Data and Application (http://www.cresda.com.cn). Atmospheric correction is used to convert the TOA reflectance to surface reflectance using a Fast Line-of-sight Atmospheric Analysis of Spectral Hypertube (FLAASH) module. After that, the images were visualized and orthorectified using ENVI 5.1 software. Lastly, four images were mosaicked.
3 Methods
We propose a novel high-resolution remote-sensing-based methodological framework to evaluate ecological quality of Haidian District (Figure 2). The proposed framework consists of four modules: 1) Generation of a fine-scaled ecological land cover map using an object-oriented image classification method; 2) Derivation of vegetation parameters and landscape metrics based on GF-2 multi-spectral data and land cover mapping; 3) Evaluation of the ecological quality (EQ1) using factor analysis and analysis of the contribution of vegetation and landscape to ecological quality based on the loadings of six indicators. 4) Development of a linear model combining both vegetation condition and landscape pattern to evaluate the ecological quality (EQ2).
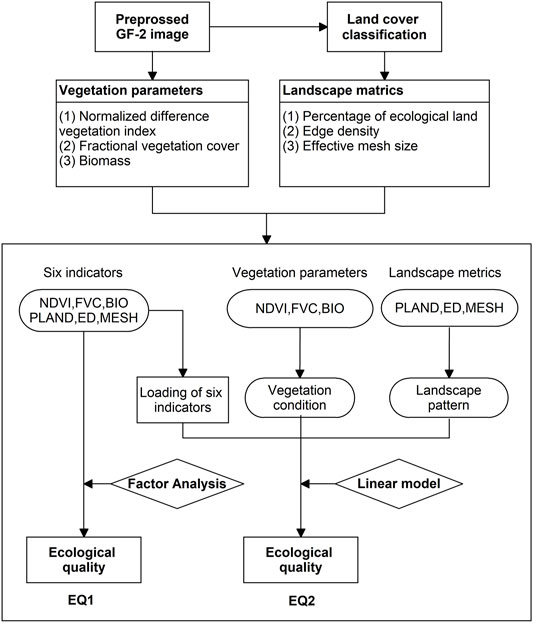
FIGURE 2. The framework of ecological quality evaluation using GF-2 remote sensing data.
3.1 Object-Oriented Land Cover Classification
Object-oriented image classification is one of the most effective methods to conduct land use/cover mapping using high spatial resolution remotely sensed images. As compared with pixel-based image classification, this method can remove salt-and-pepper noise and generate more reliable and accurate results. In this study, the GF-2 images were classified into various land cover types. The results were then used as a basis for landscape metrics calculation.
Object-oriented image classification involved three steps: multi-scale segmentation, general classes creation, and classification rules (Ramakrishnan, 2014). The segmentation parameters were defined as follows: layer weights were all set to equal, scale to 20, shape factor to 0.3, color to 0.7, and compactness and smoothness to 0.5. Four classes (water, vegetation, soil, and impervious surface) were created to form class hierarchy. We chose the nearest neighbor method as the classifier. Urban area surface is complex and heterogeneous, so it is very difficult to identify all land cover classes simultaneously. In this research, based on the difference of pixel spectral heterogeneity, four classes were identified. After that, water and vegetation were subdivided further. Water was further divided into two sub-types, clean water and turbid water. Vegetation was divided into two sub-types: grassland, and forest/shrub. 50 sample regions of 100 m × 100 m in size were randomly selected, and the land cover type of these pixels within these sample regions were identified using visual interpretation in order to assess the accuracy of land cover classification.
3.2 Landscape Metrics Calculation
3.2.1 Definition of Urban Ecological Land
Ecological land patches are the basic units for landscape metric calculation. Urban ecological land refers to the land-use type that can provide ecosystem services. Its definition has been involved in the land use classification system, though has not yet been proposed as an explicit concept in ecological planning (Peng et al., 2017). Li et al. has defined urban ecological land as land “aimed at improving the quality of life of people in cities, protecting important ecosystems and habitats, maintaining and improving the natural and urban artificial ecological unit, and stabilizing the urban ecosystem services at a certain level.” (Li et al., 2009).
Vegetation areas and water bodies are conventionally recognized as ecological lands, which are important to ecosystem service. Barren land is inferior ecological land that has potential to convert into vegetation, and is therefore also considered part of ecological land in this study. The impervious surface is not regarded as urban ecological land. Ecological land patches were extracted from land cover maps based on GF-2 image in this study. Landscape metrics were calculated at the class level for only urban ecological land.
3.2.2 Landscape Metrics Selection and Measurement
Landscape metrics have been extensively used for analyzing spatial patterns and differentiating urban land uses (O’Neill et al., 1991; Listopad et al., 2015). They can be calculated at various levels of patch, class or landscape, quantifying different aspects such as landscape composition and configuration. Many landscape metrics are highly correlated; therefore, correlation analysis should be performed in order to identify suitable metrics which are not significantly correlated with each other. At the same time, those metrics should represent as many aspects of landscape pattern as possible. From the perspective of heterogeneity level, landscape metrics are typically grouped according to the aspect of landscape pattern measured, such as area and edge metrics, shape metrics, core area metrics, contrast metrics, aggregation metrics, and diversity metrics (McGarigal, 2015). On the basis of correlation analysis, diversity and heterogeneity consideration, three landscape metrics, i.e., percentage of Landscape (PLAND), edge density (ED), and effective mesh size of ecological land (MESH), were selected as ecological quality evaluation indices, and calculated at grid level. Here, the grid size is defined as 100 m × 100 m, which is suitable to analyze the landscape pattern for ecological quality evaluation.
PLAND is a landscape composition metric, and quantifies the proportional abundance of ecological type in the landscape (McGarigal, 2015). Higher PLAND values represent better ecological quality. The PLAND is calculated as follows:
Pi = proportion of the landscape occupied by urban ecological land patches type (class) i. aij = area (m2) of urban ecological land patch ij. A = total urban ecological land area (m2).
ED was calculated as the sum of the lengths of all edge segments of urban ecological land patches, divided by the total landscape area (McGarigal, 2015). ED quantifies the fragmentation and shape complexity of the ecological land patches. Higher values of ED represent lower ecological quality. The ED is calculated as follows:
MESH focuses on the patch area of ecological land (McGarigal, 2015). It represents the fragmentation degree, patch area and segmentation. MESH is calculated as the sum of the squared area of patches, divided by the total landscape area (i.e., 10,000 m2). Higher values of MESH represent better ecological quality. The MESH is calculated as follows:
aij = area (m2) of urban ecological land patch ij. A = total urban ecological land area (m2).
3.3 Vegetation Parameters Calculation
Three ecological indicators, i.e., Normalized Difference Vegetation Index (NDVI), Enhanced Vegetation Index (EVI) and Biomass (BIO) from GF-2 images were involved to quantify vegetation condition.
NDVI is used to determine the density of green vegetation on the land by observing distinct colors (wavelengths) of the visible and near infrared (NIR) sunlight reflected by the plants. The NDVI is calculated as follows:
where Red and NIR refer to the reflectance of red and near-infrared bands in the GF-2 remote sensing data. NDVI values range from minus one to plus one, and no green leaves gives a value close to zero (NASA, 2017).
EVI improves sensitivity to high biomass regions and improved vegetation monitoring capability through a de-coupling of the canopy background signal and a reduction in atmospheric influences (Huete et al., 1999). It has shown significant improvements related to the analysis of environments composed by dense vegetation (Matsushita et al., 2007). According to the work of Liu and Huete, the EVI is defined as (Liu and Huete, 1995):
where L is a soil adjustment factor, C1 and C2 are coefficients used to correct aerosol scattering in the red band using the blue band, Blue, Red, and NIR represent reflectance at the blue, red, and NIR bands, respectively. In general, G = 2.5, C1 = 6.0, C2 = 7.5, and L = 1 (Huete et al., 1997). The formula can be written as follow:
BIO is the mass of living biological organisms in an area or ecosystem at a given time. In remote sensing based methods, empirical algorithms have been widely used to explore the relationships between BIO and various vegetation indices (Zhang, 2007). Kong et al. (2016) developed a single curve regression model and multiple linear regression models for estimating the BIO value of the grassland, and for forest and shrub with R squared values of 71.9 and 52.8%, respectively (Kong et al., 2016). Their work has been applied to the study area of Fengning county of China, which has the similar vegetation cover to Haidian district of Beijing. Therefore, Kong et al.’s biomass estimation model was used in this research. Kong et al.’s model for estimating BIO value of the grassland was defined as:
where RVI refers to the Ratio Vegetation Index, the reflectance ratio of NIR and Red band. The model for estimating biomass value of forest and shrub is:
where GNDVI refers to Green Normalized Difference Vegetation Index, and GBNDVI refers to Green and Blue Normalized Difference Vegetation Index. GNDVI and GBNDVI can be calculated using Equation 9, 10.
In order to quantify the ecological quality in the study area, all selected vegetation parameters and landscape metrics were standardized to the range of 0 and 1 based on the standard deviation model.
3.4 Factor Analysis
In this study, factor analysis was used to determine the relationships between the ecological indicators (input variables) and output unobserved factors (urban ecological quality/vegetation condition/landscape pattern). The important output of the analysis is a table of factor loadings. Each item’s loading represents how strongly the item is associated with the underlying factor. The absolute value of loadings should be 0.7 or higher to indicate the independent variables identified a priori are represented by a factor. The mathematical form of the factor analysis can be described as:
where Y1, Y2, … , Yl are the observed variables, F1, F2, … , Fn are the underlying factors, and βln are loadings. For instance, β11 is called the loading of variable Y1 on factor F1. The error
In this study, the factor analysis was applied three times to evaluation urban ecological quality from three aspects. First, the factor analysis was conducted to assess the sensitivities of six indicators to the overall ecological quality, and ecological quality was used as an unobserved factor. A loading matrix of six variables and a map of ecological quality were derived. Then, vegetation condition and landscape patterns were optimized using factor analysis, based on three vegetation parameters and three landscape metrics respectively. Lastly, based on the loading matrix, a linear function with two variables (vegetation condition and landscape pattern) was developed to provide more reliable evaluation of the ecological quality of the study area. For easy comparison, all values derived from factor analysis and linear model were normalized to the range of 0 and 1.
3.5 Linear Model
In order to present the contribution of landscape patterns more rationally without neglecting the influence of both aspects, a linear model was built to combine vegetation condition and landscape pattern as two variables, with their weights calculated from loadings of factor analysis.
Linear functions commonly arise from practical problems involving variables x and y with a linear relationship, that is, obeying a linear equation. The linear model used in this paper is deduced from the results of factor analysis, taking the form:
where a and b are mean factor loadings of vegetation parameters and landscape metrics respectively, X and Y are two factors representing vegetation condition and landscape pattern, and F is the urban ecological quality.
According to the discussions on factor loadings of every variable for the effect of ecological quality, a linear model was built based on the six variable loadings and the output of vegetation condition and landscape pattern. The result of model calculation represents the more reasonable ecological quality.
4 Results and Analysis
4.1 Land Cover Classification
Land cover types in Haidian District, involving grassland, forest, shrub, clean water, turbid water, barren soil, and impervious surface were identified from GF-2 images through object-oriented method (Figure 3). Accuracy evaluation using randomly selected samples showed that the overall accuracy of the classification reaches 84.1%, and the Kappa coefficient (Consistency check index) is 0.72. Large patches of forest/shrub and grassland are located in the northwest, while patches of impervious surface locate mostly in the highly urbanized east-southern regions.
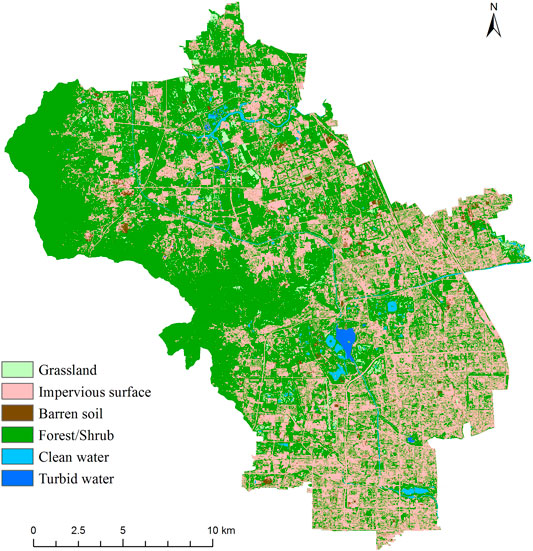
FIGURE 3. Land cover classification of Haidian District, Beijing.
4.2 Spatial Distribution of the Six Ecological Indicators
The spatial distribution of the three vegetation parameters showed similar patterns (Figure 4). Lower value patches indicated lower productivities and poor ecological effects due to poor vegetation coverage and low-level photosynthesis ratio. Spatial distribution patterns of NDVI, EVI, and BIO are also highly consistent among sub-districts (Figure 4D).
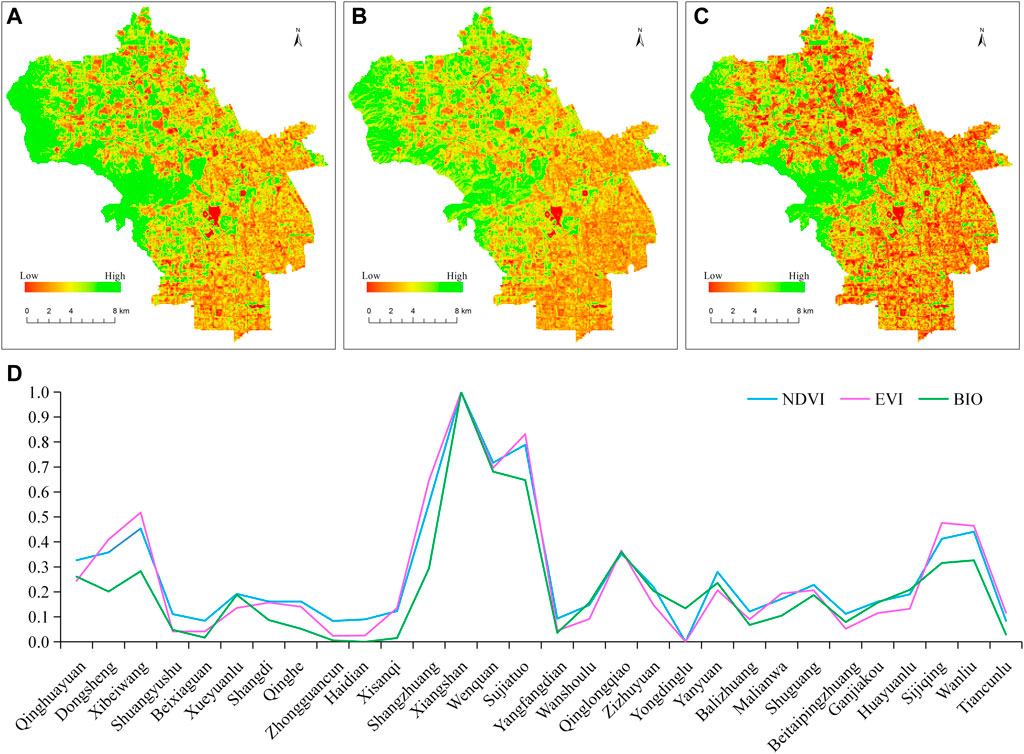
FIGURE 4. The spatial distribution of NDVI (A), EVI (B), and BIO (C) values, and sub-district-wise normalized indices (D).
Landscape metrics of the ecological land in Haidian District were also calculated (Figure 5). PLAND (a) and MESH (c) showed lower values in the southeastern area, indicating higher level fragmentation of ecological land. Higher values of both metrics can be observed in the northwest, indicating better landscape pattern. ED (b) showed the opposite distribution of PLAND (a) and MESH (c). Mean metrics at sub-district scale reveal that PLAND and MESH values are highly consistent while ED values are negatively correlated with them (Figure 5D).
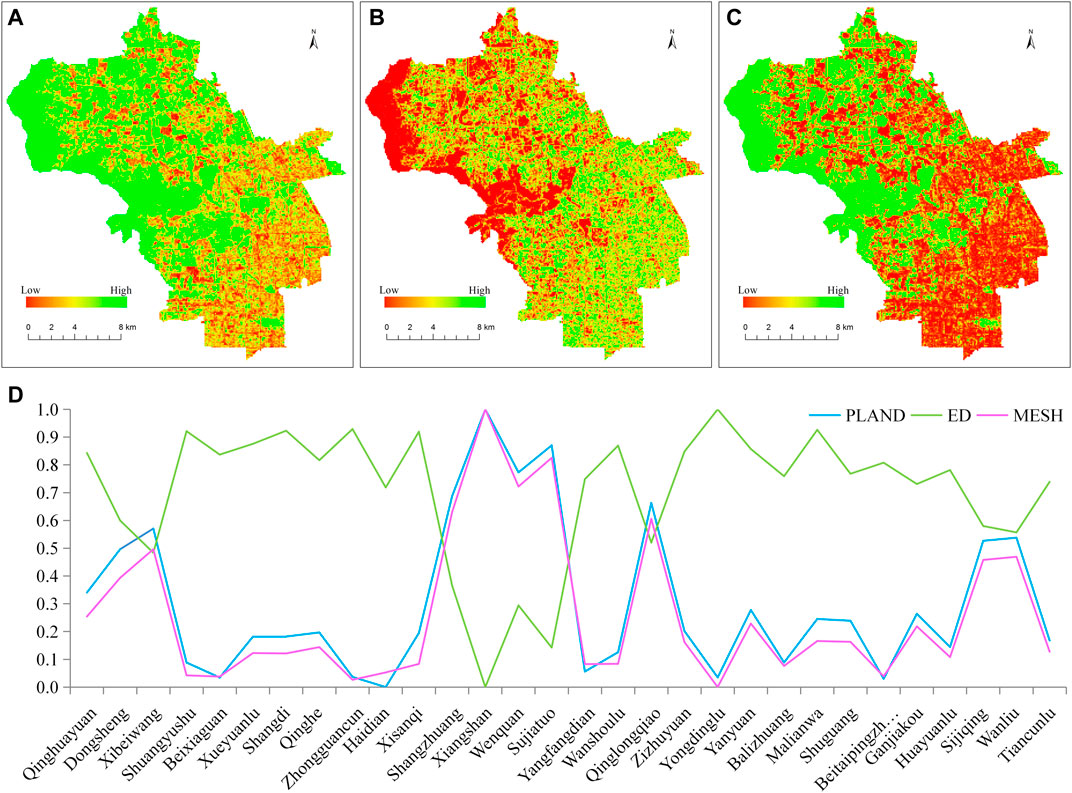
FIGURE 5. The spatial distribution of landscape metrics PLAND (A), ED (B), and MESH (C), and sub-district-wise normalized landscape metrics (D).
4.3 Urban Ecological Quality Evaluation
4.3.1 Results of Factor Analysis
Factor analysis was used in this study to analyze the relationship between input variables (ecological indicators) and the output unobserved factor. The results of three factor analyses correspond respectively to levels of ecological quality, vegetation condition and landscape pattern.
First, the output of unobserved factor was generated through factor analysis with all six input variables. The weight of each indicator was multiplied by its corresponding indicator value to generate an overall ecological quality value (Figure 6). Here, the urban ecological quality based on factor analysis with six indicators is abbreviated as EQ1.
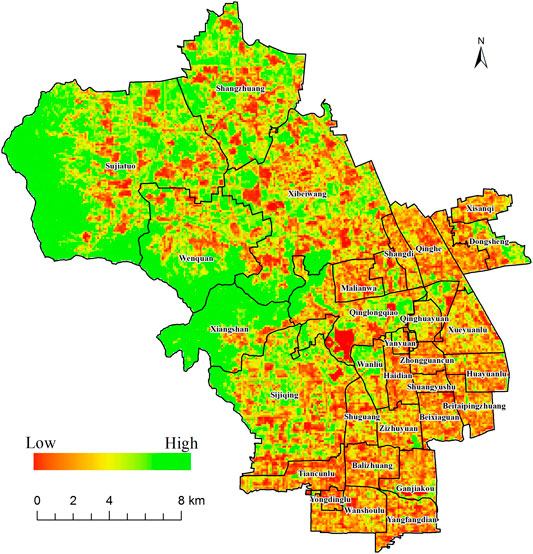
FIGURE 6. Map of ecological quality (EQ1) using six-indicator-based factor analysis in Haidian district.
Likewise, two other maps were generated using factor analysis (Figure 7), including the output unobserved factor of vegetation condition based on three vegetation parameters, and the output of landscape pattern using three landscape metrics as input. Figure 7A is the map of vegetation condition levels. Figure 7B is the map of landscape pattern levels. The hot spots in Figure 7A, in red, show the areas that have poor vegetation condition, and the hot spots in Figure 7B, in red, refer to the areas that have the lower-level landscape patterns.
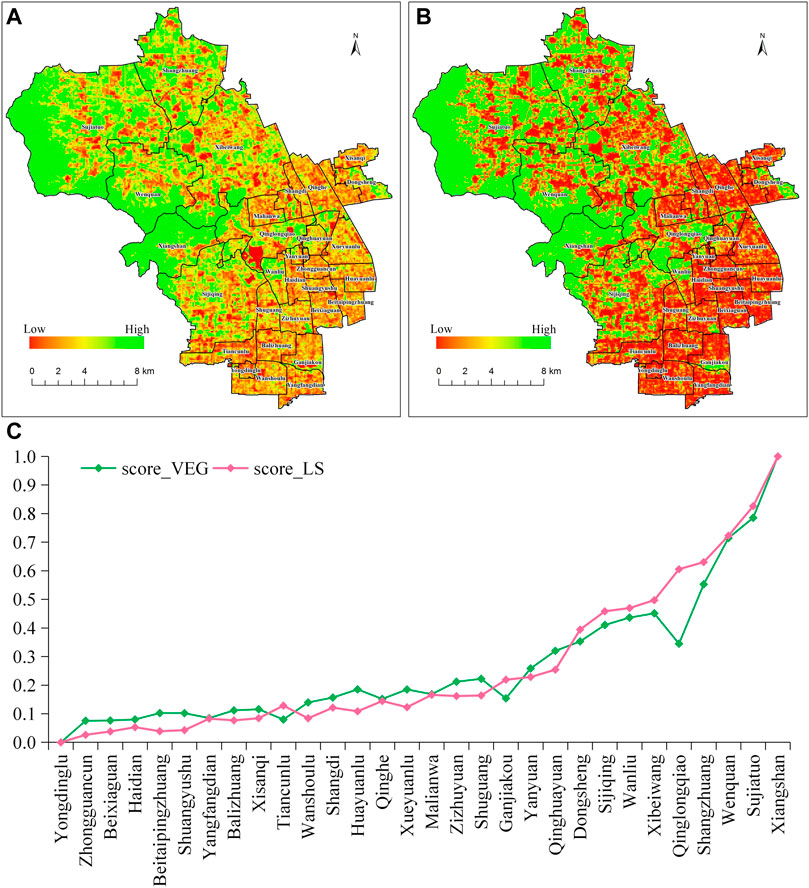
FIGURE 7. Map of Vegetation condition (A), Landscape pattern (B), and the sub-district-wise values in Haidian district (C).
Figure 7C showed two curves with green and red representing levels of vegetation condition and landscape pattern at sub-district scale. Most sub-districts have higher vegetation condition value than landscape pattern value, and only nine are in opposite situation. It is also indicated that Qinglongqiao has the biggest difference of 0.36 between values of vegetation condition and landscape pattern.
Figure 8 illustrates the contribution of vegetation condition and landscape pattern to urban ecological quality. The comparison revealed that EQ1 values were more likely to be consistent with those of vegetation condition, regardless of the values of landscape patter. This indicates that EQ1 from the 6-indicator factor analysis overlooked the contribution of landscape pattern, and may represent biased ecological quality of the study area.
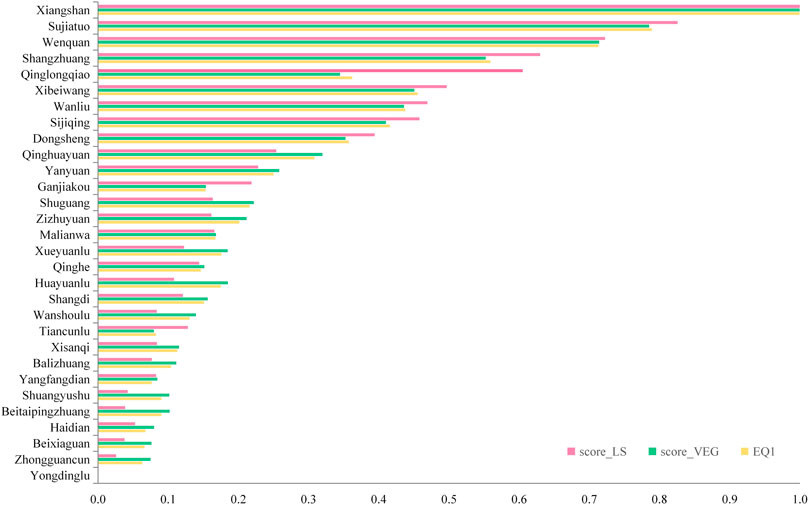
FIGURE 8. Ecological quality (EQ1), vegetation condition and landscape pattern derived from factor analysis at sub-district scale.
4.3.2 Results of the Linear Model
It is indicated by the factor analysis results that, landscape pattern, one of the most important factors that affect urban ecological quality, should be incorporated in a different way in the ecological evaluation process. Therefore, this study adopted a linear model integrating vegetation condition and landscape pattern with their respective weights, instead of the 6-factor analysis. We take the average of the absolute loading values as a weight. Then, ecological quality was calculated based on the linear model which considers vegetation and landscape with their respective weights.
4.3.2.1 The Weights of Vegetation and Landscape
Equation 13 in factor analysis gives the relationship between ecological quality and the six observed variables (PLAND, ED, MESH, NDVI, EVI, and BIO) with indicator loadings shown.
These loadings represent how strongly this indicator is associated with the unobserved factor (EQ1). The importance of various ecological indicators can be determined through comparison of their loadings on ecological quality. PLAND, MESH, NDVI, EVI, and BIO had positive loading values higher than 0.7, indicating that those variables were positively correlated with EQ1 and therefore can be used as important indicators to evaluate the ecological quality. On the other hand, ED has a negative loading value, which indicates a negative correlation between ED and ecological quality. The absolute loading value of ED is lower than 0.7, showing weaker relationship between ED and the factor compared to other indicators.
According to Equation 14, the weight of vegetation condition 1) is 0.942, derived as the average of absolute loadings of three vegetation parameters. The weight of landscape pattern 2) is 0.727, the average of the absolute loadings of three landscape metrics.
In the study, a linear combination model was adopted to give ecological quality evaluation considering both vegetation condition and landscape pattern. Here, the urban ecological quality based on linear model with the wights of vegetation condition and landscape pattern is abbreviated as EQ2. Vegetation condition and landscape pattern from factor analysis (Figure 7) were used as two separate sets in the model. Equation 15 shows the relationship between ecological quality and the two observed variables (vegetation condition X and landscape pattern Y).
4.3.2.2 Ecological Quality Map
Figure 9A showed the result of EQ2 in Haidian District using the linear model. Compared to Figures 7A,B, there exists good consistency between higher ecological quality and higher vegetation level and reasonable landscape patterns. The areas with high levels of ecological quality mostly present good vegetation conditions and reasonable landscape patterns. On the other hand, those areas with low levels of ecological quality are mainly caused by unreasonable landscape patterns combined with average levels of vegetation conditions. The hot spots, in red, in Figure 9A are the areas of poor ecological quality.
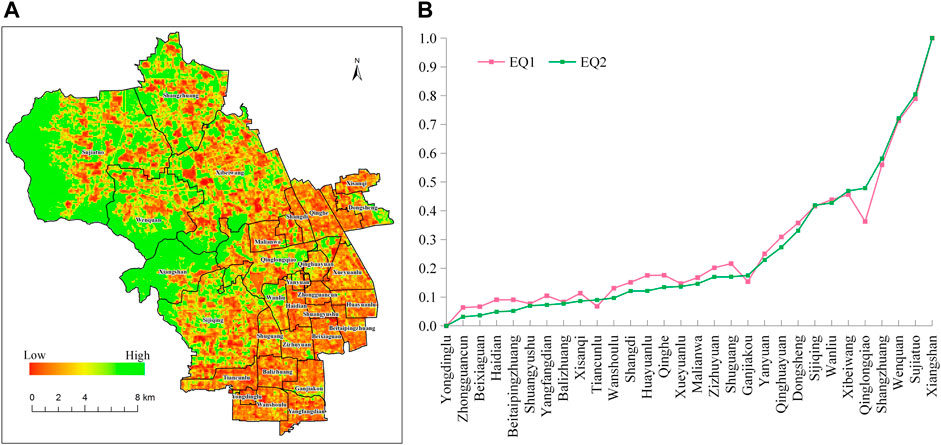
FIGURE 9. Results of ecological quality evaluation (EQ2) with the linear model (A), comparison to results with two methods (B).
Figure 9B showed EQ1 from the factor analysis and EQ2 from the linear model at sub-districts scale. EQ1 indicated that the levels were more likely consistent with that of vegetation condition. Comparisons found the levels of EQ2, which considered both vegetation conditions and landscape patterns is effective in evaluating urban ecological quality.
From the perspective of spatial variation of ecological quality, it can be concluded that there exists a gradual change from better quality in the northwest to worse in the southeast (Figure 9A). The northwestern part of Haidian, including Xiangshan, Sujiaduo and Wenquanzhen sub-districts has higher ecological quality. Then the sub-districts to the east of the top three high level ecological quality sub-districts, i.e., Shangzhuang, Xibeiwang and Sijiqing, ranked in the second tier of higher ecological quality.
In the middle-eastern part, sub-districts have a medium level of ecological quality. Southeastern part of Haidian district, especially Yongdinglu, Zhongguancun, Beixiaguan, Haidian and Beitaipingzhuang sub-districts, has lower level of ecological quality. The other areas exhibited mixed ecological quality patterns.
With that, Beijing government released a general city plan for 2016 to 2035. The plan emphasizes on removing non-capital functions and solving “big city disease”. It was also mentioned that the green area of Beijing will grow from 41.6 to 44% by year 2020 (Beijing general plan (2016-2035)). Northern region with the rich natural and human resources is the expanding area of Zhongguancun Science Park. In Haidian district overall development and planning, northern region is considered as a tourist area and ecological barrier, therefore urbanization is strictly under control and hardly permitted in these areas.
5 Discussion
5.1 Vegetation Plays the Decisive Role for Ecological Quality
Over the past several decades, vegetation has been identified as an important contributor to urban environment and ecological service. Urban vegetation can contribute to quality of life at the most fundamental level through biodiversity protection, water quality levels, and maintenance of ecological processes and life-support systems (Carne, 1994). Interactions between vegetation and ecological quality were described by experiments (Fennessy et al., 2002; Pu et al., 2008; Giménez et al., 2017) or by models (Rajabov, 2009; Giménez et al., 2016; Kuipers et al., 2016). In this research, vegetation played a key role in ecological evaluation as shown by factor analysis results. Equation 14 showed that the three vegetation parameters (NDVI, EVI, and BIO) have positive and much higher loading values. This is consistent with the work that other researchers have done (Aksoy, 2010; Kuipers et al., 2016). Among the three vegetation parameters, NDVI represents the richness of vegetation and plays the decisive role for ecological quality, resulting in a push to improve urban environments by planting more trees and grass.
5.2 Landscape Metrics Contribute Less but Are Indispensable to Ecological Quality
Landscape structure has an important influence on a wide range of ecological patterns and processes, and landscape metrics are common tools to assess these relations under the matrix-corridor-patch model (Forman, 1995; Turner et al., 2001). Landscape patterns become increasingly crucial in ecological quality evaluation in urban areas because of the gradually fragmented ecological land. The importance of landscape patterns was underestimated as shown in the 6-indicator factor analysis results, while actually landscape metrics such as patch size, patch shape and distribution of urban ecological land play a decisive role in defining their ecological and landscape functions (Kong et al., 2007).
In light of this issue, the study evaluated ecological quality based on two separate groups of indicators, e.g., vegetation parameters and landscape pattern. Factor analysis was performed separately to generate their ecological effects, and then a linear combination model was used to evaluate ecological quality integrating the effects of both indicator groups. In this way can landscape metrics provide proper contribution to ecological quality evaluation. The results are expected to emphasize the contribution of landscape pattern to urban ecological quality in future studies. These can help decision-makers better understand cause and effect relationships between the influencing factors and urban ecological quality.
Figure 10 shows three maps of vegetation condition (a), landscape pattern (b), and EQ2 (c) of Qinglongqiao sub-district. In Figure 10A, the hot spots in the left-bottom indicated the area with extremely poor vegetation condition. However, Figure 10C showed that the ecological quality is not in the lowest level in the same area. This result was caused by the quite good landscape pattern with green color (Figure 10B). Therefore, the method proposed in this study synthesizes together landscape metrics and vegetation parameters in a reasonable way, and is expected to result in more convinced ecological results.
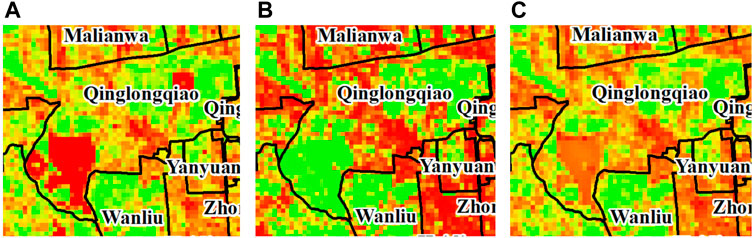
FIGURE 10. Maps of vegetation condition (A), landscape pattern (B), and EQ2 (C) of Qinglongqiao sub-district.
Furthermore, landscape metrics have been used to assess ecological patterns and processes. In this study, higher PLAND and MESH, and lower ED represent better ecological quality. PLAND and MESH have positive influence while ED has negative one. Thus, patch size and shape present the fundamental landscape indicator in assessing the urban ecological quality. For example, a connected green network has higher amenity value than smaller and fragmented ones. It can enhance the amenity values of green spaces and provide more choices to residents (Jim and Chen, 2003). Although ED has the least weight, it also can contribute to the complexity of patch edge and consequently the interactions between green spaces and ecological quality according to edge effect (Harper et al., 2005).
5.3 Advantages and Limitations of the Proposed Method
Remotely sensed images, especially high spatial resolution images provide several advantages in ecological land mapping and quantitative evaluation of ecological quality. Object-oriented image classification can provide highly accurate land cover map that can be used to generate ecological indicators with reliable accuracy, especially when meter level spatial resolution images were involved. The proposed method described the detailed differences of ecological quality at regional scales, which account for the spatial heterogeneity in evaluating urban ecological quality.
The shortage of the method lies in the spatial scale of the evaluation. Vegetation parameters can be derived from high spatial resolution images and UAV (Unmanned Aerial Vehicle) based remote sensing techniques. However, landscape metrics were calculated at a grid pixel level, which causes a coarser spatial resolution of the landscape metrics than vegetation parameters. Due to the availability of data, remote sensing-based vegetation and landscape indicators were considered in this study. Other indicators, e.g., air quality, vegetation diversity could be discussed in future work.
5.4 Policy Optimization by Combining Ecological Land Spatial Pattern
Increasing the area of ecological land (such as water bodies and especially vegetation) is a traditional way to improve ecological quality. With the rapid increase of population and expansion of built-up area, ecological land faces a growing risk of fragmentation. Therefore, the ecological quality evaluation method proposed in this paper, could provide decision-makers and the general public with specific information on the current status of vegetation condition and their spatial pattern, from the ecological quality view. Urban ecological quality could be enhanced through spatial pattern optimization as well as ecological land area expansion.
Figure 11 showed three lines with different colors to represent the levels of EQ2, vegetation condition and landscape pattern for each sub-district in Hiadian District. Xiangshan has the highest ecological quality level due to the most reasonable landscape pattern and the best vegetation condition, while Yongdinglu has the lowest. Either poor vegetation or unreasonable landscape patterns can result in low levels of ecological quality. The sub-districts with lower ecological quality can be potentially improved through optimization of the landscape pattern of ecological land or improvement of vegetation vigor. Hence, efficient policies to either improve vegetation vigor, increase vegetation area, or optimize spatial pattern could be drawn from Figure 11. For 19 sub-districts including Zhongguancun, which have higher vegetation condition value than landscape pattern value, the better way to improve the ecological quality of those areas is to make the landscape pattern more reasonable. Correspondingly, for the other nine sub-districts including Qinglongqiao, which have higher landscape pattern value than vegetation condition value, improving the vegetation condition of ecological land is considered a better solution to achieve higher ecological quality of this area.
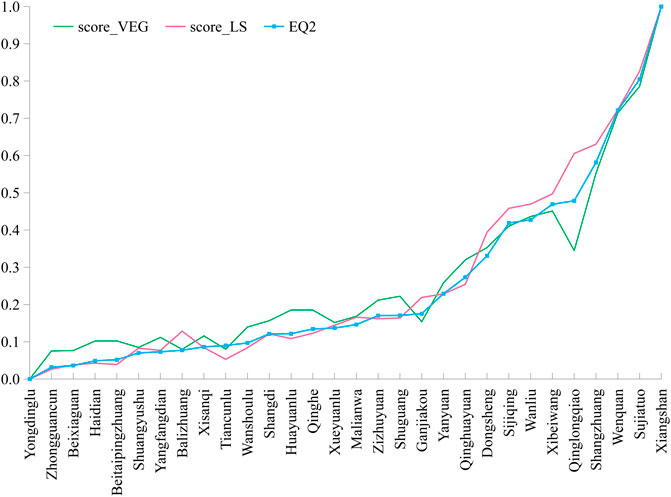
FIGURE 11. The normalized results of landscape pattern levels, vegetation condition levels and ecological quality.
Another result shown in Figure 11 is that ecological quality is greatly affected by landscape pattern in those sub-districts with lower levels (score_VEG <0.4) of vegetation condition. Due to building protection and cultural tradition, it is difficult to improve vegetation condition in the above-mentioned sub-districts. Therefore, improving the level of landscape pattern is an effective way to make ecological quality better.
With the “ecological city” initiative launched as an integral part of Beijing and local government strategy, a plan is developed to build a compound ecological security pattern, according to the actual situation of Haidian district, The revealed performances and pattern of ecological quality will be useful to understand vegetation condition and landscape pattern as the sensitive influencing factors of ecological environment, and to improve urban land use and ecology management decisions. In the northern regions with mountains and wetlands, vegetation conditions need to be maintained and improved. However, in the southern regions with built-up land, ecological land patches are smaller and more fragmented. The better way to improve ecological quality is to optimize the landscape pattern instead of vegetation condition.
6 Conclusion
This paper proposed a novel method to evaluate urban ecological quality integrating vegetation condition and landscape pattern metrics from remotely sensed images. The paper gives more reliable ecological quality mapping in Haidian District, Beijing, China. The following conclusions can be drawn in the study.
• High-resolution remote-sensing-based method enables the development of ecological indicators with high spatial accuracy, thus better describing the detailed differences of ecological quality at regional scales, and could account for the spatial heterogeneity in evaluating urban ecological quality.
• Landscape patterns should be considered in the ecological evaluation process. Ecological quality evaluation based on only vegetation condition factors, e.g., NDVI, EVI, and BIO, cannot reflect the reality in Haidian District, Beijing, leading to the situation that areas with high levels of vegetation condition are more likely to be associated with higher level ecological quality, regardless of the landscape pattern level. This revealed the big shortcoming of the evaluation for neglecting the fragmentation of the ecological land and against the common sense of ecological quality.
• Ecological quality evaluation integrating vegetation condition factors and landscape metrics, e.g., PLAND, ED, and MESH, could result in more reliable and effective estimation. Areas with high levels of vegetation condition and reasonable landscape pattern lead to higher ecological quality results. On the other hand, those areas with low levels of ecological quality are mainly caused by unreasonable landscape patterns combined with below-average levels of vegetation condition.
• Ecological quality evaluation based on vegetation condition factors and landscape metrics could result in more spatially specific ecological quality level, and reflect the spatial variation in the study area. Analysis of the ecological quality evaluation results found that there exists a gradual degradation of ecological quality from the northwest to the southeast along, consistent with the intensified urbanization.
• Ecological quality is greatly affected by landscape pattern when the levels of vegetation condition is below 0.4. For optimization of ecological quality in those sub-districts, the government could make great efforts to improve landscape pattern such as creating more small patches of green space or water bodies, as well as strengthening the greening pattern of the built-up area.
Data Availability Statement
The datasets presented in this article are not readily available because Only used for scientific research where the study area is Beijing, and people are restricted to students and researchers in China. Requests to access the datasets should be directed to HH, huanghp@aircas.ac.cn.
Author Contributions
HH conceived and designed the experiments, conducted the data analysis and wrote the manuscript; QL developed the methodology; YZ performed the experiments; QL and YZ edited the manuscript.
Funding
This research was funded by National Key R&D Program of China (2017YFB0503800).
Conflict of Interest
The authors declare that the research was conducted in the absence of any commercial or financial relationships that could be construed as a potential conflict of interest.
Publisher’s Note
All claims expressed in this article are solely those of the authors and do not necessarily represent those of their affiliated organizations, or those of the publisher, the editors and the reviewers. Any product that may be evaluated in this article, or claim that may be made by its manufacturer, is not guaranteed or endorsed by the publisher.
References
Aksoy, Y. (2010). Examining the Ecological Quality of Küçükçekmece District Parks in Istanbul in Terms of Permeability and Natural Vegetation. Ekoloji 19, 181–189. doi:10.5053/ekoloji.2010.7422
Allender, S., Lacey, B., Webster, P., Rayner, M., Deepa, M., Scarborough, P., et al. (2010). Level of Urbanization and Noncommunicable Disease Risk Factors in Tamil Nadu, India. Bull. World Health Organ. 88 (4), 297–304. doi:10.2471/blt.09.065847
Arlt, G., and Lehmann, I. (2005). Ecosystem Land Service Method System--Analysis and Evaluation of Urban Areas in Dresden. IÖR.
Behling, R., Bochow, M., Foerster, S., Roessner, S., and Kaufmann, H. (2015). Automated GIS-Based Derivation of Urban Ecological Indicators Using Hyperspectral Remote Sensing and Height Information. Ecol. indicators 48, 218–234. doi:10.1016/j.ecolind.2014.08.003
Bolund, P., and Hunhammar, S. (1999). Ecosystem Services in Urban Areas. Ecol. Econ. 29, 293–301. doi:10.1016/s0921-8009(99)00013-0
Botequilha Leitão, A., and Ahern, J. (2002). Applying Landscape Ecological Concepts and Metrics in Sustainable Landscape Planning. Landscape Urban Plann. 59, 65–93. doi:10.1016/s0169-2046(02)00005-1
Bureau of Statistics of Haidian District (2020). National Economic and Social Development Statistical Bulletin of Haidian District in 2019. Beijing, China: Haidian District Government.
Cadenasso, M. L., Pickett, S. T. A., and Schwarz, K. (2007). Spatial Heterogeneity in Urban Ecosystems: Reconceptualizing Land Cover and a Framework for Classification. Front. Ecol. Environ. 5, 80–88. doi:10.1890/1540-9295(2007)5[80:shiuer]2.0.co;2
Carne, R. J. (1994). “Urban Vegetation: Ecological and Social Value,” in Proceedings of the 1994 National Greening Australia Conference, 4–6.
Chinese Academy of Social Sciences (2019). The 17th Report on the Competitiveness of Chinese Cities.
Du, H., Zhou, F., Li, C., Cai, W., Jiang, H., and Cai, Y. (2020). Analysis of the Impact of Land Use on Spatiotemporal Patterns of Surface Urban Heat Island in Rapid Urbanization, a Case Study of Shanghai, China. Sustainability 12 (3), 1–17. doi:10.3390/su12031171
Eliasson, I., and Svensson, M. K. (2003). Spatial Air Temperature Variations and Urban Land Use - a Statistical Approach. Met. Apps 10, 135–149. doi:10.1017/s1350482703002056
Elmqvist, T. (2013). Urbanization, Biodiversity and Ecosystem Services : Challenges and Opportunities : A Global Assessment : A Part of the Cities and Biodiversity Outlook Project. Springer.
Estoque, R. C., and Murayama, Y. (2013). Landscape Pattern and Ecosystem Service Value Changes: Implications for Environmental Sustainability Planning for the Rapidly Urbanizing Summer Capital of the Philippines. Landscape Urban Plann. 116, 60–72. doi:10.1016/j.landurbplan.2013.04.008
Fennessy, M. S., Gernes, M., Mack, J. J., and Wardrop, D. H. (2002). Methods for Evaluating Wetland Condition: Using Vegetation to Assess Environmental Conditions in Wetlands. Washington, DC: Environmental Protection Agency, Office of Water. EPA-822-R-02-020 U.S. 2002.
Forman, R. T. T. (1995). Some General Principles of Landscape and Regional Ecology. Landscape Ecol. 10, 133–142. doi:10.1007/bf00133027
Fuller, R. A., Irvine, K. N., Devine-Wright, P., Warren, P. H., and Gaston, K. J. (2007). Psychological Benefits of Greenspace Increase with Biodiversity. Biol. Lett. 3, 390–394. doi:10.1098/rsbl.2007.0149
Giménez, M. G., de Jong, R., Della Peruta, R., Keller, A., and Schaepman, M. E. (2017). Determination of Grassland Use Intensity Based on Multi-Temporal Remote Sensing Data and Ecological Indicators. Remote Sensing Environ. 198, 126–139.
Giménez, M. G., Della Peruta, R., de Jong, R., Keller, A., and Schaepman, M. E. (2016). Spatial Differentiation of Arable Land and Permanent Grassland to Improve a Land Management Model for Nutrient Balancing. IEEE J. Selected Top. Appl. Earth Observations Remote Sensing 9, 5655–5665.
Gómez-Baggethun, E., and Barton, D. N. (2013). Classifying and Valuing Ecosystem Services for Urban Planning. Ecol. Econ. 86, 235–245.
Gonzalez, M., Ladet, S., Deconchat, M., Cabanettes, A., Alard, D., and Balent, G. (2010). Relative Contribution of Edge and Interior Zones to Patch Size Effect on Species Richness: An Example for Woody Plants. For. Ecol. Manage. 259, 266–274. doi:10.1016/j.foreco.2009.10.010
Harper, K. A., Macdonald, S. E., Burton, P. J., Chen, J., Brosofske, K. D., Saunders, S. C., et al. (2005). Edge Influence on forest Structure and Composition in Fragmented Landscapes. Conservation Biol. 19, 768–782. [CrossRef]. doi:10.1111/j.1523-1739.2005.00045.x
Henry, J. A., and Dicks, S. E. (1987). Association of Urban Temperatures with Land Use and Surface Materials. Landscape Urban Plann. 14, 21–29. doi:10.1016/0169-2046(87)90003-x
Huete, A., Justice, C., and Leeuwen, W. (1999). MODIS Vegetation Index (MOD 13) Algorithm Theoretical Basis. Document Version 3.
Huete, A., Liu, H. Q., Batchily, K., and van Leeuwen, W. (1997). A Comparison of Vegetation Indices Over a Global Set of TM Images for EOS-MODIS. Remote Sensing Environ. 59, 440–451. doi:10.1016/s0034-4257(96)00112-5
Liu, H. Q., and Huete, A. (1995). A Feedback Based Modification of the NDVI to Minimize Canopy Background and Atmospheric Noise. IEEE Trans. Geosci. Remote Sensing 33, 457–465. doi:10.1109/36.377946
Jim, C. Y., and Chen, S. S. (2003). Comprehensive Greenspace Planning Based on Landscape Ecology Principles in Compact Nanjing City, China. Landscape Urban Plann. 65, 95–116. doi:10.1016/s0169-2046(02)00244-x
Kaufmann, R. K., Seto, K. C., Schneider, A., Liu, Z., Zhou, L., and Wang, W. (2007). Climate Response to Rapid Urban Growth: Evidence of a Human-Induced Precipitation Deficit. J. Clim. 20, 2299–2306. doi:10.1175/jcli4109.1
Kong, F., Li, X., and Bai, Y. (2016). The Estimation of Aboveground Vegetation Carbon Storage Based on GF-1 WFV Satellite Images in Fengning County. Resour. Sci. 38, 1054–1064.
Kong, F., Yin, H., and Nakagoshi, N. (2007). Using GIS and Landscape Metrics in the Hedonic Price Modeling of the Amenity Value of Urban Green Space: A Case Study in Jinan City, China. Landscape Urban Plann. 79, 240–252. doi:10.1016/j.landurbplan.2006.02.013
Kuipers, H. J. G., Netten, J. J. C., and Hendriks, A. J. (2016). Explaining Ecological Quality by Using Variable Vegetation Densities in Hydrological Modelling. Aquat. Bot. 133, 38–44. [CrossRef]. doi:10.1016/j.aquabot.2016.05.008
Lakes, T., and Kim, H.-O. (2012). The Urban Environmental Indicator “Biotope Area Ratio”-An Enhanced Approach to Assess and Manage the Urban Ecosystem Services Using High Resolution Remote-Sensing. Ecol. Indicators 13, 93–103. doi:10.1016/j.ecolind.2011.05.016
Li, F., Wang, W., Zhang, X., Wang, R., and Zhao, D. (2009). Urban Ecological Land and its Optimization of Service Function. China Population. Resour. Environ. 19, 343–347.
Li, Y., Zhu, X., Sun, X., and Wang, F. (2010). Landscape Effects of Environmental Impact on Bay-Area Wetlands Under Rapid Urban Expansion and Development Policy: A Case Study of Lianyungang, China. Landscape Urban Plann. 94, 218–227. doi:10.1016/j.landurbplan.2009.10.006
Listopad, C. M. C. S., Masters, R. E., Drake, J., Weishampel, J., and Branquinho, C. (2015). Structural Diversity Indices Based on Airborne LiDAR as Ecological Indicators for Managing Highly Dynamic Landscapes. Ecol. Indicators 57, 268–279. doi:10.1016/j.ecolind.2015.04.017
Matsushita, B., Yang, W., Chen, J., Onda, Y., and Qiu, G. (2007). Sensitivity of the Enhanced Vegetation index (EVI) and Normalized Difference Vegetation index (NDVI) to Topographic Effects: A Case Study in High-Density Cypress Forest. Sensors 7, 2636–2651. doi:10.3390/s7112636
McGarigal, K. (2015). Spatial Pattern Analysis Program for Categorical and Continuous Maps. Fragstats Help 4, 2. [CrossRef].
National Bureau of Statistics of China (2021). Press Conference on the Operation of the National Economy in 2021. Chinese Government 2022.
O’Neill, R. V., Gardner, R. H., Milne, B. T., Turner, M. G., and Jackson, B. (1991). Heterogeneity and Spatial Hierarchies, Ecological Heterogeneity. Springer, 85–96.
Owen, D. (2010). Urbanization, Water Quality, and the Regulated Landscape. Social ence Electronic Publishing.
Peng, J., Xie, P., Liu, Y., and Ma, J. (2016). Urban Thermal Environment Dynamics and Associated Landscape Pattern Factors: A Case Study in the Beijing Metropolitan Region. Remote Sensing Environ. 173, 145–155. doi:10.1016/j.rse.2015.11.027
Peng, J., Zhao, M., Guo, X., Pan, Y., and Liu, Y. (2017). Spatial-Temporal Dynamics and Associated Driving Forces of Urban Ecological Land: A Case Study in Shenzhen City, China. Habitat Int. 60, 81–90. doi:10.1016/j.habitatint.2016.12.005
Pettorelli, N., Laurance, W. F., O'Brien, T. G., Wegmann, M., Nagendra, H., and Turner, W. (2014). Satellite Remote Sensing for Applied Ecologists: Opportunities and Challenges. J. Appl. Ecol. 51, 839–848. doi:10.1111/1365-2664.12261
Pu, R., Gong, P., Tian, Y., Miao, X., Carruthers, R. I., and Anderson, G. L. (2008). Using Classification and NDVI Differencing Methods for Monitoring Sparse Vegetation Coverage: A Case Study of Saltcedar in Nevada, USA. Int. J. Remote Sensing 29, 3987–4011. doi:10.1080/01431160801908095
Rajabov, T. (2009). “Ecological Assessment of Spatio-Temporal Changes of Vegetation in Response to Biosphere Effects in Semi-Arid Rangelands of Uzbekistan,” in Land Restoration Training Programme (Reykjavik, Iceland). http://www.unulrt.is/static/fellows/document/rajabov_t.pdf.
Ramakrishnan, P. (2014). An Approach to Classify the Object from the Satellite Image Using Image Analysis Tool. IJIRST 1 (4), 2349–6010.
Rose, R. A., Byler, D., Eastman, J. R., Fleishman, E., Geller, G., Goetz, S., et al. (2015). Ten Ways Remote Sensing Can Contribute to Conservation. Conservation Biol. 29, 350–359. doi:10.1111/cobi.12397
Sarrat, C., Lemonsu, A., Masson, V., and Guedalia, D. (2006). Impact of Urban Heat Island on Regional Atmospheric Pollution. Atmos. Environ. 40, 1743–1758. doi:10.1016/j.atmosenv.2005.11.037
Su, S., Xiao, R., Jiang, Z., and Zhang, Y. (2012). Characterizing Landscape Pattern and Ecosystem Service Value Changes for Urbanization Impacts at an Eco-Regional Scale. Appl. Geogr. 34, 295–305. doi:10.1016/j.apgeog.2011.12.001
Turner, M. G., Gardner, R. H., O'neill, R. V., Gardner, R. H., and O'Neill, R. V. (2001). Landscape Ecology in Theory and Practice. Springer. [CrossRef].
Uy, P. D., and Nakagoshi, N. (2008). Application of Land Suitability Analysis and Landscape Ecology to Urban Greenspace Planning in Hanoi, Vietnam. Urban For. Urban Green. 7, 25–40. doi:10.1016/j.ufug.2007.09.002
Wang, Z., Li, J., Yang, Y., Li, H., Wu, M., Wang, K., et al. (2017). Quantitative Assess the Dynamic Change of Urban Ecological Environment Based on Remote Sensing—A Case Study in Yixing City, Jiangsu Province. Journal of Ningxia University.
Xu, H. (2013). A Remote Sensing Urban Ecological Index and its Application. Acta Ecologica Sinica 33, 7853–7862.
Zhang, C. L., Chen, F., Miao, S. G., Li, Q. C., Xia, X. A., and Xuan, C. Y. (2009). Impacts of Urban Expansion and Future Green Planting on Summer Precipitation in the Beijing Metropolitan Area. J. Geophys. Res. 114, D02116. doi:10.1029/2008jd010328
Zhang, F., Wang, Y., Ma, X., Wang, Y., Yang, G., and Zhu, L. (2019). Evaluation of Resources and Environmental Carrying Capacity of 36 Large Cities in China Based on a Support-Pressure Coupling Mechanism. Sci. Total Environ. 688, 838–854. doi:10.1016/j.scitotenv.2019.06.247
Zhang, H. (2007). Applications of RS Technology in Forest Biomass Research. World For. Res. 20, 30–34.
Keywords: urban, ecological quality, vegetation condition, landscape pattern, remote sensing
Citation: Huang H, Li Q and Zhang Y (2022) A High-Resolution Remote-Sensing-Based Method for Urban Ecological Quality Evaluation. Front. Environ. Sci. 10:765604. doi: 10.3389/fenvs.2022.765604
Received: 27 August 2021; Accepted: 21 March 2022;
Published: 02 May 2022.
Edited by:
Xuan Zhu, Monash University, AustraliaReviewed by:
Tianhai Cheng, Institute of Remote Sensing and Digital Earth (CAS), ChinaPedzisai Kowe, Midlands State University, Zimbabwe
Copyright © 2022 Huang, Li and Zhang. This is an open-access article distributed under the terms of the Creative Commons Attribution License (CC BY). The use, distribution or reproduction in other forums is permitted, provided the original author(s) and the copyright owner(s) are credited and that the original publication in this journal is cited, in accordance with accepted academic practice. No use, distribution or reproduction is permitted which does not comply with these terms.
*Correspondence: Yuan Zhang, zhangyuan@radi.ac.cn