
94% of researchers rate our articles as excellent or good
Learn more about the work of our research integrity team to safeguard the quality of each article we publish.
Find out more
ORIGINAL RESEARCH article
Front. Environ. Sci., 05 October 2022
Sec. Conservation and Restoration Ecology
Volume 10 - 2022 | https://doi.org/10.3389/fenvs.2022.740287
This article is part of the Research TopicBiodiversity Mapping in Ecology and Conservation: Pitfalls, Uncertainties, and Creative Ways ForwardView all 4 articles
 M. P. Ali1*
 M. Biswas2
 Gemma Clemente-Orta3
 M. M. M. Kabir1Juel Datta1S. S. Haque1Xinghu Qin4*Douglas Landis5Parwinder Kaur6Barry R. Pittendrigh7†
 M. T. H. Howlader7*
Landscape diversity is one of the key drivers for maintaining ecosystem services in agricultural production by providing vital habitats and alternative food sources for beneficial insects and pollinators within the agricultural landscapes. The landscape structure, land uses, and diversity differ between geographic locations. However, how the changes of landscape structure and land use diversity affect the arthropod diversity in a geographic area is poorly understood. Here, we tested the impact of landscape diversity on the rice locations in Bangladesh. Results ranged from highly diversified to very highly diversified in Chattogram (>7.9), to highly diversified (0.590.79) in Satkhira and moderately (0.390.59) to less diversified (0.190.39) in Patuakhali. These significant different landscape diversities influenced the arthropod diversity in rice fields. Arthropod species diversity increases with the increase in the Land Use Mix (LUM) index. The maximum tillering stage of rice growth harbored higher abundance and species diversity in rice fields. Moreover, we found that vegetation is the most important factor influencing the abundance of arthropods. Extensive agriculture and forest contributed substantially to predicting arthropod richness. Meanwhile, barren land and high-density residential land as well as intensive agriculture had large impact on species diversity. This study indicates that landscape diversity plays a vital role in shaping the species diversity in rice fields, providing guidelines for the conservation of arthropod diversity, maximizing natural pest control ecosystem service and more secure crop production itself.
To meet the world’s growing food demand, agricultural production practices in many parts of the world have shifted from traditional extensive farming systems to more intensified forms of agriculture. Such intensified agricultural practices often include the widespread use of agro-chemicals and exploitation of water resources, coupled with livestock production to meet the food demands of the global population, projected to reach 9.8 billion in 2050 (United Nations, 2017). Agricultural intensification results in a simplification of overall landscape structure in addition to other landscape diversity that include, but are not limited to, degradation, urbanization (Clement et al., 2015), tourism (Halling, 2011), industrialization (Hatamia and Shafieardekani, 2014), and expanding human settlements (Antrop and Eetvelde, 2008).
Climate change can further alter land use systems leading to multidimensional effects, for example, enhanced desertification, nutrient-deficient soils, salinity intrusions, floods, and frequent natural calamities in climate-susceptible regions, including Bangladesh (Khan et al., 2012; Kabir et al., 2016; Masum and Khan, 2020). These effects can transform entire land use systems (Islama et al., 2018). For example, in coastal areas, which occupy one-third of Bangladesh, major changes have occurred over the last half-century largely due to frequent and diverse natural disasters with the direct and indirect impact on land resources and their uses. In particular, saltwater intrusion areas have increased more than 25% in Bangladesh during the past 35 years, constituting 109 million ha in 2009, and the area continues to increase (Soil Resource Development Institute, 2010; Mahmuduzzaman and Zahir Uddin Ahmed, 2014; BBS, 2017). Increasing salinity induces further land use change (Islama et al., 2018). For example, traditional rice cultivation lands have been transformed using climate-smart farming systems into shrimp farming in Satkhira and Khulna districts of Bangladesh (Karim and Mimura, 2008; Hossai et al., 2014; BBS, 2017). However, these unplanned and haphazard land use shifts have resulted in dramatic changes to traditional cultivation practices and shrimp farming in these coastal areas (Parvin et al., 2016).
The effects of landscape change due to agricultural practices and climate change are multilevel (Koomen et al., 2012). Changes in land use and shifts in farming systems can induce adverse environmental impact and hamper normal crop production (Parvin et al., 2016). Shifting land use systems alters patterns of vegetation which influence arthropod communities in various ecosystems (Wang et al., 2019). For example, agroecosystems and associated natural or semi-natural habitats often provide resources to different insect herbivores and other arthropods (Rusch et al., 2010; Schellhorn et al., 2014). Herbivores and their natural enemies migrate among habitats, resulting in spatial or temporal emigrations (Landis et al., 2000; Rand et al., 2006; Tscharntke et al., 2012). Consequently, these impacts directly or indirectly change the food, shelter, and other resources for arthropods both in the rice season and off-season. Immigration of arthropods can enhance densities of local populations, thereby increasing the biodiversity (Lucey et al., 2014) and ecosystem services (Barros et al., 2019). Such immigration is also important in restoration and conservation projects (Brudvig, 2011). In addition, high vegetation diversity in landscapes promotes arthropod diversity in dynamic production areas (van Schalkwyk et al., 2021).
The aforementioned factors are all related to landscape diversity. Accordingly, landscape diversity is one of the key factors in maintaining biodiversity and species richness and abundance in agroecosystems. Most studies on landscape diversity and insect abundance relationships have been devoted to investigating the natural enemies of insect pests with the objective of managing habitats for cost-effective pest control (Symondson et al., 2002; Bianchi et al., 2006). However, the farmland landscape diversity promotes wild pollinators and plant reproduction, increases wild bee abundance, and increases the seed set of some crops (for example, Raphanus sativus) through enhanced connectivity (Annika et al., 2018). Increased diversity of crop fields may also promote the diversity of insect pollinators (Dennis et al., 1998; Hass et al., 2018; Foster et al., 2019). Conversely, crop diversity can reduce bee abundance if particularly intensive management practices are adopted (Annika et al., 2018). Insect herbivores also respond to landscape variables such as vegetation type, land type, and water bodies, and the impact is much less conclusive than the data on natural enemies (Bianchi et al., 2013). This represents a knowledge gap in need of filling and affording the design of more effective biological control of crop pests.
The present study was conducted to understand the effect of landscape diversity on the species diversity and richness of the arthropod population in rice fields in three geographical locations of Bangladesh. Here, we examined how both landscape composition and configuration influence arthropod communities in rice agroecosystems. Our objectives were as follows: 1) to determine the effects of landscape diversity in time and location on the species diversity and richness in rice fields; 2) to assess the arthropods population presenting in rice fields of varying diversity factors; 3) to disentangle the influence of the actual geographic landscape on the composition and abundance of insect fauna in rice fields. Accordingly, we quantified the heterogeneity of total landscapes of three geographic locations in Bangladesh based on high-resolution satellite imagery using six independent matrices of the landscape. We then analyzed the landscape diversity of those locations over for two consecutive years and tested the impact of landscape diversity on arthropod species diversity measured in the rice field.
The study was conducted in three geographical regions of Bangladesh (Supplementary Figure S1). These three geographic regions were 1) Chattogram district with rice production in hilly lowlands; 2) Patuakhali, a coastal belt of Bangladesh where rice production is challenged by salinity intrusion; and 3) Satkhira, a traditional rice and shrimp cultivation area where salinity intrusion is increasing. Within each region, 30 “core study sites” were selected, resulting in a total of 90 core sites. The average distance between the nearest cores sites was 3.0 km.
The arthropod communities present in the rice fields were sampled during the wet season of 2018 and 2019. All samples were collected at three different stages of rice growth (early, mid, and maximum tillering stages). The maximum tillering stage typically occurs ca. 50 days after transplanting and is generally associated with the maximum abundance of arthropods (Heong et al., 1991; Wilby et al., 2006). Since the composition of the arthropod community can change with the development of the rice crop and between cropping seasons (wet and dry seasons) (Heong et al., 1991), our study focused on data obtained only during the wet season (August to October) in each year. This period is a typical transplanted Aman (T. Aman) rice-growing season in Bangladesh. This season covers the highest rice production areas in Bangladesh. This is a rainfed rice production season in Bangladesh, where rice growth depends only on natural rainfall. However, at the end of the season, supplementary irrigation is sometimes required for successful crop growth and optimum grain yield.
Arthropods were collected from 30 rice fields in each site using a sweep net (40-cm diameter) (Ali et al., 2017). A total of 20 sweeps were run randomly at the canopy level of the plants at a transect in each of the two adjoining field margins of the focal field at each site. Each transect covered a 50 m × 1 m strip which was sampled with 20 sweeps. At each core site, three samples were taken at random locations near the center of the field between 09:00–11:00 h. Collected arthropods were sorted, identified, and counted at the field site. The arthropods which were not identified at the field site were preserved in 70% ethanol and brought into the laboratory for further study and were identified to the species level using a binocular microscope and the taxonomic keys of Barrion and Litsinger, (1994). Thus, identified arthropods also were then sorted and counted.
The landscape structure was derived from digital satellite images taken in 2018 and 2019. The datasets used for image classification were obtained from the United States Geological Survey using Landsat 8 Operational Land Imager (USGS U.S, 2018). Landsat 8 was first launched on 11 February 2013, having nine spectral bands, including a pan band: Band 1 Visible (0.43–0.45 μm) 30 m, Band 2 Visible (0.450–0.51 μm) 30 m, Band 3 Visible (0.53–0.59 μm) 30 m, Band 4 Red (0.64–0.67 μm) 30 m, Band 5 Near-Infrared (0.85–0.88 μm) 30 m, Band 6 SWIR 1 (1.57–1.65 μm) 30 m, Band 7 SWIR 2 (2.11–2.29 μm) 30 m, Band 8 Panchromatic (PAN) (0.50–0.68 μm) 15 m, and Band 9 Cirrus (1.36–1.38 μm) 30 m23. Cloud-free months in Bangladesh, such as January or February, were used to extract images which showed comparable reflectance. These were OLI data of operational land Imager of 15 m × 15 m panchromatic and 30 m × 30 m multispectral. The images were classified in supervised classification techniques to detect the landscape changes in terms of land use land cover (LULC) that quantify the changes in particular land use patterns over the years. The radiance values were rescaled into a 16-bit digital number (DN) with a range between 0 and 65,536 and converted to reflectance rather than radiance. The post-classification detection of LULC changes was performed in ERDAS Imagine 14 platform through training samples, or signatures were collected under land use classes using the Signature Editor separately for 2018 and 2019.
For the accuracy assessment of contingency matrix, stratified random sampling with ground-truthing was applied. The kappa coefficient (K) was calculated for the accuracy assessment (Rwanga and Ndambuki, 2017). Therefore, the overall accuracy and accuracy of each land use pattern were calculated in terms of user accuracy and product accuracy. The Cohen’s kappa coefficient was calculated for 2018 and 2019 in Chattogram, Satkhira, and Patuakhali districts.
where TS = total sample and TCS = total corrected sample.
The overall accuracy of Chattogram was 94.667% in 2018 LULC and 94.00% in 2019. In Satkhira, the overall accuracy was 95.00% in 2018 and 96.875% in 2019. In Patuakhali, the overall accuracy was 94.29% in 1918 and 92.85% in 2019. Details of user accuracy and product accuracy are listed in Table 1. Accuracy assessment of all the districts and both 2018 and 2019 are presented in Supplementary Tables S1A and B for Chattogram, Supplementary Tables S2A and B for Satkhira, and Supplementary Tables S3A and B for Patuakhali.
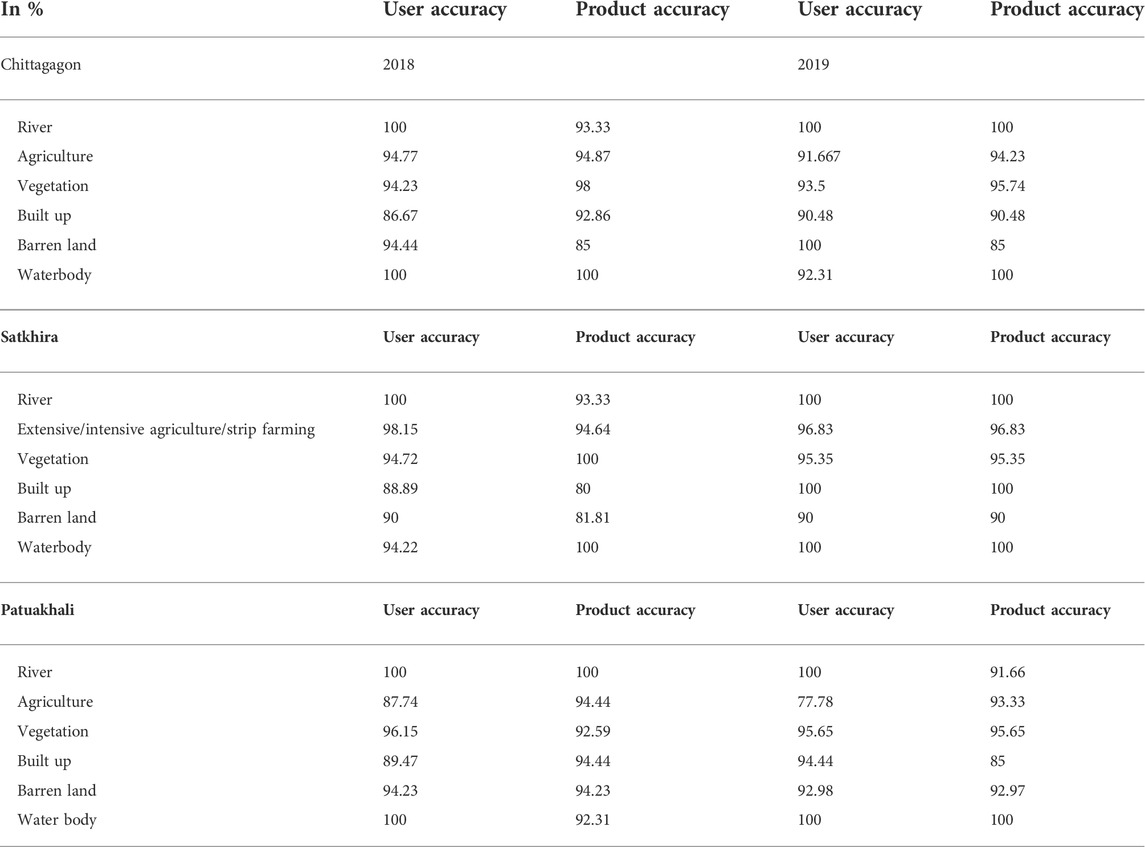
TABLE 1. User accuracy and product accuracy of each land use pattern for 2018 and 2019 with respect to three considered districts.
The calculated Kappa coefficient for Chittagagon was 92.953% in 2018 and 92.425% in 2019. In Satkhira district, the Kappa coefficient was 93.28% in 2018 and 95.796% in 2019. In Patuakhali district, the Kappa value was 92.64% in 2018 and 90.598% in 2019.
In this study, we concentrated on insect abundance and diversity in rice fields; thus, the landscape diversity has been calculated through the LUM method (Frank et al., 2005). Comparing the 2 years datasets implies very minimum changes in LULC. However, landscape LUM analysis in terms of diversity has been processed based on the requirement of some particular land use patterns such as dense forest, vegetation, intensive agriculture, extensive agriculture, barren land, land without crops and shrimp farming of 2019 LULC.
where a = total area of land for all three land uses: commercial (b1), residential (b2), and official (b3); n3 = 2 or 3 depending on the number of different land uses present. If n3 = 1 or 0, the LUM value is assigned with 0.
In 2006, this was modified by Frank et al. (2005) as
where A = (b1/a) ln (b1/a) + (b2/a) ln (b2/a) + (b3/a) ln (b3/a) + (b4/a) ln (b4/a) + (b5/a) ln (b5/a) + (b6/a) ln (b6/a); a = total square feet of land for all land uses.
The advantage of entropy is that it dignifies the diversity and balance of considered land use types within a specific area. The value of diversity ranges from 0 to 1, indicating 0 as homogeneity and 1 as diversified or mixed nature; thus, we have modified the classes of index values into five respective magnitudes: very highly diversified (mixed or heterogeneity), highly diversified, moderately diversified, poorly diversified, and very poorly diversified (homogeneity). To recognize and identify the LULC changes and LUM index (diversity), studied sites have been divided into 6 km × 6 km, that is, 36 km2 grid or fishnet based, obtaining an equal pattern of number system as in images and LUM data sheets so that optimum area may be considered within the blocks and the LUM pattern can be distinctly identified.
Species richness and diversity of recorded arthropods in all rice fields were calculated using the Shanon diversity index (H) described by Magurran (1988), as follows.
The Czekanowski coefficient was measured using the following equation
Species richness of arthropods was calculated following the Margalef index (D) (Margalef 1958). The index is given by the following formula:
Here, S is the total number of species, N is the total number of individuals in the sample, and ln is the natural logarithm (logarithm to base e).
A one-way ANOVA was performed to compare the abundance, species richness, and diversity among the studied sites. We analyzed how LUM index-related structural components of the local landscape affects arthropod spillover in rice fields. Species richness, species diversity, and abundance in the rice fields were modeled with linear regression to find the impact of individual factors on them. Explanatory variables included in these models were forest, waterbody, residential area, agriculture, barren land, vegetation, and LUM index in the landscape of each geographic area.
To assess which factors affect the species diversity most, we regressed the total number of species, species richness, and Shanon index against the landscape factors independently using deep neural networks. We first constructed a 3-hidden-layer MLP (multilayer perceptron) and then tuned the number of neurons in each layer to find the optimal model. The deep neural network was constructed with a weighted decay optimizer and a logistic function at the hidden layer. We performed a random search on the number of neurons at each layer via cross-validation. For each regression, we searched 50 hyperparameter combinations. The final model performance was determined by the lowest mean average error (MAE). The importance of the variable is determined based on Olden’s algorithm (Olden and Jackson 2002), which calculates variable importance as the product of the raw input-hidden and hidden-output connection weights between each input and output neuron and sums the product across all hidden neurons. Deep neural network models were built using the caret package (Shepard et al., 1987; Kuhn, 2008; Kuhn, 2012).
A total of 30,814 arthropods representing 24 species were captured in sweep netting across all sampling periods. The recorded arthropods found in this study are presented in Table 2. The two sampling years and three sampling times in each year were comparable, with 11,982 individuals of 22 species recorded in 2018 and 18,832 individuals representing 24 species captured in 2019. Among the sampled arthropods, 18,972 specimens were identified as pest species, and 11,842 specimens were identified as natural enemies (NE), which serve as biological control agents in rice fields. Approximately twice as many pests were found during the second sampling year compared to the first year, with 12,810 pests of 18 species captured in 2019 and 6,162 pests of 16 species in 2018. Approximately similar quantities of NE were observed in both sampling years, with 5,820 in 2018 and 6,022 of 6 species in 2019. The abundance of insect fauna in the three geographical locations is presented in Supplementary Figure S2.
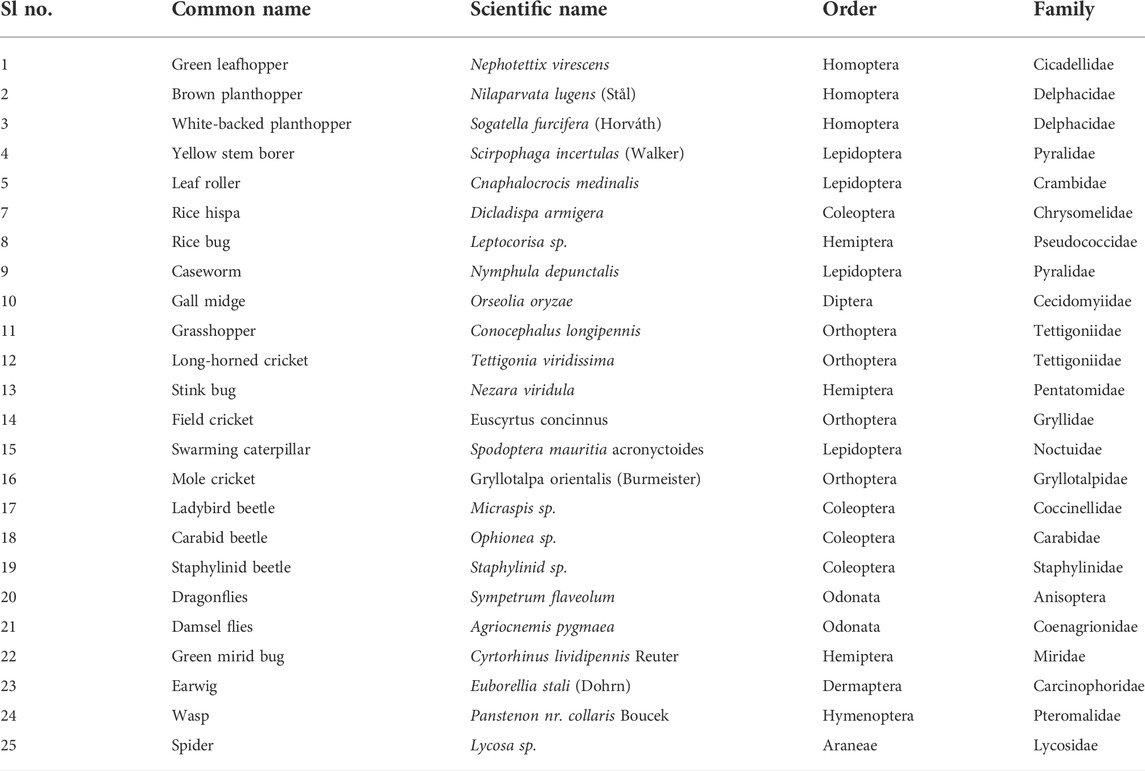
TABLE 2. List of arthropods found in rice fields during the study period. The arthropods were recorded using sweep netting. A total of 20 complete sweeps were run randomly at the canopy level.
The species richness and diversity of arthropods in three crop periods varied among the geographic locations (Figure 1). Within each location, crop phenology showed a significant effect on the species richness (F = 6.106, p = 0.036 for 2018 and F = 41.684, p < 0.01 for 2019), with the highest species richness observed in Chattogram, followed by Satkhira and Patuakhali (Figure 1). The highest species richness was observed in the mid-tillering stage of crop irrespective of year and location. Likewise, species diversity (Shanon index) of rice insects observed in three crop phonologies was also varied by geographical locations. Comparative species diversity index (Shanon index) in three geographical locations is presented in Figure 2.
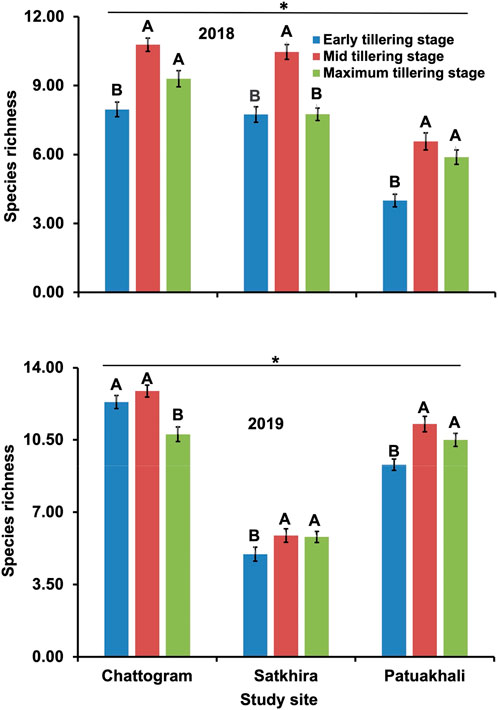
FIGURE 1. Comparative graphical representation of species richness in three geographic locations. Diversity measured at early tillering stage, mid tillering stage and maximum tillering stage of 2018 (upper figure) and at early, mid, maximum tillering stage values, which increased in 2019 (lower figure). This is remarkably so in Patuakhali’s early tillering stage while Satkhira looks same (despite the maximum tillering stage having increased). In Chattogram, the mid tillering stage has decreased in 2019 but, overall, the mean values of diversity tend to be increased i.e., mixed nature of land utilization.
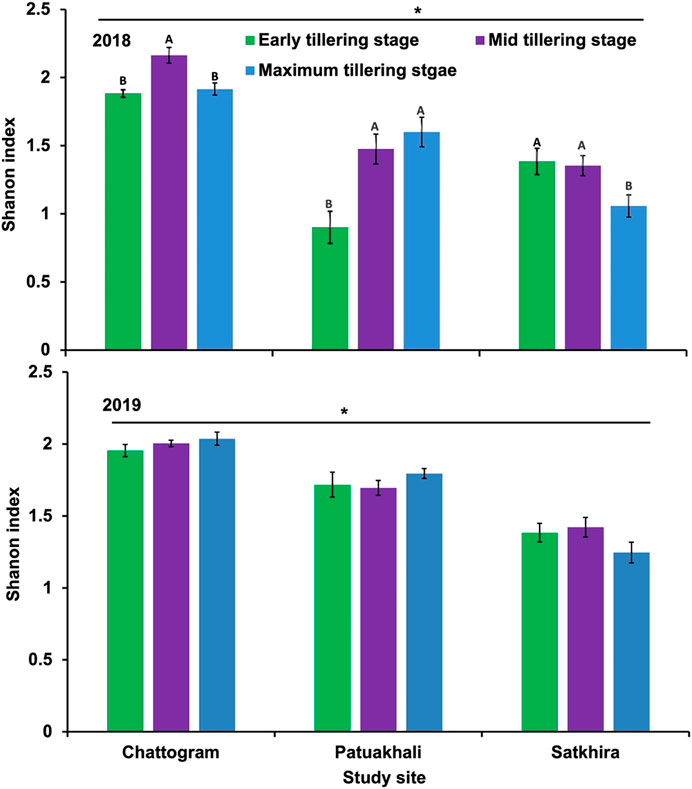
FIGURE 2. Comparative graphical representation of species diversity index (Shanon index) in three geographic locations. Diversity measured at early tillering stage, mid tillering stage and maximum stage of 2018 (upper figure) and at early, mid, and maximum tillering stage, which have increased in 2019 (lower Figure 2. Notably, early tillering in Patuakhali increased the most while Satkhira seems constant (albeit with an increased maximum tillering stage). In Chattogram mid tillering stage has decreased in 2019, while overall diversity mean values increased, i.e. mixed nature of land utilization.
The highest Shanon diversity index was observed in Chattogram, followed by Patuakhali and Satkhira (Figure 2). We also measured and compared similarity indices for all three sites. Table 3 presents the Czekanowski coefficient and SED for each site. The largest Czekanowski coefficient (0.46) and lowest SED score (1,538) observed between Chattogram and Satkhira indicates these two sites are most similar to each other in terms of composition.
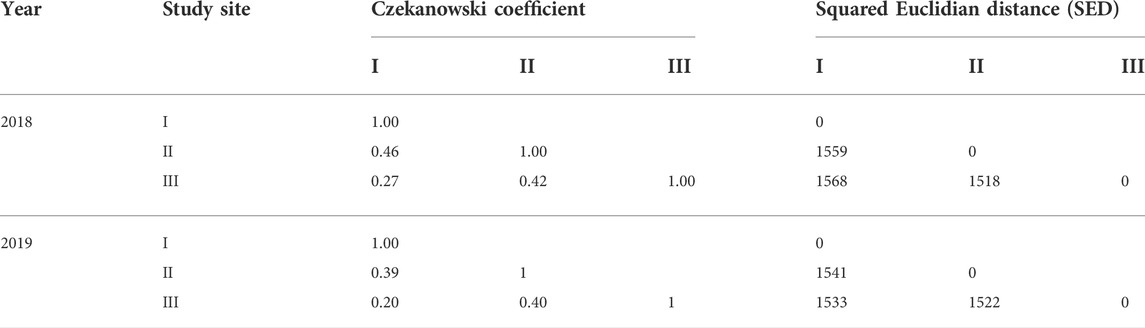
TABLE 3. Czekanowski coefficient and squared Euclidean distance (SED) values of three study sites. I: Chattogram, II: Satkhira, and III: Patuakhali.
The recorded arthropods were further classified as natural enemies (NE) (including predators and parasitoids) and herbivores based on their food habits (Table 4). The NE guild was dominated by the spiders followed by green mirid bug (GMB), ladybird beetle (LBB), dragonflies, damsel flies, and staphylinid beetle. Thus, it is evident that spiders were the most dominant predator in all three study sites. Other collected NE were carabid beetle, wasps, and earwig. In contrast, the herbivorous guild was dominated by the member of Homoptera, followed by the Lepidoptera order. The numerically most captured preys/herbivores in the rice fields were brown planthopper (BPH), green leafhopper (GLH), white-backed planthopper (WBPH) and yellow stem borer (YSB). Geographic location also influenced the trophic guilds irrespective of crop phenology. Chattogram showed the highest number of natural enemies and herbivore guilds than the other two geographical locations.
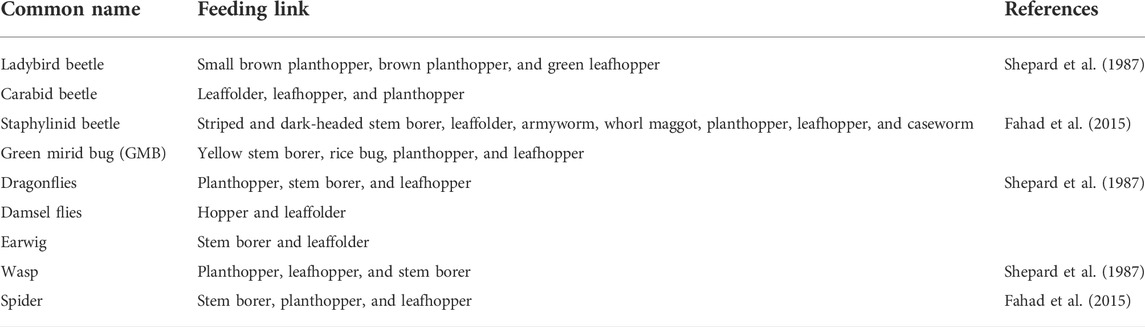
TABLE 4. Feeding links of natural enemies recorded from rice fields in the three study sites. Insects were recorded using sweep net at three crop phonologies.
The association of different identified natural enemy (NE) and their respective host was also analyzed, as presented in Figure 3. Total NE showed significant association with total insect pest prevailed in rice field (R2 = 0.668, p = 0.04697). Green mirid bug and spider displayed significant association with most of their prey, such as brown planthopper and green leafhopper (Figure 3). The highest NE prey interaction was observed between yellow stem borer (adult) and dragonflies (R2 = 0.939, p = 0.0486), followed by brown planthopper and green mirid bug (R2 = 0.761, p = 0.0232), green leafhopper and spider (R2 = 0.632, p = 0.0485), brown planthopper and spider (R2 = 0.537, p = 0.0482), and green leafhopper and green mirid bug (R2 = 0.474, p = 0.1183) (Figure 3). Thus, it was found that the prey (host) and their respective NE present in the rice field are interdependent on each other.
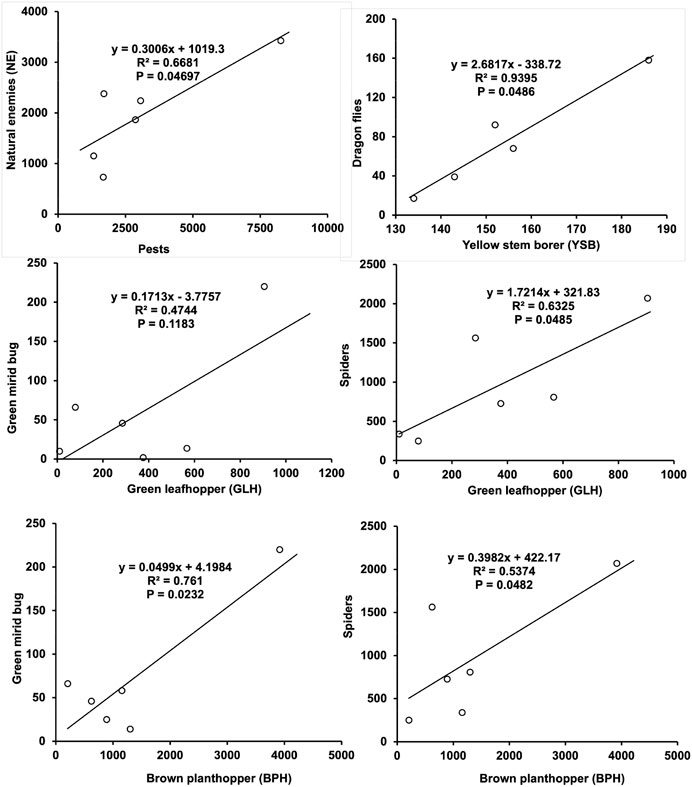
FIGURE 3. Simple linear regression showing natural enemy–prey association between important economic insect pest species in rice. Spatio-temporal changes of the landscape and LUM index.
Landscape changes from 2018–2019 specify some changes in land uses of three respective study locations. In Chattogram, high-density settlement areas increased in 2019, followed by low-density settled areas. Mainly, the northern and north-eastern part of the district forest and barren lands are converted into settlements, and comparatively extensive and intensive agriculture are increased, especially along the river lines in the southern and south-eastern parts (Figures 4A and D). North-western grids display the huge changes of wetlands to low-density settlements with the increased population. The developed agricultural sectors have intensified the mixed nature in LUM index 0.59–0.79 and found significantly highly diversified to very highly diversity > 7.9 (Figure 5A). The Satkhira exhibits (Figures 4B and E) different kinds of landscape changes, that is, 40% of extensive agricultural land and lands without crops are converted to shrimp cultivation and grid no 40–54 in the southern part settled area are increased with extensive paddy cultivation. Land transformation mainly has occupied the northern part and north-eastern grid areas and is visualized in the LUM index, where 80% of grids under highly diversified (0.59–0.79), that is, mixed nature of landscape (Figure 5B). Patuakhali (Figure 5C) exhibited homogeneous LUM indices, indicating most of the areas are moderately (0.39–0.59) to poorly diversified (0.19–0.39). In fact, highly diversified grids occupy only 25% of the areas where settlement has increased with agriculture (Figures 4C,F).
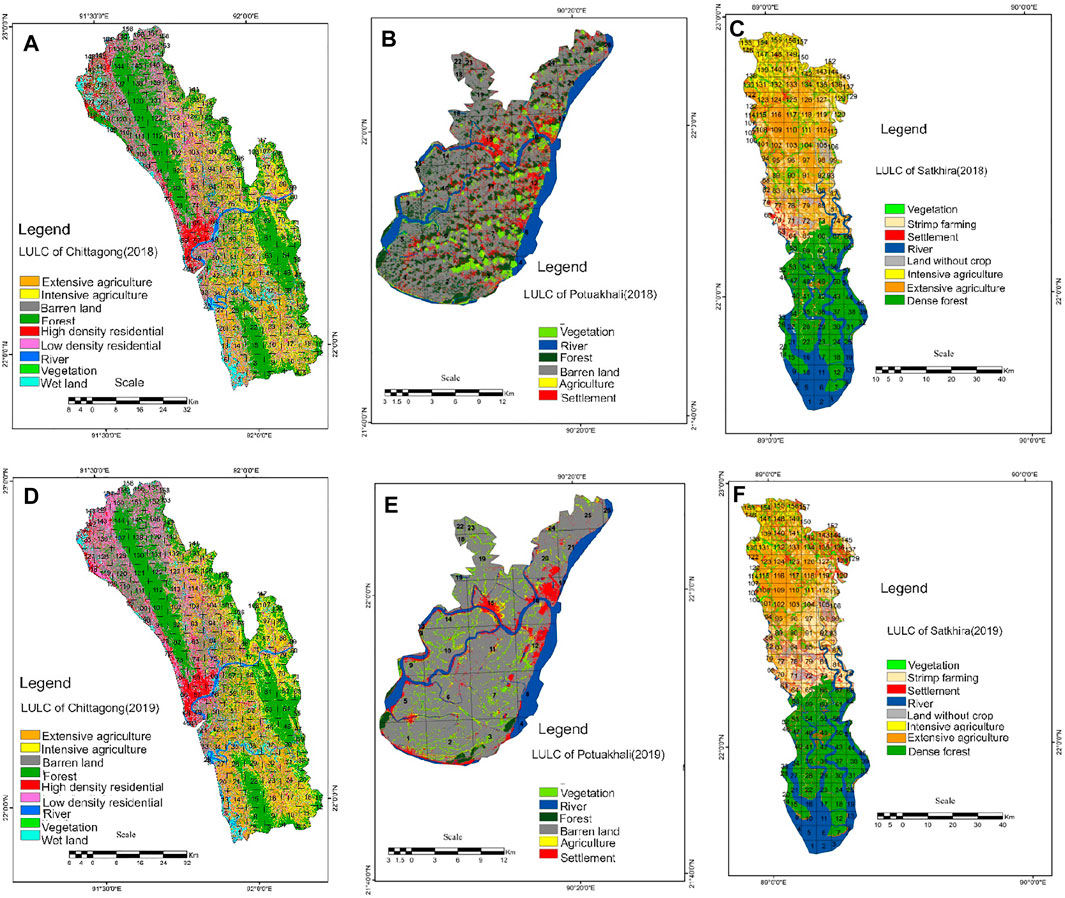
FIGURE 4. Extracted land use/land cover change from Landsat 8 data of 2018 (upper) and 2019 (lower). (A and D) Grid-wise comparison of two respective years of Chattogram; (B and E) Patuakhali and (C and F) Satkhira. The comparative maps detect the spatial changes of land uses; in Chattogram, the north-eastern part and south-eastern part are mostly changed; in Satkhira, transformation took place in the northern and north-eastern section; and in Patuakhali, changed grids are mostly visible in the eastern part of the district.
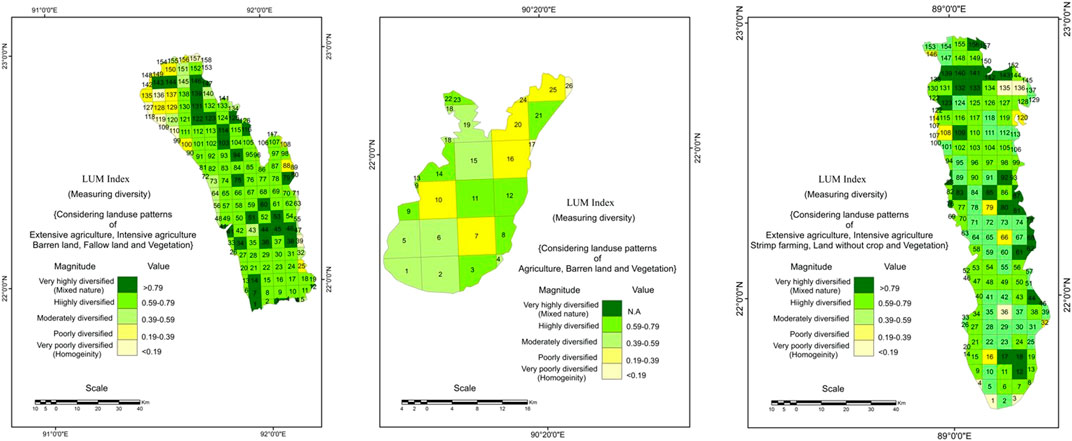
FIGURE 5. Calculated LUM index for measuring the diversity of 2019 considering the grid method; (A) in Chattogram, most of the areas are under highly diversified (0.59–0.79); (B) in Patuakhali, the area is poorly to moderately diversified because of its geographical location as it belongs to the coastal area and % of waste land is maximum resulting the homogeneous character; and (C) in Satkhira, moderately and highly diversified grids are dominant.
Population fluctuation also depends upon vegetative biodiversity and intensity. Insects’ feeding and multiplication were higher on extensively higher land use mix index areas. Each geographic location has a unique LULC pattern, as described previously. More or less similar LULC pattern was observed in two consecutive years 2018 and 2019 in each geographic location (Figure 6). The best-fitting model shows that the agricultural area in each location has a significant impact on species richness. Figure 6A depicts that species richness increases with the increase of agricultural area. Similarly, residential area has significant impact on species richness (F = 12.11, p = 0.025). However, it has no significant impact on species diversity (p > 0.05). Wide differences of LUM indices also significantly influenced species diversity, with a significant positive impact on species diversity (F = 9.344, P = 0.038). Best-fitted modelling showed that species diversity increased with increasing LUM indices (Figure 6A), though not species abundance or species richness (p > 0.05).
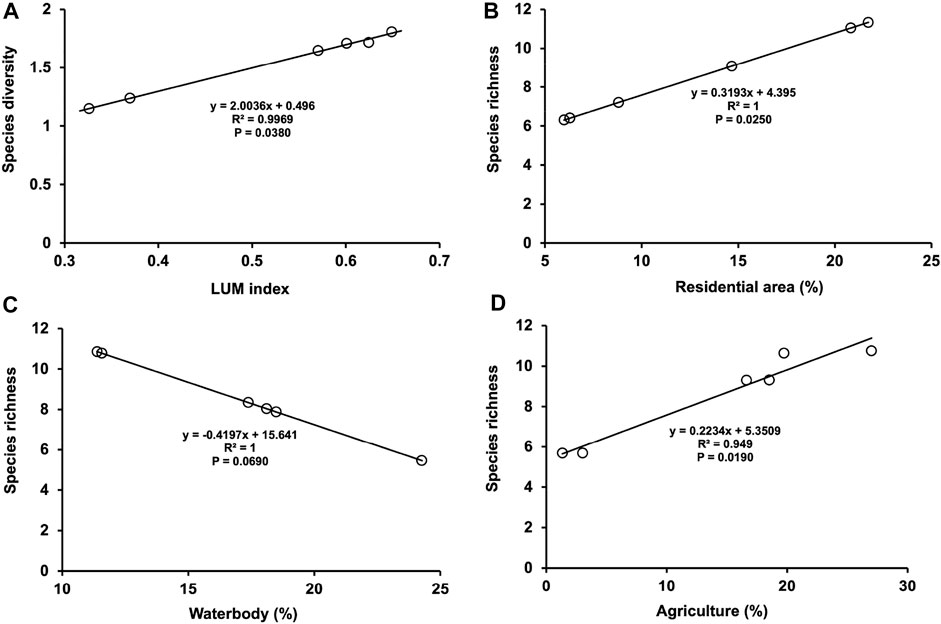
FIGURE 6. Model estimated species diversity (predicted Shanon index) and predicted species richness against different landscape variables and land use mix (LUM) indexes.
Landscape factors contributing most to predicting species diversity were also analyzed using a neural network approach. By this model, vegetation, we found that forest, and water body contributed most to predicting the total number of species (Figure 7A). As opposed to the total number of species, we observed that extensive agriculture and forest are the most impactful factors influencing species richness (Figure 7B). In contrast, barren land and high-density residential land and intensive agriculture are the top three factors affecting species diversity (Figure 7C).
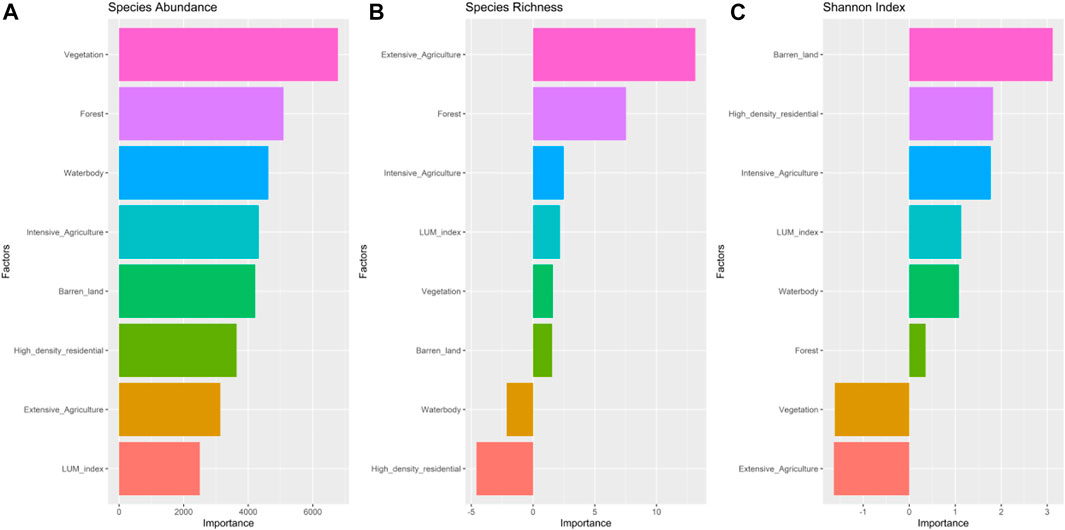
FIGURE 7. Weight of different landscape factors predicting species abundance (A), species richness (B), and Shanon index (C). Weight of each factor contributing most to predicting the species diversity was analyzed using a neural network approach.
This study investigated the relationship between species diversity of rice arthropods and landscape using three distinct geographical regions in Bangladesh. Consequently, we detected a significant difference in landscape diversity in the three study sites, with unique landscape diversity existing around the experimental plots in each geographical location. Thus, we highlighted the abundance, species richness and diversity of rice arthropods in relation to landscape diversity. Land use land cover (LULC) and landscape diversity (LUM index) were analyzed to correlate with arthropod species diversity. At the same time, the neural network approach was used to find the highest predictor of arthropod species diversity. Landscape diversity is generally considered to enhance insect species number in an area (Jonsen and Fahrig, 1997; Krauss et al., 2003). Similarly, our study shows that geographic location with higher landscape diversity has higher arthropod species diversity (Figures 1, 2; Supplementary Figure S2).
The abundance of prey and NE data represents the cyclic function of a food web composition (Ghani and Maalik, 2020). However, the fluctuation of one component influences the abundance of other components in the food web structure of any ecosystem functioning (Rana et al., 2012). This indicates that ecological agitation is an important factor in an ecological breakdown in an agricultural ecosystem. Our study shows that NE has an ecological association with insect pests observed in rice fields. The feeding link species shows a positive correlation with the prey population (Figure 3). This indicates that the displacement of one component of a food web system disrupts the ecosystem functioning in an agricultural system.
Insect predators can share the same prey species and similarly prey species are preferred over other species (Omkar and James, 1997). We found that predator spiders share two prey species, including green leafhoppers (GLH) and brown planthopper (BPH), while dragonflies share only one prey, yellow stem-borers (YSP) (Figure 3). Likewise, the green mirid bug (GMB) shares BPH and GLH but prefers the former over the latter (Figure 3). A similar observation was found in other reports. Ghani and Maalik (2020) reported that Coccinella septempunctata is significantly associated with all its preys. This predator shows a general predator but prefers Diuraphis noxia over Schizaphis graminum. The C. septempunctata is known as a general predator (Rana et al., 2012), and most predators prefer two prey species, D. noxia and S. graminum, in wheat compared to other prey. The predators, C. septempunctata and Coccinella hieroglyphica, have a significant association with D. noxia (Ghani and Maalik, 2020). Some predators demonstrate significant consumption affinity to single prey, which indicates that indiscriminate application of insecticide reduced the other prey species in crop fields. Spraying of insecticide in crop fields reduces the species (Inayat et al., 2011). This can be happened due to the handling of prey by different predator species. Our study shows the constant prey-NE association in rice fields. Moreover, spraying of insecticide influences insect pest and predator or parasitoid ratio in the agro-ecosystem. The effect of pesticides on prey and NE association will be more in the future since the application of insecticides is increasing day by day (Siddiqui, 2005; Tariq et al., 2007). This effect can be more important in Bangladesh since most rice growers apply insecticide 2–4 times in each rice-growing season (Hoque and Haque, 2014), and there are three rice-growing seasons per year (Ali et al., 2019).
Our study shows that crop phenology influences significant species richness in rice fields, and significantly higher species richness at maximum tillering stages. This result is contrastingly different from Bakar and Khan (2016), who reported the highest species richness in the early tillering stage of rice growth. However, their findings derived from an Boro rice experiment conducted during the dry season in Bangladesh. The present study examined T. Aman rice grown during the rainfed wet season. Earlier, Ali et al. (2020) reported that the abundance of insects in rice is influenced by season. Maximum tillering stages of rice growth provide attractive shelter and food sources, which induce a higher number of insects in the field. In addition, our study also shows that geographical location has a significant impact on species richness, and higher species richness was observed in Chattogram (Figure 1). A similar effect was observed in other studies. Ghani and Maalik (2020) reported that Faisalabad has higher species diversity than Sialkot. Local weather parameters such as air temperature, humidity, solar radiation, wind velocity and rainfall could influence the number of insects, abundance and diversity in a crop field (Adams et al., 2020). However, we did not consider weather parameters in our study.
Overall, the rice agro-ecosystem and impact of natural pest control system alter with the existing landscape diversity, mainly in Satkhira and Chattogram. The study is also concerned with the comparison of four respective indices such as diversity, early tillering stage, mid-tillering stage, and maximum tillering stage. The mean values of 2018–2019 of three locations encompass increased values in 2019, remarkably in Patuakhali, where the early tillering stage increased abundantly (0.8–1.7). In Satkhira, it remained the same, although the value of the maximum tillering stage increased (1.0–1.2). In Chattogram, the mid-tillering stage decreased in 2019 (2.1–2), but overall, the mean values of diversity trended to increase, that is, mixed nature of land utilization with the increased agricultural lands with shrimp cultivation and settlement. These land use changing patterns might influence the arthropod diversity in rice fields.
The land use mix (LUM) index increases the species diversity in rice fields. This can be explained that landscape diversity induced a higher number of arthropod species in rice fields in all geographical locations. Landscape diversity increases the insect species number in crop fields (Jonsen and Fahrig, 1997; Krauss et al., 2003). Our study shows that a significant correlation exists between the LUM index and species diversity (Figure 6). The higher species diversity index observed in higher LUM index as compared to lower LUM index might be attributed to the more diverse vegetation and land use that made a suitable macro and micro climate for arthropod species in an area. This result is in agreement with the finding of Adjaloo et al. (2012), who reported higher species richness observed in heavily shaded area farms than in widely spaced farms with less canopy cover. Adeduntan (2009) stated that a particular area with physical complexity affects the diversity and abundance of insects. Therefore, higher species diversity observed in higher LUM index areas might be attributed to the more diverse landscape. More LUM index area has diverse vegetation, trees, and plantations, which could serve as suitable food and shelter for many insect species, which ultimately induce higher species diversity.
Neural network analysis identified variable has a strong weight in the models. Each factor shows a different weight to species abundance, species richness, and Shanon index (Figure 7). For example, vegetation shows the most influential factor on species abundance, but it poorly influences the species richness and Shanon index (Figure 7). Similarly, a high-density residential area shows a positive influential factor on species abundance and Shanon index, but it shows a negative weight on species richness. Thus, landscape composition can differently affect the different diversity index of arthropods in crop fields. The variables indicating LUM perform poorly in species abundance but highly in species diversity. This type of result can be observed in other reports. Gil-Tena et al. (2010) reported that all the variables show positive signs, but aspect diversity, temperature, public forest, and road and population density, display an inverse relationship.
In our experiment, abundance, species diversity, and species richness of arthropods were found in rice fields varied in geographic locations and crop phenology due to landscape diversity. The most abundant species of predator was spiders, and the pest groups were BPH, GLH, and YSB in rice fields. Higher abundance, diversity, and species richness were observed in Chattogram, with higher landscape diversity (LUM index). Both species richness and abundance were dominated in maximum tillering stages of rice growth. Species diversity increased with the increase in the LUM index, which shows that the areas having more diverse landscapes can provide higher ecosystem service providers, such as natural enemies. We observed a higher degree of turnover in species number of pests and natural enemies in Chattogram, with diverse landscapes along land-cover gradients of higher agriculture. The shifts in species composition through land-cover gradients are attributed to the changes in functional group abundances of pests and natural enemies. Though we did not assess how this change transforms into ecosystem services such as pest control and pollination, other studies recommend that wider spatial variation in species structure across the agricultural landscape may supply insurance in the ecosystem (Yanchi and Loreau, 1999; Tscharntke et al., 2007).
Our findings may provide some preliminary information for biodiversity management and conservation paradigms. This would involve making proactive conservation and management plans, in which land use change management treatments are considered together with different types of land use changes. In this sense, new tree plantation programs (forests) in agricultural landscapes or nearer to agricultural land and roadside forest tree plantations may enhance or help conserve biodiversity. In this way, this study highlights the importance of considering prevailing landscape approaches when planning for conservation of diverse local landscape system (and, in turn, afford diverse food for beneficial insects). This demonstration of landscape diversity as a crucial factor in maintaining arthropod species diversity in rice fields highlights a need to take this factor into consideration in biodiversity conservation program.
The original contributions presented in the study are included in the article/Supplementary Material; further inquiries can be directed to the corresponding authors.
MPA, SSH, and DL designed the experiments. MPA, SSH, and MTHH executed the project activities. MPA designed the methodology. MPA. and MMMK generated the data. MPA, MMMK and JD compiled data. MPA, MB, GC-O and XQ analyzed the data. MPA, MB, XQ, GC-O, JD and MTHH wrote the original and revised manuscript. DAL, AH, EFA, PK, BRP, MTHH and XQ revised and edited the manuscript for clarity. All of the authors read and approved the final manuscript.
The work was funded by the USAID-sponsored Partnerships for Enhanced Engagement in Research (PEER) Program’s Cycle 6 project, entitled “Ecosystem services in a changing climate; assessing critical services in Bangladesh rice production landscapes.” PEER is implemented by the U.S. National Academy of Sciences (NAS) via USAID and NAS Prime Agreement No. AID-OAA-A-11 -00012. DAL (US partner on the PEER grant) acknowledges support from the NSF Long-term Ecological Research Program (DEB 1832042) at the Kellogg Biological Station, Michigan State University South Asia Partnership, and MSU AgBioResearch.
The authors thank the staff and scientists of the Entomology Division for helping in the greenhouse work and the Bangladesh Rice Research Institute (BRRI) for providing other necessary support. The authors also acknowledge the PEER-recruited field assistants who helped to collect data from the field. The authors would like to extend their sincere appreciation to the Researchers Supporting Project Number (RSP-2021/134), King Saud University, Riyadh, Saudi Arabia.
The authors declare that the research was conducted in the absence of any commercial or financial relationships that could be construed as a potential conflict of interest.
All claims expressed in this article are solely those of the authors and do not necessarily represent those of their affiliated organizations, or those of the publisher, the editors, and the reviewers. Any product that may be evaluated in this article, or claim that may be made by its manufacturer, is not guaranteed or endorsed by the publisher.
The Supplementary Material for this article can be found online at: https://www.frontiersin.org/articles/10.3389/fenvs.2022.740287/full#supplementary-material
Adams, B. J., Li, E., Bahlai, C. A., Meineke, E. K., McGlynn, T. P., and Brown, B. V. (2020). Local and landscape scale variables shape insect diversity in an urban biodiversity hot spot. Ecol. Appl. 30, e02089. doi:10.1002/eap.2089
Adeduntan, S. (2009). Influence of human activities on diversity and abundance of insects in akure forest reserve, ondo state, Nigeria. Int. J. Biol. Chem. Sci. 3 (6), 1320–1335. doi:10.4314/ijbcs.v3i6.53152
Adjaloo, M. K., Oduro, W., and Mochiah, M. B. (2012). Spatial distribution of insect assemblage in cocoa farms in relation to natural forest. J. Appl. Biosc. 54, 3870–3879.
Ali, M. P., Bari, M. N., Ahmed, N., Kabir, M. M. M., Afrin, S., Zaman, M. A. U., et al. (2017). Rice production without insecticide in smallholder farmer's field. Front. Environ. Sci. 5, 16. doi:10.3389/fenvs.2017.00016
Ali, M. P., Bari, M. N., Haque, S. S., Kabir, M. M. M., Afrin, S., Nowrin, F., et al. (2019). Establishing next-generation pest control services in rice fields: Eco-agriculture. Sci. Rep. 9, 10180. doi:10.1038/s41598-019-46688-6
Ali, M. P., Kabir, M. M. M., Haque, S. S., Qin, X., Nasrin, S., Landis, D., et al. (2020). Farmer's behavior in pesticide use: Insights study from smallholder and intensive agricultural farms in Bangladesh. Sci. Total Environ. 747, 141160. doi:10.1016/j.scitotenv.2020.141160
Annika, L., Kormann, U. G., Tscharntke, T., Clough, Y., Baillod, A. B., Sirami, C., et al. (20182018). Landscape configurational heterogeneity by small-scale agriculture, not crop diversity, maintains pollinators and plant reproduction in Western Europe. Proc. R. Soc. B 285, 20172242. doi:10.1098/rspb.2017.2242
Antrop, M., and Eetvelde, V. V. (2008). Mechanisms in recent landscape transformation. WIT Transac. Built Environ. 100, 183–192. Conference: GEO-ENVIRONMENT 2008. doi:10.2495/GEO080181
Bakar, M. A., and Khan, M. M. H. (2016). Diversity of insect pests and natural enemies as influenced by growth stages and pest management practices in rice. Bangladesh J. Agric. Res. 41, 461–470. doi:10.3329/bjar.v41i3.29718
Barrion, A. T., and Litsinger, J. A. (1994). Taxonomy of rice insect pests and their arthropod parasites and predators. Biol. Manag. Rice Insects, 13–36.
Barros, F. M., Peres, C. A., Pizo, M. A., and Ribeiro, M. C. (2019). Divergent flows of avian-mediated ecosystem services across forest matrix interfaces in human-modified landscapes. Landsc. Ecol. 34, 879–894. doi:10.1007/s10980-019-00812-z
BBS (2017). Yearbook of agricultural statistics of Bangladesh 2016. Dhaka, Bangladesh: Bangladesh Bureau of Statistics.
Bianchi, F. J., Booij, C. J. H., and Tscharntke, T. (2006). Sustainable pest regulation in agricultural landscapes: A review on landscape composition, biodiversity and natural pest control. Proc. R. Soc. B 273, 1715–1727. doi:10.1098/rspb.2006.3530
Bianchi, F. J., Schellhorn, N. A., and Cunningham, S. A. (2013). Habitat functionality for the ecosystem service of pest control: Reproduction and feeding sites of pests and natural enemies. Agric. For. Entomol. 15, 12–23. doi:10.1111/j.1461-9563.2012.00586.x
Brudvig, L. A. (2011). The restoration of biodiversity: Where has research been and where does it need to go? Am. J. Bot. 98, 549–558. doi:10.3732/ajb.1000285
Clement, M. T., Chi, G., and Ho, H. C. (2015). Urbanization and land-use change: A human Ecology of deforestation across the United States, 2001- 2006. Sociol. Inq. 85 (4), 628–653. doi:10.1111/soin.12097
Clifford, H. T., and Stephenson, W. (1975). An introduction to numerical classification. New York-San Francisco-London: Academic Press.
Dennis, P., Young, M. R., and Gordon, I. J. (1998). Distribution and abundance of small insects and arachnids in relation to structural heterogeneity of grazed, indigenous grasslands. Ecol. Entomol. 23, 253–264. doi:10.1046/j.1365-2311.1998.00135.x
Fahad, S., Nie, L., Wu, C., Liu, X., Li, L., Cui, K., et al. (2015). Rice pest management and biological control. Sustain. Agric. Rev. 16, 85–106. doi:10.1007/978-3-319-16988-0_4
Foster, C. W., Neumann, J. L., and Holloway, G. J. (2019). Linking mesoscale landscape heterogeneity and biodiversity: Gardens and tree cover significantly modify flower-visiting beetle communities. Landsc. Ecol. 34, 1081–1095. doi:10.1007/s10980-019-00822-x
Frank, L. D., Schmid, T. L., Sallis, J. F., Chapman, J., and Saelens, B. E. (2005). Linking objectively measured physical activity with objectively measured urban form: Findings from SMARTRAQ. Am. J. Prev. Med. 28, 117–125. doi:10.1016/j.amepre.2004.11.001
Ghani, A, and Maalik, S. (2020). Assessment of diversity and relative abundance of insect fauna associated with Triticum aestivum from district Sialkot, Pakistan. J. King Saud Univ. - Sci. 32, 986–995. doi:10.1016/j.jksus.2019.09.002
Gil-Tena, S. A., Vega-García, C., Brotons, L., and Saura, S. (2010). Modelling bird species richness with neural networks for forest landscape management in NE. For. Syst. 19, 113–125. doi:10.5424/fs/201019S-9290
Halling, S-I. (2011). Tourism as interaction of landscapes – opportunities and obstacles on the way to sustainable tourism development in Lamu Island, Kenya. Forskarskolan i Geografi, Kulturgeografiska institutionen. Uppsala: Uppsala univ, 118.
Hass, A. L., Kormann, U. G., Tscharntke, T., Clough, Y., Baillod, A. B., Sirami, C., et al. (2018). Landscape configurational heterogeneity by small-scale agriculture, not crop diversity, maintains pollinators and plant reproduction in Western Europe. Proc. R. Soc. B 285, 20172242. doi:10.1098/rspb.2017.2242
Hatamia, M., and Shafieardekani, M. (2014). The effect of industrialization on land use changes; evidence fromintermediate cities of Iran. Intern. J. Curr. Life Sci. 4 (12), 11899–11902.
Heong, K. L., Aquino, G. B., and Barrion, A. T. (1991). Arthropod community structures of rice ecosystems in the Philippines. Bull. Entomol. Res. 81, 407–416. doi:10.1017/s0007485300031977
Hoque, M. Z., and Haque, M. E. (2014). Socio-economic factors influencing profitability of rice seed production in selected areas of Bangladesh. Agriculturists 12, 33–40. doi:10.3329/agric.v12i1.19578
Hossai, M., Arshad, M., Qian, L., Zhao, M., Mehmood, Y., and Kaechele, H. (2014). Economics ecological in’ method ricardian of application an: Bangladesh in farming. Ecol. Econ. 164, 106354. IRI (Society and Climate Resources ENSO). doi:10.1016/j.ecolecon.2019.106354
Inayat, T. P., Rana, S. A., Rana, N., Ruby, T., Siddiqui, M. J. I., Khan, M. N. A., et al. (2011). Predator-prey relationship among selected species in the croplands of central Punjab, Pakistan. Pak. J. Agric. Sci. 48, 149–153.
Islama, K., Jashimuddin, M., Nath, B., and Nath, T. K. (2018). Land use classification and change detection by using multi-temporal remotely sensed imagery: The case of Chunati wildlife sanctuary, Bangladesh. Egypt. J. Remote Sens. Space Sci. 21, 37–47. doi:10.1016/j.ejrs.2016.12.005
Jonsen, I. D., and Fahrig, L. (1997). Response of generalist and specialist insect herbivores to landscape spatial structure. Landsc. Ecol. 12, 185–197.
Kabir, R., Hafiz, T. A., Ball, Emma, and Caldwell, Kay (2016). Climate change impact: The experience of the coastal areas of Bangladesh affected by cyclones sidr and aila. J. Environ. Public Health 2016, 9654753. doi:10.1155/2016/9654753
Karim, M. F., and Mimura, N. (2008). Impacts of climate change and sea-level rise on cyclonic storm surge floods in Bangladesh. Glob. Environ. Change 18, 490–500. doi:10.1016/j.gloenvcha.2008.05.002
Khan, S. M., Huq, S., and Shamsuddoha, M. (2012). ‘The Bangladesh national climate funds’. LDC paper series. London: International Institute for Environment and Development.
Koomen, E., Opdam, P., and Steingröver, E. (2012). Adapting complex multi-level landscape systems to climate change. Landsc. Ecol. 27, 469–471. doi:10.1007/s10980-012-9721-8
Krauss, J., Steffan Dewenter, I., and Tscharntke, T. (2003). How does landscape context contribute to effects of habitat fragmentation on diversity and population density of butterflies? J. Biogeogr. 30, 889–900. doi:10.1046/j.1365-2699.2003.00878.x
Kuhn, M. (2008). Building predictive models in R using the caret package. J. Stat. Softw. 28, 1–26. doi:10.18637/jss.v028.i05
Kuhn, M. (2012). Variable selection using the caret package. URL: http://cran.cermin.lipi.go.id/web/packages/caret/vignettes/caretSelection. Pdf.
Landis, D. A., Wratten, S. D., and Gurr, G. M. (2000). Habitat management to conserve natural enemies of arthropod pests in agriculture. Annu. Rev. Entomol. 45, 175–201. doi:10.1146/annurev.ento.45.1.175
Lucey, J. M., Tawatao, N., Senior, M. J., Chey, V. K., Benedick, S., Hamer, K. C., et al. (2014). Tropical forest fragments contribute to species richness in adjacent oil palm plantations. Biol. Conserv. 169, 268–276. doi:10.1016/j.biocon.2013.11.014
Magurran, A. E. (1988). Ecological diversity and its measurement. Princeton: Princeton University Press.
Mahmuduzzaman, M., and Zahir Uddin Ahmed, A. K. M. (2014). Nuruzzaman, fazle rabbi sadeque ahmed, causes of salinity intrusion in coastal belt of Bangladesh. Int. J. Plant Res. 4 (4A), 8–13. doi:10.5923/s.plant.201401.02
Margalef, R. (1958). “Temporal succession and spatial heterogeneity in phytoplankton,” in Perspectives in marine biology. Editor A. A. Buzzati-Traverso (Berkeley: Univ. Calif. Press), 323–347.
Masum, M. R. A., and Khan, M. Z. H. (2020). Climate change mitigation finance and project implementation in Bangladesh: Governance challenges and way forward. Dhaka: Transparency International Bangladesh.
Olden, J. D., and Jackson, D. A. (2002). Illuminating the “black box”: A randomization approach for understanding variable contributions in artificial neural networks. Ecol. Modell. 154, 135–150. doi:10.1016/s0304-3800(02)00064-9
Omkar, S., and James, B. E. (1997). Prey preference of a lady beetle, Coccinella septempunctata Linnaeus (Coleoptera: Coccinellidae). J. Adv. Zool. 18, 96–97.
Parvin, G. A., Ali, H., Fujita, K., Abedin, A., Habiba, U., and Shaw, R. (2016). “Land use change in southwestern coastal Bangladesh: Consequence to food and water supply,” in Land use management in disaster risk reduction (Tokyo: Springer), 381–401.
Rana, A., Saharan, B., Nain, L., Prasanna, R., and Shivay, Y. S. (2012). Enhancing micronutrient uptake and yield of wheat through bacterial PGPR consortia. Soil Sci. Plant Nutr. 58, 573–582. doi:10.1080/00380768.2012.716750
Rand, T. A., Tylianakis, J. M., and Tscharntke, T. (2006). Spillover edge effects: The dispersal of agriculturally subsidized insect natural enemies into adjacent natural habitats. Ecol. Lett. 9, 603–614. doi:10.1111/j.1461-0248.2006.00911.x
Rusch, A., Valantin-Morison, M., Sarthou, J. P., and Roger-Estrade, J. (2010). Biological control of insect pests in agroecosystems: Effects of crop management, farming systems, and seminatural habitats at the landscape scale: A review. Adv. Agron. 109, 219–259. doi:10.1016/B978-0-12-385040-9.00006-2
Rwanga, S. S., and Ndambuki, J. M. (2017). Accuracy assessment of land use/land cover classification using remote sensing and GIS. Int. J. Geosciences 8, 611–622. doi:10.4236/ijg.2017.84033
Schellhorn, N. A., Bianchi, F. J. J. A., and Hsu, C. L. (2014). Movement of entomophagous arthropods in agricultural landscapes: Links to pest suppression. Annu. Rev. Entomol. 59, 559–581. doi:10.1146/annurev-ento-011613-161952
Shepard, B. M., Barrion, A. T., and Litsinger, J. A.Int. Rice Res. Inst (1987). Friends of the rice farmer: Helpful insects, spiders, and pathogens. Cham: Springer.
Siddiqui, Z. A. (2005). “PGPR: Prospective biocontrol agents of plant pathogens,” in PGPR: Biocontrol and biofertilization (Dordrecht: Springer), 111–142.
Soil Resources Development Institute (SRDI) (2010). Saline soils of Bangladesh; SRDI. Dhaka, Bangladesh: Ministry of Agriculture.
Symondson, W. O. C., Sunderland, K. D., and Greenstone, M. H. (2002). Can generalist predators be effective biocontrol agents? Annu. Rev. Entomol. 47, 561–594. doi:10.1146/annurev.ento.47.091201.145240
Tariq, M. I., Afzal, S., Hussain, I., and Sultana, N. (2007). Pesticides exposure in Pakistan: A review. Environ. Int. 33, 1107–1122. doi:10.1016/j.envint.2007.07.012
Tscharntke, T., Bommarco, R., Clough, Y., Crist, T. O., Kleijn, D., Rand, T. A., et al. (2007). Conservation biological control and enemy diversity on a landscape scale. Biol. Control 43, 294–309. doi:10.1016/j.biocontrol.2007.08.006
Tscharntke, T., Tylianakis, J. M., Rand, T. A., Didham, R. K., Fahrig, L., Batary, P., et al. (2012). Landscape moderation of biodiversity patterns and processes eight hypotheses. Biol. Rev. 87, 661–685. doi:10.1111/j.1469-185x.2011.00216.x
United Nations (2017). World population prospects: The 2017 revision, key findings and advance tables. New york: United Nations.
USGS U.S. Geological Survey Landsat 8: U.S. 2018. Available online: https://pubs.usgs.gov/fs/2013/3060/. (accessed on Nov 12, 2018).
van Schalkwyk, J., Pryke, J. S., Samways, M. J., and Gaigher, R. (2021). Maintaining high vegetation structural diversity in the landscape promotes arthropod diversity in dynamic production areas. Landsc. Ecol. 36, 1773–1785. doi:10.1007/s10980-021-01253-3
Wang, X., Li, F. Y., Tang, K., Wang, Y., Suri, G., Bai, Z., et al. (2019). Land use alters relationships of grassland productivity with plant and arthropod diversity in Inner Mongolian grassland. Ecol. Appl. 00 (00), e02052. doi:10.1002/eap.2052
Wilby, A., Lan, L. P., Heong, K. L., Huyen, N. P. D., Quang, N. H., Minh, N. V., et al. (2006). Arthropod diversity and community structure in relation to land use in the Mekong Delta, Vietnam. Ecosystems 9, 538–549. doi:10.1007/s10021-006-0131-0
Keywords: landscape structure, land use change, arthropod diversity, rice, geographic location
Citation: Ali MP, Biswas M, Clemente-Orta G, Kabir MMM, Datta J, Haque SS, Qin X, Landis D, Kaur P, Pittendrigh BR and Howlader MTH (2022) Landscape diversity influences the arthropod species diversity in the rice field. Front. Environ. Sci. 10:740287. doi: 10.3389/fenvs.2022.740287
Received: 12 July 2021; Accepted: 30 June 2022;
Published: 05 October 2022.
Edited by:
Marco Malavasi, Czech University of Life Sciences Prague, CzechiaReviewed by:
Xunbing Huang, Linyi University, ChinaCopyright © 2022 Ali, Biswas, Clemente-Orta, Kabir, Datta, Haque, Qin, Landis, Kaur, Pittendrigh and Howlader. This is an open-access article distributed under the terms of the Creative Commons Attribution License (CC BY). The use, distribution or reproduction in other forums is permitted, provided the original author(s) and the copyright owner(s) are credited and that the original publication in this journal is cited, in accordance with accepted academic practice. No use, distribution or reproduction is permitted which does not comply with these terms.
*Correspondence: M. P. Ali, cGFubmFfYWxpQHlhaG9vLmNvbQ==; Xinghu Qin, cWlueGluZ2h1QGdtYWlsLmNvbQ==; M. T. H. Howlader, dG9mYXp6YWxoQGJhdS5lZHUuYmQ=
†ORCID: Abeer Hashem, orcid.org/0000-0001-6541-347X
Disclaimer: All claims expressed in this article are solely those of the authors and do not necessarily represent those of their affiliated organizations, or those of the publisher, the editors and the reviewers. Any product that may be evaluated in this article or claim that may be made by its manufacturer is not guaranteed or endorsed by the publisher.
Research integrity at Frontiers
Learn more about the work of our research integrity team to safeguard the quality of each article we publish.