 Zizhen Dong
 Ruowen Yang
 Jie Cao
 Lin Wang
94% of researchers rate our articles as excellent or good
Learn more about the work of our research integrity team to safeguard the quality of each article we publish.
Find out more
ORIGINAL RESEARCH article
Front. Environ. Sci., 09 January 2023
Sec. Atmosphere and Climate
Volume 10 - 2022 | https://doi.org/10.3389/fenvs.2022.1115698
This article is part of the Research TopicClimate-Environment Interactions under Global WarmingView all 25 articles
Observations indicate that the winter precipitation over Southeast Asia (SEAP) shows significantly increased trends from 1979 to 2014, which can be partly reproduced under the historical all-forcing simulations from the 12 Coupled Model Intercomparison Project Phase 6 (CMIP6) climate models. By analyzing separate external forcings run with the Detection and Attribution experiments, we find that the effects of anthropogenic forcing rather than natural variation play a primary role in driving the increasing of SEAP trends simulated in the historical all-forcing experiments. Further analysis indicate that the observed increasing trend is closely associated with the decadal shift of the Southeast Asian precipitation after the mid-1990s, which could be also driven by anthropogenic forcing to some extent. Anthropogenic forcing can favor a La Niña-like pattern of sea surface temperature (SST) warming in the tropical Pacific and result in the decadal increase of SEAP via the enhanced zonal SST gradient and the Pacific Walker circulation. This study thus provides some evidence of the impacts of anthropogenic forcing to drive recent changes in the winter SEAP.
Over the past several decades, prominent changes have been observed in global climate under global warming (e.g., Hoerling et al., 2010; Zhang et al., 2013; Li et al., 2015; Donat et al., 2016; Lu et al., 2020; Guo et al., 2022). In such, human-induced precipitation changes are among the most intuitive and serious impacts of climate changes, with potential effects on water resources, human society, infrastructure, agriculture, and ecosystems in most areas around the world (e.g., Liu et al., 2013; Polson et al., 2014; Lewis and Karoly, 2015; Li et al., 2017; Mukherjee et al., 2018; IPCC, 2021; Zhao et al., 2022). For example, Zhang et al. (2013) indicated that anthropogenic forcing has contributed to the strengthening of extreme precipitation over the land areas of the North Hemisphere during 1951–2005. They estimated that anthropogenic forcing strengthens the annual maximum 1 day precipitation in sampled North Hemisphere areas by 3.3% averagely. Hence, improving the knowledge of anthropogenic contribution to precipitation changes is a crucial issue of climate science. It can advance our understanding on the causes for climate changes in the observation, and is necessary and vital for decision makers to help guide their adaptation and mitigation strategies.
At present, a large number of studies have been denoted to examine the human-driven precipitation changes in many regions of the world, including East Asia (e.g., Li et al., 2017; Lu et al., 2020; Guo et al., 2022), India (Mukherjee et al., 2018; Singh et al., 2019), South America (Vera and Díaz, 2015), Europe (Peña-Angulo et al., 2020; Tabari et al., 2020), United States (Mascioli et al., 2016), Australia (Lewis and Karoly, 2015), and so on. For example, Zhao et al. (2021) suggested that the anthropogenic effect induced warming can reduce the land-sea thermal contrast. It then weakens the precipitation trends over the East Asian transitional climate zone via the weakening of Asian summer monsoon and moisture transport. However, there is still insufficient knowledge of impacts of anthropogenic forcing on regional precipitation changes in tropical developing countries such as Southeast Asia.
Southeast Asia, located in the Indo-Pacific sector, has an obvious monsoon climate with the most abundant precipitation occurred in boreal winter (e.g., Chang et al., 2005; Juneng and Tangang, 2005; Yang and Wu, 2019; Yang et al., 2020; Dong et al., 2021). Previous studies indicated that the Southeast Asian precipitation (SEAP) in boreal winter usually exerts remarkable influences on both the tropical and extratropical climate. On the one hand, precipitation is a primary water source for the socioeconomic development in most of the agriculture-based Southeast Asian countries (Kripalani and Kulkarni, 1997; 1998; Lau and Yang, 1997; Dong et al., 2021). On the other hand, the precipitation anomalies can induce large diabatic heating in the tropical regions, which further result in significant climate anomalies over the extratropical regions such as East Asia and North America via the excited atmospheric Rossby waves (e.g., Lau and Yang, 1997; Jia et al., 2015; Yang et al., 2019; Dong and Wang, 2022). Thus, investigating the variations and causes of the winter SEAP is an important issue for hydrological cycle and climate changes.
Many studies suggested that the spatial-temporal characteristics and variations of SEAP in boreal winter could be driven by the effects of internal variability such as the El Niño–Southern Oscillation (ENSO; e.g., Hamada et al., 2002; Aldrian and Susanto, 2003; Lau and Nath, 2003; Chen et al., 2013; Jia et al., 2016), the East Asian winter monsoon (EAWM; e.g., Wang and Chen, 2010; Huang et al., 2012; Jia and Ge, 2017), and the intra-seasonal oscillation (e.g., Hidayat and Kizu, 2010; Xavier et al., 2014; Dong et al., 2022). For instance, the negative phase of ENSO (i.e., La Niña) often leads to more winter SEAP via enhancing the Pacific Walker circulation and exciting convective activities over Southeast Asia and vice versa (Juneng and Tangang, 2005; Feng et al., 2010). In addition, a stronger EAWM is usually accompanied by enhanced northeasterly winds along the coast of East Asia and more cold air intrusion to the tropics, facilitating more-than-normal SEAP in boreal winter (Wang and Chen, 2010; Dong et al., 2021). Despite these extensive studies mentioned above, the role of human activity on the observed changes of the winter SEAP and the possible causes are still not fully understood.
One way to investigate the effects of anthropogenic forcing on the winter SEAP is by climate models, through which the precipitation changes simulated in a real world are compared with those in a counterfactual world (e.g., Polson et al., 2014; Mukherjee et al., 2018; Lu et al., 2020; Tabari et al., 2020; Zhao et al., 2021). For example, based on the 17 Coupled Model Intercomparison Project Phase 5 (CMIP5) climate models with 105 realizations in the Detection and Attribution Model Intercomparison Project (DAMIP) experiments, Song et al. (2014) found that the weakened trends of the East Asian summer monsoon circulation in the lower troposphere during 1958–2001 are primarily driven by anthropogenic aerosol forcing, which can reduce the land-sea thermal contrast and result in a higher sea level pressure (SLP) in northern China. Here, we use the DAMIP experiments that participate in CMIP6 (Eyring et al., 2016) to perform the detection and attribution analyses. The basic questions we address here are: 1) How does the winter SEAP change during recent decades? 2) Does anthropogenic forcing contribute to the observed changes? 3) If so, what are the possible causes for the changes? Section 2 describes the data and methodology. Section 3 illustrates the observed changes in winter SEAP and elucidates the anthropogenic effects in shaping these changes and analyzes the possible causes. Finally, the summary and discussion are provided in section 4.
The gridded monthly mean precipitation datasets are used from two sources, including the Global Precipitation Climatology Project (GPCP) combined precipitation dataset, version 2.3 (Adler et al., 2003) and the NOAA Climate Prediction Center (CPC) Merged Analysis of Precipitation (CMAP; Xie and Arkin, 1997), both of which have a horizontal resolution of 2.5° × 2.5° and cover the period from 1979 to the present. Monthly mean skin temperature and SLP data are from the fifth generation of the European Center for Medium-Range Weather Forecasts (ECMWF) reanalysis (ERA5; Hersbach et al., 2020) dataset that spans the period since 1959 and was downloaded with a horizontal resolution of 1.0°× 1.0°.
The simulation data from outputs of 12 CMIP6 climate models (Eyring et al., 2016), including a total of 58 realizations in historical all-forcing and a total of 58 realizations in historical natural forcing runs (Table 1), are used to analyze the relative contributions of natural and anthropogenic forcing on the changes of the winter SEAP. The historical simulation (named as Hist-all) is forced by both natural (solar variability and volcanic aerosols) and anthropogenic forcing (greenhouse gas and anthropogenic aerosols) (Vera and Díaz, 2015; Konapala et al., 2017; Li et al., 2017). The historical natural experiments (named as Hist-Nat) are the same as the historical all-forcing simulations except that they are forced by the natural variations only. In the study, the response of anthropogenic forcing (named as Hist-Ant) is computed as the difference between the all-forcing and the natural-forcing runs (Taylor et al., 2012; Song et al., 2014; Zhao et al., 2021). To better compare the observation with simulation, both observational and model data are bilinearly interpreted into the horizontal resolution of 2.5° × 2.5°. The simulated results are presented based on the multi-model ensemble mean (MME), which is calculated by averaging a variable over all 58 realizations with equal weighting.
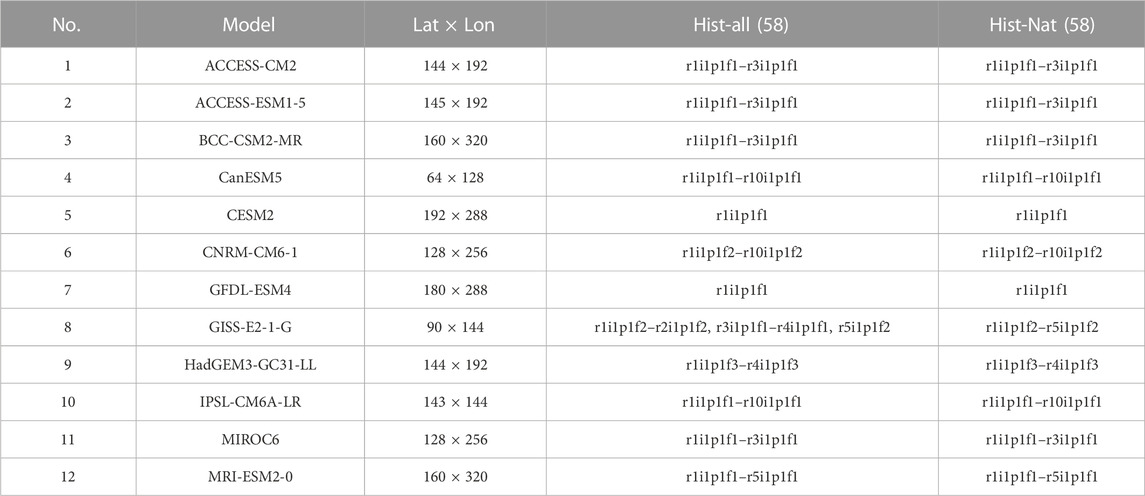
TABLE 1. List of the 12 climate models that contributed historical simulations to CMIP6. These simulations include Hist-all (natural plus anthropogenic forcing) and Hist-Nat (natural forcing) runs that cover the period from 1979 to 2014. The number of ensemble members in each experiment is indicated in the bracket.
This study focuses on boreal winter (December, January, and February; DJF), in which the SEAP usually reaches a peak in a year (Dong et al., 2021). Since the CMIP6 historical simulations finish in 2014, results are displayed for winters from 1979 to 2014, where the 1979 winter denotes 1979/1980 and so on. The monthly anomaly of a variable is defined as the deviation of its monthly value from the climatological mean during 1981–2010. The linear trends of a climate variable are calculated by the least-squares regression analysis, and their confidence levels are evaluated with the two-tailed Student’s t-test.
The performance of the CMIP6 Hist-all runs in simulating the climatological mean winter precipitation over Southeast Asia during 1979–2014 is first investigated (Figure 1). In the observation, the distribution of the winter SEAP displays a south-north dipole structure, with more (less) precipitation located east of the Philippines, west of Borneo, over the Indonesia and over the Sumatra (over the Indochina Peninsula and over the northern Philippines) (Figures 1A, B). The CMAP shows a similar pattern to GPCP but with larger (smaller) amount over the eastern Indonesia (east of the Philippines). The spatial correlation between GPCP and CMAP is 0.89 (significant at the 99% confidence level). The Hist-all MME reproduces well the dominant features of the observed SEAP, while the precipitation amount over the eastern Maritime Continent in the model is larger than that in the observation (Figure 1C). The pattern correlation coefficients between the observation in GPCP and CMAP and historical MME simulation over Southeast Asia (10°S–20°N, 90°–140°E) are .85 and .86, respectively, both of which exceed the 99% confidence levels based on the two-tailed Student’s t-test. It indicates that the Hist-all MME can simulate the observed SEAP climatology reasonably.
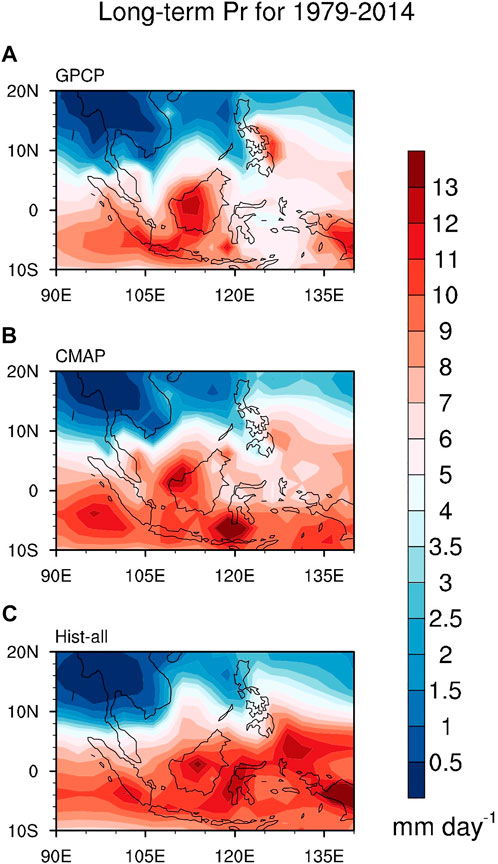
FIGURE 1. Spatial distribution of climatological mean winter precipitation (shadding, unit: mm day−1) over Southeast Asia during 1979–2014 in (A) GPCP, (B) CMAP, and (C) Hist-all MME, respectively.
The distribution of precipitation trends over Southeast Asia during 1979–2014 derived from the observation and simulations is presented in Figure 2. In the observation, significantly positive trends of winter precipitation are observed over most areas of Southeast Asia. They are primarily located around the Philippines, over the South China Sea, the eastern Indochina Peninsula, the Malay Peninsula and the northwestern Sumatra, whereas negative trends are distributed over the southern Indonesia (Figures 2A, B). The precipitation trends are consistent between GPCP and CMAP with the pattern correlation coefficient 99% significant at 0.49. However, there is a conflict of precipitation trends around the Sulawesi between these two gridded datasets. It is a negative trend in GPCP and a positive trend in CMAP. Although the Hist-all MME simulates smaller magnitude of the precipitation trends over Southeast Asia compared with the observations, the spatial pattern of the SEAP trends is well reproduced in the models (Figure 2C). The spatial correlations between the MME simulation and observations are 0.34 and 0.41 for GPCP and CMAP, respectively, both of which are 95% significant even if the effective degrees of freedom are considered (Bretherton et al., 1999). It seems that the historical all-forcing MME simulates a larger reproducibility of the SEAP characteristics in CMAP than those in GPCP. In addition, there are 29 out of 58 realizations (50%) of the Hist-all runs show the same trend pattern over Southeast Asia as those in the historical MME with the spatial correlations exceeding the 90% significance levels, indicating the reliability of precipitation trends simulated in historical all-forcing experiments.
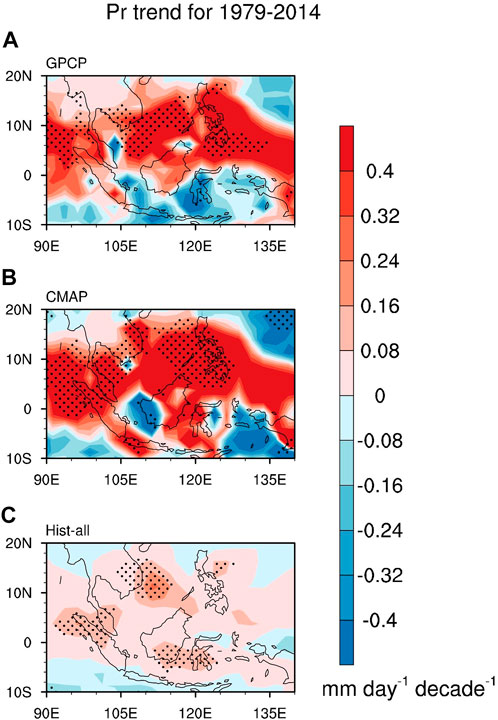
FIGURE 2. Spatial distribution of winter precipitation trends [shading, shading interval (SI) = .08 mm day−1 decade−1] from 1979 to 2014 over Southeast Asia in (A) GPCP, (B) CMAP, and (C) Hist-all MME, respectively. Values exceeding the 90% confidence levels based on the two-tailed Student’s t-test are drawn with black dots.
To identify the relative contribution of nature and anthropogenic forcing to the winter precipitation trends over Southeast Asia, the simulated trends in response to Hist-Nat and Hist-Ant forcing are respectively shown in Figure 3. No significant precipitation trends are simulated over the most areas of Southeast Asia in Hist-Nat MME except those significantly negative trends over the southern Indonesia (Figure 3A). In contrast, the Hist-Ant forced pattern, largely resembling that in response to Hist-all forcing (Figure 2C), is characterized by significant increases of precipitation trends over the South China Sea, the eastern Indochina Peninsula and the northwestern Sumatra, east of the Philippines, around the Java Sea and the Sulawesi (Figure 3B). The spatial correlation of the SEAP trends between Hist-Ant (Hist-Nat) and Hist-all MME is 95% significant (insignificant) at .80 (.26). Hence, it can be inferred that the observed and simulated precipitation trends over Southeast Asia during 1979–2014 are markedly affected by anthropogenic forcing. The same analyses were also performed in each of the 12 CMIP6 models (not shown), and the results are basically consistent with those in MME that the effects of anthropogenic forcing are more important than natural variation to drive the historical SEAP trends, indicating the model-independency of such a conclusion. Previous studies suggested that the anthropogenic forcings including the greenhouse gas and anthropogenic aerosols both contribute to the changes in regional precipitation (e.g., Hoerling et al., 2010; Polson et al., 2014; Guo et al., 2022). Thus, we further analyze the relative roles of anthropogenic greenhouse gas and aerosols on human-induced precipitation trends over Southeast Asia. Here, the historical greenhouse gas experiments (named as Hist-GHG) that forced by well-mixed greenhouse gas changes with the same ensemble members as Hist-Nat are used, and the response of aerosol forcing (named as Hist-Aer) is calculated as the difference between the anthropogenic forcing and the greenhouse gas runs (Taylor et al., 2012; Song et al., 2014). It can be found that the Hist-GHG MME explains the human-forced positive precipitation trends primarily over the southern Borneo and the Sulawesi (Figure 3C). While those in the Hist-Aer MME are mainly located over the eastern Indochina Peninsula, east of the Philippines, the South China Sea, and the northern Sumatra (Figure 3D). It indicates that both the greenhouse gas and anthropogenic aerosols contribute to some SEAP trends in Hist-Ant MME. However, the spatial correlation between the Hist-GHG (Hist-Aer) and the Hist-Ant MME is insignificant (significant) at –0.05 (0.77) over the whole of Southeast Asia. As a result, the effects of aerosols forcing are more important than greenhouse gas to contribute to the human-forced SEAP trends during 1979–2014.
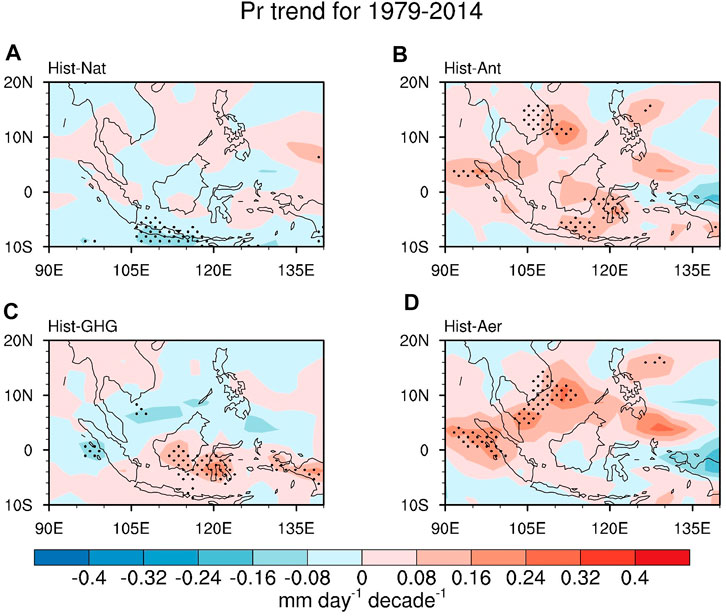
FIGURE 3. Same as Figure 2C, but for (A) Hist-Nat, (B) Hist-Ant, (C) Hist-GHG, and (D) Hist-Aer MME, respectively.
In order to obtain a clearer image of the SEAP trends, Figure 4 shows the area-mean trends over Southeast Asia (10°S–20°N, 90°–140°E) during 1979–2014 in the observations and in the simulations. As shown, GPCP displays a significant positive trend over Southeast Asia, with the magnitude at 0.16 mm day−1 decade−1. The trend in CMAP is slightly higher than that in GPCP, with the magnitude 90% significant at 0.26 mm day−1 decade−1. The results are consistent with their spatial distributions as shown in Figures 2A, B. The increasing of precipitation trends over Southeast Asia is partly reproduced by Hist-all MME, whereas its magnitude is smaller than those in the observations, approximately 0.03 mm day−1 decade−1 exceeding the 90% confidence level. It suggests that the SEAP trends simulated in Hist-all MME could explain about 18.8% and 11.5% of the observed trends in GPCP and CMAP, respectively. The Hist-Ant MME accounts for most of the positive SEAP trends (.04 mm day−1 decade−1) modelled in Hist-all MME. On the contrary, the trend in Hist-Nat MME is insignificant and negative (–.01 mm day−1 decade−1). Hence, it reveals that anthropogenic forcing plays a primary role in driving the increasing of the SEAP trend from 1979 to 2014. Further, a separation of anthropogenic forcing indicates that the anthropogenic aerosols rather than the greenhouse gas forcing explain most of the anthropogenic forced SEAP trends, indicating the importance of anthropogenic aerosols forcing. However, these results of separated anthropogenic forcing may have some uncertainties because we adopt the linear assumption to investigate the roles of different external forcings. Whether the responses of climate system in a real world to external forcing, especially the anthropogenic forcings, are strictly linear remains unknown (Song et al., 2014). Since the primary purpose of the study is to distinguish the impacts of anthropogenic forcing and natural variation on the SEAP changes instead of the different roles of anthropogenic contributions, in the following analysis, we only focus on the historical outputs including the Hist-Nat and Hist-Ant simulations. Furthermore, the above results still provide evidence that the anthropogenic forcing definitely impacts the precipitation changes over Southeast Asia.
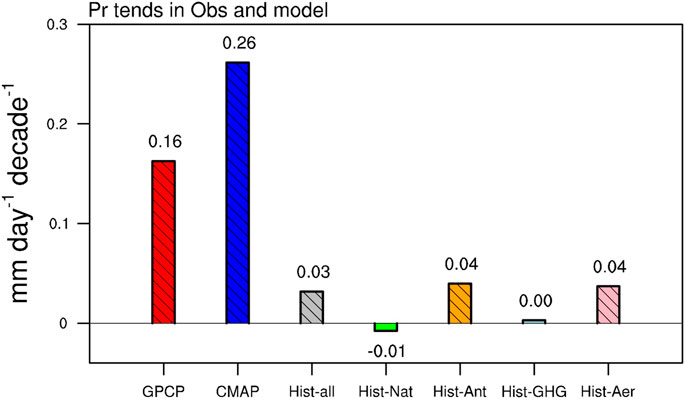
FIGURE 4. Linear trends of winter precipitation (unit: mm day−1 decade−1) averaged over Southeast Asia (10°S–20°N, 90°–140°E) from 1979 to 2014 in GPCP (red), CMAP (blue), Hist-all (gray), Hist-Nat (green), Hist-Ant (orange), Hist-GHG (light-blue), and Hist-Aer (pink) MME, respectively. The inner numbers indicate the corresponding trends. The oblique line indicates the difference between the area-mean trend and zero exceeding the 90% confidence level based on the single sample t-test.
To evaluate the reliability of the results, the probability density functions (PDF) of area-mean precipitation trends over Southeast Asia (10°S–20°N, 90°–140°E) from the realizations of historical all, natural, and anthropogenic forcings are compared (Figure 5). The observed SEAP trends in GPCP and CMAP (red and blue lines) can possibly happen in an all-forcing world (Figure 5A), and about 15 out of the 58 realizations (25.9%) from Hist-all runs show comparable trend (>.10 mm day−1 decade−1) with the observations. In addition, the observed SEAP trend for GPCP falls inside the 5%–95% confidence interval range (–.147–0.211 mm day−1 decade−1) in a real world simulation. It implies that the increased SEAP trend in the observation can be partly reproduced in Hist-all forcing. On the contrast, the PDF of Hist-Nat simulations can hardly capture the observed trends (Figure 5B), and only three out of 58 realizations (5.2%) displays comparable trend (>.10 mm day−1 decade−1) with the observations. Furthermore, the 5%–95% confidence interval level of SEAP trends in Hist-Nat ranges from –.163 to 0.085 mm day−1 decade−1, and does not contain any observations. The results imply that the positive SEAP trends in the observation is impossible to happen without anthropogenic forcing. The PDF of precipitation trends from Hist-Ant simulations as well as the 5%–95% range (–.196–.210 mm day−1 decade−1) present consistent features with those from Hist-all simulations (Figure 5C), and there are 18 out of 58 realizations (31.0%) showing comparable trend with the observations (>.10 mm day−1 decade−1). The Kolmogorov-Smirnov test shows that the PDF of the area-mean precipitation trends in Hist-all and in Hist-Ant (Hist-Nat) are from the same (different) distribution, statistically significant at the 95% confidence level. Hence, it is suggested that the effect of anthropogenic forcing on the observed SEAP trends is recognizable.
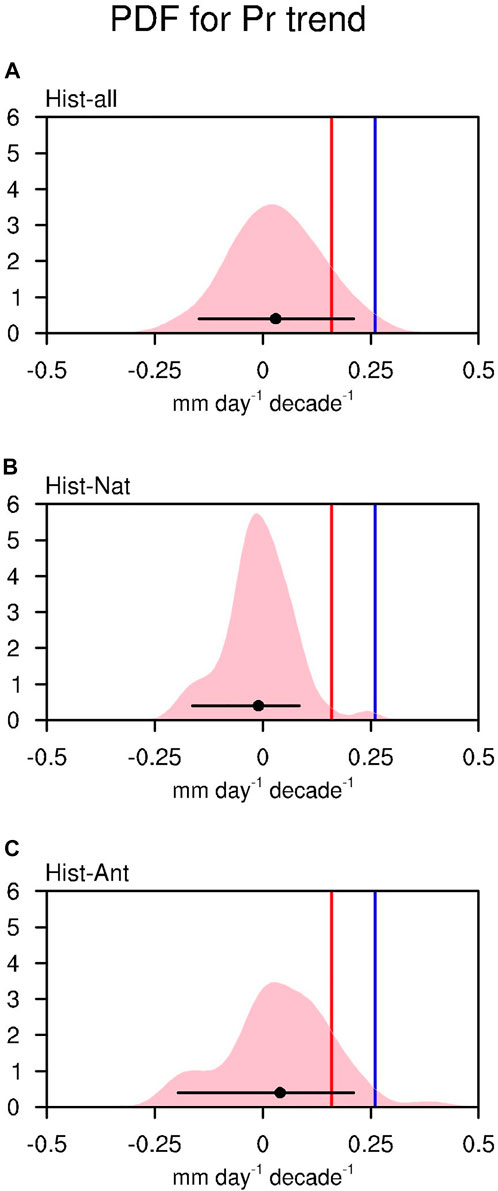
FIGURE 5. The probability density functions (PDF) of winter precipitation trends (shading, unit: mm day−1 decade−1) averaged over Southeast Asia (10°S–20°N, 90°–140°E) derived from 58 (A) Hist-all, (B) Hist-Nat, and (C) Hist-Ant runs, respectively. The red and blue lines denote the observed trends from GPCP and CMAP, respectively. The black dots indicate the ensemble mean in each experiment, and the horizontal black lines indicate a range of 5–95% from the corresponding distribution. The PDFs are estimated by the kernel-smoothing.
Figure 6 shows the 5-year running mean of the winter precipitation anomalies averaged over Southeast Asia (10°S–20°N, 90°–140°E) during 1979–2014. In the observation, the regional mean SEAP in GPCP (red line) and in CMAP (blue line) both show an increasing trend (Figure 6A), with the increasing rate 95% significant at .17 and .27 mm day−1 decade−1, respectively. The Hist-all MME (black line) simulates the similar precipitation evolution over Southeast Asia to the observations, with an increasing rate 95% significant at .03 mm day−1 decade−1. The correlation coefficients of the SEAP series between the Hist-all forcing and observations in GPCP and CMAP are .66 and .70, respectively, both of which exceeding the 99% confidence levels based on the two-tailed Student’s t-test. The precipitation evolutions simulated in Hist-Nat and Hist-Ant MME show comparable relations with that in Hist-all MME (Figure 6B), and their correlation coefficients are .46 and .49, respectively, exceeding the 95% confidence levels. However, the increased SEAP trend in Hist-Nat MME is near zero during 1979–2014, and that in Hist-Ant MME is 95% significant at .03 mm day−1 decade−1. As a result, the increasing of the winter SEAP trend during 1979–2014 is primarily dominated by anthropogenic forcing. In addition, a close inspection on these historically simulated SEAP series reveals that the Hist-all simulated SEAP evolution before the 1990s and after the 2000s can be well captured by Hist-Ant MME, and their correlation is 95% significant at .72 during the period 1979–1990 combined with 2001–2013, larger than that in Hist-Nat MME with the insignificant correlation coefficient at .22. Nevertheless, Hist-Nat MME presents better simulation of SEAP evolution in Hist-all MME during the 1990s, and their correlation coefficient is .90 for 1991–2000, above the 95% confidence level, while that for Hist-Ant is −.50 below the 90% confidence level. These results imply that the historical evolution of the winter SEAP from 1979 to 2014 simulated in Hist-all MME could be caused by both the natural forcing and anthropogenic activity. Although the effect of anthropogenic forcing may be more important, the contribution of natural forcing to the SEAP evolution should not be ignored.
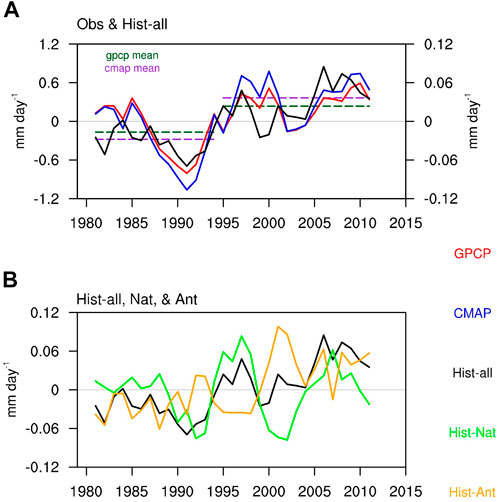
FIGURE 6. The 5-year running mean of the winter precipitation anomalies (unit: mm day−1) averaged over Southeast Asia (10°S–20°N, 90°–140°E) during 1979–2014. (A) GPCP (left y-axis), CMAP (left y-axis), and Hist-all MME (right y-axis) are indicated by the red, blue, and black lines, and (B) Hist-Nat (left y-axis) and Hist-Ant (left y-axis) MME are indicated by the green and orange lines, respectively. The dashed dark-green and purple lines in (A) denote the mean value of precipitation anomalies during 1979–1994 and 1995–2013 for GPCP and CMAP, respectively.
As shown in Figure 6A in the observation, there is a notable decadal shift of the mean SEAP that occurred after the mid-1990s, in accord with that reported in Dong et al. (2021). A moving Student’s t-test with a 9-year window applied to the observed and simulated SEAP series confirms the decadal shift, and the shift points are detected in 1995 for GPCP and CMAP (Figures 7A, B) and in 1994 for Hist-all MME (Figure 7C), respectively. To better quantify the decadal shift, the whole period 1979–2014 was divided into two sub-periods, 1979–1994 and 1995–2013, to represent negative and positive phases of the winter SEAP, respectively. In the observation, the mean SEAP during 1979–1994 in GPCP (CMAP) is –.168 (–.279) mm day−1, while that during 1995–2013 is .234 (.365) mm day−1. These in Hist-all MME during the two sub-periods are –.032 and .029 mm day−1, which can be well simulated by Hist-Ant MME (–.021 and .024 mm day−1). The differences of their mean values between these two sub-periods for observations, Hist-all, and Hist-Ant MME are 90% statistically significant based on the two-tailed Student’s t-test. In contrast, the Hist-Nat MME fails to simulate the decadal shift of the winter SEAP, and its mean values for 1979–1994 and 1995–2013 are –.011 and .005 mm day−1, respectively, with the difference of mean values below the 90% confidence level. These results indicated that the decadal shift of the winter precipitation over Southeast Asia that transforming from a negative to a positive phase after the mid-1990s causes the significantly increased precipitation trend during 1979–2014, which could be partly reproduced by anthropogenic forcing. To validate the result, the winter precipitation differences between 1995–2013 and 1979–1994 over Southeast Asia in observations and in historical simulations are further shown in Figure 8, and they present a large similarity to those in Figures 2, 3A, B. The spatial correlation between the decadal difference and the linear trend of SEAP in each pair is above .80, exceeding the 99% confidence level based on the two-tailed Student′s t-test, indicating a close relation between the SEAP trend and the precipitation decadal variation. The Hist-all MME (Figure 8C) well reproduces the decadal features of the winter SEAP in the observations (Figures 8A, B), with the spatial correlations 95% significant at .39 and .42 for GPCP and CMAP, respectively. In addition, the decadal increasing of precipitation over Southeast Asia can be mostly captured by anthropogenic forcing (Figure 8E), while natural forcing only captures the decadal increases of precipitation southeast of the Philippines and over the southern Thailand (Figure 8D). Hence, these results highlight the dominance of anthropogenic activity on the decadal changes of the winter SEAP during 1979–2014.

FIGURE 7. The moving Student’s t-test of the area-mean precipitation anomalies over Southeast Asia, as illustrated in Figure 6A, with a 9-year window in (A) GPCP, (B) CMAP, and (C) Hist-all MME, respectively. The dashed red lines indicate the 90% confidence levels based on the two-tailed Student’s t-test.
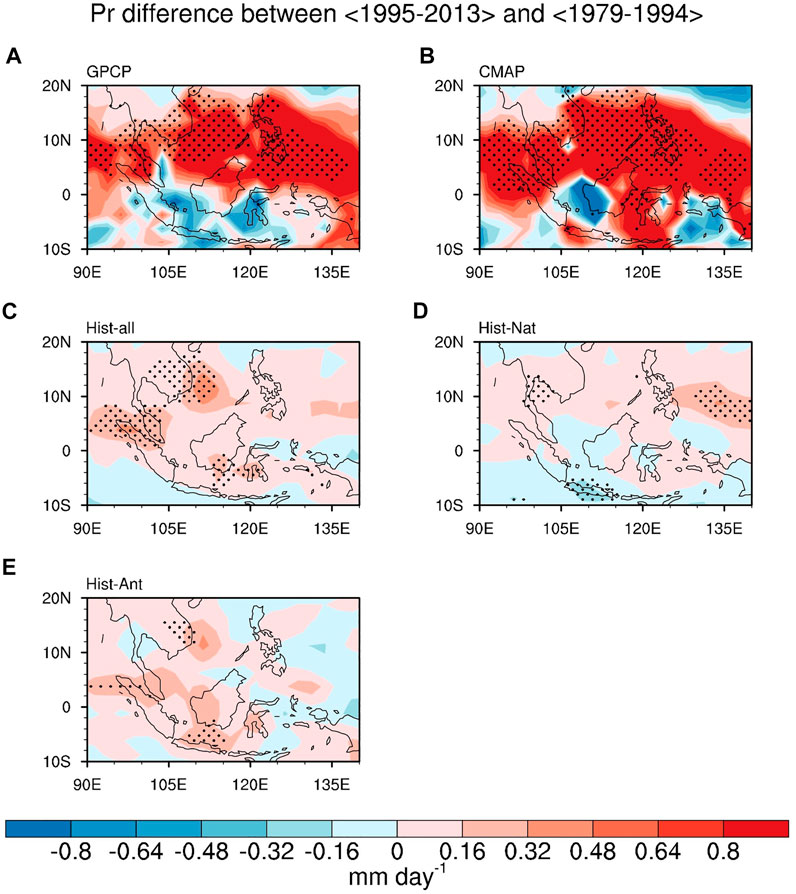
FIGURE 8. The differences of precipitation anomalies (shading, SI = 0.16 mm day−1) over Southeast Asia between 1995–2013 and 1979–1994 in (A) GPCP, (B) CMAP, (C) Hist-all, (D) Hist-Nat, and (E) Hist-Ant MME, respectively. Values exceeding the 90% confidence levels based on the two-tailed Student’s t-test are drawn with black dots.
Early studies suggested that the Pacific sea surface temperature (SST) pattern such as ENSO is the most crucial factor in modulating the winter precipitation over Southeast Asia via the Pacific Walker circulation and anomalous ascending/descending motions over the Maritime Continent (Feng et al., 2010; Dong et al., 2021). Hence, to examine the possible causes for the decadal increasing of SEAP during 1979–2014, the role of SST should be investigated. Figure 9 shows the linear trends of skin temperature over ocean from the ERA5 reanalysis data and the historical simulation with different external forcings. In the observation, a warming trend with a La Niña–like pattern has been identified in the Pacific (Figure 9A). The SST warming shows a typical pattern of a horseshoe–like structure, with faster warming in the tropical western Pacific than that in the tropical eastern Pacific, indicating the zonal SST gradient in the tropical Pacific to be stronger (An et al., 2012; Yeh et al., 2012). In the North Pacific, there are some SST signals similar to the Victoria mode, which is the second dominant mode of the North Pacific variability and is closely associated with the ENSO (Bond et al., 2003). The results are consistent with previous studies (e.g., Hua et al., 2018; Luo et al., 2018; Jiang and Zhu, 2020; Zhang et al., 2021), in which a La Niña–like warming pattern in the tropical Pacific and the strengthening trends of Victoria mode over the North Pacific (Bond et al., 2003; Ding et al., 2015) have been observed during recent decades. This non-synchronous warming trend of the Pacific SST has been well reproduced by the Hist-all MME and the Hist-Ant MME in spite of their smaller magnitudes (Figures 9B, D). The spatial correlation of the SST trends between Hist-all and observation (Hist-Ant) is .41 (.95), exceeding the 95% confidence level based on the two-tailed Student’s t-test. In contrast, these features of the SST trends hardly happen in a natural forcing world (Figure 9C). The composite difference of the SST anomalies between 1995–2013 and 1979–1994 (not shown) shows consistent results with those in linear trends. Thus, it is indicated that anthropogenic forcing can facilitate a La Niña–like SST warming pattern in the Pacific during 1979–2014. Previous studies have found that the fast warming in the tropical Indian ocean (e.g., Luo et al., 2012; Zhang et al., 2019; Zhang et al., 2021) and the Atlantic ocean (e.g., McGregor et al., 2014; Li et al., 2016), which could be driven by anthropogenic greenhouse gases forcing and aerosol forcing (Booth et al., 2012; Myhre et al., 2013; Hua et al., 2018), respectively, may contribute to the recent La Niña–like pattern in the Pacific via the strengthening of Pacific trade winds and the equatorial upwelling. In addition, the anthropogenic greenhouse forcing could also weaken the ENSO amplitude directly, which in turn causes a La Niña–like mean state in the Pacific (Kohyama et al., 2017). As a result, the view concluded in the paper that anthropogenic forcing facilitates a La Niña–like SST warming can be supported by the above studies.
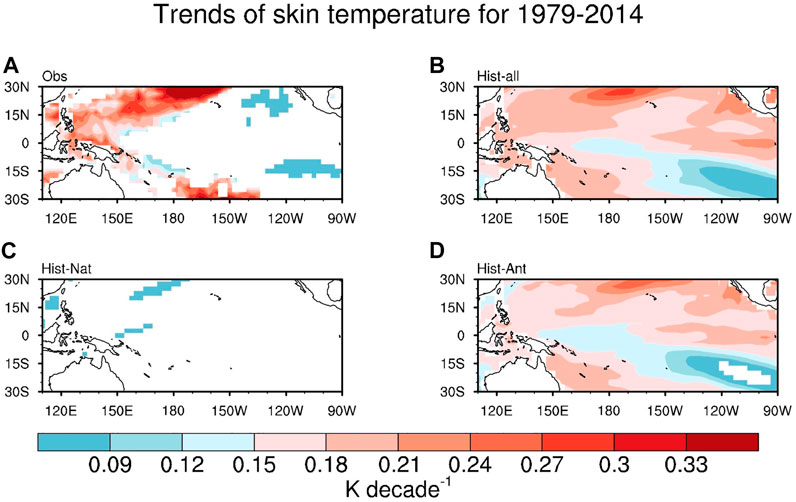
FIGURE 9. Spatial distribution of winter skin temperature trends (shading, SI = 0.03 K decade−1) from 1979 to 2014 in (A) ERA5, (B) Hist-all, (C) Hist-Nat, and (D) Hist-Ant MME, respectively. Values exceeding the 90% confidence levels based on the two-tailed Student’s t-test are drawn.
In the observation, the zonal SST gradient in the tropical Pacific associated with the La Niña–like SST warming can result in the SLP trends to present a structure of the enhanced east-west pressure gradient during 1979–2014 (Figure 10A), indicating the strengthening of the Pacific Walker circulation. The SST induced SLP trends in the observation can be partly reproduced by Hist-all MME (Figure 10B), and is dominated by anthropogenic forcing (Figure 10D). The spatial correlation of SLP trends in the tropical Pacific between Hist-all and observation (Hist-Ant) is 95% significant at .56 (.96). However, natural forcing plays an unimportant role on the changes in SLP trends (Figure 10C). Therefore, the results indicate that anthropogenic forcing can facilitate the decadal increases of the winter SEAP from 1979 to 2014 via the induced Pacific La Niña–like SST warming and the resultant strengthening of the Pacific Walker circulation.
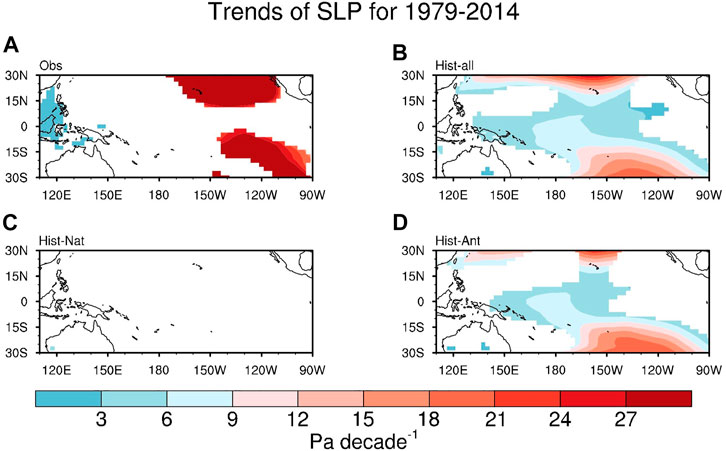
FIGURE 10. Spatial distribution of winter SLP trends (shading, SI = 3 Pa decade−1) from 1979 to 2014 in (A) ERA5, (B) Hist-all, (C) Hist-Nat, and (D) Hist-Ant MME, respectively. Values exceeding the 90% confidence levels based on the two-tailed Student’s t-test are drawn.
In the study, we investigate the effects of anthropogenic forcing on the increasing of the winter precipitation over Southeast Asia during 1979–2014 by analyzing the DAMIP experiments from the 12 CMIP6 models. Results show that the observed climatology and linear trends of SEAP can be partly reproduced under historical all-forcing experiments. A comparison of separate external forcings between Hist-Nat and Hist-Ant MME indicates that the anthropogenic forcing plays a primary role in the increased precipitation over Southeast Asia that simulated in the Hist-all forcing. In addition, anthropogenic forcing contributes to a decadal shift of the winter SEAP from a negative to a positive phase since the mid-1990s, which is strongly associated with the strengthening of SEAP trends from 1979 to 2014. Further analysis indicate that anthropogenic forcing can drive a La Niña–like pattern of SST warming trend in the Pacific, and thus leads to the decadal increase of precipitation over Southeast Asia via the enhanced zonal SST gradient and the Pacific Walker circulation.
It should be noted that the increased precipitation trends over Southeast Asia under different forcing experiments are weaker than those in the observations, as also evident in SST and SLP trends. Dong et al. (2021) indicated that the internal climate variability such as the Interdecadal Pacific Oscillation, the Arctic sea ice, and the EAWM can influence the decadal variations of the winter SEAP. In this study, we find that the increased precipitation trends over Southeast Asia are closely associated with the decadal shift of SEAP. As a result, the observed increasing trend of the winter SEAP could be driven by both the internal climate variability and external forcing. The analyses presented in the paper are based on MME, which can largely remove the internal climate variability. Hence, the discrepancy between simulations and observation indicates that the internal variability may play a dominant role in the decadal increasing of SEAP, while the anthropogenic forcing plays a secondary role. To detect the relative contribution of internal variability and external forcings in driving the SEAP changes is a crucial issue and deserves further study. Last but not least, this study only uses 12 CMIP6 models with a total of 58 realizations in each historical experiment and may not fully estimate and quantify the simulated results due to the model uncertainty. Using more climate models and more realizations may be helpful to nearer the observation. The analysis with more CMIP6 data is planned for the near future.
The original contributions presented in the study are included in the article/supplementary material, further inquiries can be directed to the corresponding author.
All authors equally collaborated in the research presented in this publication by making the following contributions: research conceptualization, ZD, RY, and LW; methodology, ZD and JC; formal analysis, ZD, RY, and LW; data curation, ZD and LW; writing original draft preparation, ZD, RY, and JC; writing review and editing, ZD and RY; supervision, RY and JC.
This work was supported by the National Natural Science Foundation of China (42205061, 42022035, and 42030603).
We would like to thank the three reviewers for their valuable comments and suggestions to improve the manuscript. We thank the NOAA Physical Sciences Laboratory for providing the GPCP and CMAP precipitation data. We also thank the ECMWF reanalysis project for providing the ERA5 data, and the WCRP for providing the CMIP6 model outputs.
The authors declare that the research was conducted in the absence of any commercial or financial relationships that could be construed as a potential conflict of interest.
All claims expressed in this article are solely those of the authors and do not necessarily represent those of their affiliated organizations, or those of the publisher, the editors and the reviewers. Any product that may be evaluated in this article, or claim that may be made by its manufacturer, is not guaranteed or endorsed by the publisher.
Adler, R. F., Huffman, G. J., Chang, A., Ferraro, R., Xie, P.-P., Janowiak, J., et al. (2003). The version-2 global precipitation climatology project (GPCP) monthly precipitation analysis (1979–present). J. Hydrometeorol. 4, 1147–1167. doi:10.1175/1525-7541(2003)004<1147:tvgpcp>2.0.co;2
Aldrian, E., and Dwi Susanto, R. (2003). Identification of three dominant rainfall regions within Indonesia and their relationship to sea surface temperature. Int. J. Climatol. 23, 1435–1452. doi:10.1002/joc.950
An, S.-I., Kim, J.-W., Im, S.-H., Kim, B.-M., and Park, J.-H. (2012). Recent and future sea surface temperature trends in tropical Pacific warm pool and cold tongue regions. Clim. Dyn. 39, 1373–1383. doi:10.1007/s00382-011-1129-7
Bond, N. A., Overland, J. E., Spillane, M., and Stabeno, P. (2003). Recent shifts in the state of the North Pacific. Geophys. Res. Lett. 30. doi:10.1029/2003GL018597
Booth, B. B. B., Dunstone, N. J., Halloran, P. R., Andrews, T., and Bellouin, N. (2012). Aerosols implicated as a prime driver of twentieth-century North Atlantic climate variability. Nature 484, 228–232. doi:10.1038/nature10946
Bretherton, C. S., Widmann, M., Dymnikov, V. P., Wallace, J. M., and Bladé, I. (1999). The effective number of spatial degrees of freedom of a time-varying field. J. Clim. 12, 1990–2009. doi:10.1175/1520-0442(1999)012<1990:TENOSD>2.0.CO;2
Chang, C.-P., Wang, Z., Mcbride, J., and Liu, C.-H. (2005). Annual cycle of SoutheastSoutheast asia—maritime continent rainfall and the asymmetric monsoon transition. J. Clim. 18, 287–301. doi:10.1175/JCLI-3257.1
Chen, W., Feng, J., and Wu, R. (2013). Roles of ENSO and PDO in the link of the East Asian winter monsoon to the following summer monsoon. J. Clim. 26, 622–635. doi:10.1175/JCLI-D-12-00021.1
Ding, R., Li, J., Tseng, Y.-H., Sun, C., and Guo, Y. (2015). The Victoria mode in the North Pacific linking extratropical sea level pressure variations to ENSO. J. Geophys. Res. Atmos. 120, 27–45. doi:10.1002/2014JD022221
Donat, M. G., Lowry, A. L., Alexander, L. V., O’Gorman, P. A., and Maher, N. (2016). More extreme precipitation in the world’s dry and wet regions. Nat. Clim. Change 6, 508–513. doi:10.1038/nclimate2941
Dong, Z., and Wang, L. (2022). Quasi-biweekly oscillation over the western north Pacific in boreal winter and its influence on the central north American air temperature. J. Clim. 35, 1901–1913. doi:10.1175/JCLI-D-21-0531.1
Dong, Z., Wang, L., Xu, P., Pimonsree, S., Limsakul, A., and Singhruck, P. (2021). Interdecadal variation of the wintertime precipitation in Southeast Asia and its possible causes. J. Clim. 34, 3503–3521. doi:10.1175/JCLI-D-20-0480.1
Dong, Z., Wang, L., Yang, R., Cao, J., and Hu, P. (2022). Impact of quasi-biweekly oscillation on Southeast Asian cold surge rainfall monitored by TRMM satellite observation. Remote Sens. 14, 5200. doi:10.3390/rs14205200
Eyring, V., Bony, S., Meehl, G. A., Senior, C. A., Stevens, B., Stouffer, R. J., et al. (2016). Overview of the coupled model Intercomparison project phase 6 (CMIP6) experimental design and organization. Geosci. Model. Dev. 9, 1937–1958. doi:10.5194/gmd-9-1937-2016
Feng, J., Wang, L., Chen, W., Fong, S. K., and Leong, K. C. (2010). Different impacts of two types of Pacific Ocean warming on Southeast Asian rainfall during boreal winter. J. Geophys. Res. Atmos. 115, D24122. doi:10.1029/2010JD014761
Guo, Y., Dong, B., and Zhu, J. (2022). Anthropogenic impacts on changes in summer extreme precipitation over China during 1961–2014: Roles of greenhouse gases and anthropogenic aerosols. Clim. Dyn. doi:10.1007/s00382-022-06453-4
Hamada, J.-I., Yamanaka, M. D., Matsumoto, J., Fukao, S., Winarso, P. A., and Sribimawati, T. (2002). Spatial and temporal variations of the rainy season over Indonesia and their link to ENSO. J. Meteorological Soc. Jpn. Ser. II 80, 285–310. doi:10.2151/jmsj.80.285
Hersbach, H., Bell, B., Berrisford, P., Hirahara, S., Horányi, A., Muñoz-Sabater, J., et al. (2020). The ERA5 global reanalysis. Q. J. R. Meteorological Soc. 146, 1999–2049. doi:10.1002/qj.3803
Hidayat, R., and Kizu, S. (2010). Influence of the Madden–Julian Oscillation on Indonesian rainfall variability in austral summer. Int. J. Climatol. 30, 1816–1825. doi:10.1002/joc.2005
Hoerling, M., Eischeid, J., and Perlwitz, J. (2010). Regional precipitation trends: Distinguishing natural variability from anthropogenic forcing. J. Clim. 23, 2131–2145. doi:10.1175/2009JCLI3420.1
Hua, W., Dai, A., and Qin, M. (2018). Contributions of internal variability and external forcing to the recent pacific decadal variations. Geophys. Res. Lett. 45, 7084–7092. doi:10.1029/2018GL079033
Huang, R., Chen, J., Wang, L., and Lin, Z. (2012). Characteristics, processes, and causes of the spatio-temporal variabilities of the East Asian monsoon system. Adv. Atmos. Sci. 29, 910–942. doi:10.1007/s00376-012-2015-x
IPCC (2021). Climate change 2021: The physical science basis. Contribution of working group I to the sixth assessment Report of the intergovernmental Panel on climate change. Cambridge, UK and New York, NY, USA: Cambridge University Press. in press.
Jia, X., and Ge, J. (2017). Interdecadal changes in the relationship between ENSO, EAWM, and the wintertime precipitation over China at the end of the twentieth century. J. Clim. 30, 1923–1937. doi:10.1175/JCLI-D-16-0422.1
Jia, X., Ge, J., and Wang, S. (2016). Diverse impacts of ENSO on wintertime rainfall over the Maritime Continent. Int. J. Climatol. 36, 3384–3397. doi:10.1002/joc.4562
Jia, X., Wang, S., Lin, H., and Bao, Q. (2015). A connection between the tropical Pacific Ocean and the winter climate in the Asian-Pacific region. J. Geophys. Res. Atmos. 120, 430–448. doi:10.1002/2014JD022324
Jiang, N., and Zhu, C. (2020). Tropical Pacific cold tongue mode triggered by enhanced warm pool convection due to global warming. Environ. Res. Lett. 15, 054015. doi:10.1088/1748-9326/ab7d5e
Juneng, L., and Tangang, F. T. (2005). Evolution of ENSO-related rainfall anomalies in Southeast Asia region and its relationship with atmosphere–ocean variations in Indo-Pacific sector. Clim. Dyn. 25, 337–350. doi:10.1007/s00382-005-0031-6
Kohyama, T., Hartmann, D. L., and Battisti, D. S. (2017). La niña–like mean-state response to global warming and potential oceanic roles. J. Clim. 30, 4207–4225. doi:10.1175/JCLI-D-16-0441.1
Konapala, G., Mishra, A., and Leung, L. R. (2017). Changes in temporal variability of precipitation over land due to anthropogenic forcings. Environ. Res. Lett. 12, 024009. doi:10.1088/1748-9326/aa568a
Kripalani, R. H., and Kulkarni, A. (1997). Rainfall variability over south‒east asia—connections with Indian monsoon and ENSO extremes: New perspectives. Int. J. Climatol. 17, 1155–1168. doi:10.1002/(sici)1097-0088(199709)17:11<1155::aid-joc188>3.0.co;2-b(199709)17:11<1155::AID-JOC188>3.0.CO;2-B
Kripalani, R. H., and Kulkarni, A. (1998). The relationship between some large-scale atmospheric parameters and rainfall over SoutheastSoutheast Asia: A comparison with features over India. Theor. Appl. Climatol. 59, 1–11. doi:10.1007/s007040050009
Lau, K. M., and Yang, S. (1997). Climatology and interannual variability of the southeast Asian summer monsoon. Adv. Atmos. Sci. 14, 141–162. doi:10.1007/s00376-997-0016-y
Lau, N.-C., and Nath, M. J. (2003). Atmosphere–Ocean variations in the indo-pacific sector during ENSO episodes. J. Clim. 16, 3–20. doi:10.1175/1520-0442(2003)016<0003:aoviti>2.0.co;2
Lewis, S. C., and Karoly, D. J. (2015). Are estimates of anthropogenic and natural influences on Australia’s extreme 2010–2012 rainfall model-dependent? Clim. Dyn. 45, 679–695. doi:10.1007/s00382-014-2283-5
Li, H., Chen, H., and Wang, H. (2017). Effects of anthropogenic activity emerging as intensified extreme precipitation over China. J. Geophys. Res. Atmos. 122, 6899–6914. doi:10.1002/2016JD026251
Li, X., Ting, M., Li, C., and Henderson, N. (2015). Mechanisms of asian summer monsoon changes in response to anthropogenic forcing in CMIP5 models. J. Clim. 28, 4107–4125. doi:10.1175/JCLI-D-14-00559.1
Li, X., Xie, S.-P., Gille, S. T., and Yoo, C. (2016). Atlantic-induced pan-tropical climate change over the past three decades. Nat. Clim. Change 6, 275–279. doi:10.1038/nclimate2840
Liu, J., Wang, B., Cane, M. A., Yim, S.-Y., and Lee, J.-Y. (2013). Divergent global precipitation changes induced by natural versus anthropogenic forcing. Nature 493, 656–659. doi:10.1038/nature11784
Lu, C., Lott, F. C., Sun, Y., Stott, P. A., and Christidis, N. (2020). Detectable anthropogenic influence on changes in summer precipitation in China. J. Clim. 33, 5357–5369. doi:10.1175/JCLI-D-19-0285.1
Luo, J.-J., Sasaki, W., and Masumoto, Y. (2012). Indian Ocean warming modulates Pacific climate change. Proc. Natl. Acad. Sci. 109, 18701–18706. doi:10.1073/pnas.1210239109
Luo, J.-J., Wang, G., and Dommenget, D. (2018). May common model biases reduce CMIP5’s ability to simulate the recent Pacific La Niña-like cooling? Clim. Dyn. 50, 1335–1351. doi:10.1007/s00382-017-3688-8
Mascioli, N. R., Fiore, A. M., Previdi, M., and Correa, G. (2016). Temperature and precipitation extremes in the United States: Quantifying the responses to anthropogenic aerosols and greenhouse gases, +. J. Clim. 29, 2689–2701. doi:10.1175/JCLI-D-15-0478.1
Mcgregor, S., Timmermann, A., Stuecker, M. F., England, M. H., Merrifield, M., Jin, F.-F., et al. (2014). Recent Walker circulation strengthening and Pacific cooling amplified by Atlantic warming. Nat. Clim. Change 4, 888–892. doi:10.1038/nclimate2330
Mukherjee, S., Aadhar, S., Stone, D., and Mishra, V. (2018). Increase in extreme precipitation events under anthropogenic warming in India. Weather Clim. Extrem. 20, 45–53. doi:10.1016/j.wace.2018.03.005
Myhre, G., Shindell, D., Bréon, F.-M., Shindell, D., Bréon, F.-M., Collins, W., et al. (2013). “Anthropogenic and natural radiative forcing,” in Climate change 2013: The physical science basis. Contribution of Working Group I to the fifth assessment report of the Intergovernmental Panel on Climate Change (Cambridge, UK, and New York: Cambridge University Press), 659–740. doi:10.1017/CBO9781107415324.018
Peña-Angulo, D., Vicente-Serrano, S. M., Domínguez-Castro, F., Murphy, C., Reig, F., Tramblay, Y., et al. (2020). Long-term precipitation in Southwestern Europe reveals no clear trend attributable to anthropogenic forcing. Environ. Res. Lett. 15, 094070. doi:10.1088/1748-9326/ab9c4f
Polson, D., Bollasina, M., Hegerl, G. C., and Wilcox, L. J. (2014). Decreased monsoon precipitation in the Northern Hemisphere due to anthropogenic aerosols. Geophys. Res. Lett. 41, 6023–6029. doi:10.1002/2014GL060811
Singh, D., Ghosh, S., Roxy, M. K., and Mcdermid, S. (2019). Indian summer monsoon: Extreme events, historical changes, and role of anthropogenic forcings. WIREs Clim. Change 10, e571. doi:10.1002/wcc.571
Song, F., Zhou, T., and Qian, Y. (2014). Responses of East Asian summer monsoon to natural and anthropogenic forcings in the 17 latest CMIP5 models. Geophys. Res. Lett. 41, 596–603. doi:10.1002/2013GL058705
Tabari, H., Madani, K., and Willems, P. (2020). The contribution of anthropogenic influence to more anomalous extreme precipitation in Europe. Environ. Res. Lett. 15, 104077. doi:10.1088/1748-9326/abb268
Taylor, K. E., Stouffer, R. J., and Meehl, G. A. (2012). An overview of CMIP5 and the experiment design. Bull. Am. Meteorological Soc. 93, 485–498. doi:10.1175/BAMS-D-11-00094.1
Vera, C. S., and Díaz, L. (2015). Anthropogenic influence on summer precipitation trends over South America in CMIP5 models. Int. J. Climatol. 35, 3172–3177. doi:10.1002/joc.4153
Wang, L., and Chen, W. (2010). How well do existing indices measure the strength of the East Asian winter monsoon? Adv. Atmos. Sci. 27, 855–870. doi:10.1007/s00376-009-9094-3
Xavier, P., Rahmat, R., Cheong, W. K., and Wallace, E. (2014). Influence of madden-julian oscillation on Southeast Asia rainfall extremes: Observations and predictability. Geophys. Res. Lett. 41, 4406–4412. doi:10.1002/2014GL060241
Xie, P., and Arkin, P. A. (1997). Global precipitation: A 17-year monthly analysis based on gauge observations, satellite estimates, and numerical model outputs. Bull. Am. Meteorological Soc. 78, 2539–2558. doi:10.1175/1520-0477(1997)078<2539:GPAYMA>2.0.CO;2
Yang, R., Gui, S., and Cao, J. (2019). Bay of bengal-east asia-pacific teleconnection in boreal summer. J. Geophys. Res. Atmos. 124, 4395–4412. doi:10.1029/2019JD030332
Yang, Y., and Wu, R. (2019). Seasonal variation of precipitation over the Indochina Peninsula and its impact on the South China Sea spring warming. Int. J. Climatol. 39, 1618–1633. doi:10.1002/joc.5904
Yang, Y., Wu, R., and Wang, C. (2020). Individual and combined impacts of tropical indo-pacific SST anomalies on interannual variation of the Indochina peninsular precipitation. J. Clim. 33, 1069–1088. doi:10.1175/JCLI-D-19-0262.1
Yeh, S.-W., Ham, Y.-G., and Lee, J.-Y. (2012). Changes in the tropical pacific SST trend from CMIP3 to CMIP5 and its implication of ENSO. J. Clim. 25, 7764–7771. doi:10.1175/JCLI-D-12-00304.1
Zhang, L., Han, W., Karnauskas, K. B., Meehl, G. A., Hu, A., Rosenbloom, N., et al. (2019). Indian ocean warming trend reduces pacific warming response to anthropogenic greenhouse gases: An interbasin thermostat mechanism. Geophys. Res. Lett. 46, 10882–10890. doi:10.1029/2019GL084088
Zhang, L., Zhao, J., Kug, J.-S., Geng, X., Xu, H., Luo, J., et al. (2021). Pacific warming pattern diversity modulated by indo-pacific sea surface temperature gradient. Geophys. Res. Lett. 48, e2021GL095516. doi:10.1029/2021GL095516
Zhang, X., Wan, H., Zwiers, F. W., Hegerl, G. C., and Min, S.-K. (2013). Attributing intensification of precipitation extremes to human influence. Geophys. Res. Lett. 40, 5252–5257. doi:10.1002/grl.51010
Zhao, D., Zhang, L., and Zhou, T. (2022). Detectable anthropogenic forcing on the long-term changes of summer precipitation over the Tibetan Plateau. Clim. Dyn. 59, 1939–1952. doi:10.1007/s00382-022-06189-1
Keywords: winter precipitation, Southeast asia, trend, historical simulation, anthropogenic forcing, CMIP6
Citation: Dong Z, Yang R, Cao J and Wang L (2023) Effect of anthropogenic forcing on increased winter precipitation in Southeast Asia from 1979 to 2014. Front. Environ. Sci. 10:1115698. doi: 10.3389/fenvs.2022.1115698
Received: 04 December 2022; Accepted: 28 December 2022;
Published: 09 January 2023.
Edited by:
Zhiyuan Hu, School of atmospheric sciences, Sun Yat-sen University, ChinaReviewed by:
Zhiqiang Gong, Beijing Climate Center (BCC), ChinaCopyright © 2023 Dong, Yang, Cao and Wang. This is an open-access article distributed under the terms of the Creative Commons Attribution License (CC BY). The use, distribution or reproduction in other forums is permitted, provided the original author(s) and the copyright owner(s) are credited and that the original publication in this journal is cited, in accordance with accepted academic practice. No use, distribution or reproduction is permitted which does not comply with these terms.
*Correspondence: Ruowen Yang, eWFuZ3J1b3dlbkB5bnUuZWR1LmNu
Disclaimer: All claims expressed in this article are solely those of the authors and do not necessarily represent those of their affiliated organizations, or those of the publisher, the editors and the reviewers. Any product that may be evaluated in this article or claim that may be made by its manufacturer is not guaranteed or endorsed by the publisher.
Research integrity at Frontiers
Learn more about the work of our research integrity team to safeguard the quality of each article we publish.